Through the first half of July, Arctic sea ice extent continued tracking close to levels in 2012, the summer that ended with the lowest September extent in the satellite record. The stormy weather pattern that characterized June has persisted into July. Nevertheless, sea ice melt began earlier than average over most of the Arctic Ocean.
Overview of conditions
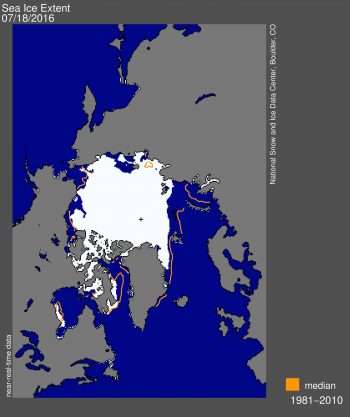
Figure 1. Arctic sea ice extent for July 18, 2016 was 7.82 million square kilometers (3.02 million square miles). The orange line shows the 1981 to 2010 median extent for that day. The black cross indicates the geographic North Pole. Sea Ice Index data. About the data
Credit: National Snow and Ice Data Center
High-resolution image
As of July 18, Arctic sea ice extent was 7.82 million square kilometers (3.02 million square miles). This is just below the two standard deviation value for the date, and just above the level observed on the same date in 2012, the year that ended up having the lowest September extent in the satellite record. Throughout the month, extent has closely tracked both the two standard deviation and 2012 levels.
Ice extent in the first half of July was well below average in the Kara and Barents seas, as it has been throughout the winter and spring. Extent is also below average in the Beaufort and Chukchi seas, between the East Siberian and Laptev seas by the New Siberian Islands, and along the southeast coast of Greenland. In the last several days, polynyas have formed in the northern Beaufort Sea. Compared to 2012 at this time of year, there is more ice in the southern Beaufort Sea, Baffin Bay, the Laptev Sea, and north of the New Siberian islands in the East Siberian Sea. There is less ice this year in the East Greenland Sea, extending through the Barents and Kara seas, and in the western Beaufort and Chukchi seas.
Conditions in context
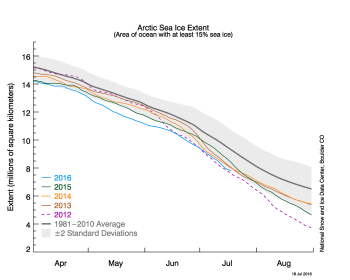
Figure 2. The graph above shows Arctic sea ice extent as of July 18, 2016, along with daily ice extent data for four previous years. 2016 is shown in blue, 2015 in green, 2014 in orange, 2013 in brown, and 2012 in purple. The 1981 to 2010 average is in dark gray. The gray area around the average line shows the two standard deviation range of the data. Sea Ice Index data.
Credit: National Snow and Ice Data Center
High-resolution image
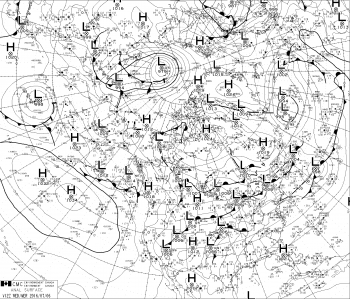
Figure 3. This surface weather map from the Canadian Meteorological Center for 0600Z, July 6, 2016, shows a strong low pressure system (extratropical cyclone) over the Eurasian side of the central Arctic Ocean. The central pressure of the cyclone dropped to as low as 979 hPa, a very strong storm for this part of the Arctic.
Credit: National Snow and Ice Data Center/Canadian Meteorological Center
High-resolution image
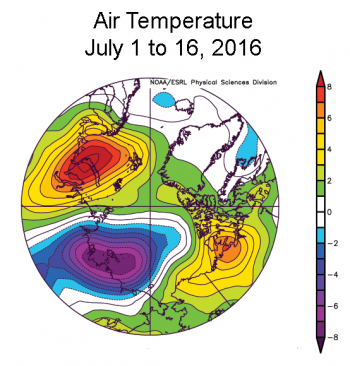
Figure 4. Arctic air temperatures at the 925 hPa level, as compared to the long-term (1981 to 2010) average. The area of below average temperatures centered over the East Siberian Sea contrasts sharply with unusually warm conditions over the Barents and Kara seas, the Canadian Arctic Archipelago and northern Alaska.
Credit: NSIDC/ NOAA ESRL Physical Sciences Division
High-resolution image
The average rate of ice loss through July 18 was 89,500 square kilometers (34,600 square miles) per day, which is close to the long-term average (1981 through 2010) rate of 86,800 square kilometers (33,500 square miles) per day. Recall from our last post that the month of June was characterized by a stormy pattern over the central Arctic Ocean, which likely acted to slow the rate of ice loss. This pattern has persisted into July. However, the rate of decline increased in the first two weeks of the month as very warm conditions spread around the Arctic coasts. Ice loss has slowed in the last few days. A number of low pressure systems, primarily generated over northern Eurasia, have migrated into the central Arctic Ocean, north of the East Siberian Sea. One of these was quite strong, with a central pressure dropping to as low as 979 hPa (Figure 3).
Cyclones found over the central Arctic Ocean in summer tend to be what is termed “cold cored.” Because of these cold-cored systems and their associated pattern of winds, air temperatures at the 925 hPa level for the first half of July have been well below average along and north of the East Siberian Sea. By sharp contrast, strongly above average temperatures have been the rule over the Barents and Kara seas, the Canadian Arctic Archipelago and northern Alaska (Figure 4). Local conditions can be quite variable, and not well captured by conditions at the 925 hPa level. On July 14, Deadhorse, on the North Slope of Alaska on the shores of the Beaufort Sea, saw a record high temperature. The reading of 85° Fahrenheit (through 7 p.m.) broke the record of 83° Fahrenheit set in 1991. It is also also the highest reading on record for any Alaska station within 50 miles of the Arctic Ocean coast north of the Brooks Range.
Early melt onset
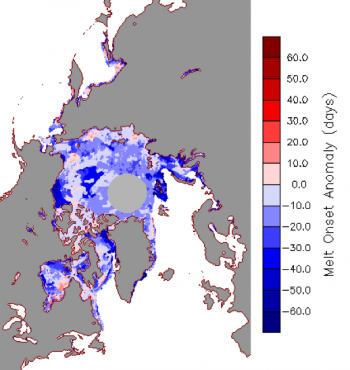
Figure 5. The onset of surface melt, as determined from satellite passive microwave data, was early over most of the Arctic Ocean. An early melt implies an early drop in the surface albedo, which furthers the melt process.
Credit: National Snow and Ice Data Center
High-resolution image
Seasonal onset of surface melt was early over most of the Arctic Ocean (Figure 5). This occurred under the high-pressure-dominated weather pattern that was present earlier in the spring. The onset of surface melt can be determined with the same passive microwave data used to determine sea ice extent and concentration. Melt began in late April/early May in the southern Beaufort Sea, which was about 6 weeks (more than 40 days) earlier than average. Melt also began a month earlier than average in the Barents Sea and northern Baffin Bay.
Early onset of melt is important because melt drops the surface albedo, allowing the sea ice and its overlying snow cover to absorb more solar radiation, which accelerates the melt process. Data from the NASA Moderate Resolution Imaging Spectroradiometer (MODIS) satellite instrument show many very large, multiyear ice floes in the Beaufort Sea, one of them about 50 miles across. It will be interesting to see if these large multiyear floes melt out this summer. NSIDC will be closely monitoring the situation.
New insights into Antarctic sea ice conditions
Gerald Meehl of the National Center for Atmospheric Research led a new study shedding light on the upward trend in total Antarctic sea ice extent over the period of satellite observations. The overall view from climate models is that Antarctic sea ice extent should have decreased in response to the general warming of climate. This has led some scientists to suggest that the climate models are fundamentally flawed. However, an explanation for the expanding Antarctic sea ice appears to lie in the Interdecadal Pacific Oscillation (IPO), a natural mode of climate variability. The IPO transitioned from a positive to a negative phase in the late 1990s at the same time that the increase in total Antarctic sea ice extent accelerated. The negative IPO brought a cooling of tropical Pacific sea surface temperatures, and deepening of the Amundsen Sea Low near Antarctica. This has contributed to regional circulation changes in the Ross Sea region favoring expansion of the sea ice cover. Meehl’s study also shows that the negative phase of the IPO in coupled global climate models is characterized by patterns similar to the sea-level pressure and 850 hPa wind changes observed in all seasons near Antarctica since 2000, particularly in the Ross Sea region. Additional model experiments show that these atmospheric circulation changes are mainly driven by precipitation and convective heating anomalies related to the IPO in the equatorial eastern Pacific. They conclude that the models are not wrong, but instead can simulate the processes involved with natural climate variability that results in increased Antarctic sea ice, even when global temperatures are rising.
Reference
Meehl, G.A., J.M. Arblaster, C. Bitz, C.T.Y. Chung, and H. Teng. 2016. Antarctic sea ice expansion between 2000-2014 driven by tropical Pacific decadal climate variability. Nature Geoscience, doi:10.1038/NGEO2751.

