Arctic sea ice extent remained about a standard deviation below average for the month of December. Compared to recent years, 2014 as a whole was rather unremarkable. The bigger story was the record high extents observed in the Antarctic through more than half of the year. At year’s end, Antarctic sea ice extent was again at a record high, but poised for a rapid decline as the austral summer wears on.
Overview of conditions
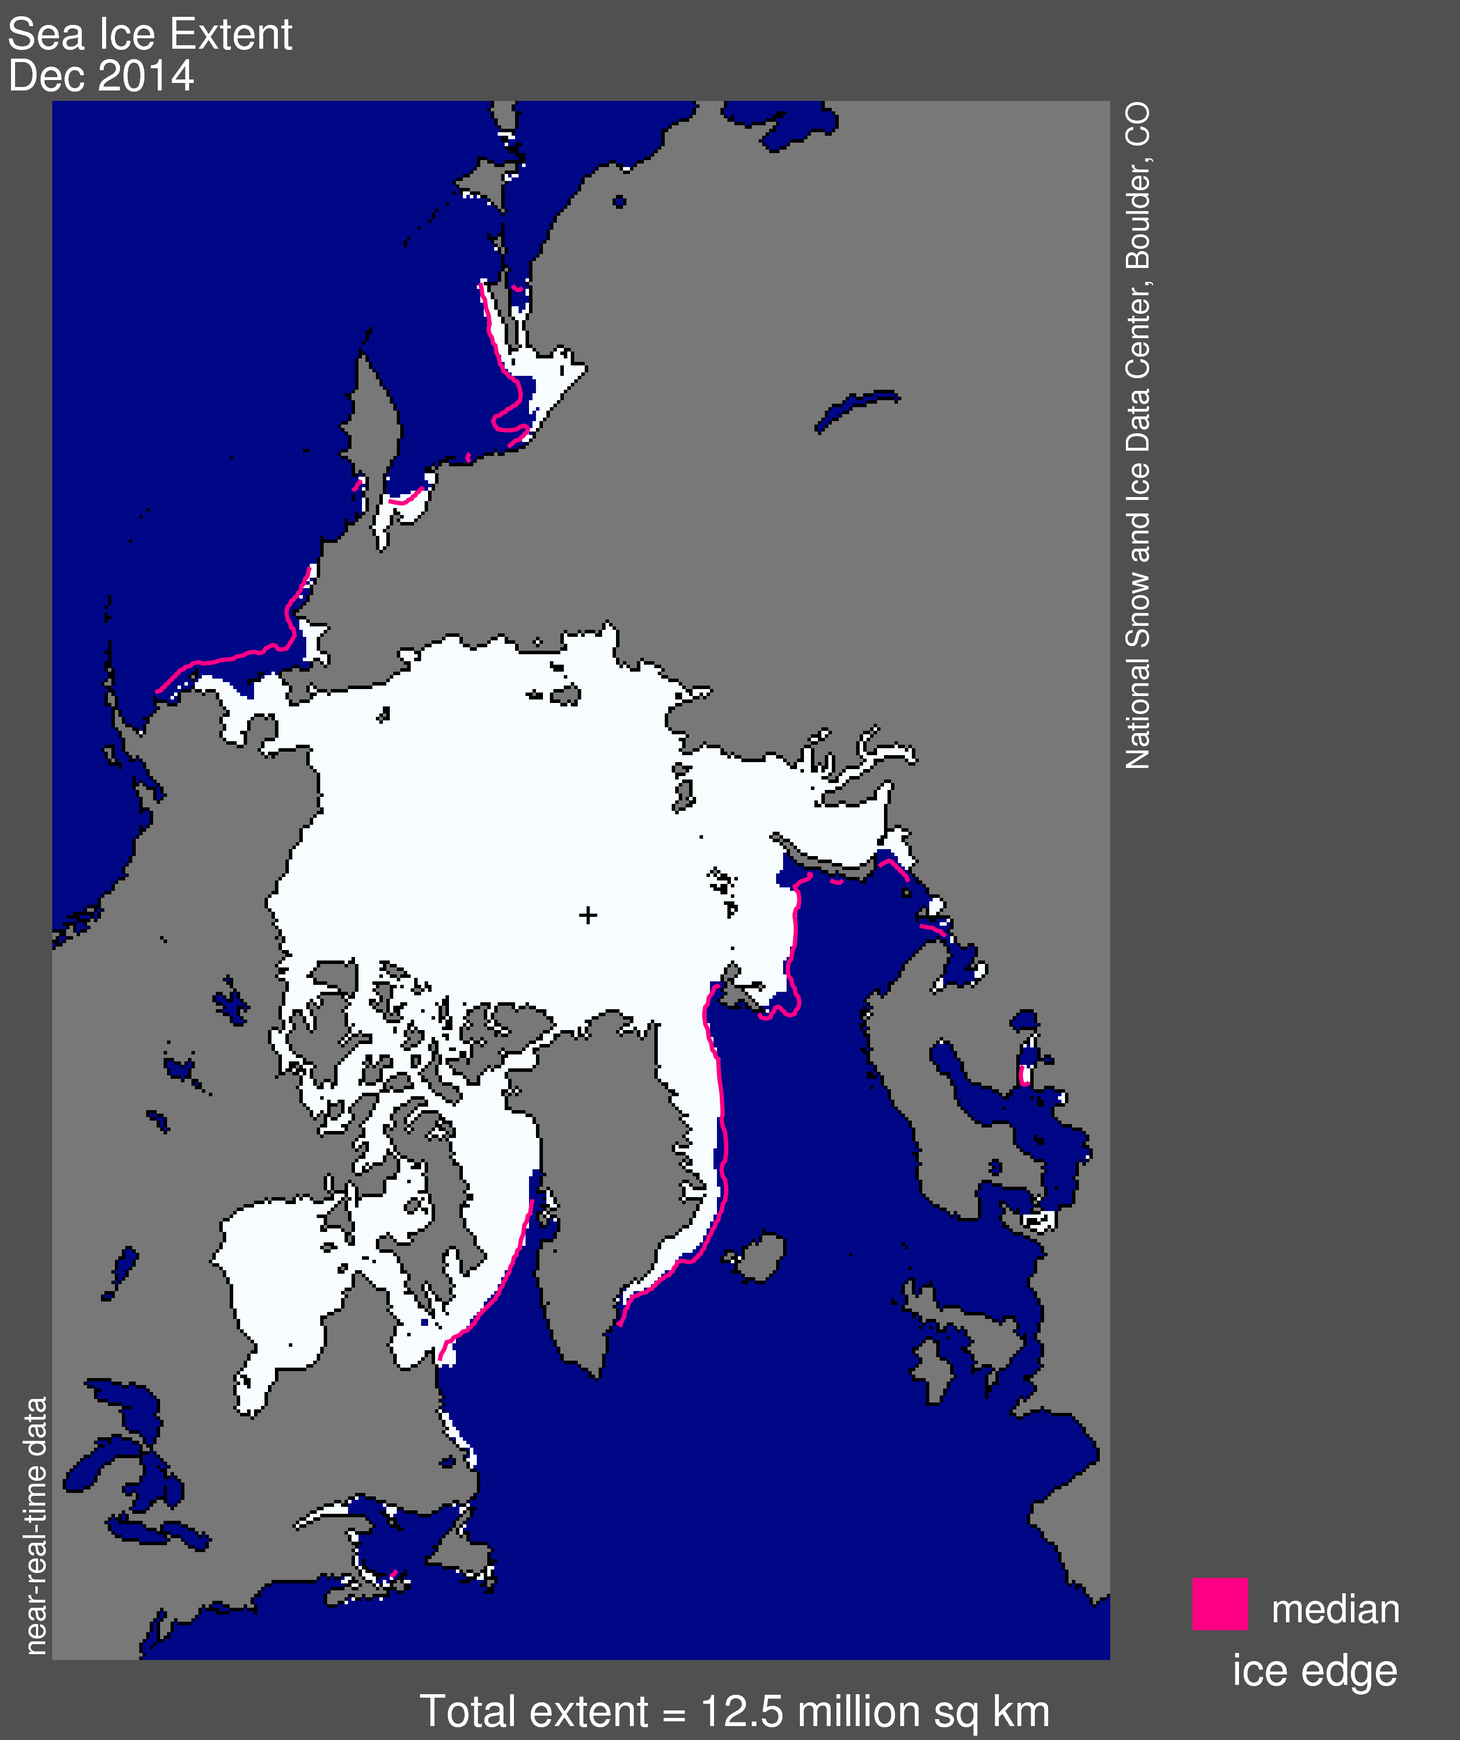
Figure 1. Arctic sea ice extent for December 2014 was 12.52 million square kilometers (4.83 million square miles). The magenta line shows the 1981 to 2010 median extent for that month. The black cross indicates the geographic North Pole. Sea Ice Index data. About the data
Credit: National Snow and Ice Data Center
High-resolution image
Sea ice extent in December averaged 12.52 million square kilometers (4.83 million square miles). This is 540,000 square kilometers (208,495 square miles) below the 1981 to 2010 long-term average of 13.06 million square kilometers (5.04 million square miles) and 500,000 square kilometers (193,051 square miles) above the record low for the month observed in 2010.
Both Hudson Bay and Baffin Bay are now essentially completely ice covered. On the Atlantic side, recent winters have been characterized by reduced winter ice extent in the Kara and Barents seas. This is not the case for the winter of 2014 to 2015.
The only two regions where extent is notably below average are in the Bering Sea and the Sea of Okhotsk. This contrasts with recent winters when ice extent has been greater than average in the Bering Sea.
Conditions in context
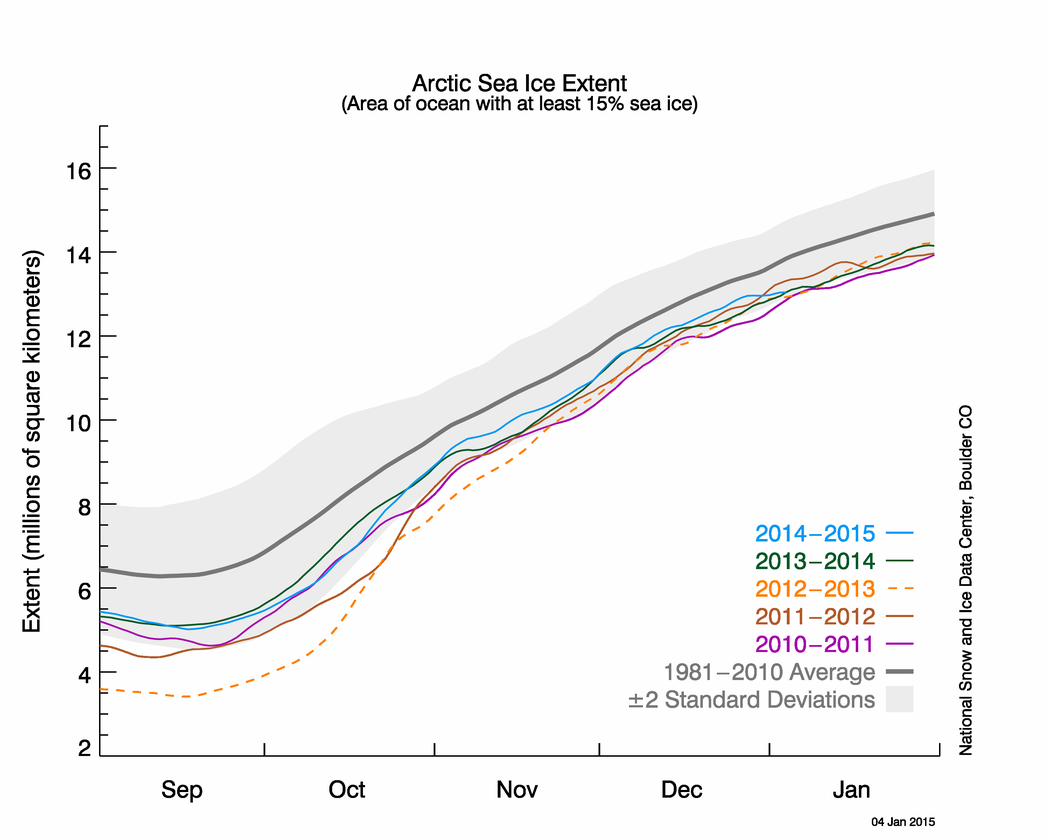
Figure 2. The graph above shows Arctic sea ice extent as of January 4, 2015, along with daily ice extent data for four previous years. 2014 to 2015 is shown in blue, 2013 to 2014 in green, 2012 to 2013 in orange, 2011 to 2012 in brown, and 2010 to 2011 in purple. The 1981 to 2010 average is in dark gray. The gray area around the average line shows the two standard deviation range of the data.Sea Ice Index data.
Credit: National Snow and Ice Data Center
High-resolution image
Sea ice extent grew 2.00 million square kilometers (772,000 square miles) during the month of December. This was about average for the month. Throughout the month, daily extents were about one standard deviation below 1981 to 2010 averages. This occurred despite the fairly warm conditions over the Eurasian side of the Arctic Ocean. As averaged over the month, air temperatures at the 925 hPa level in the Laptev and East Siberian seas were up to 5 degrees Celsius (9 degrees Fahrenheit) above average, linked to a region of unusually high pressure in the region that led to southerly winds.
December 2014 compared to previous years
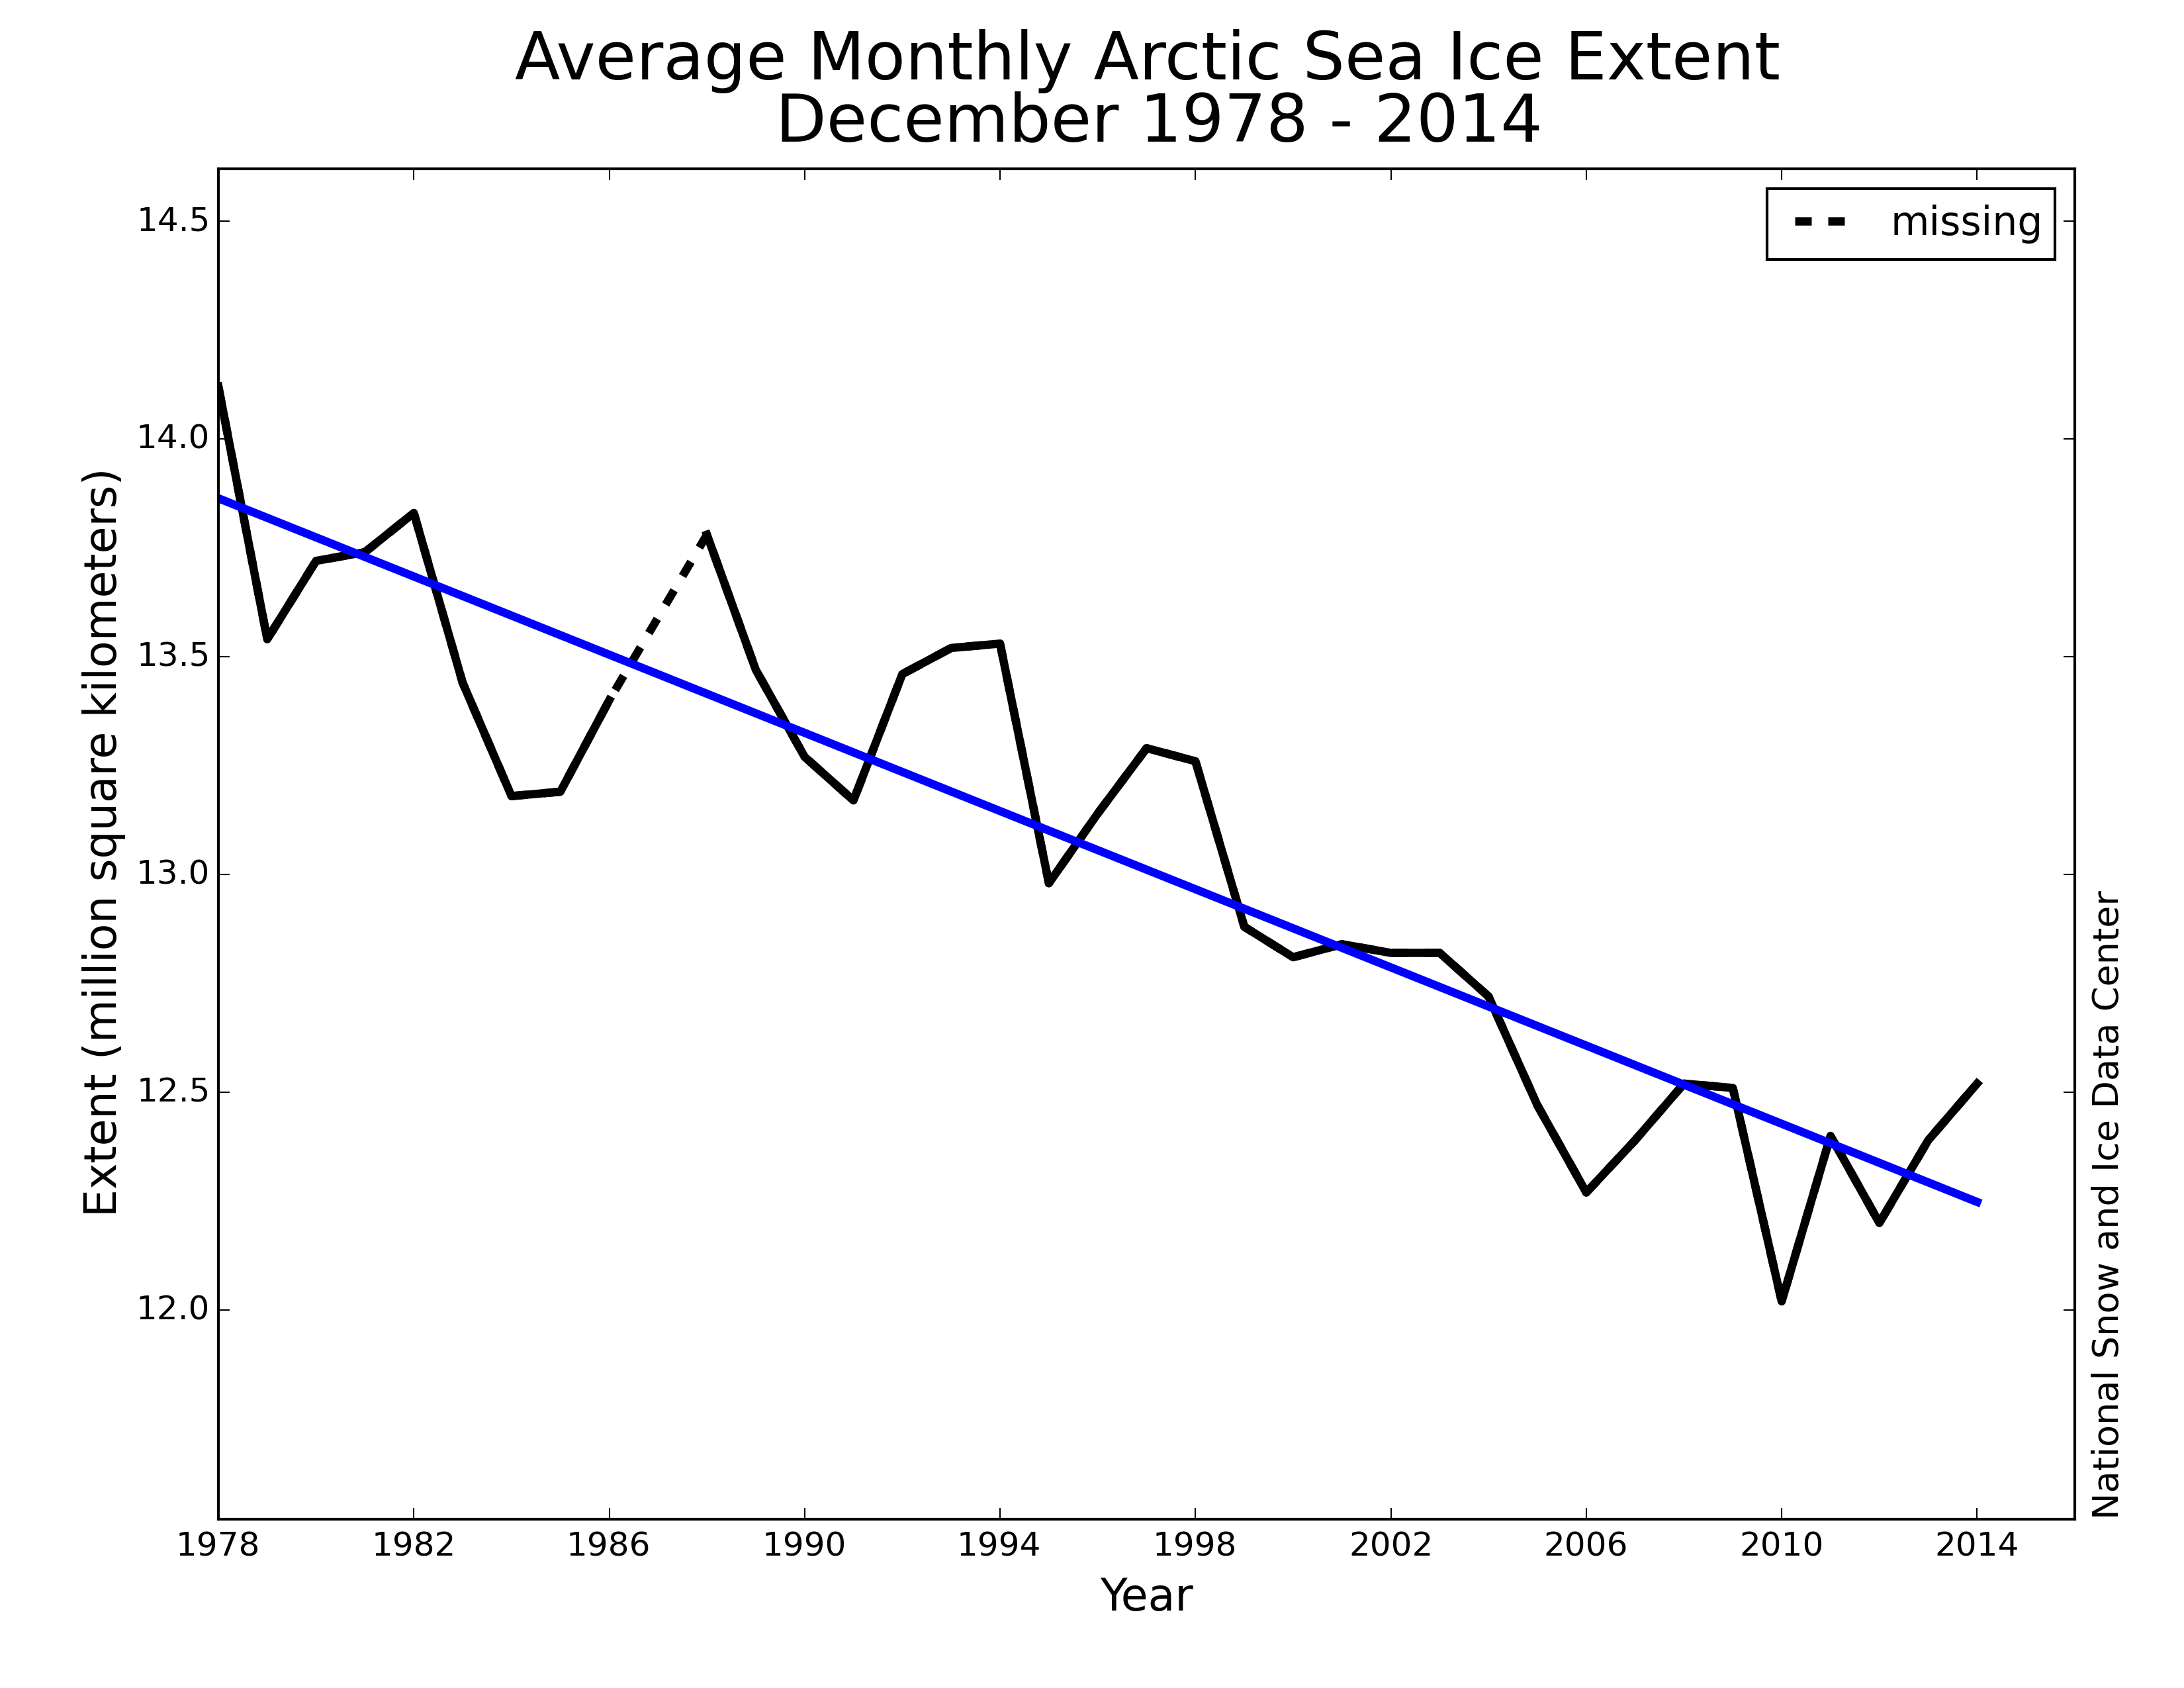
Figure 3. Monthly December ice extent for 1979 to 2014 shows a decline of 3.4% per decade relative to the 1981 to 2010 average. The dashed line indicates a period of missing data from December 2, 1987 through January 12, 1988.
Credit: National Snow and Ice Data Center
High-resolution image
Arctic sea ice extent for December was the ninth lowest in the satellite record. Through 2014, the linear rate of decline for December extent over the satellite record is 3.4% per decade.
2014 in review
Compared to recent years, sea ice conditions observed throughout 2014 were largely unremarkable. Throughout the year, extent for the Arctic as a whole remained below average, but generally within two standard deviations of the average. The maximum extent observed on March 21 of 14.91 million square kilometers (5.76 million square miles) was the fifth lowest in the satellite record, with the minimum extent observed on September 17 of 5.02 million square kilometers (1.94 million square miles) being the sixth lowest on record. One event of note was in the Laptev Sea, where during August, open water was observed to extend to about 85 degrees latitude, less than 560 kilometers (350 miles) from the North Pole.
Summer weather conditions, which are known to strongly influence September minimum ice extent, were also largely unremarkable in 2014. Compared to the long term (1981 to 2010) climatology, sea level pressure over the period June through August 2014 was higher than average over much of the central Arctic Ocean, the Atlantic sector of the Arctic, and Greenland. While air temperatures at the 925 hPa level (approximately 3,000 feet altitude) were slightly above average over part of the central Arctic Ocean, they were below average over the Kara Sea and just north of Alaska.
By sharp contrast, sea ice in Antarctica was at satellite-era record high daily levels for much of 2014. On September 22, 2014, Antarctic ice extent reached 20.11 million square kilometers (7.76 million square miles). This was the first year in the modern satellite record that Antarctic ice extent climbed above 20 million square kilometers (7.72 million square miles).
As the year drew to a close, sea ice extent again reached record high levels for the date by declining far more slowly than usual. Extent anomalies are particularly large in the Ross Sea and Amundsen Sea regions, and in the northern Weddell Sea—areas that have been anomalously high for most of the calendar year. However, sea ice concentration in both these regions is now quite low, that is, the sea ice pack is loose and open. This is characteristic of dispersal of the ice by storms, and indeed strong low pressure anomalies were present in the eastern Ross Sea and northern Weddell Sea in the second half of December. The extent of this loose sea ice pack far to the north makes it likely that a rapid decline will occur as warmer summer weather arrives.
Losing the memory of low extent

Figure 4. This graph shows future projections of September sea ice extent under various future greenhouse gas emission levels. Limiting the warming in 2100 to about 1 to 2 degrees Celsius (2 to 4 degrees Fahrenheit) under the RCP2.6 emission scenario would help to stabilize ice conditions at levels seen today. The RCP8.5 emission scenario (warming by about 4 degrees Celsius 0r 7 degrees Fahrenheit by the end of this century) would result in a seasonally ice-free Arctic by the end of this century.
Credit: Julienne Stroeve
High-resolution image
In September of 2014, the Royal Society of London held a workshop focused on the reduction in Arctic sea ice extent. One outcome of this meeting was a greater understanding of the overall trajectory of September ice extent. In a nutshell, it appears that very large departures from the overall downward trend in September extent are unlikely to persist into the following September. If a given September has very low ice extent, strong winter heat loss results in strong ice growth, so that the “memory” of the low ice September ice extent is lost. If a given September has a high ice extent, winter heat loss is more limited, meaning less ice growth. Consequently, while there can be large departures from year to year from the downward linear trend in ice extent (e.g., September 2012 compared to 2014), the natural tendency is for the large departure to dampen out, so that, overall, ice extent stays on the long-term downward trajectory that will eventually lead to seasonally ice free conditions as the Arctic continues to warm in response to rising atmospheric concentrations of Greenhouse gases.

