While the U.S. experienced extreme weather in November, conditions in the Arctic were fairly ordinary. Arctic sea ice in November followed a fairly average growth pace. Ice extent was near average over much of the Arctic with only the Chukchi Sea and Davis Strait showing below average ice conditions.
Overview of conditions
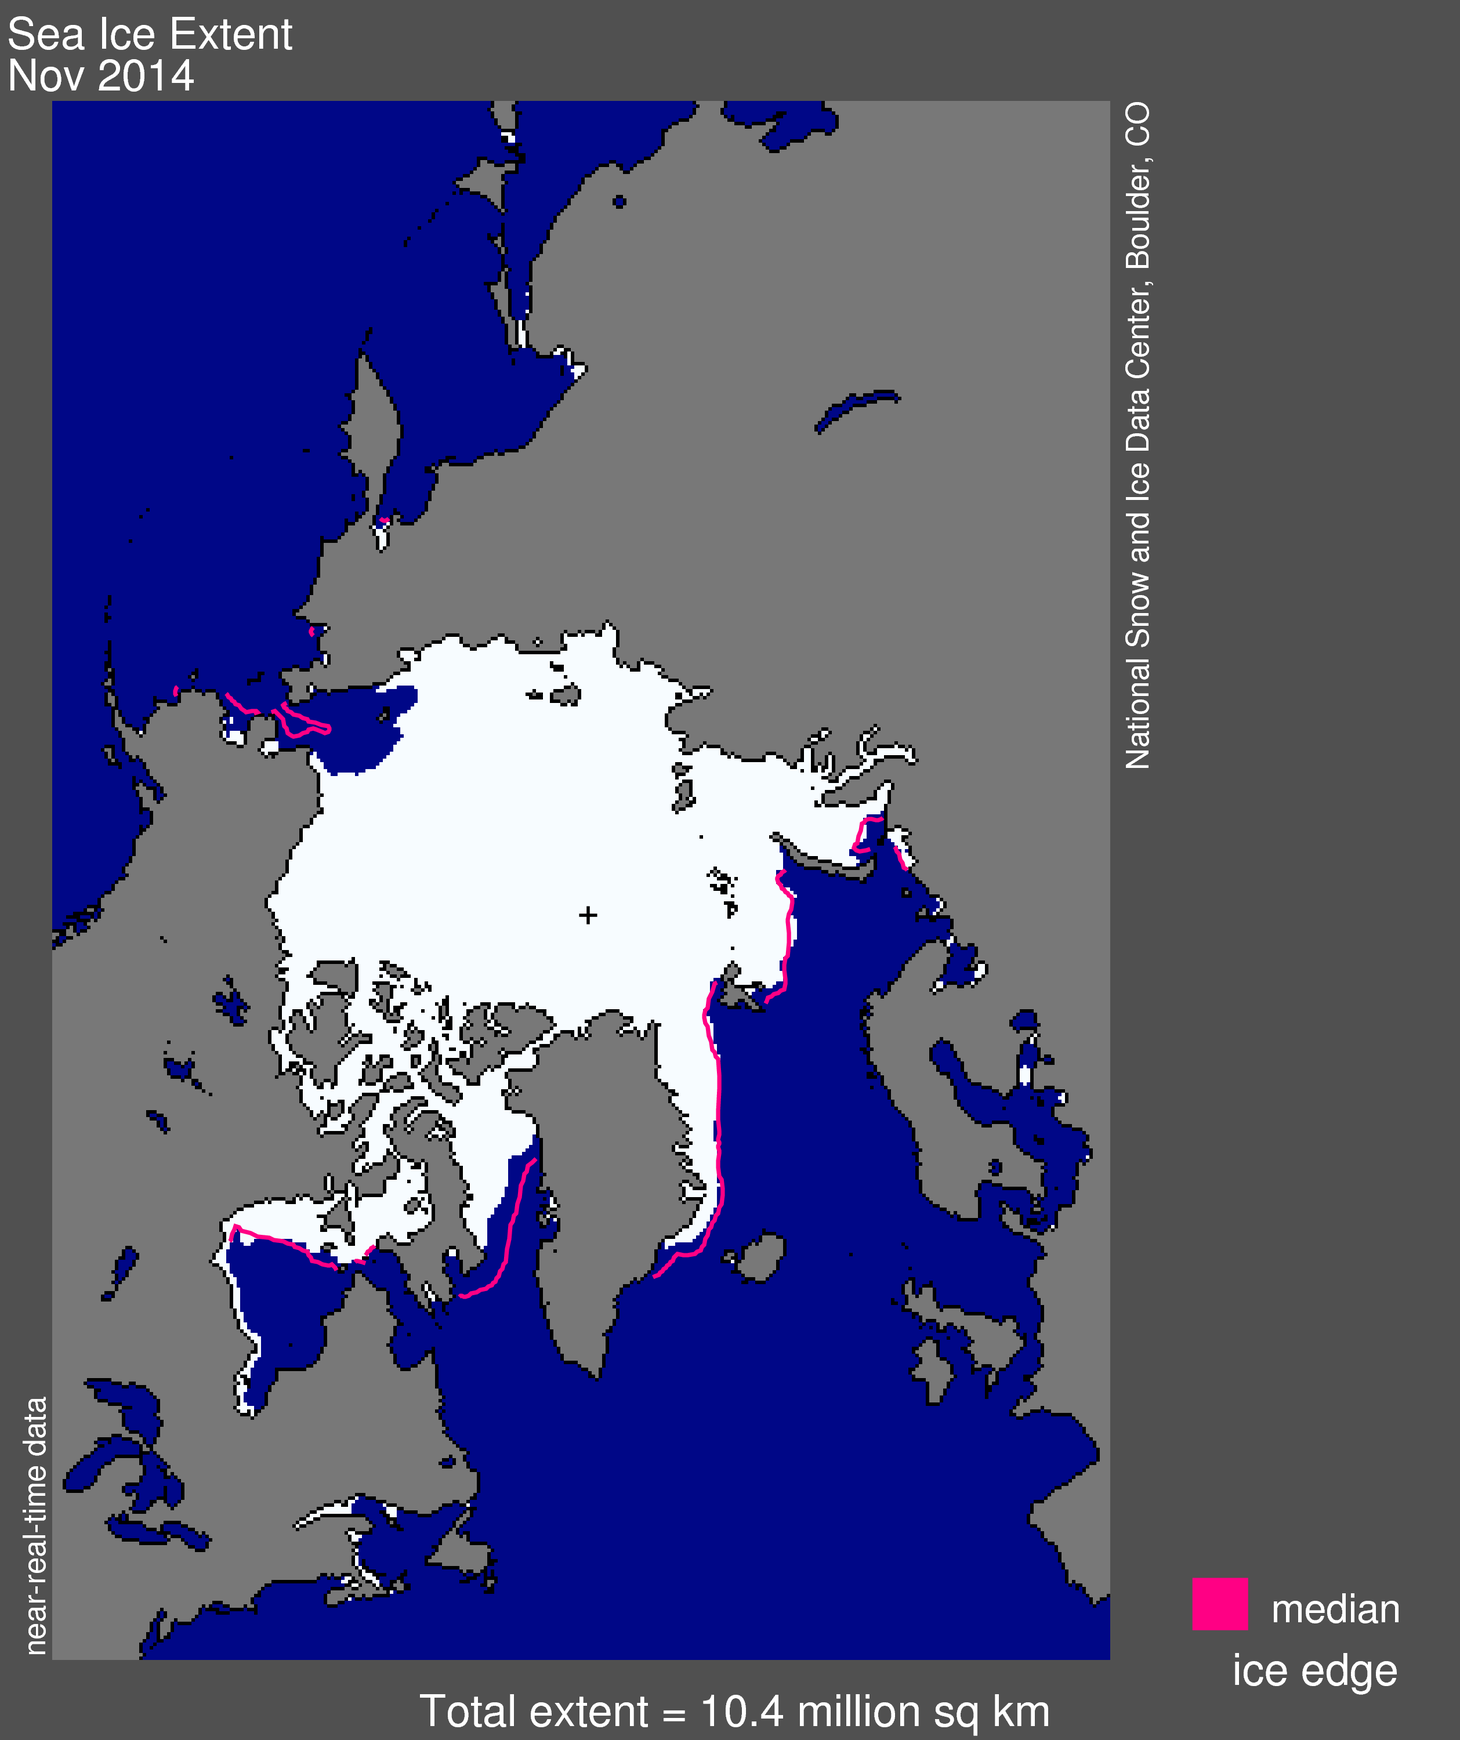
Figure 1. Arctic sea ice extent for November 2014 was 10.36 million square kilometers (4.00 million square miles). The magenta line shows the 1981 to 2010 median extent for that month. The black cross indicates the geographic North Pole. Sea Ice Index data. About the data
Credit: National Snow and Ice Data Center
High-resolution image
Sea ice extent in November averaged 10.36 million square kilometers (4.00 million square miles). This is 630,000 square kilometers (243,000 square miles) below the 1981 to 2010 long-term average of 10.99 million square kilometers (4.24 million square miles) and 520,000 square kilometers (201,000 square miles) above the record low for the month observed in 2006.
Arctic sea ice extent continued to increase throughout the month of November. By the end of the month, most of the Arctic Ocean was covered by ice, the exception being the Chukchi Sea that remained unusually ice free for this time of year. Ice also began to extend into Hudson Bay and Baffin Bay, although ice growth was slower than average in Davis Strait. The near-average ice conditions in the East Greenland, Barents and Kara seas have not been seen in the last few winters, and is the reason that overall extent for November is higher than in recent years.
Conditions in context
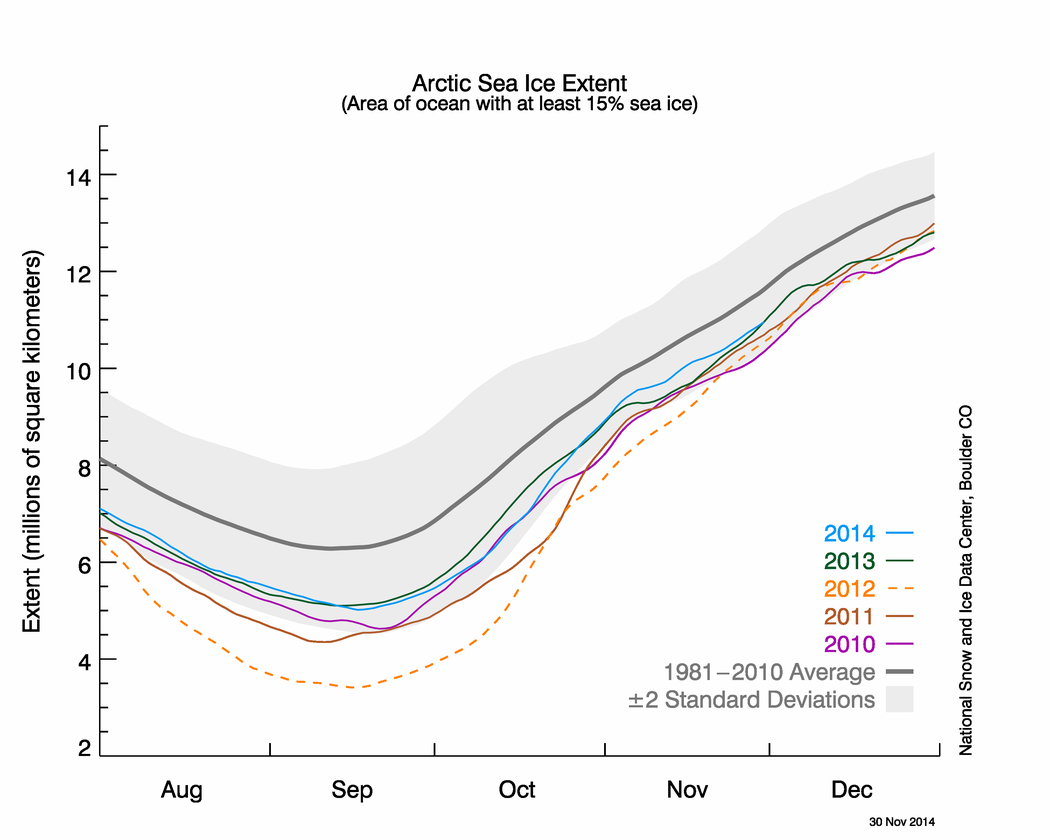
Figure 2. The graph above shows Arctic sea ice extent as of November 30, 2014, along with daily ice extent data for four previous years. 2014 is shown in blue, 2013 in green, 2012 in orange, 2011 in brown, and 2010 in purple. The 1981 to 2010 average is in dark gray. The gray area around the average line shows the two standard deviation range of the data. Sea Ice Index data.
Credit: National Snow and Ice Data Center
High-resolution image
Sea ice extent grew 2.15 million square kilometers (830,000 square miles) during the month of November. This was about average for the month and substantially slower than observed in 2012. While the month started with 1.17 million square kilometers (452,000 square miles) more ice in 2014 than on November 1, 2012, by the end of the month, the difference between 2014 and 2012 had closed to only 416,000 square kilometers (161,000 square miles). The difference in November ice growth between 2012 and 2014 reflects the larger area of open water at the end of summer 2012. With more open water, there was a larger area for new ice to grow.
November 2014 compared to previous years
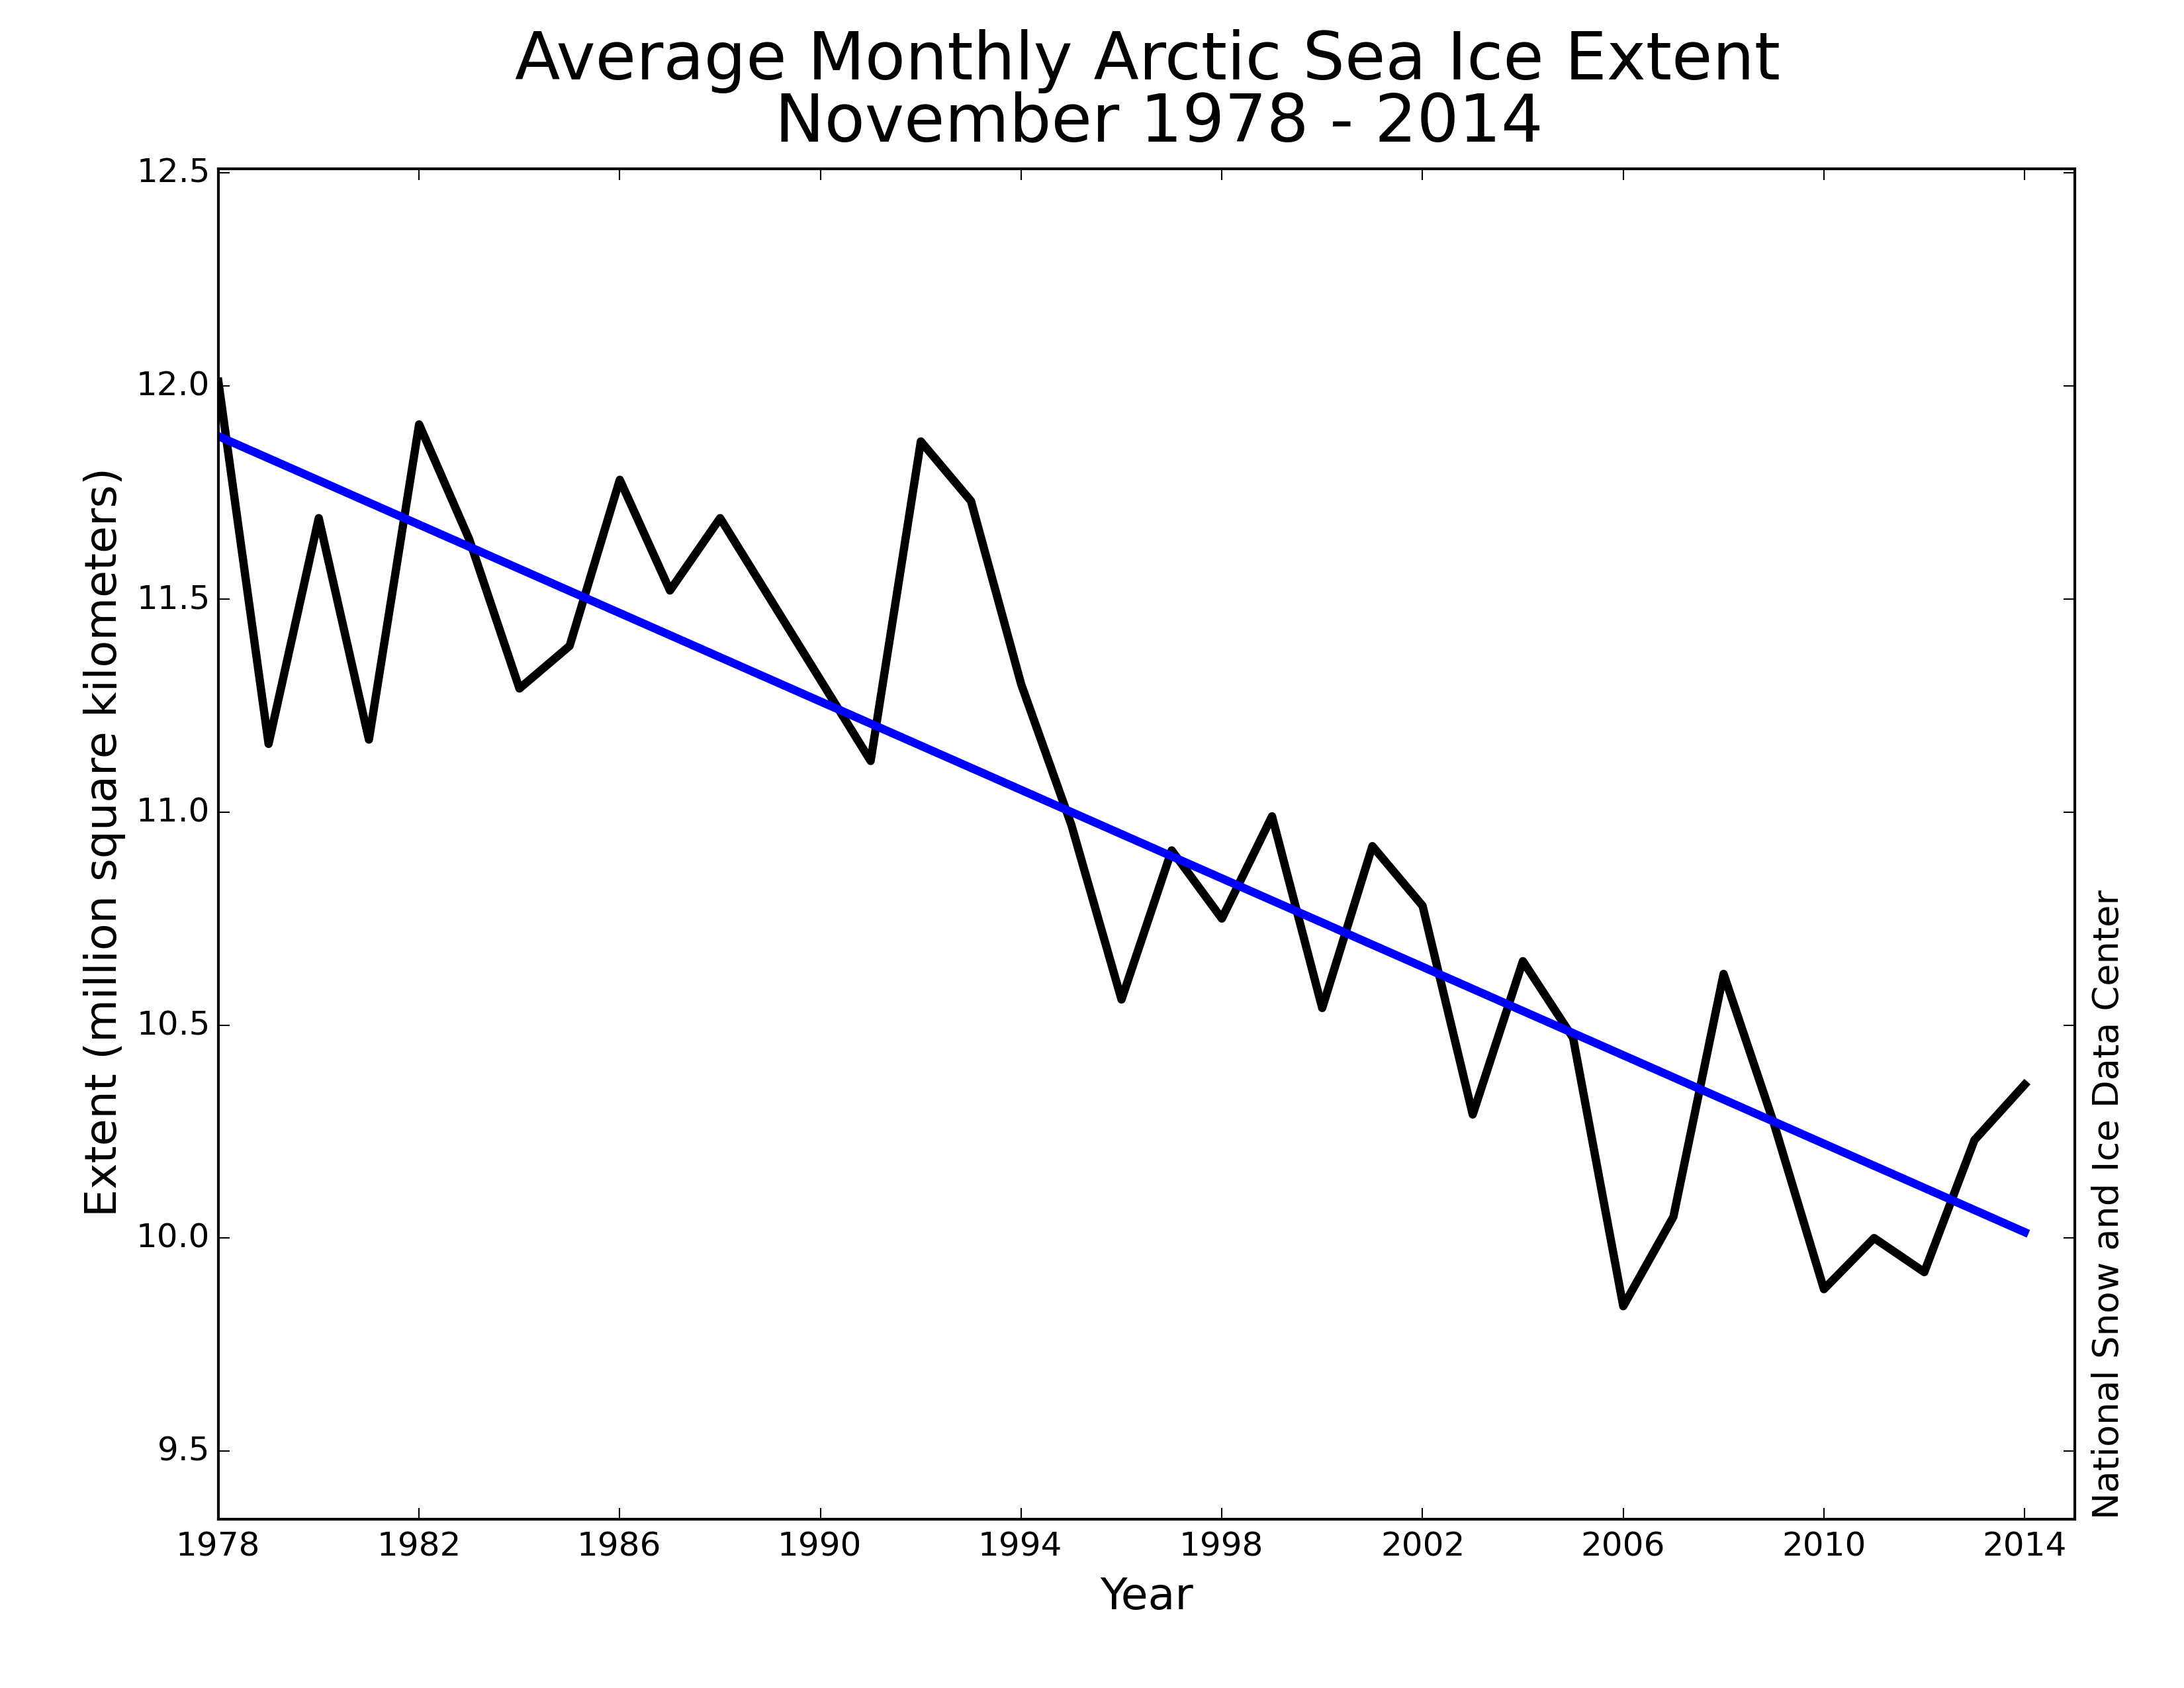
Figure 3. Monthly November ice extent for 1979 to 2014 shows a decline of 4.7% per decade relative to the 1981 to 2010 average.
Credit: National Snow and Ice Data Center
High-resolution image
Arctic sea ice extent for November was the 9th lowest in the satellite record. Through 2014, the linear rate of decline for November extent over the satellite record is 4.7% per decade.
Arctic amplification and mid-latitude weather extremes
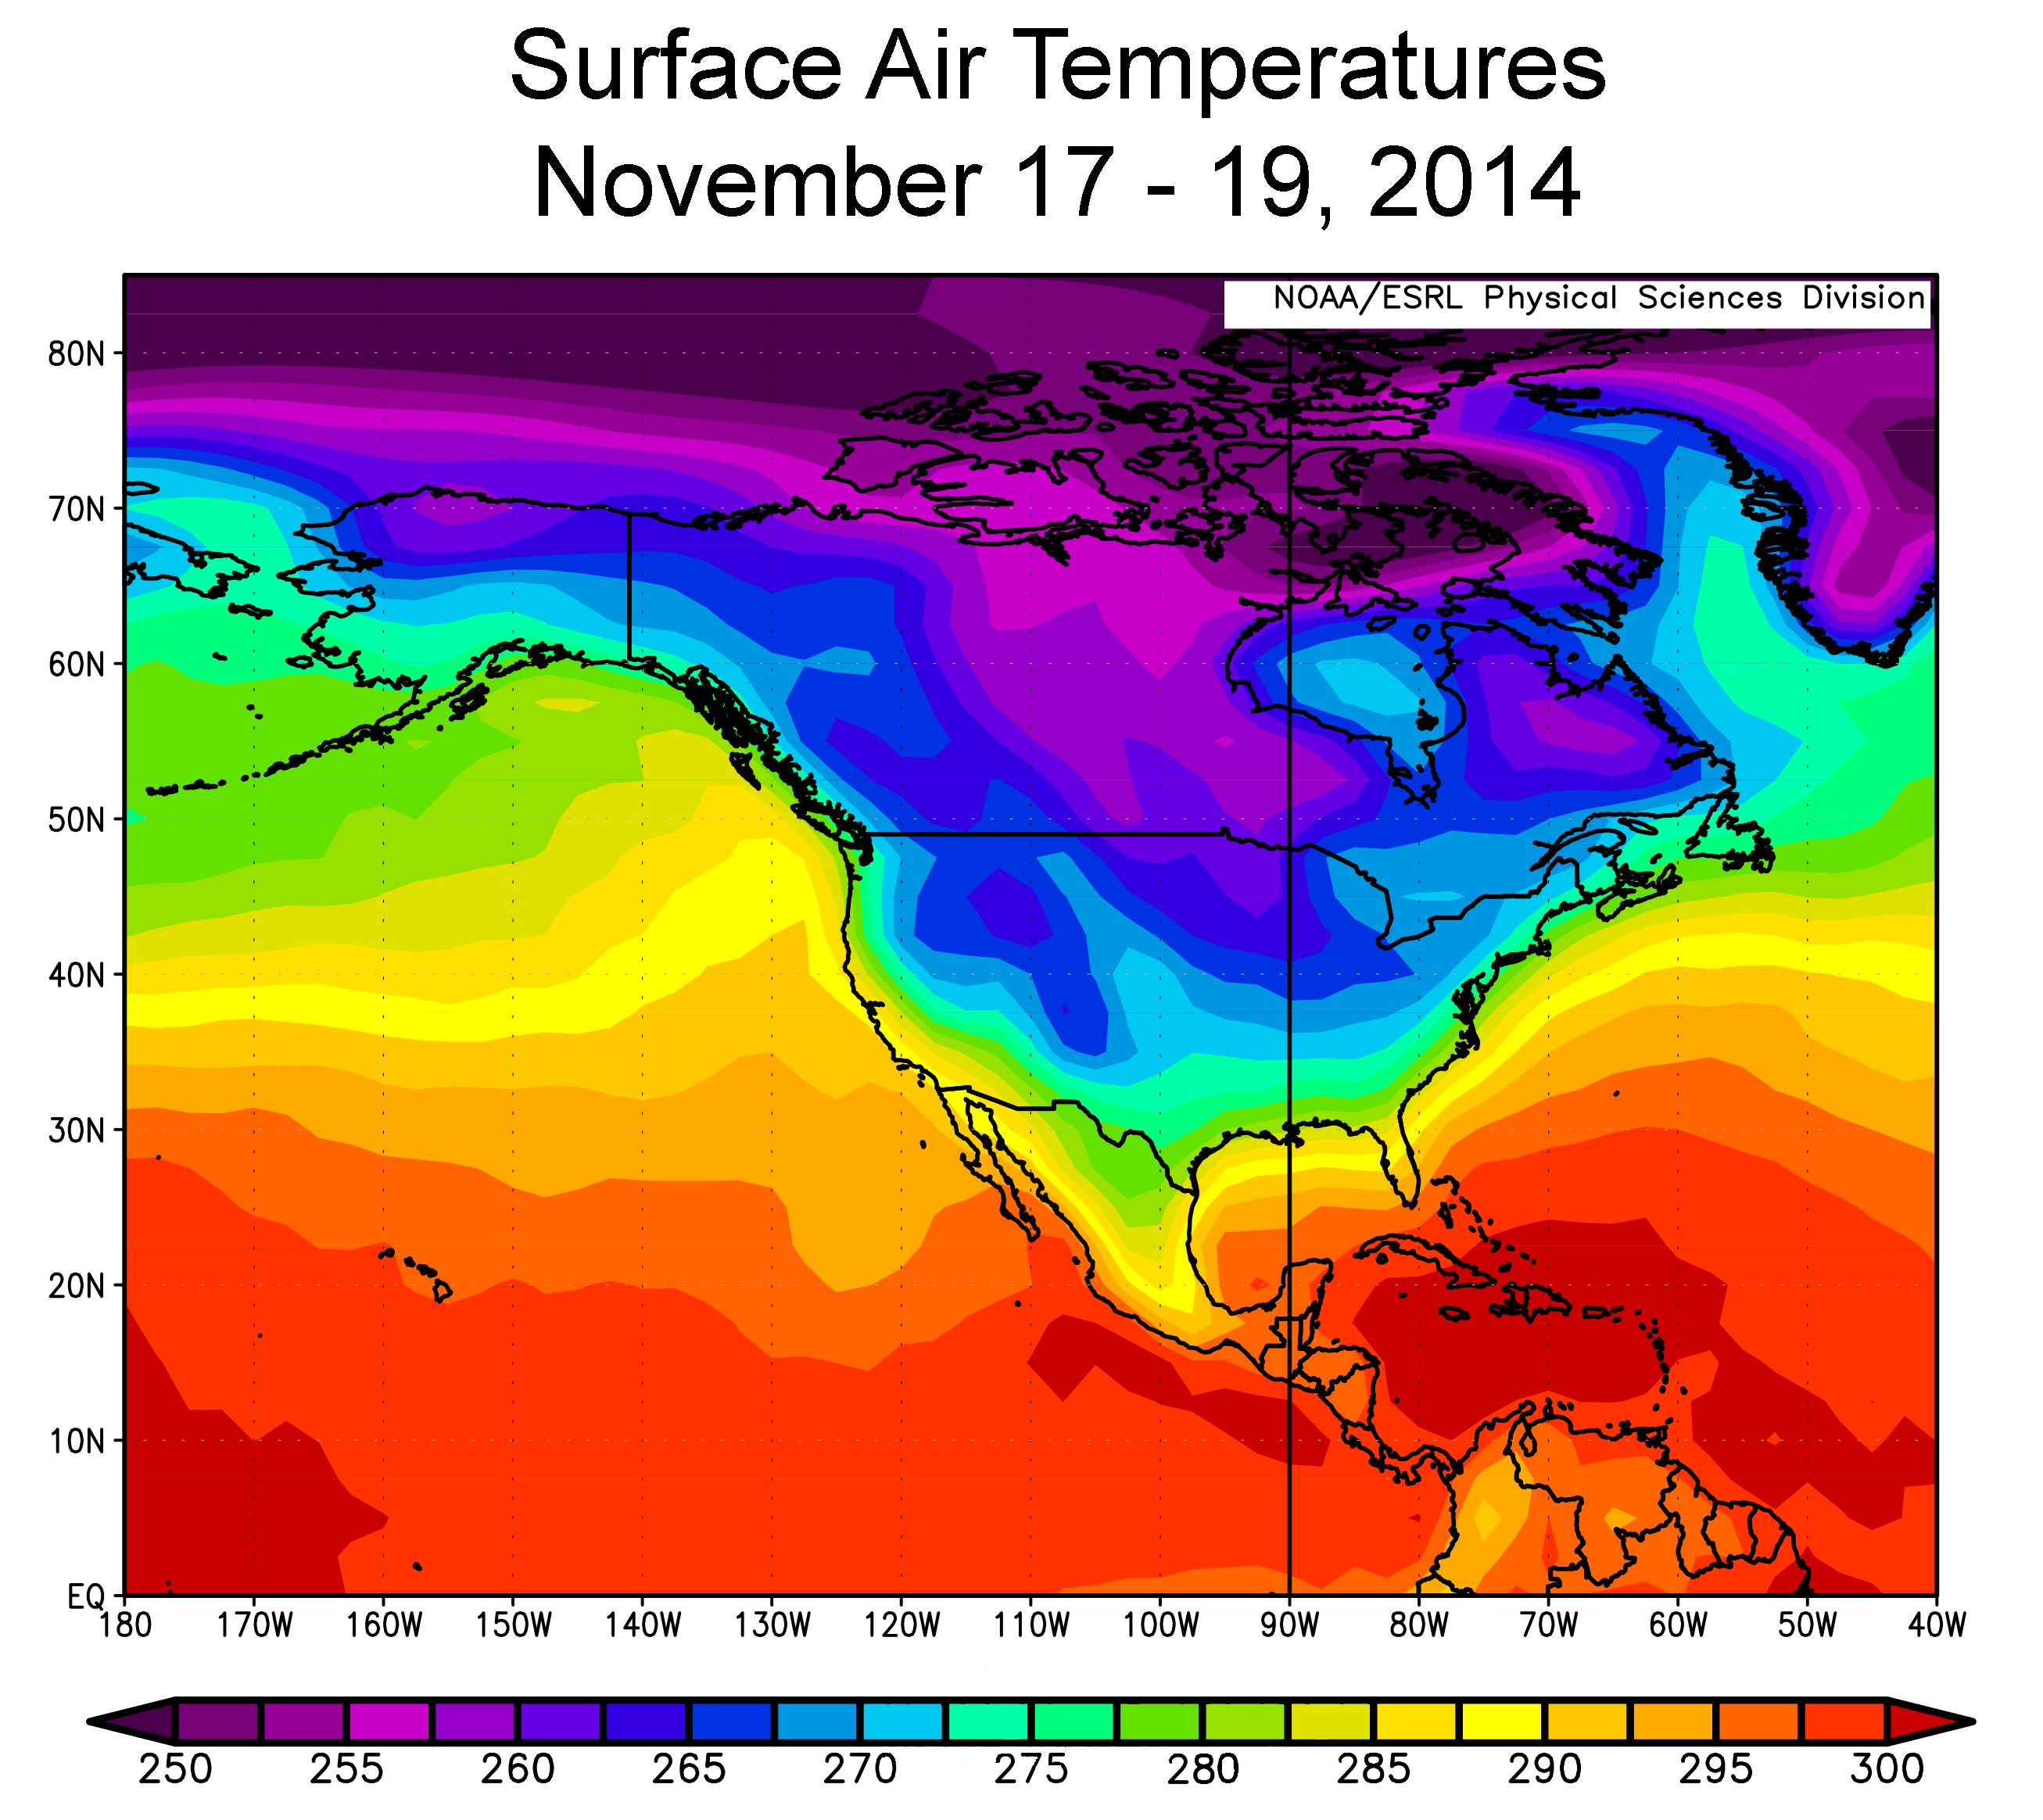
Figure 4. This plot of average surface air temperatures from November 17 to 19, 2014 over North America during a polar outbreak shows unusually cold air reaching down into the U.S. Temperatures are in degrees Kelvin. Blues and purples indicate sub-freezing temperatures.
Credit: NSIDC/NOAA ESRL Physical Sciences Divisionr
High-resolution image
Last month we discussed how the extra heat stored in ice-free areas of the ocean during recent summers is released back to the atmosphere as the ice begins to re-form, leading to amplified warming in the Arctic atmosphere. The impact of this warming and its potential impacts on mid-latitude weather patterns and extreme weather events is an active area of research.
This November has been particularly notable for severe weather in the U.S., with a very strong storm in the Bering Sea affecting the Aleutian Islands of western Alaska* (a remnant of Typhoon Nuri that tracked from the tropics through the Aleutians), record-setting low temperatures in the upper plains, and epic lake-effect snow near Buffalo, N.Y. Such individual events cannot be directly linked to climate change, let alone specifically to sea ice loss.
*Correction, December 16, 2014: Adjusted the wording here to make clear that the storm did not affect mainland Alaska, but only the Aleutians.
New research this year from Japanese scientists (Mori et al., 2014) provides support for the hypothesis, put forward by Jennifer Francis of Rutgers University and Steve Vavrus of the University of Wisconsin, that the warming Arctic is contributing to an increasing waviness of the jet stream with the potential for more extreme weather events, including cold outbreaks in the lower 48 U.S. and Eurasia that have been seen in recent years. However, while there is some evidence of this connection, it is not conclusive and many scientists remain skeptical of a link between Arctic sea ice and mid-latitude weather.
Antarctica watch
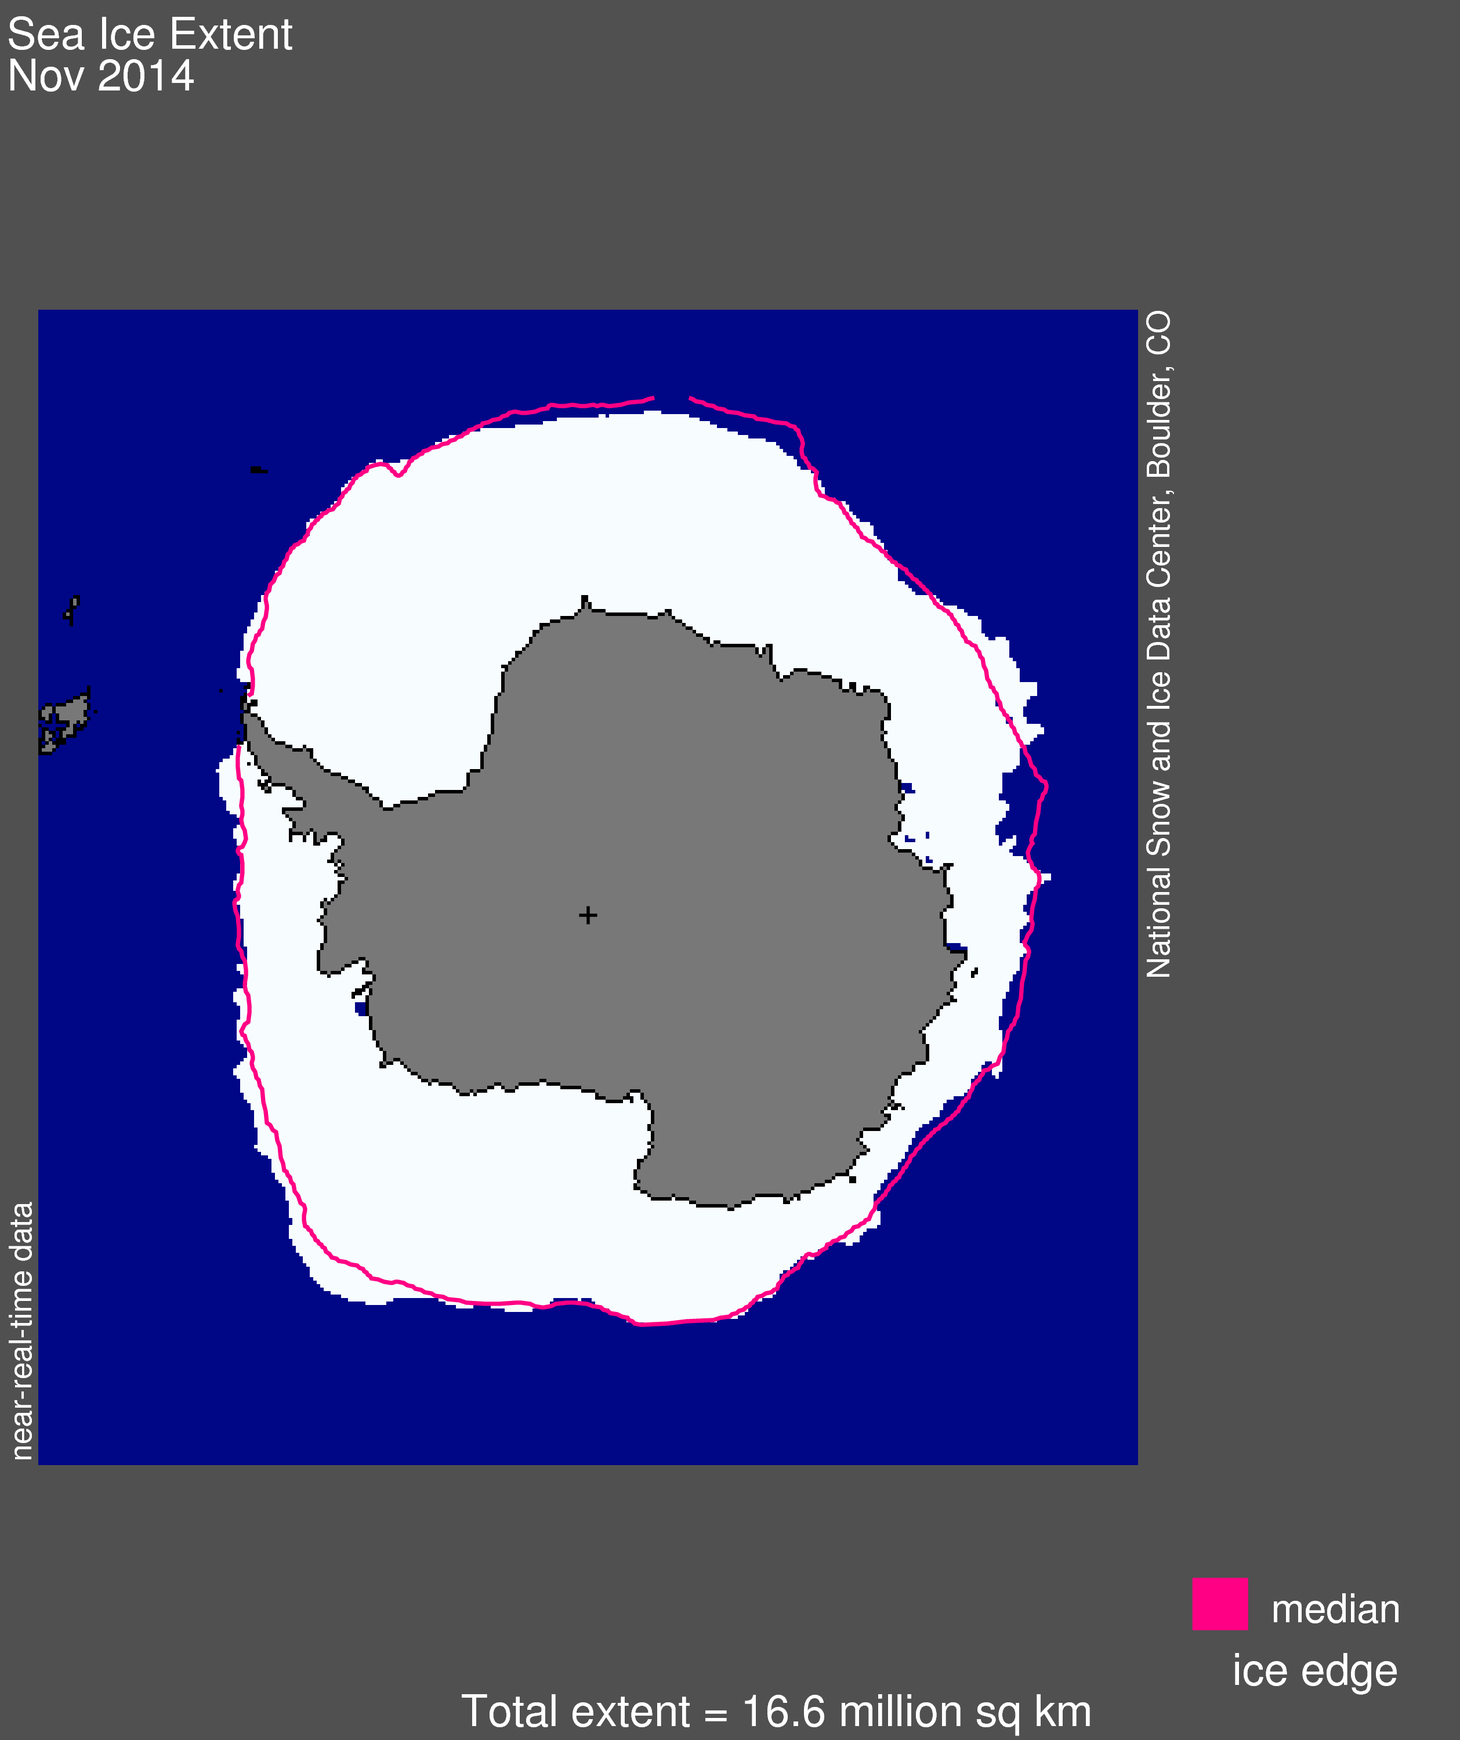
Figure 5. Antarctic sea ice extent for November 2014 was 16.63 million square kilometers (6.42 million square miles). The magenta line shows the 1981 to 2010 median extent for that month. The black cross indicates the geographic South Pole. Sea Ice Index data. About the data
Credit: National Snow and Ice Data Center
High-resolution image
Antarctic sea ice has continued to decline at a faster-than-average pace (approximately 122,000 square kilometers, or 47,100 square miles per day through the month of October, compared to the average rate of 112,000 square kilometers or 43,200 square miles per day), and is now about 650,000 square kilometers (251,000 square miles) below the level for the date recorded in 2013. Currently ice extent remains about 700,000 square kilometers (270,000 square miles) higher than the 1981 to 2010 average for this time of year. Large reductions in the Bellingshausen Sea and the southern Indian Ocean were the main causes of the Antarctic-wide decrease, driven in large part by persistent northerly winds. Air temperatures over the Southern Ocean for the month were near average in nearly all areas. On the icy continent itself, cool conditions prevailed over the Antarctic Peninsula and West Antarctica (1 to 2 degrees Celsius, or 1.8 to 3.6 degrees Fahrenheit below average) while warm conditions were the rule in the Eastern Hemisphere section (2 to 4 degrees Celsius, or 3.6 to 7.2 degrees Fahrenheit above average).
Reference
Mori, M., M. Watanabe, H. Shiogama, J. Inoue, and M. Kimoto, 2014. Robust Arctic sea-ice influence on the frequent Eurasian cold winters in past decades. Nature Geoscience, vol. 7, pp. 869-873.

