A few days after the annual Arctic sea ice minimum extent was reached on September 19, the sun set at the North Pole, aiding sea ice growth. Arctic sea ice extent has grown at a fairly slow pace, leading to the fifth lowest September in the 45-year passive microwave satellite record. Antarctic sea ice extent has had an uptick in growth, but remains at record low levels for this time of year.
Overview of conditions
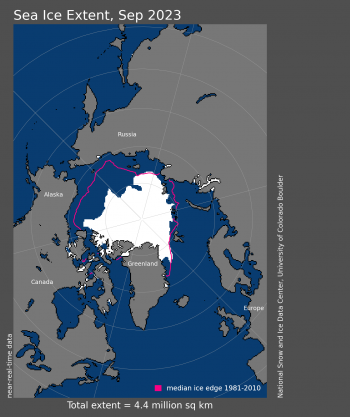
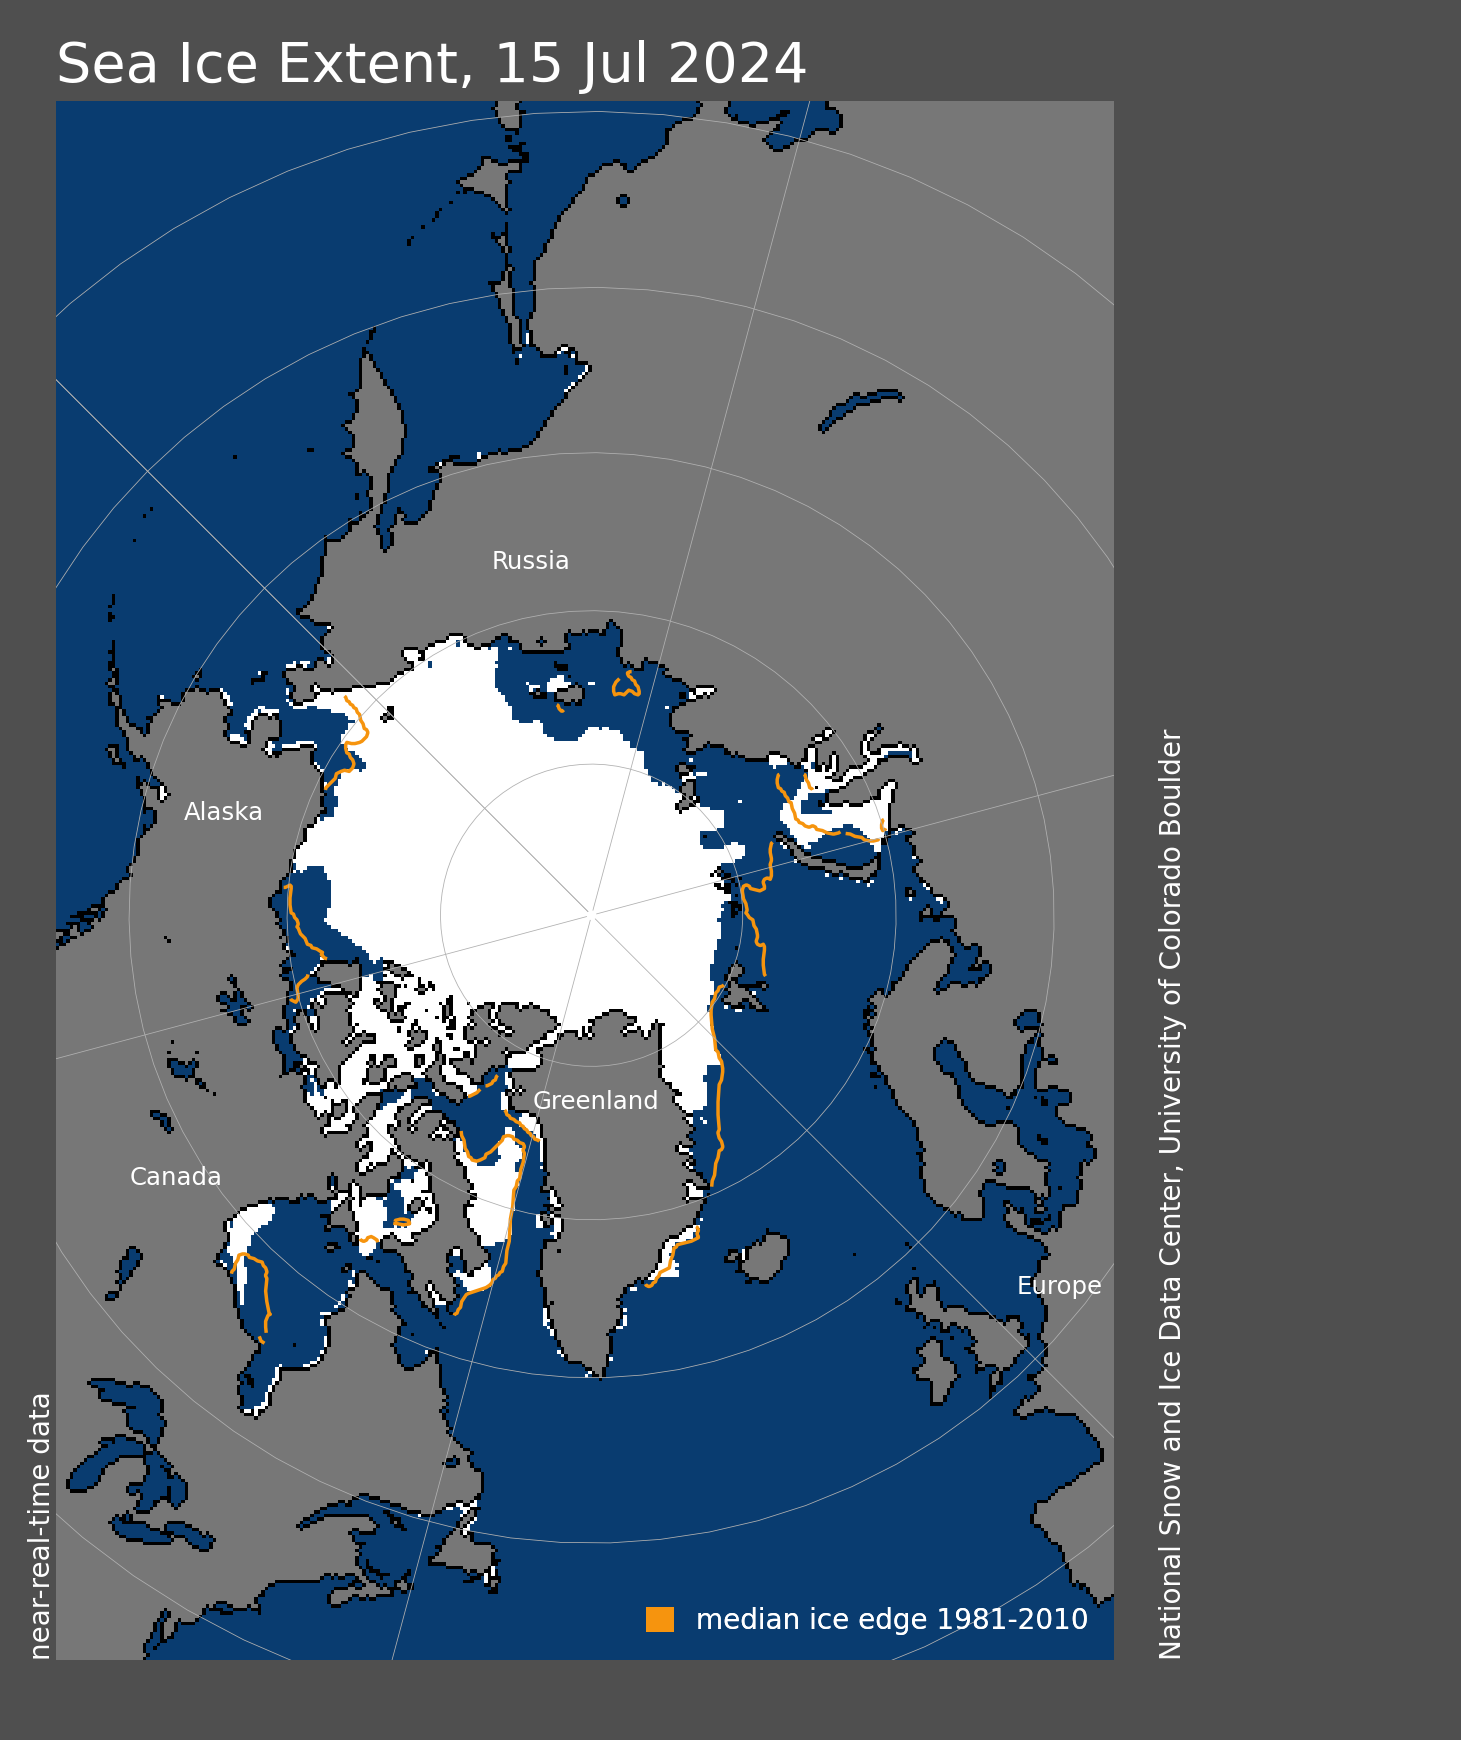
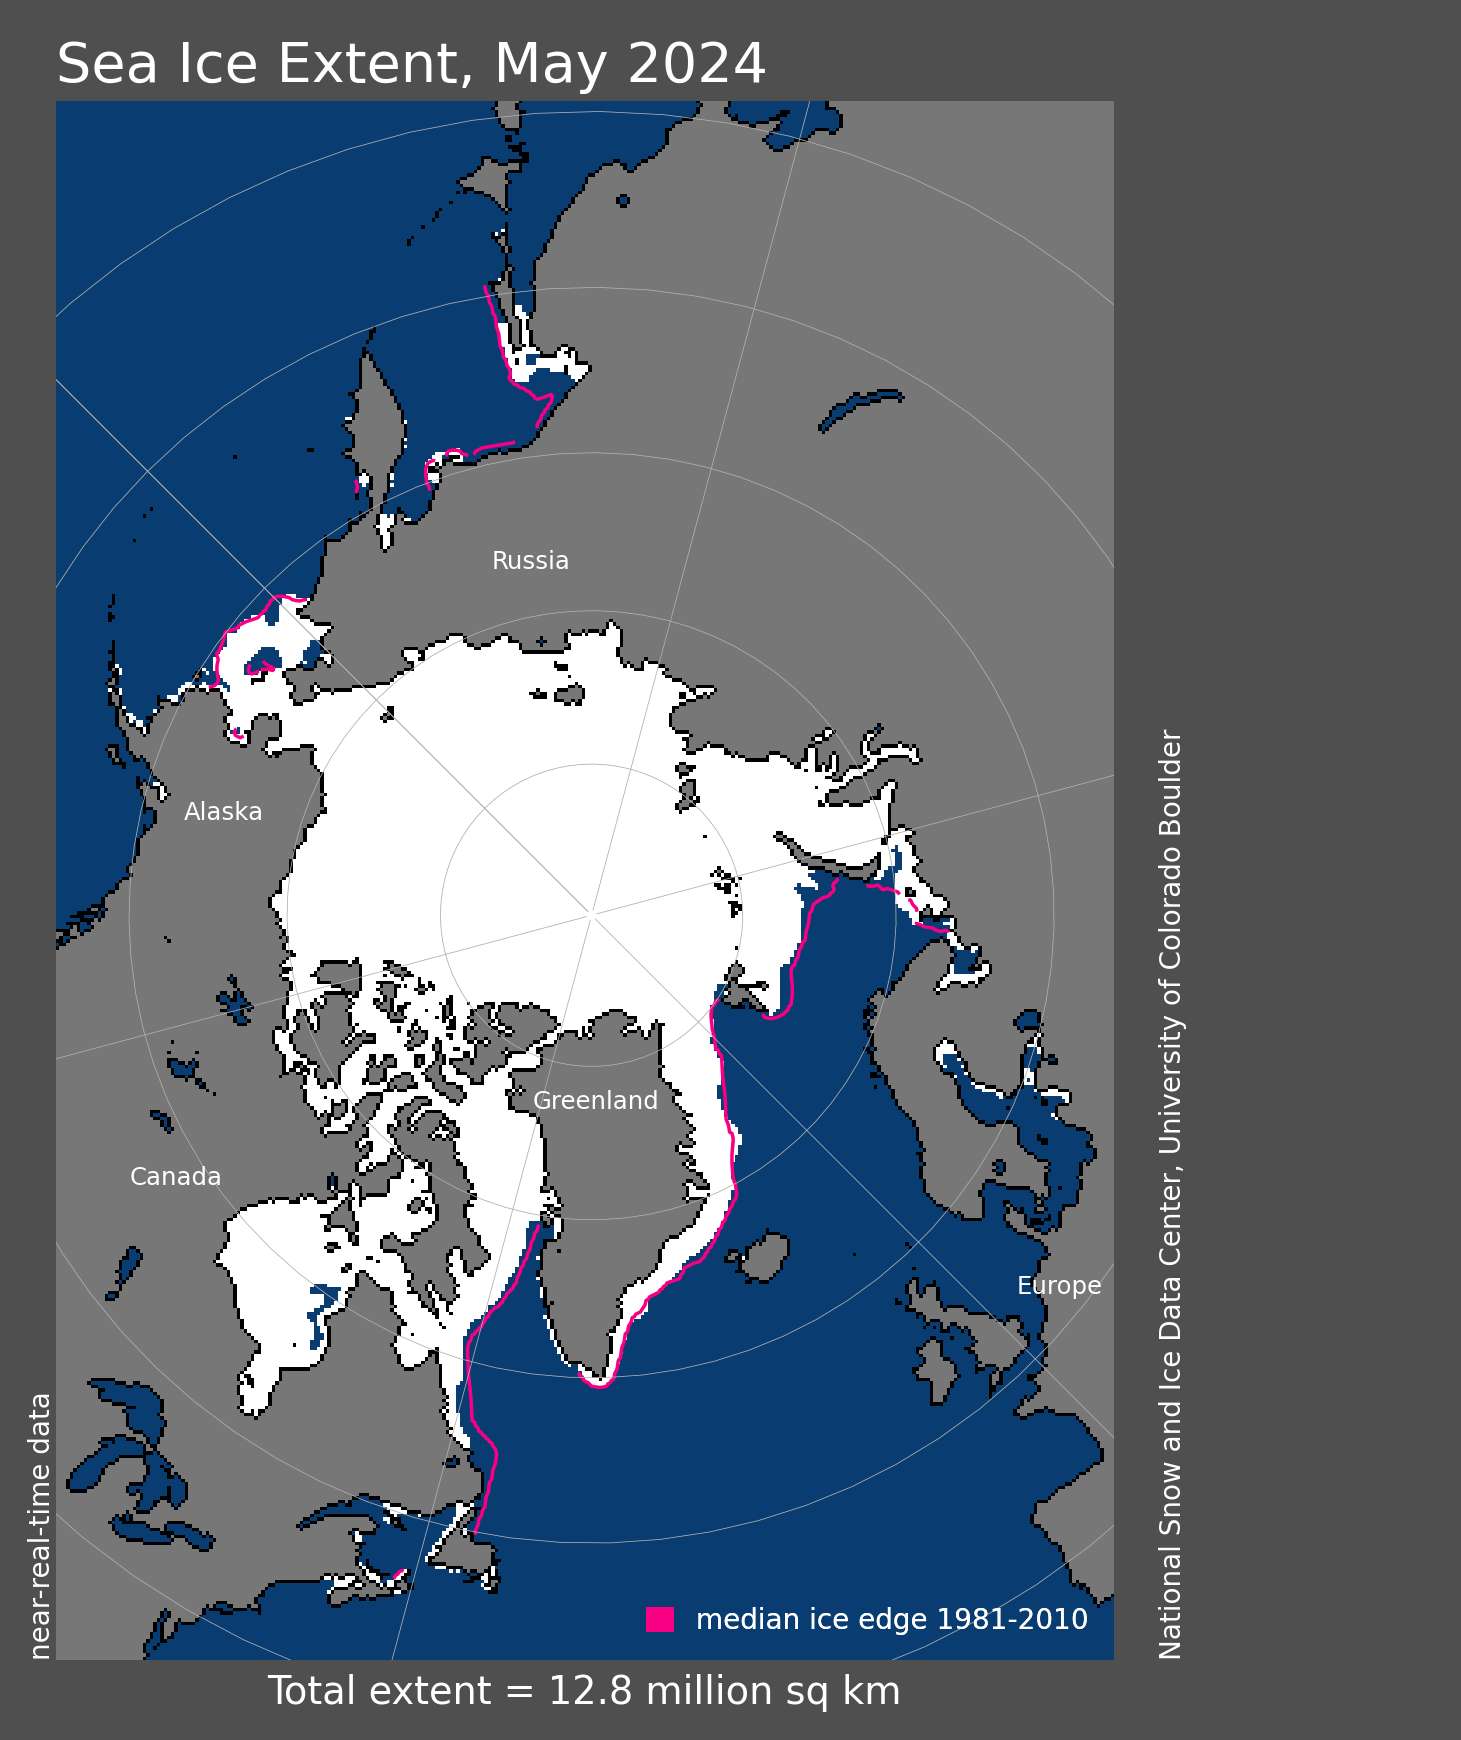
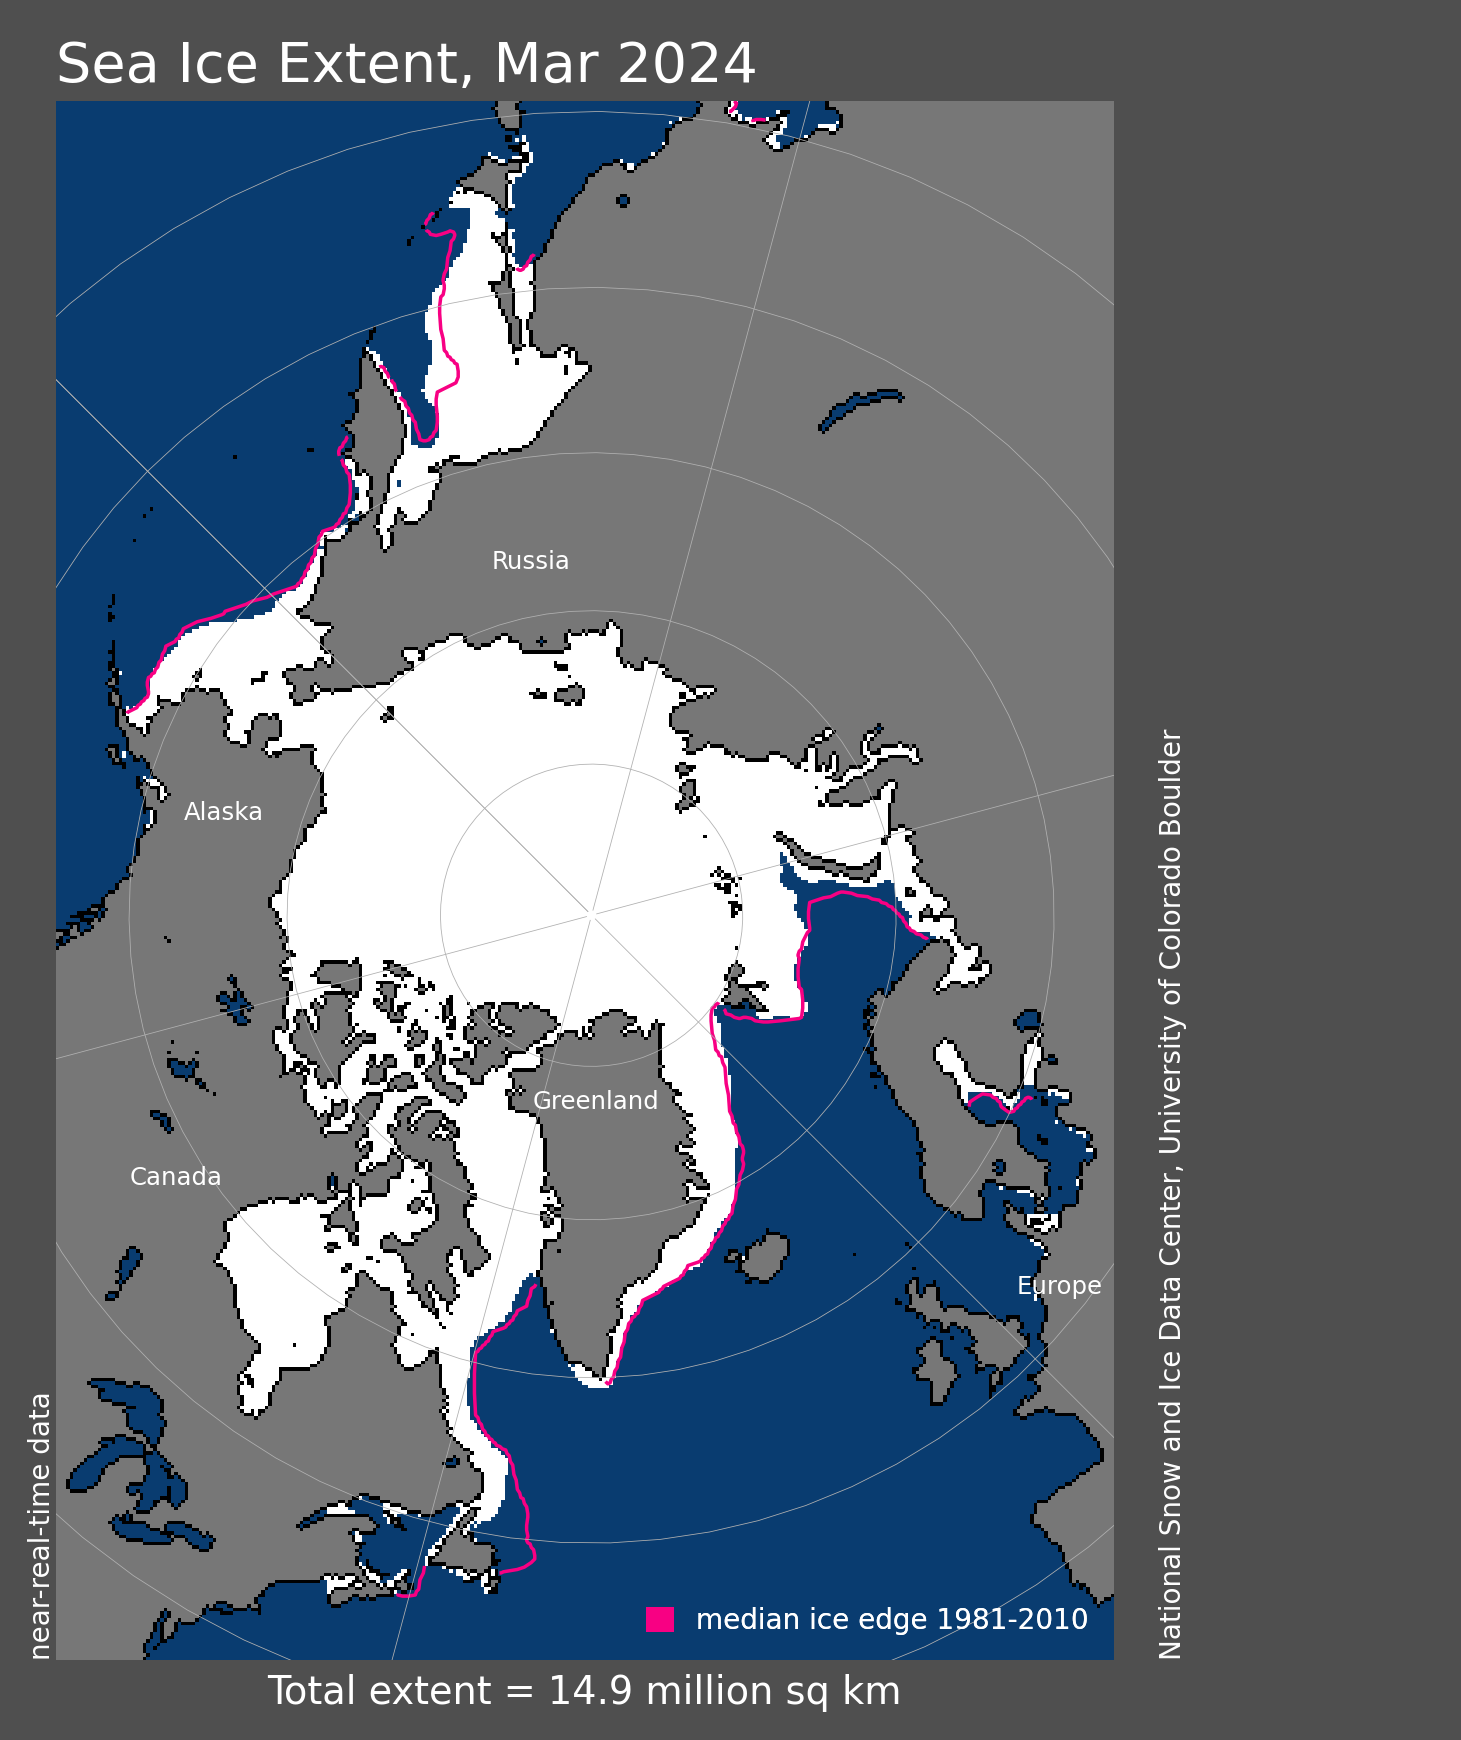
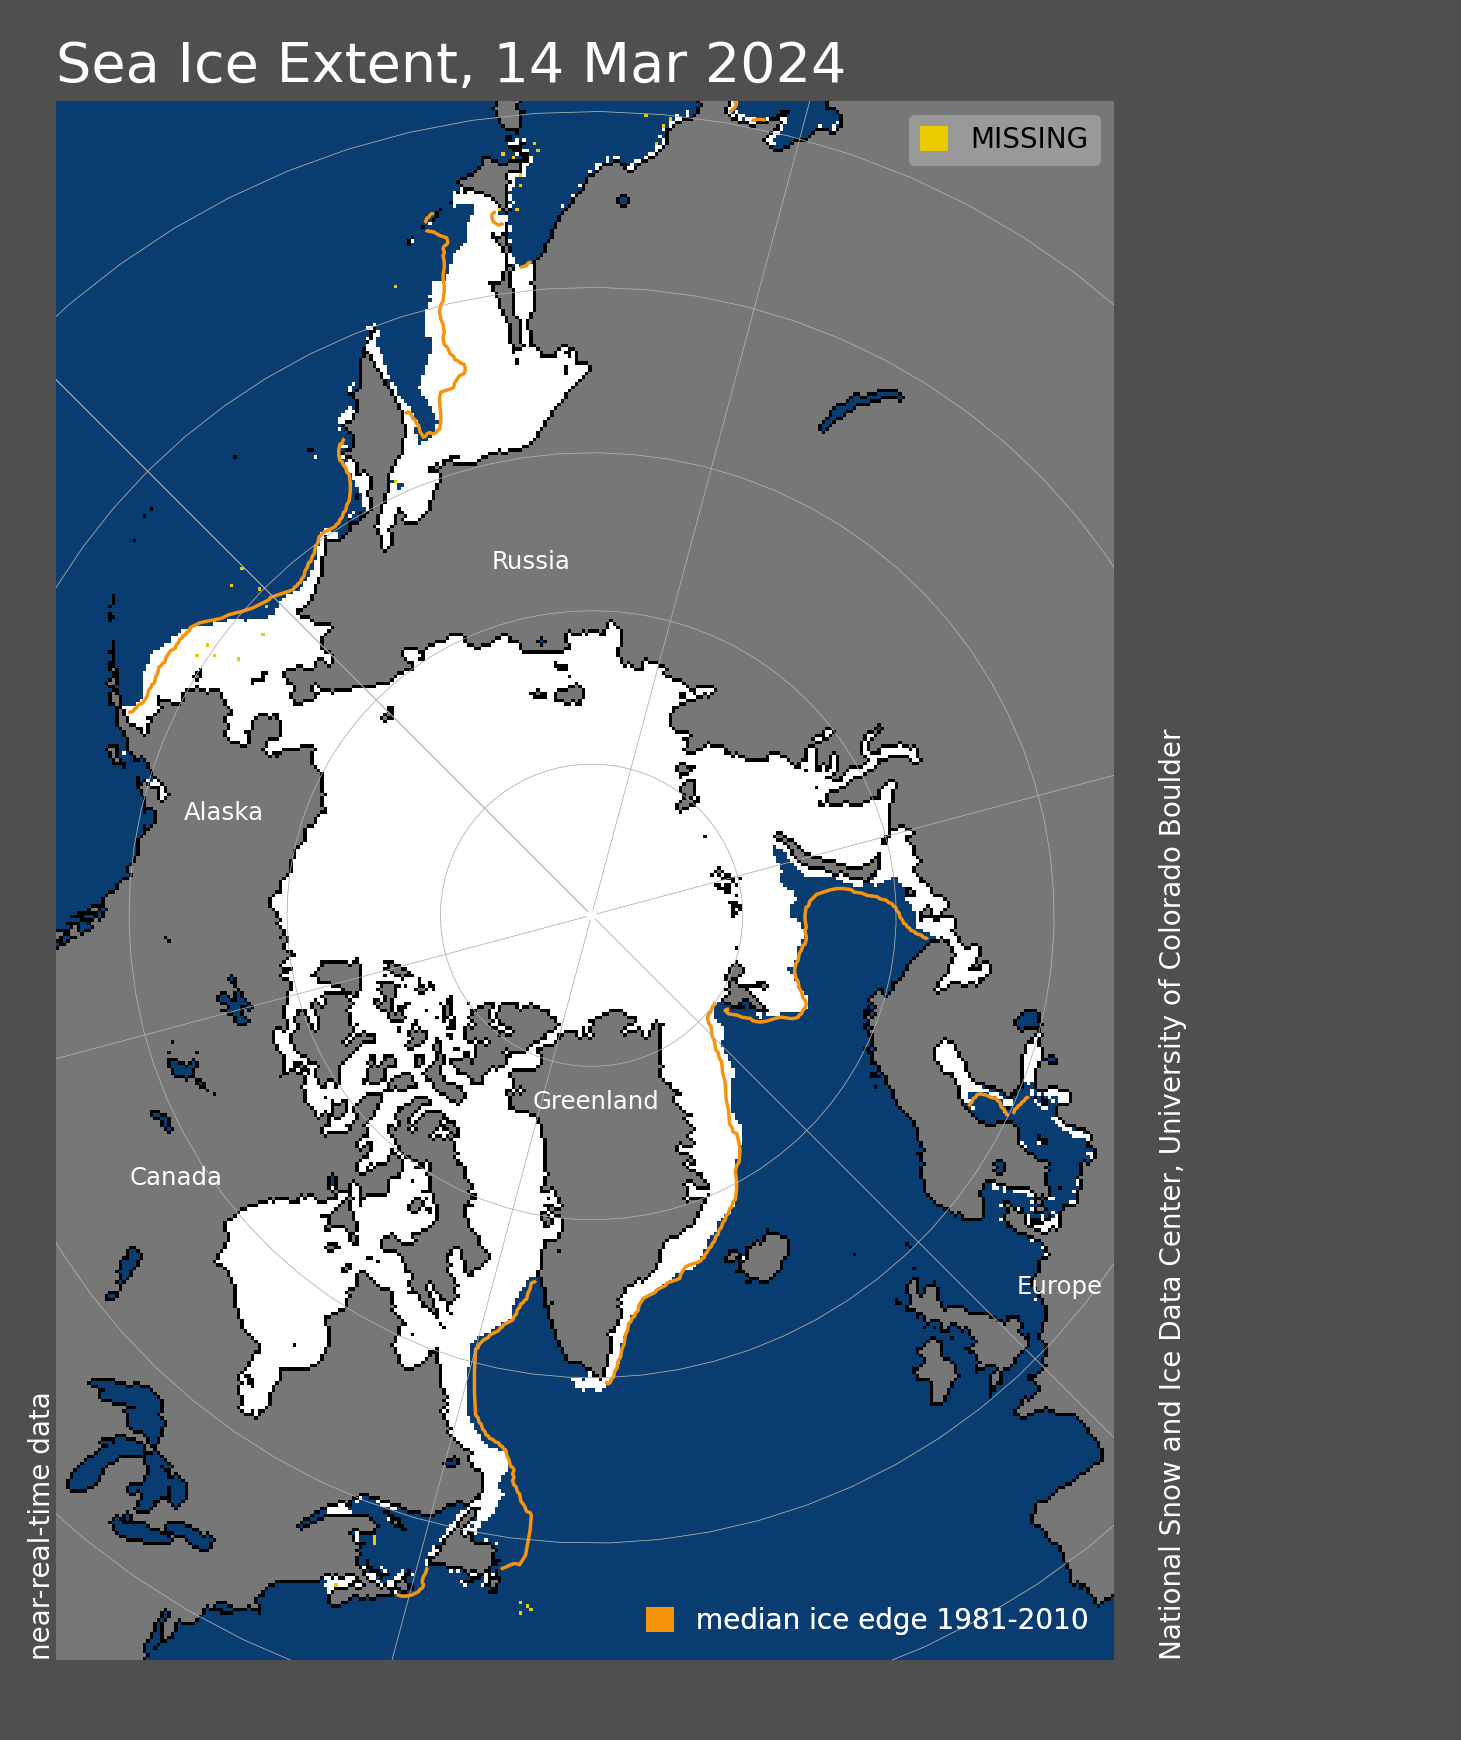
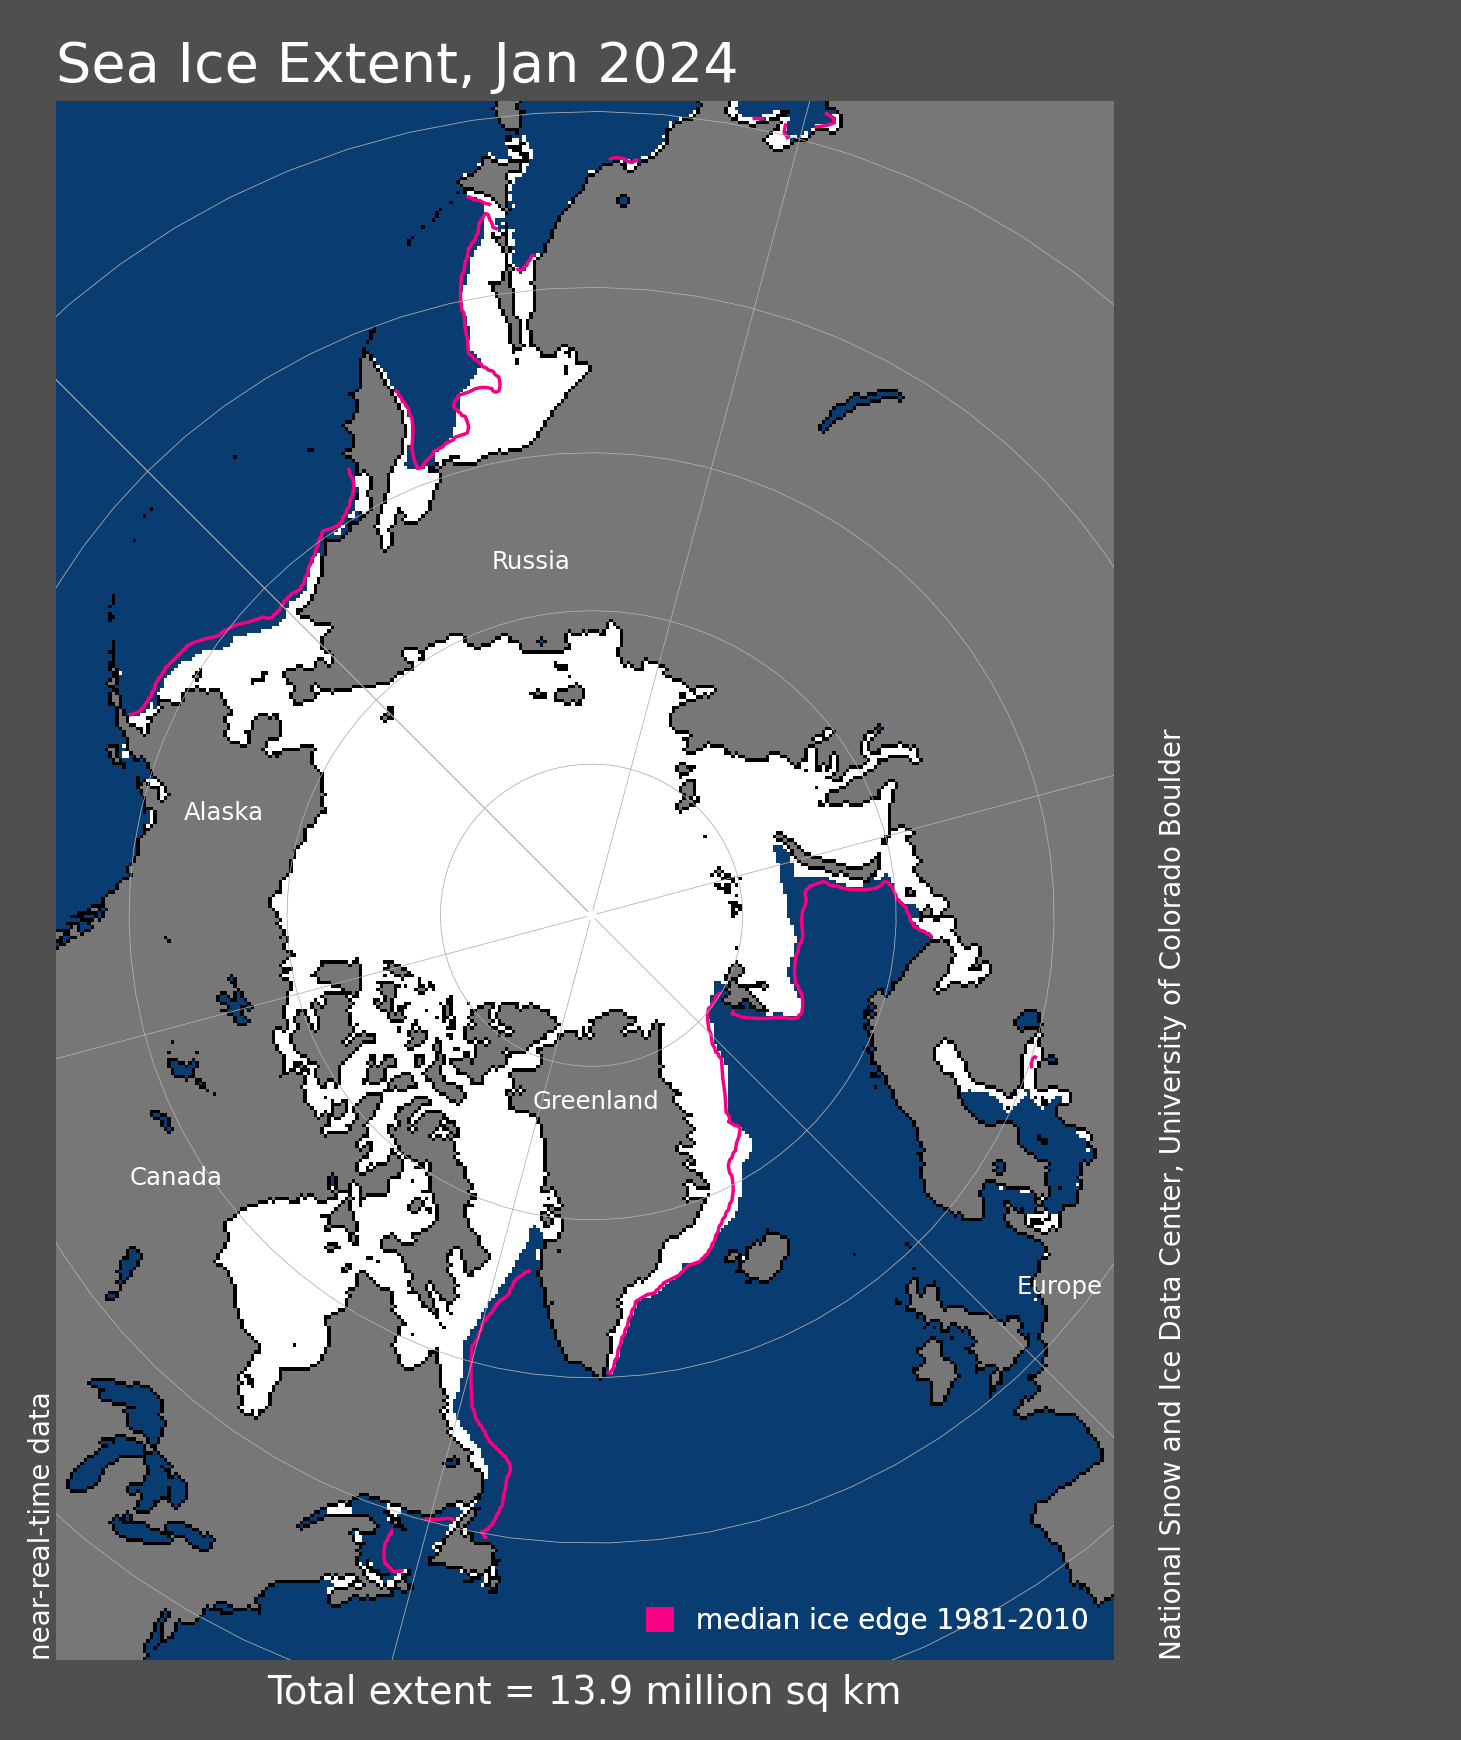
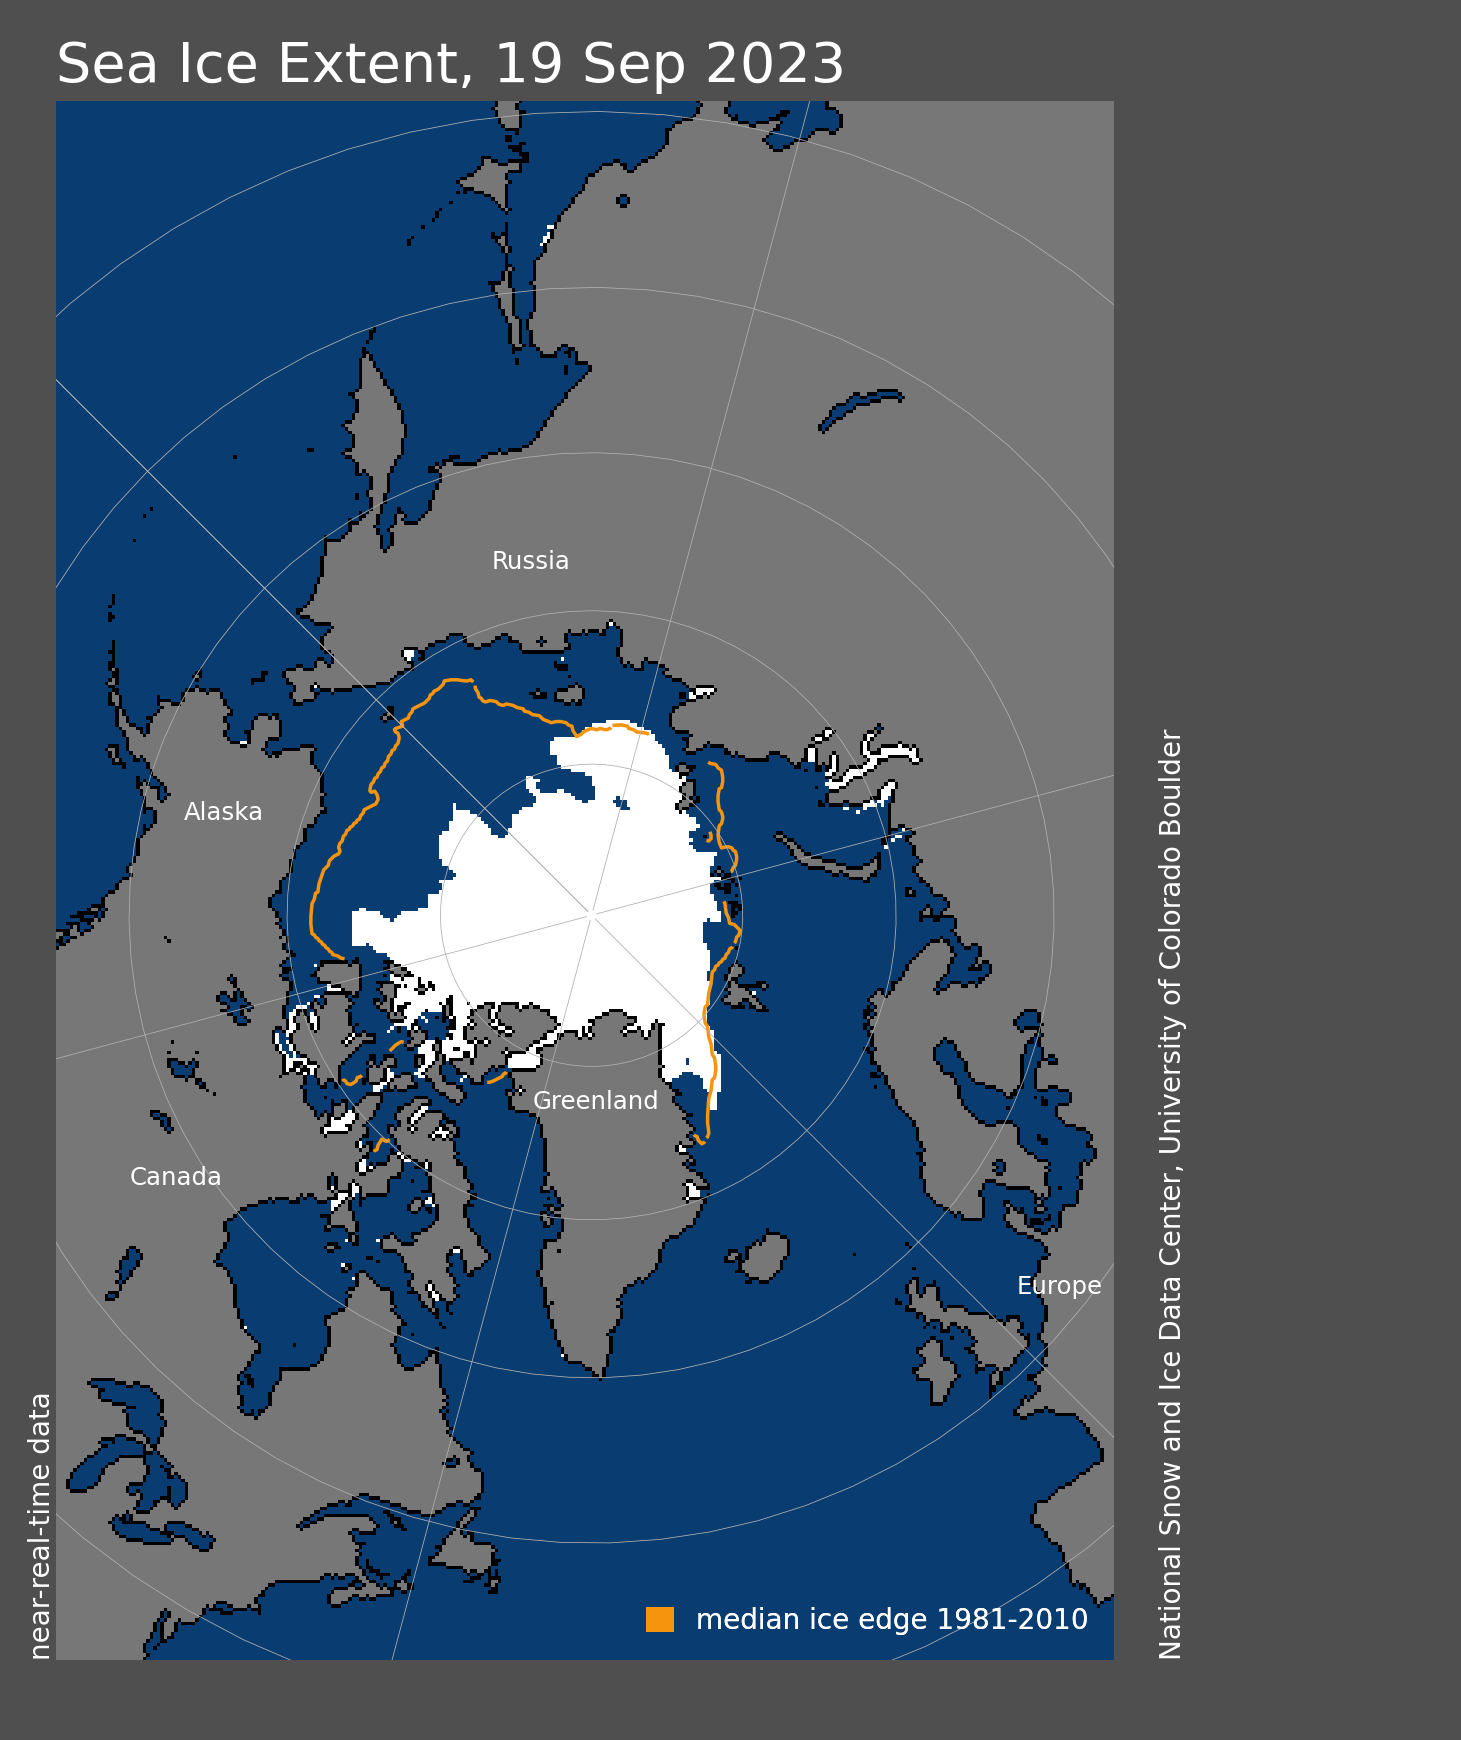
Figure 1a. Arctic sea ice extent for September 2023 was 4.37 million square kilometers (1.69 million square miles). The magenta line shows the 1981 to 2010 average extent for that month. Sea Ice Index data. About the data
Credit: National Snow and Ice Data Center
High-resolution image
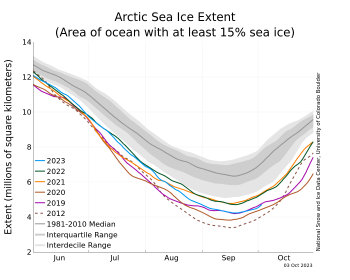
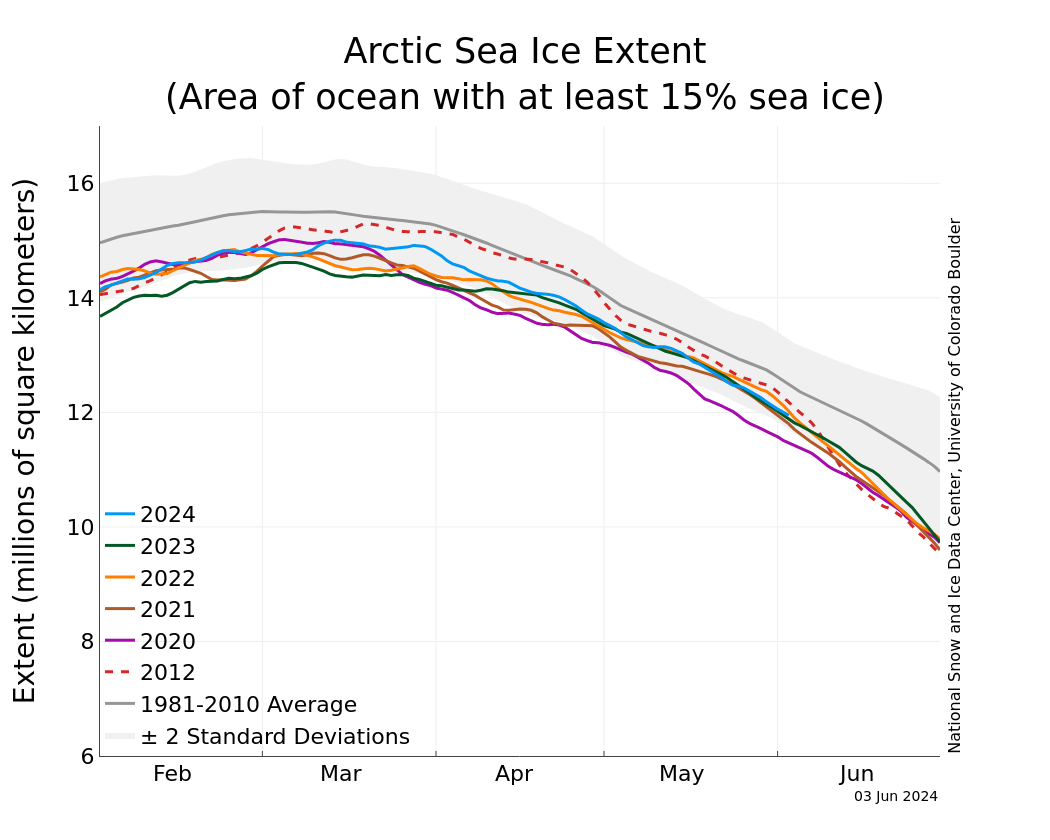
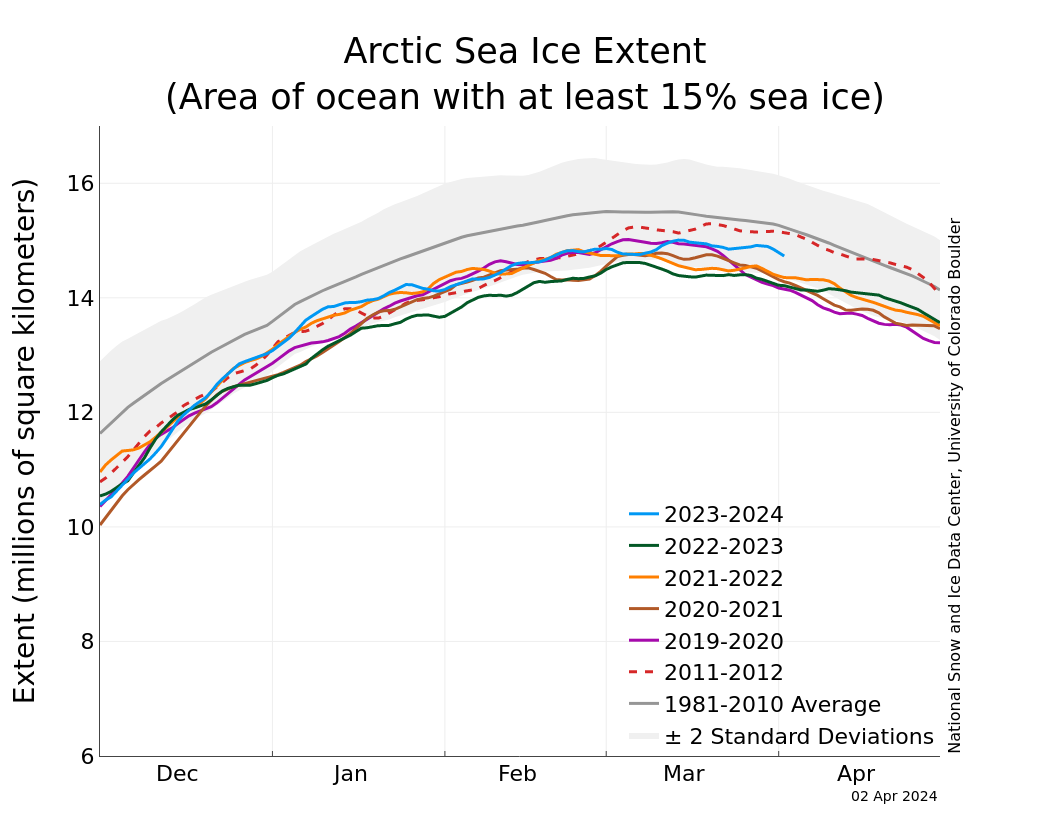
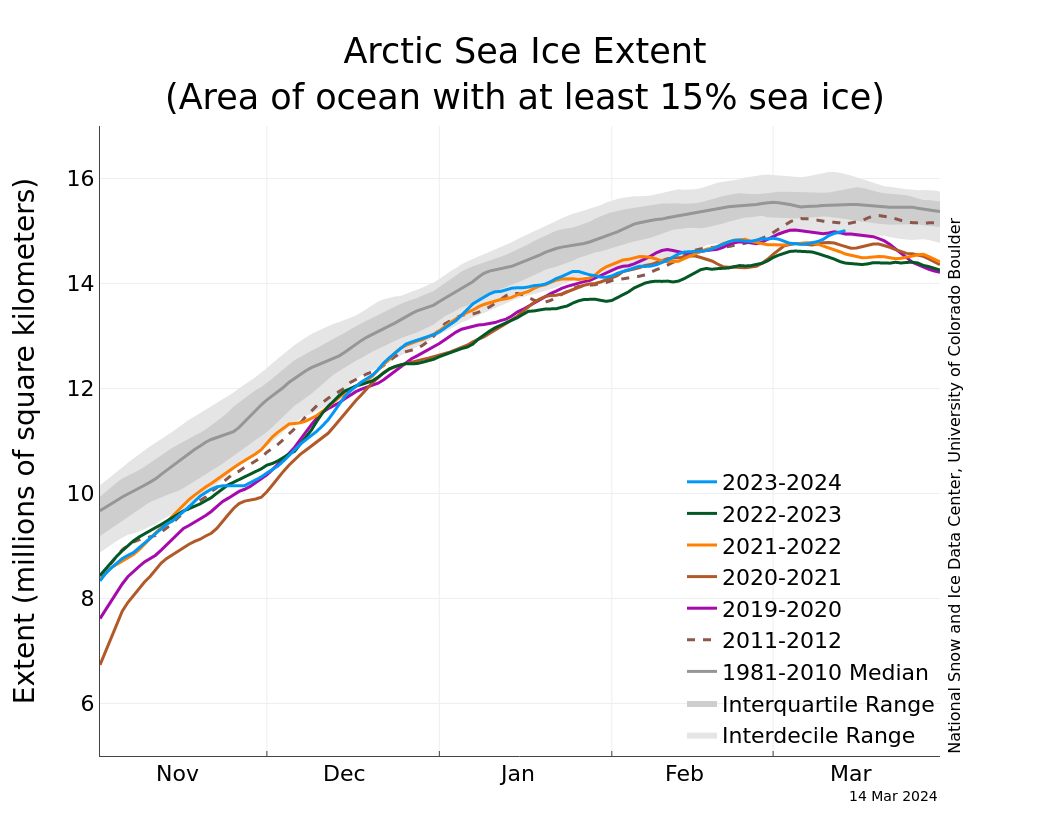
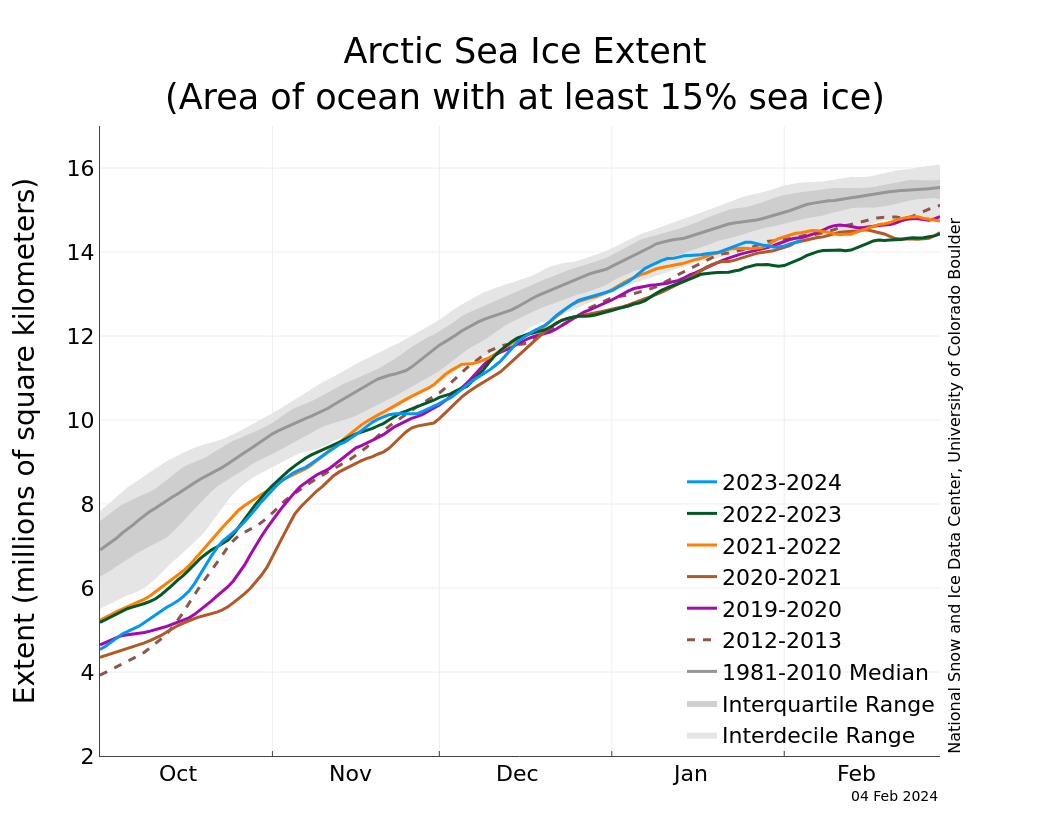
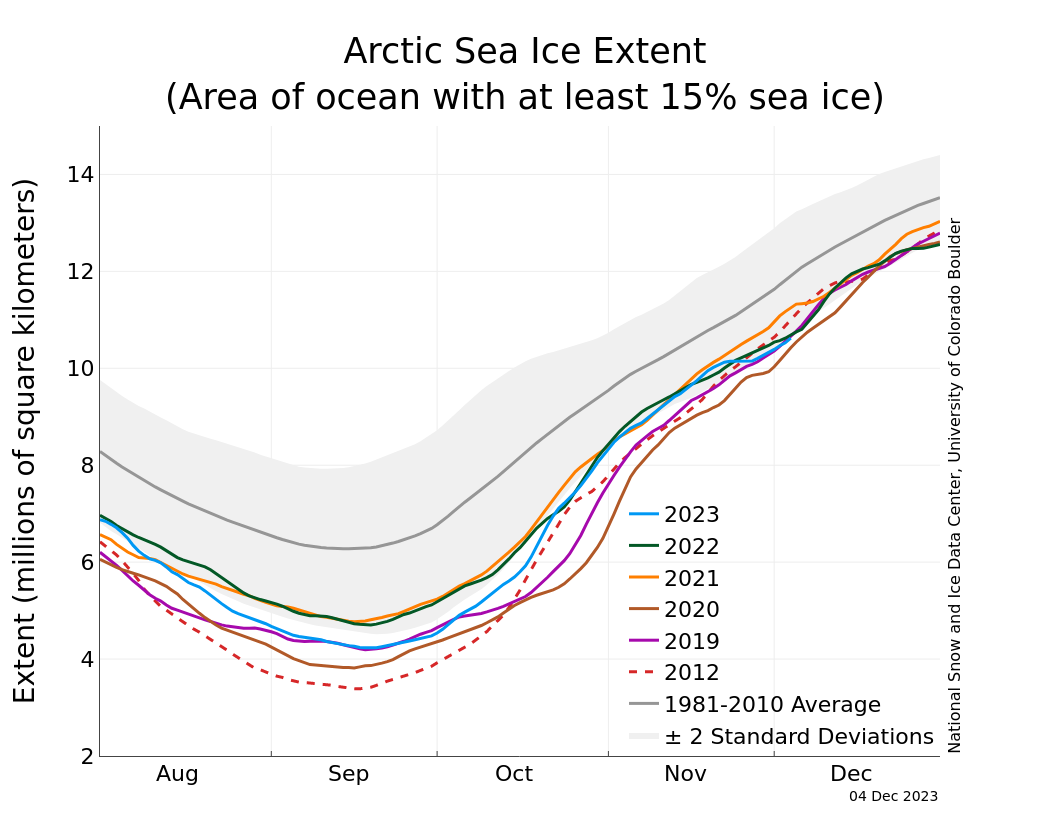
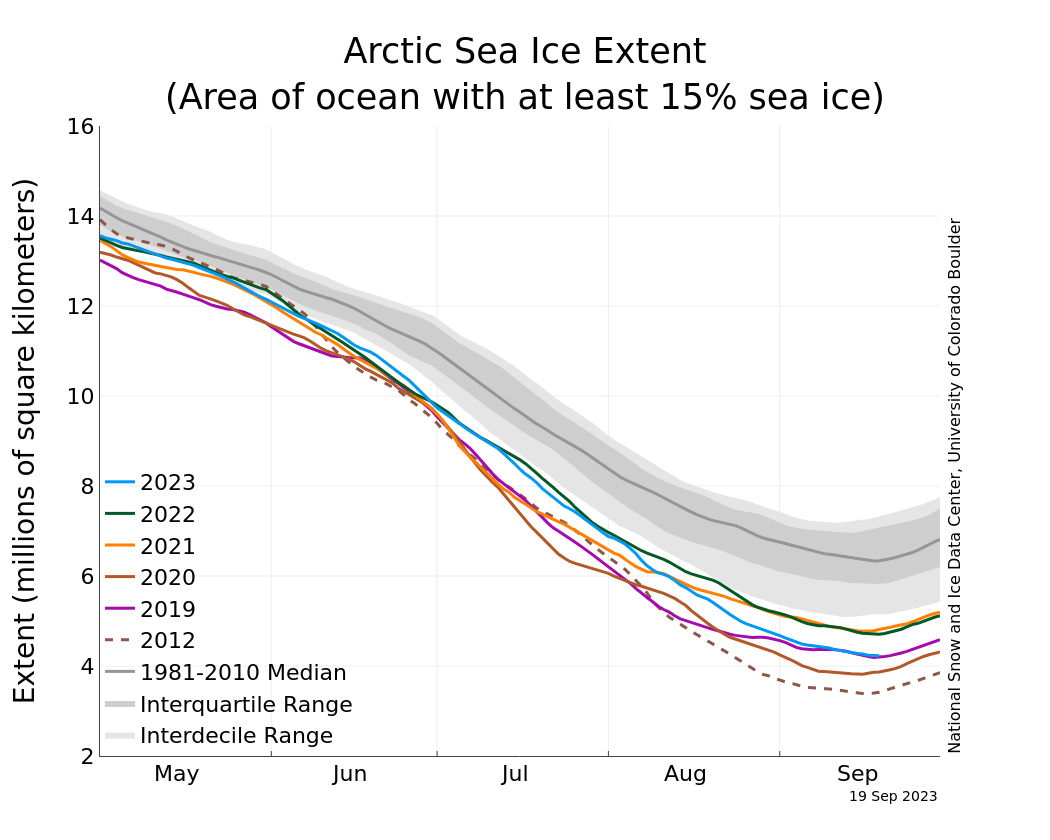
Figure 1b. The graph above shows Arctic sea ice extent as of October 3, 2023, along with daily ice extent data for four previous years and the record low year. 2023 is shown in blue, 2022 in green, 2021 in orange, 2020 in brown, 2019 in magenta, and 2012 in dashed brown. The 1981 to 2010 median is in dark gray. The gray areas around the median line show the interquartile and interdecile ranges of the data. Sea Ice Index data.
Credit: National Snow and Ice Data Center
High-resolution image
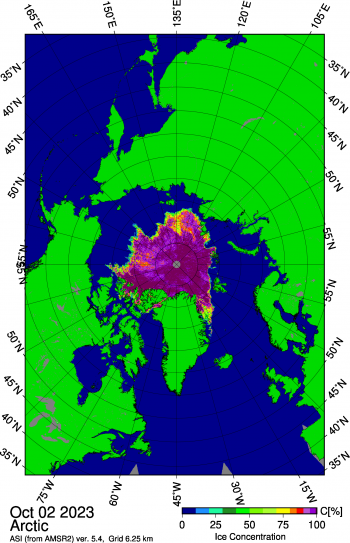
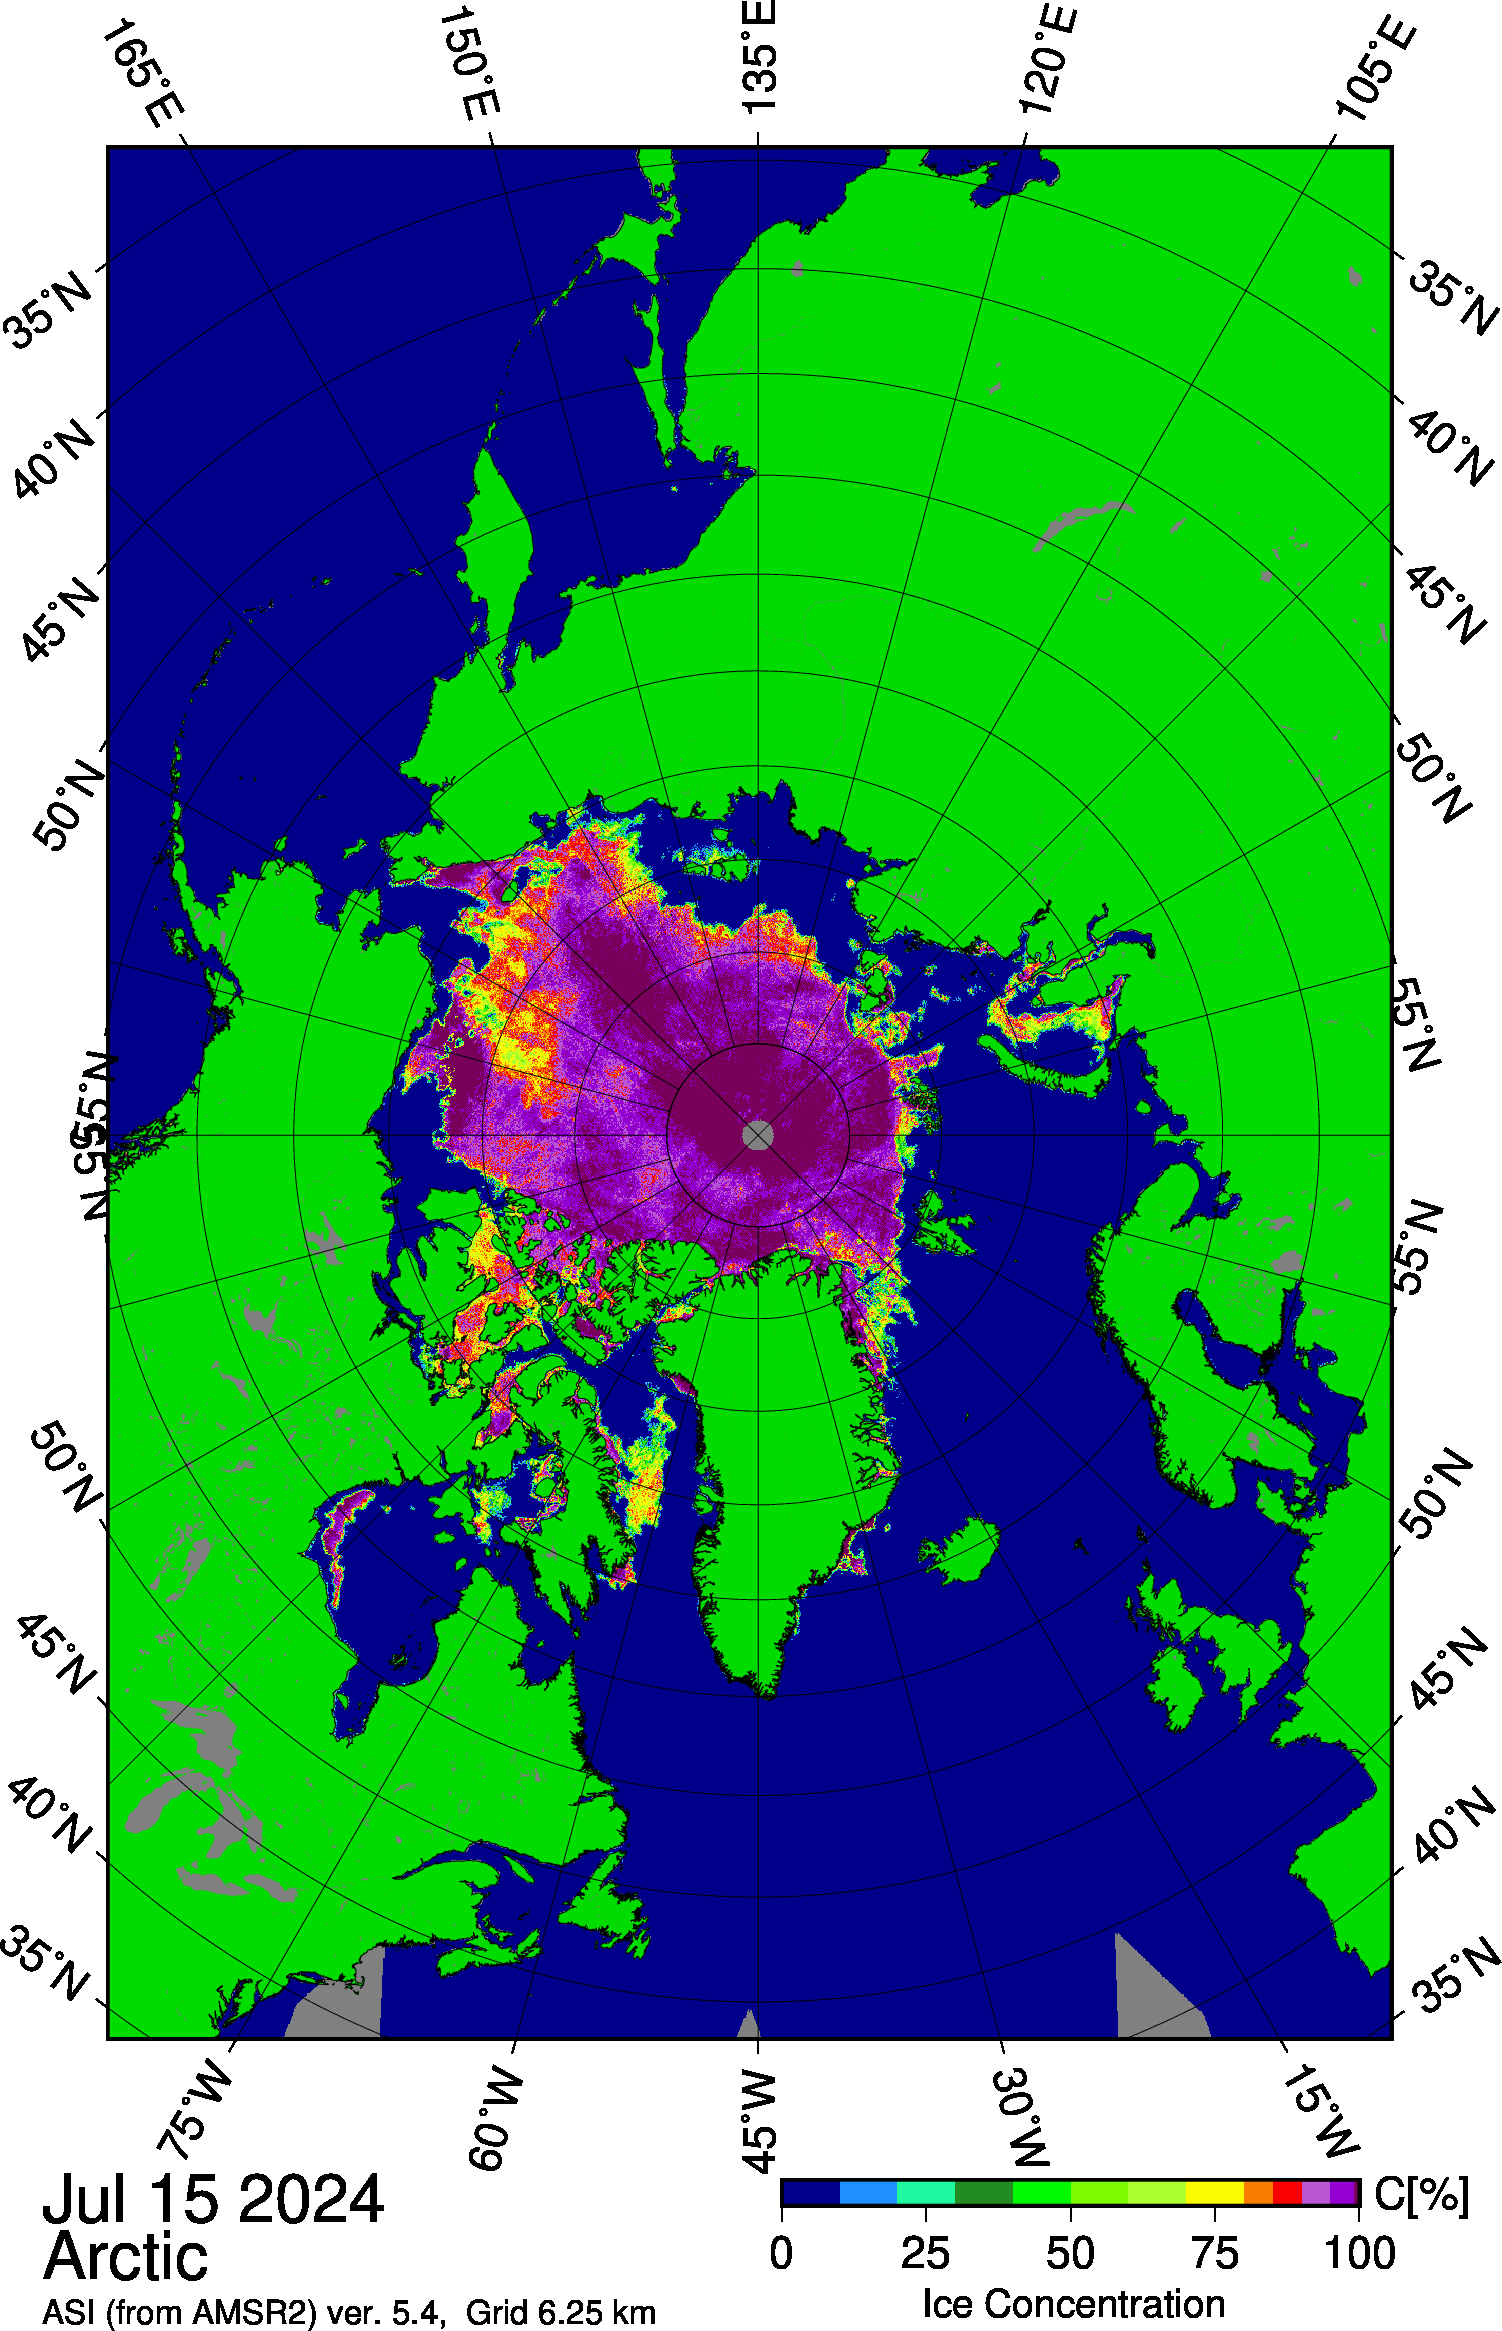
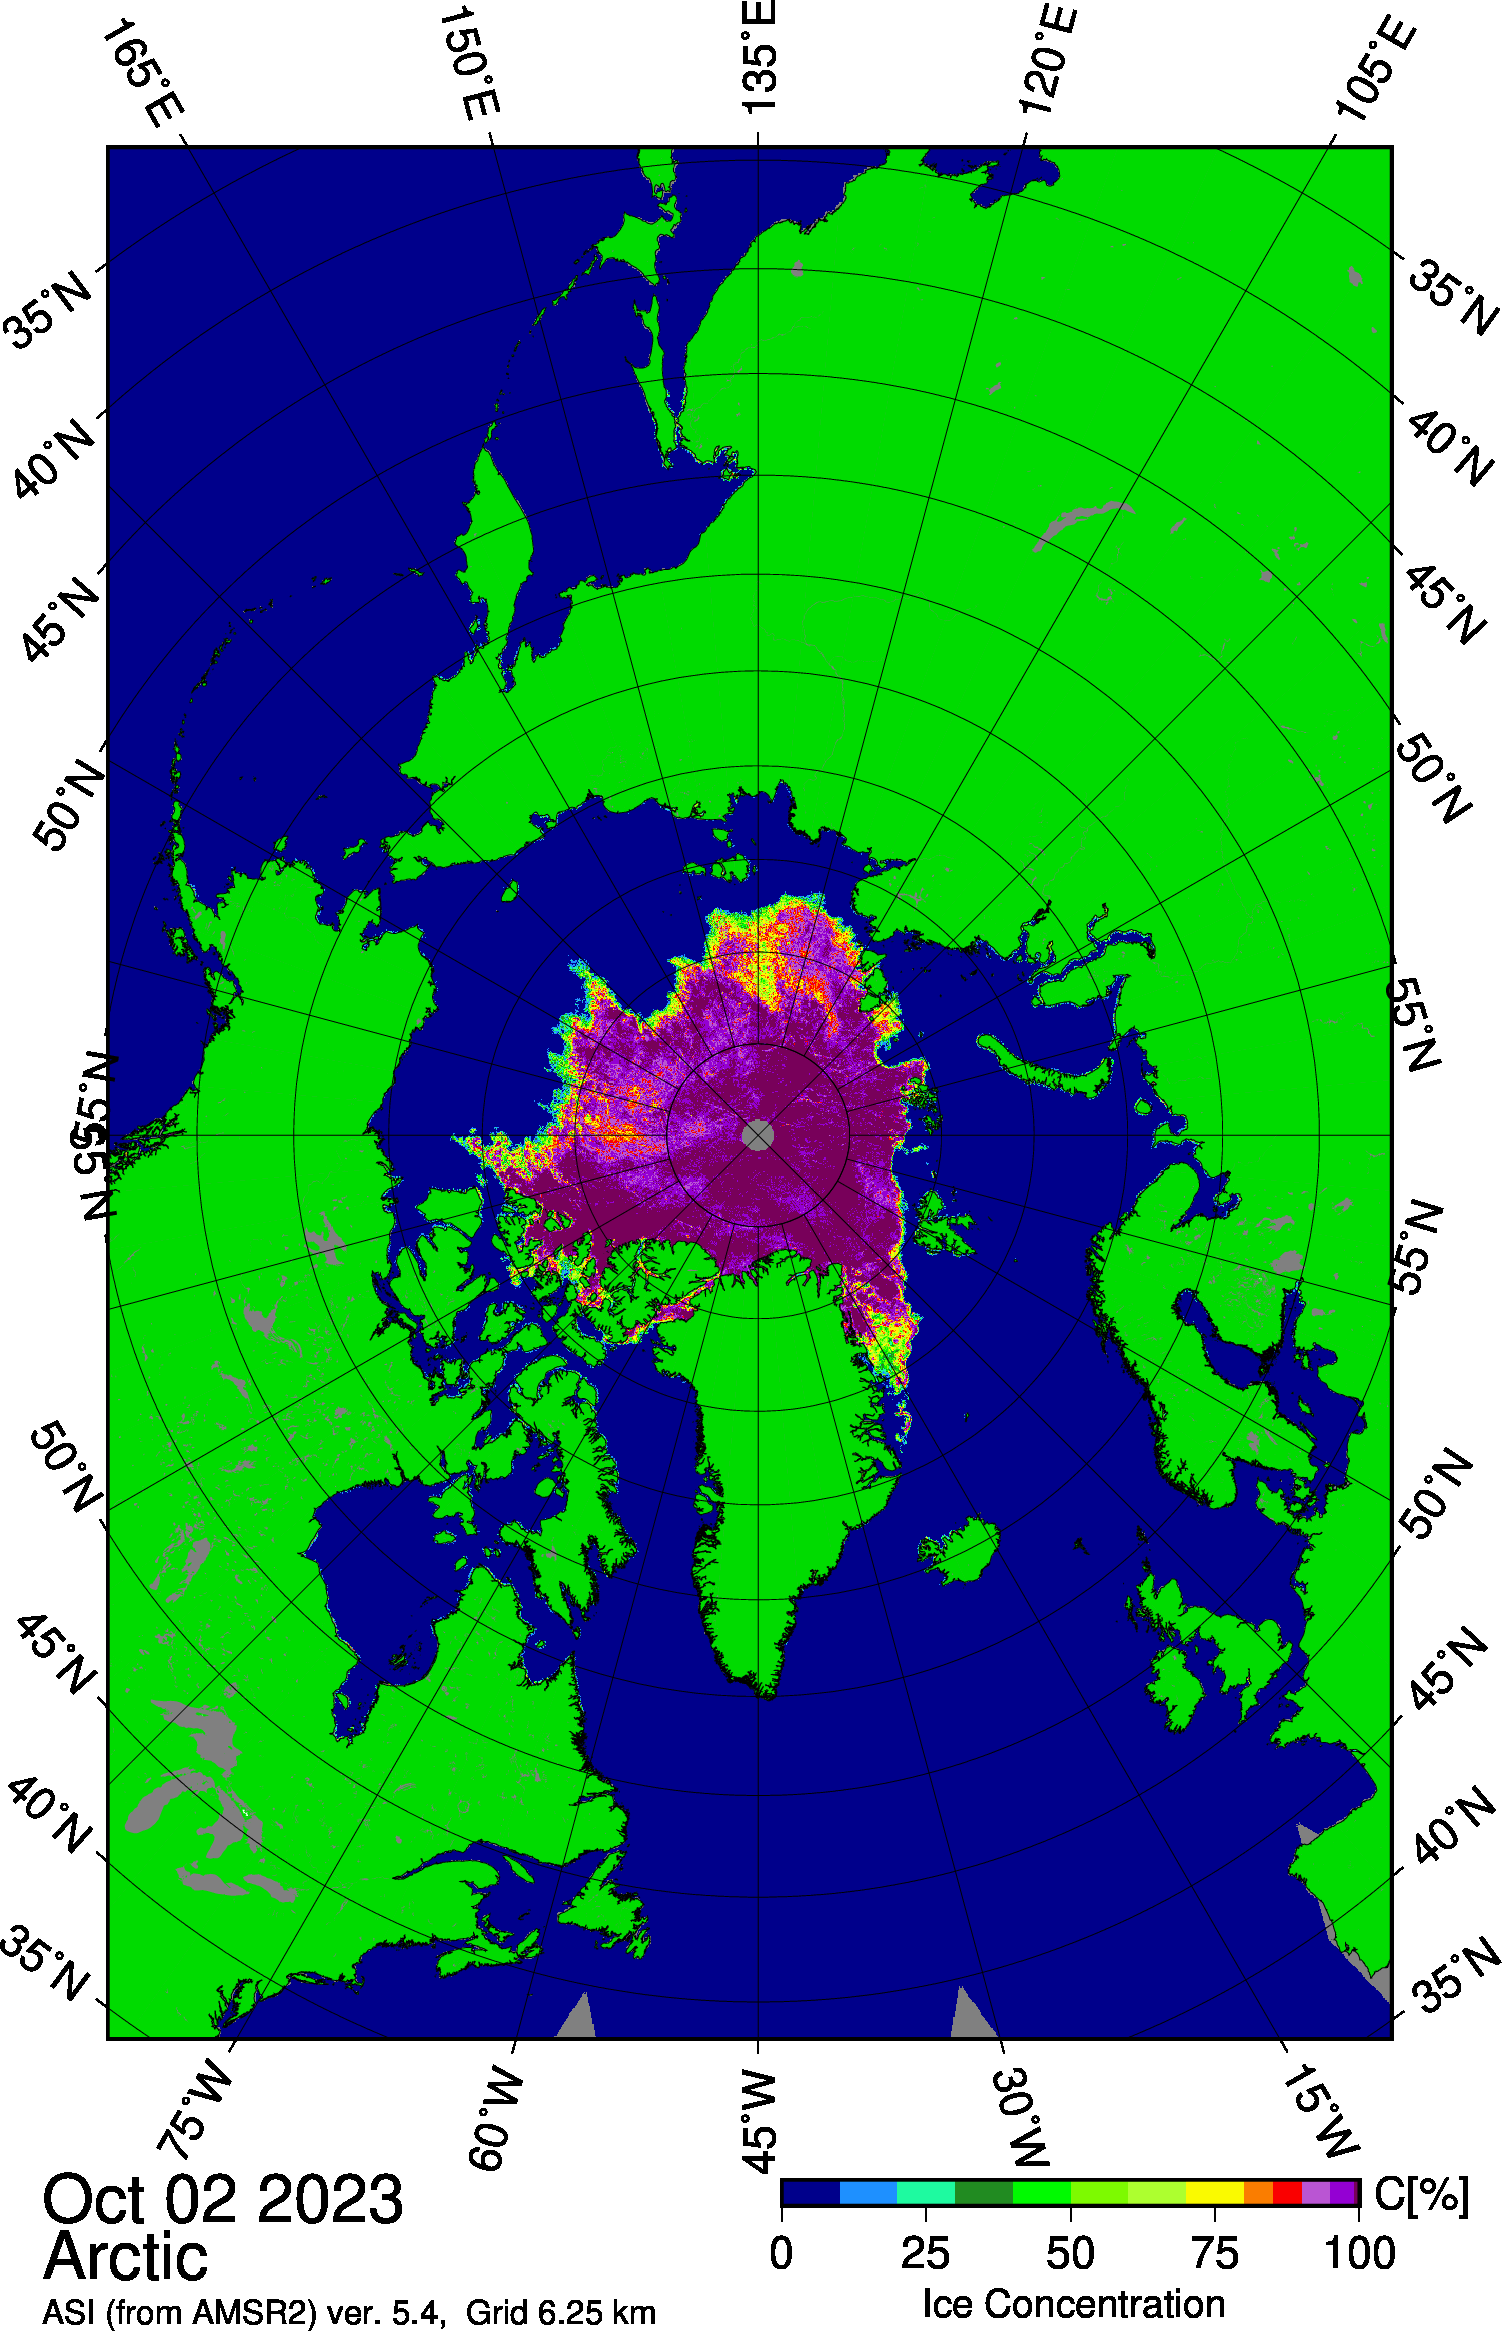
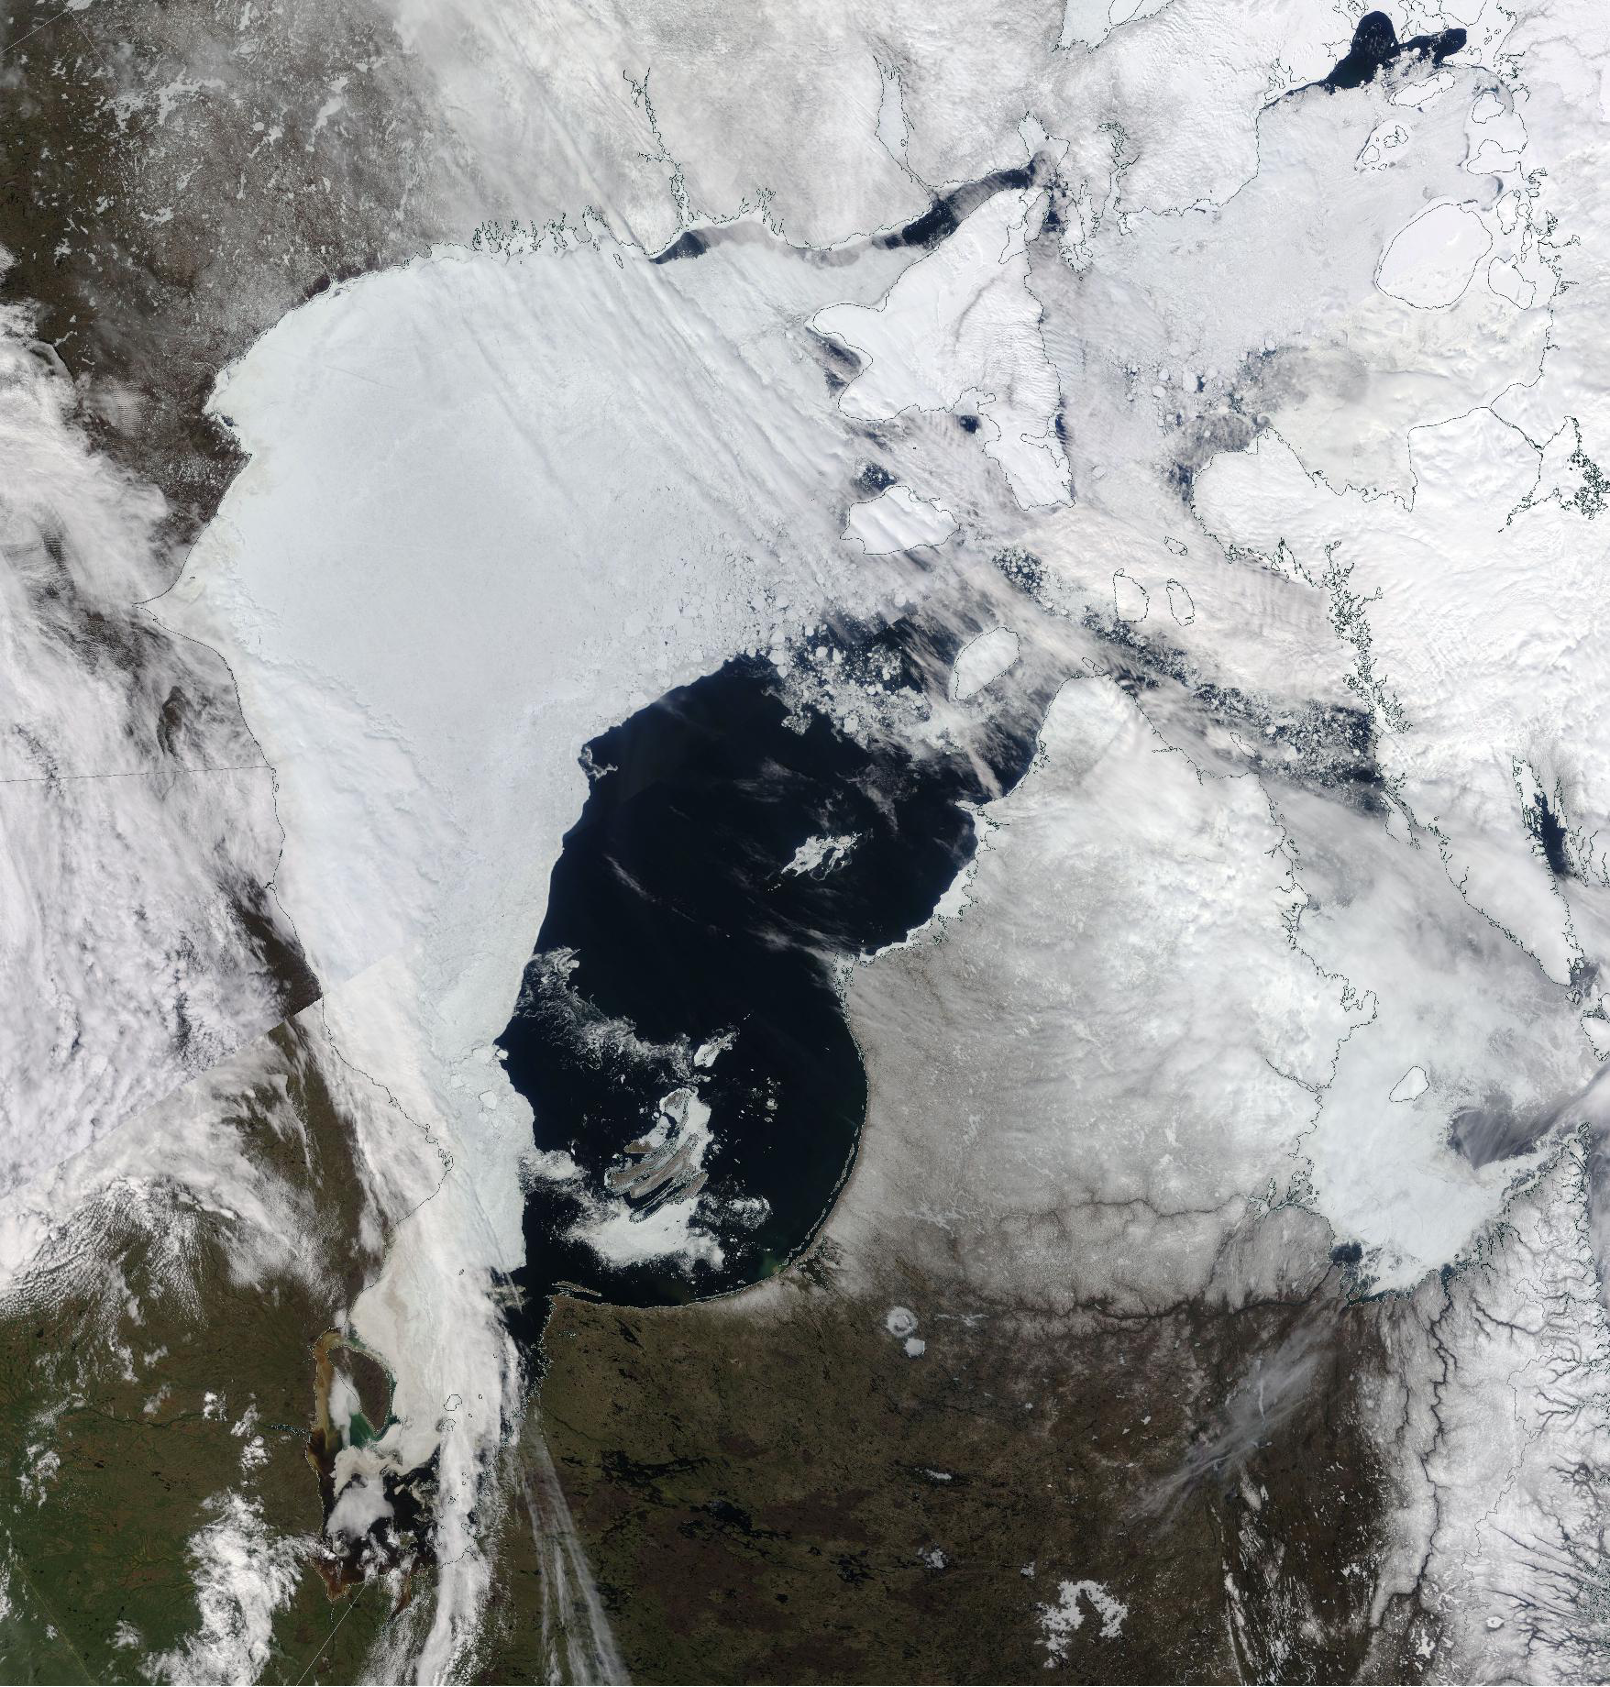
Figure 1c. This image from the Japan Aerospace Exploration Agency (JAXA) Advanced Microwave Scanning Radiometer 2 (AMSR2) shows sea ice concentration in the Arctic Ocean on October 2, 2023, highlighting the openings of sea ice north of Alaska within the Beaufort and Chukchi Seas.
Credit: Japan Aerospace Exploration Agency, courtesy University of Bremen
High-resolution image
Average Arctic sea ice extent for September 2023 was 4.37 million square kilometers (1.69 million square miles), placing it fifth lowest in the 45-year satellite record (Figure 1a). Following the annual minimum of 4.23 million square miles (1.63 million square kilometers), the growth in Arctic sea ice extent has been slower than average (Figure 1b). The image plot for October 2 from the Advanced Microwave Scanning Radiometer 2 (AMSR2) instrument provided by the University of Bremen shows that with the cessation of melt, the ice edge has become more sharply defined (Figure 1c). The lack of ice in the longitudes spanning the Laptev Sea eastward to the Beaufort Sea is striking; before ice forms in these areas the upper ocean will have to lose its remaining heat through radiation and convective transfer to the atmosphere and space. The Northern Sea Route remains essentially free of ice. While both the Northern (deepwater) and Southern (Amundsen’s) routes of the Northwest Passage appear largely ice free, some ice still remains in the northern route, notably at the eastern entrance of M’Clure Strait. This is discussed further below.
Conditions in context
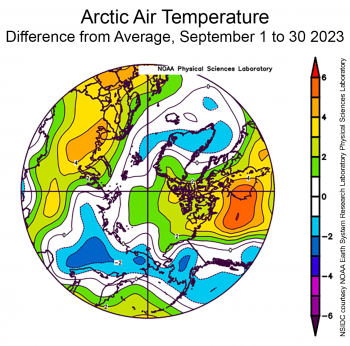
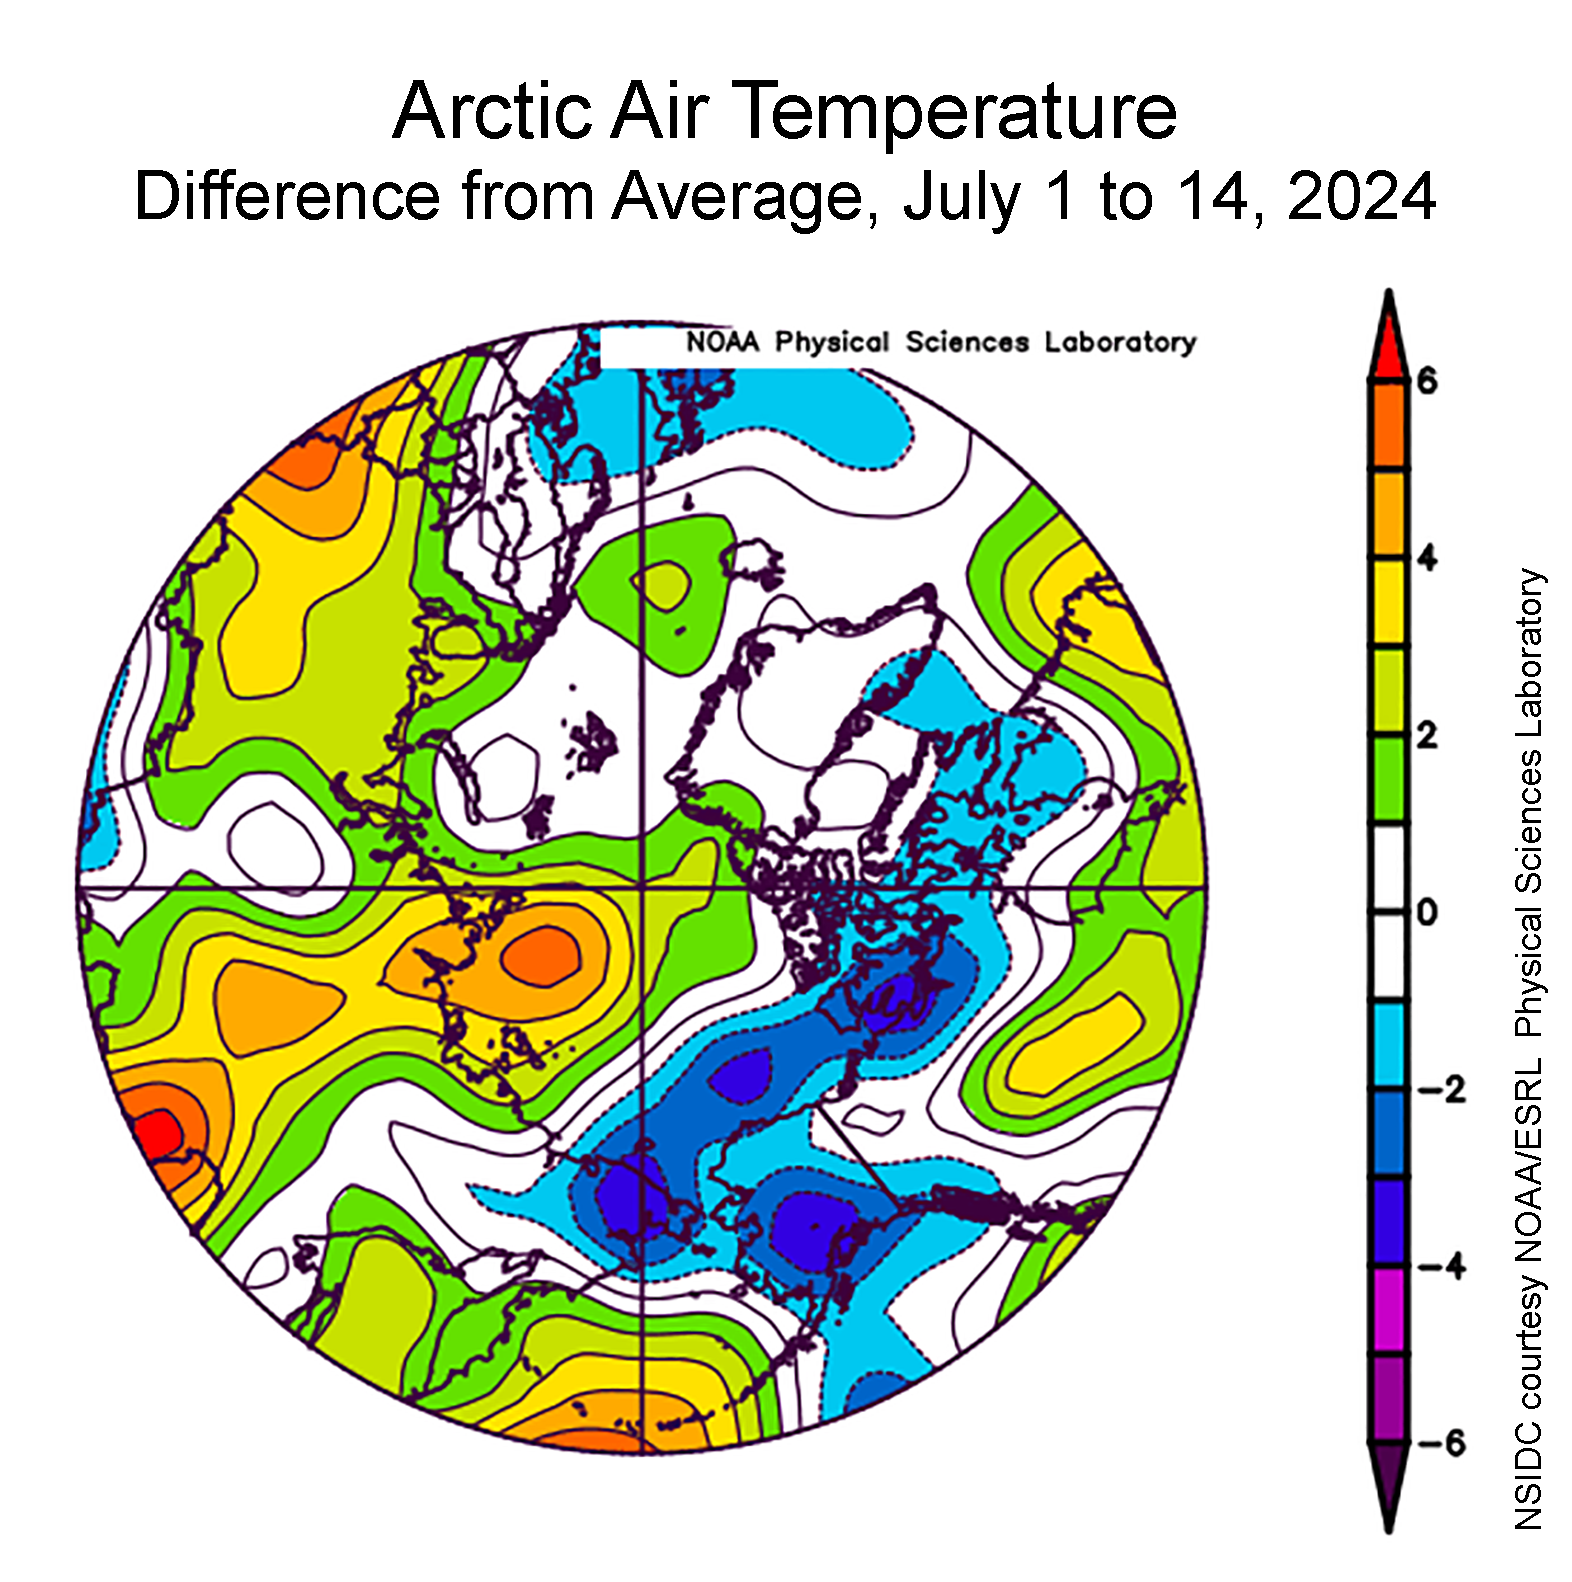
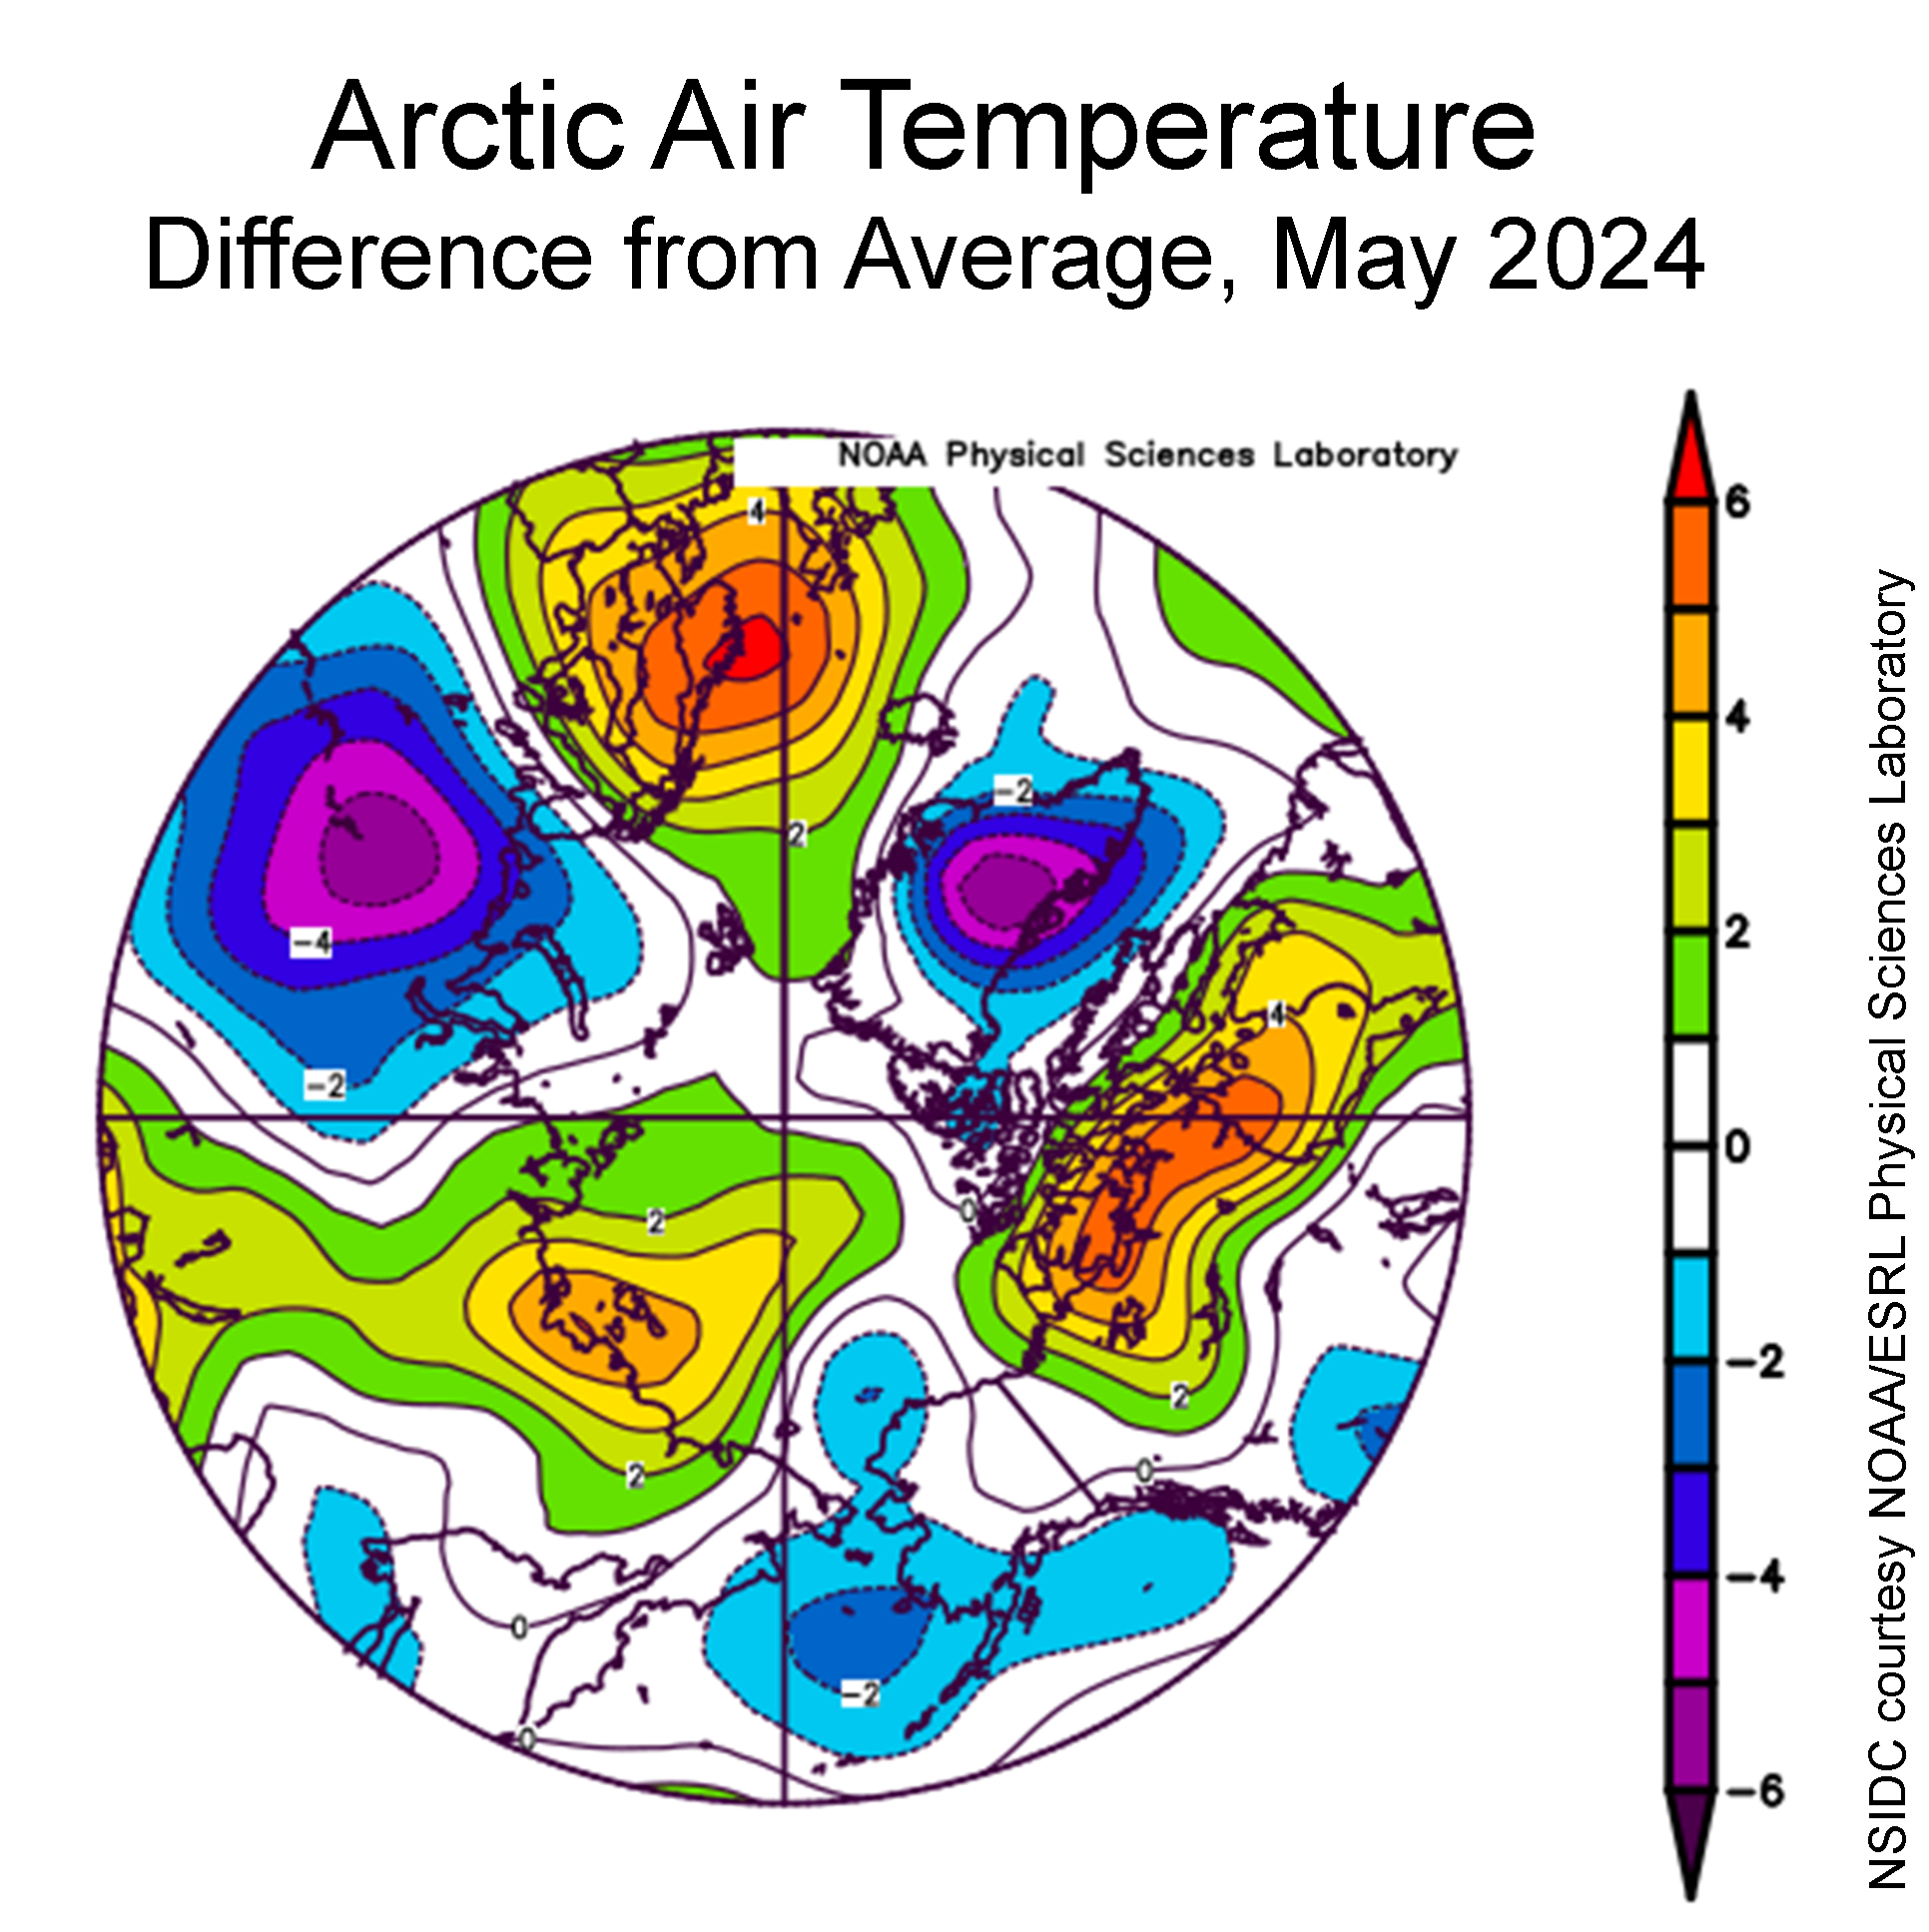
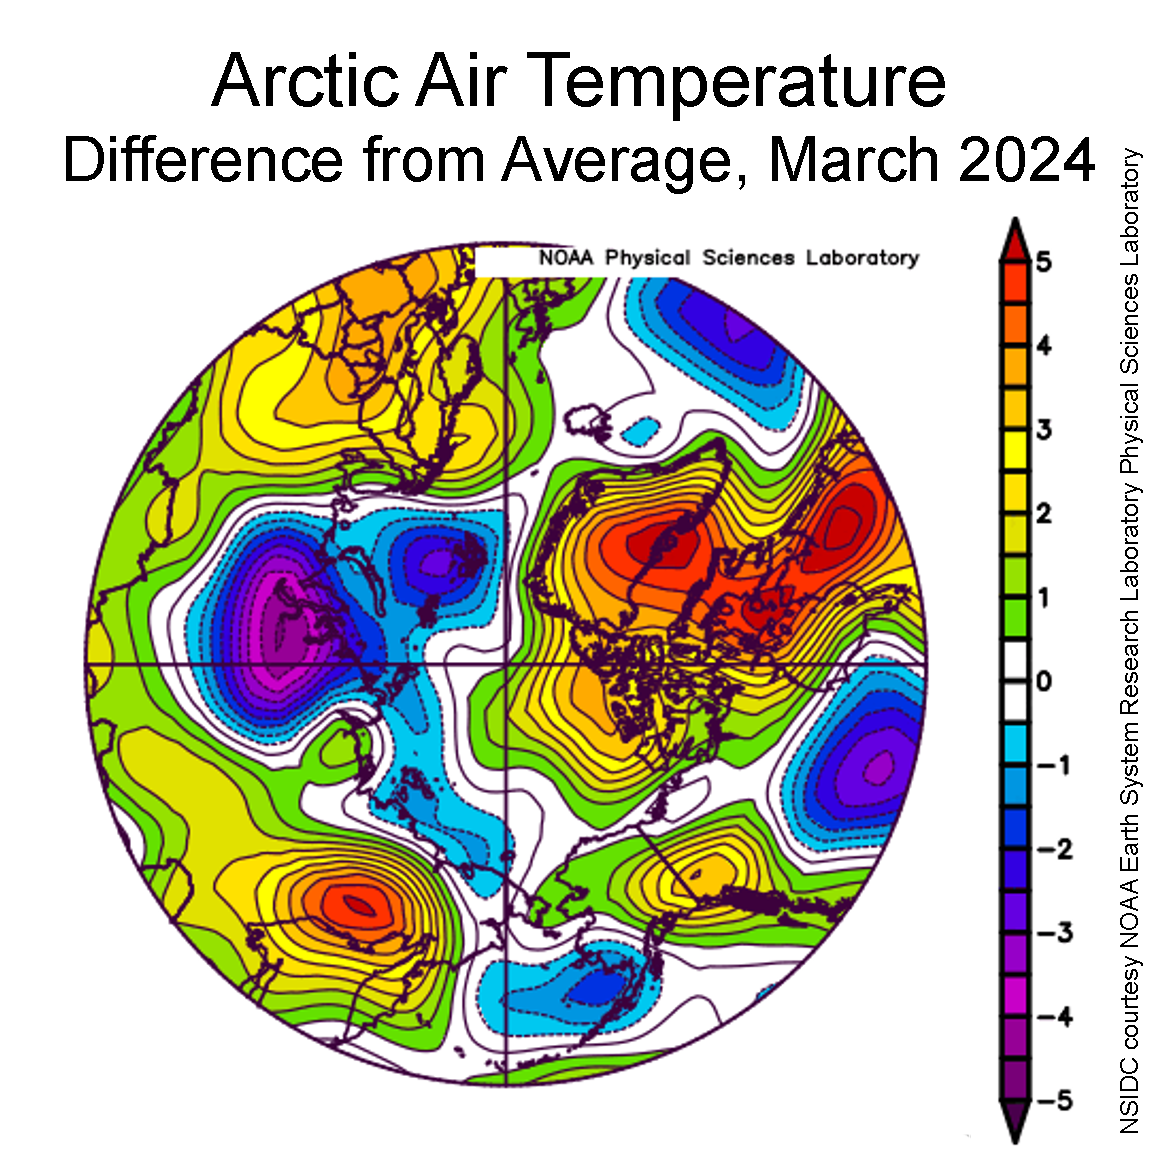
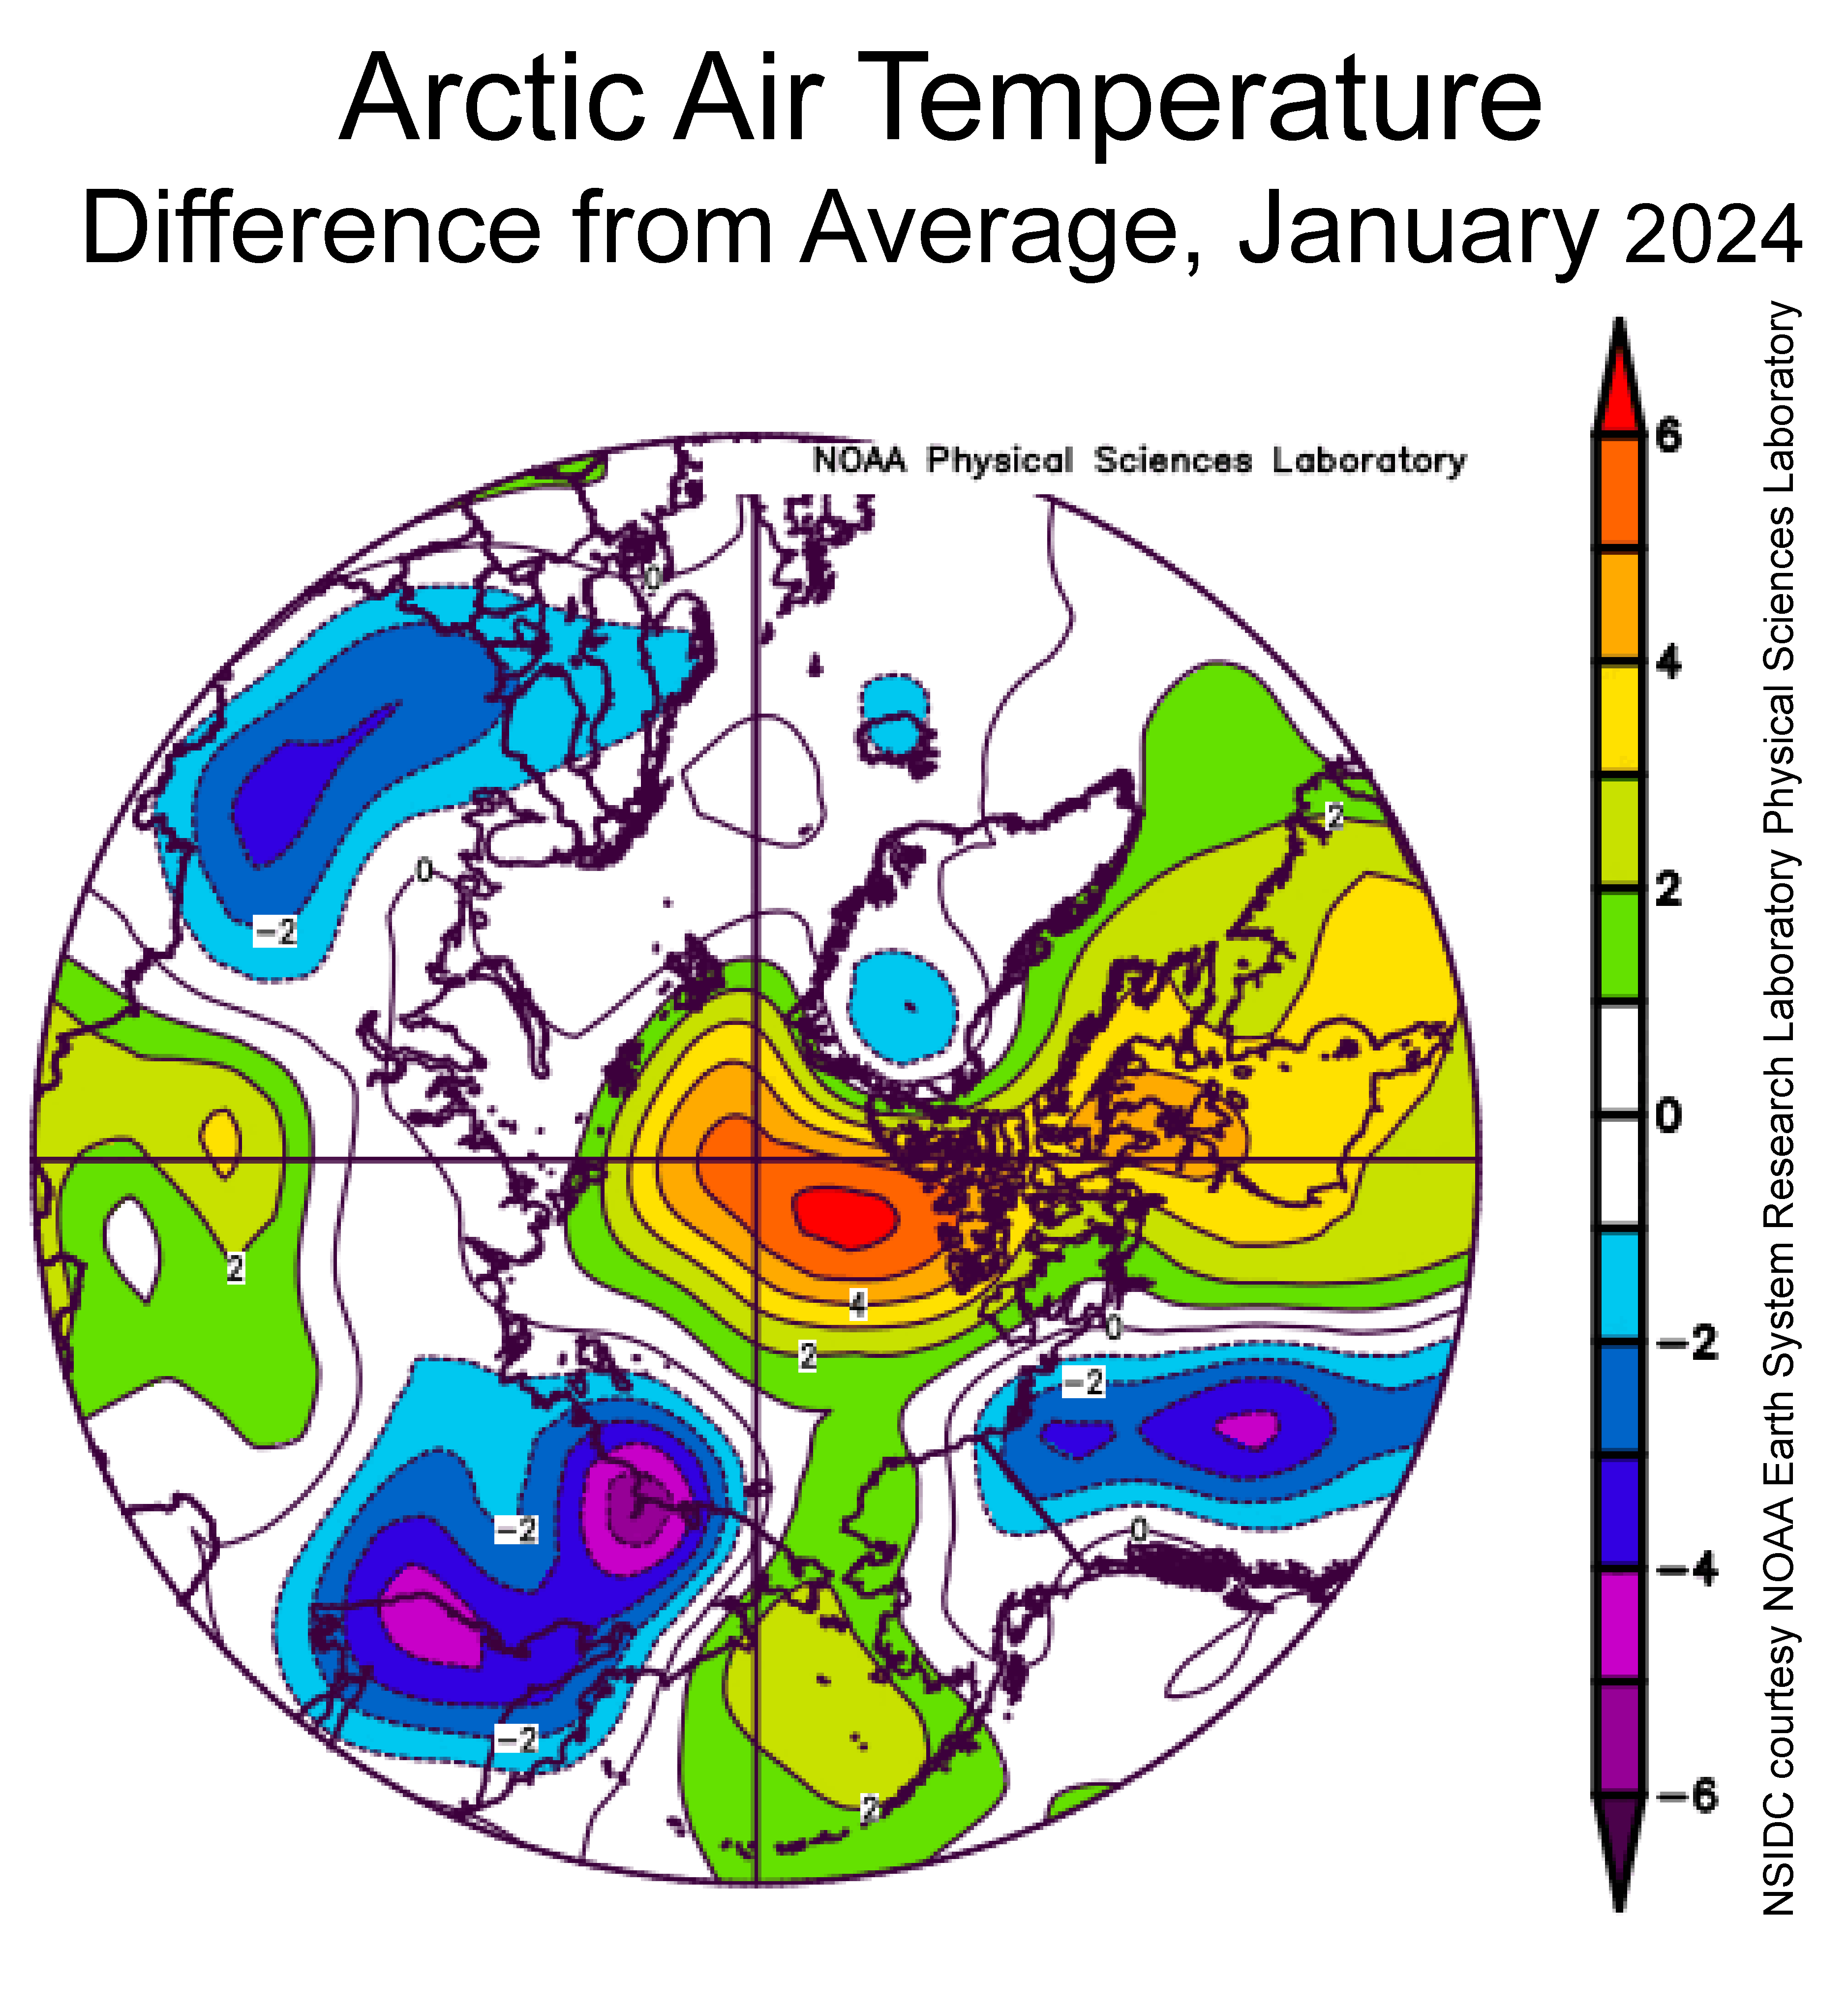
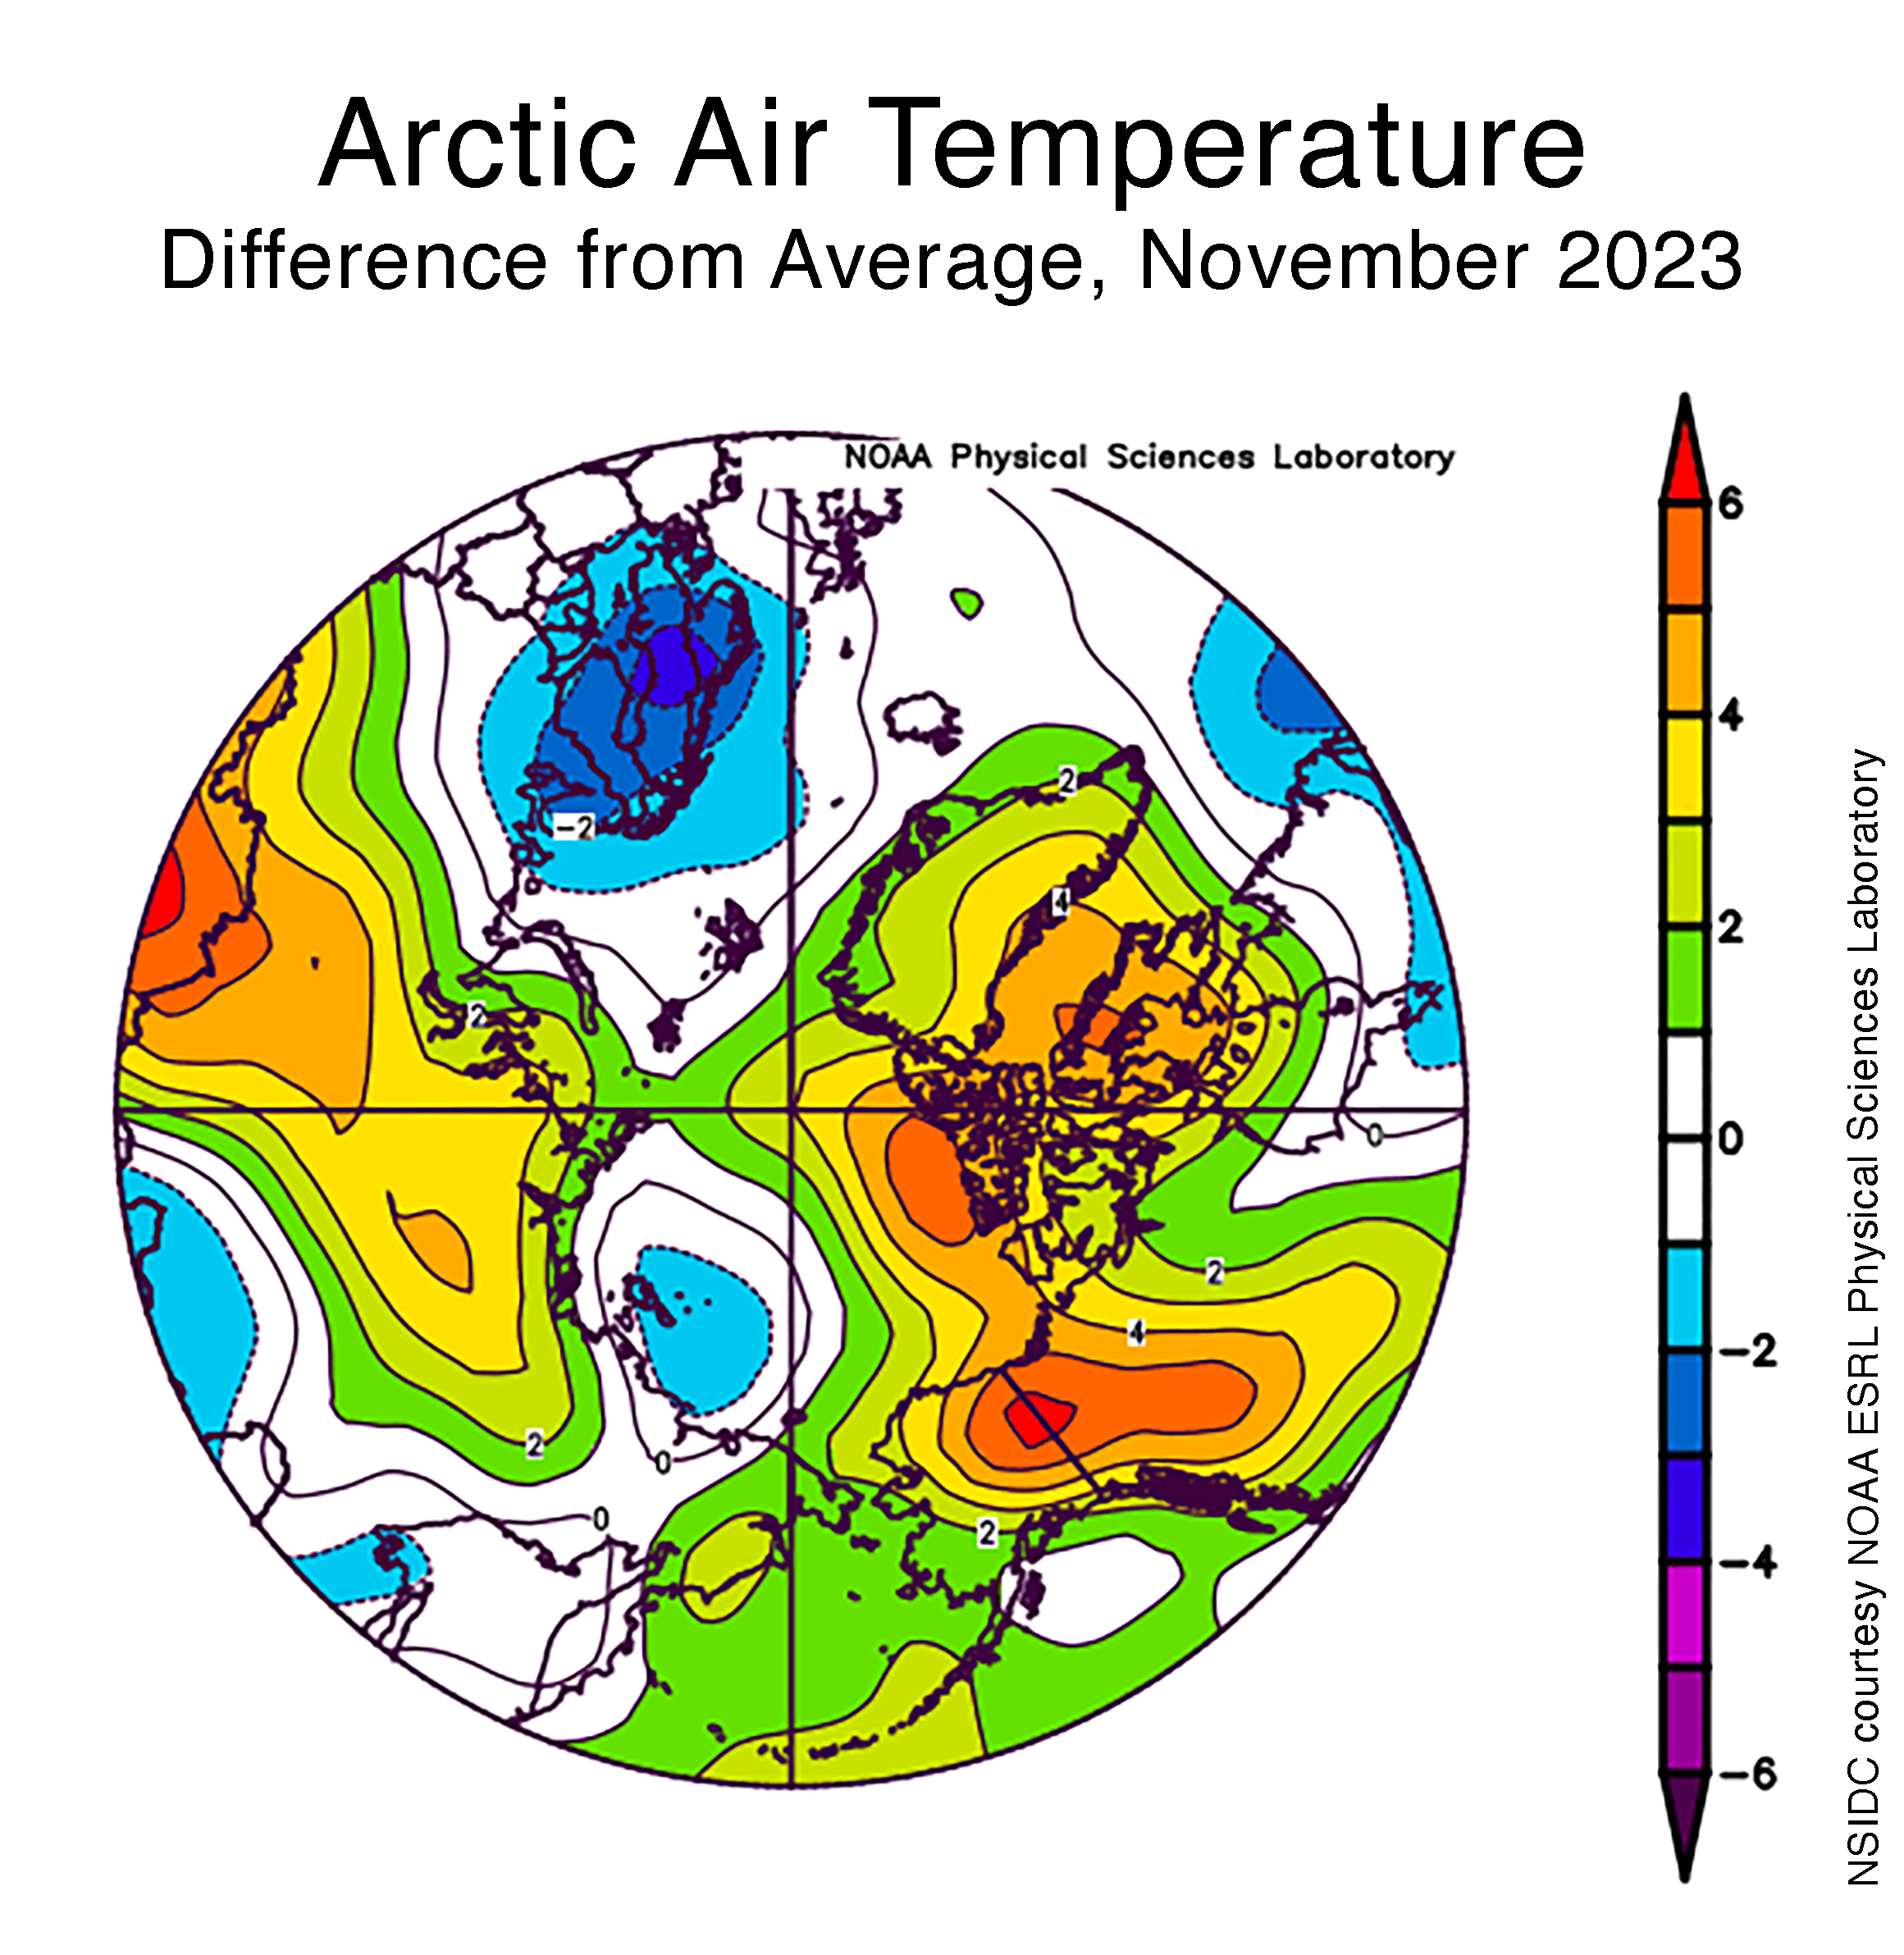
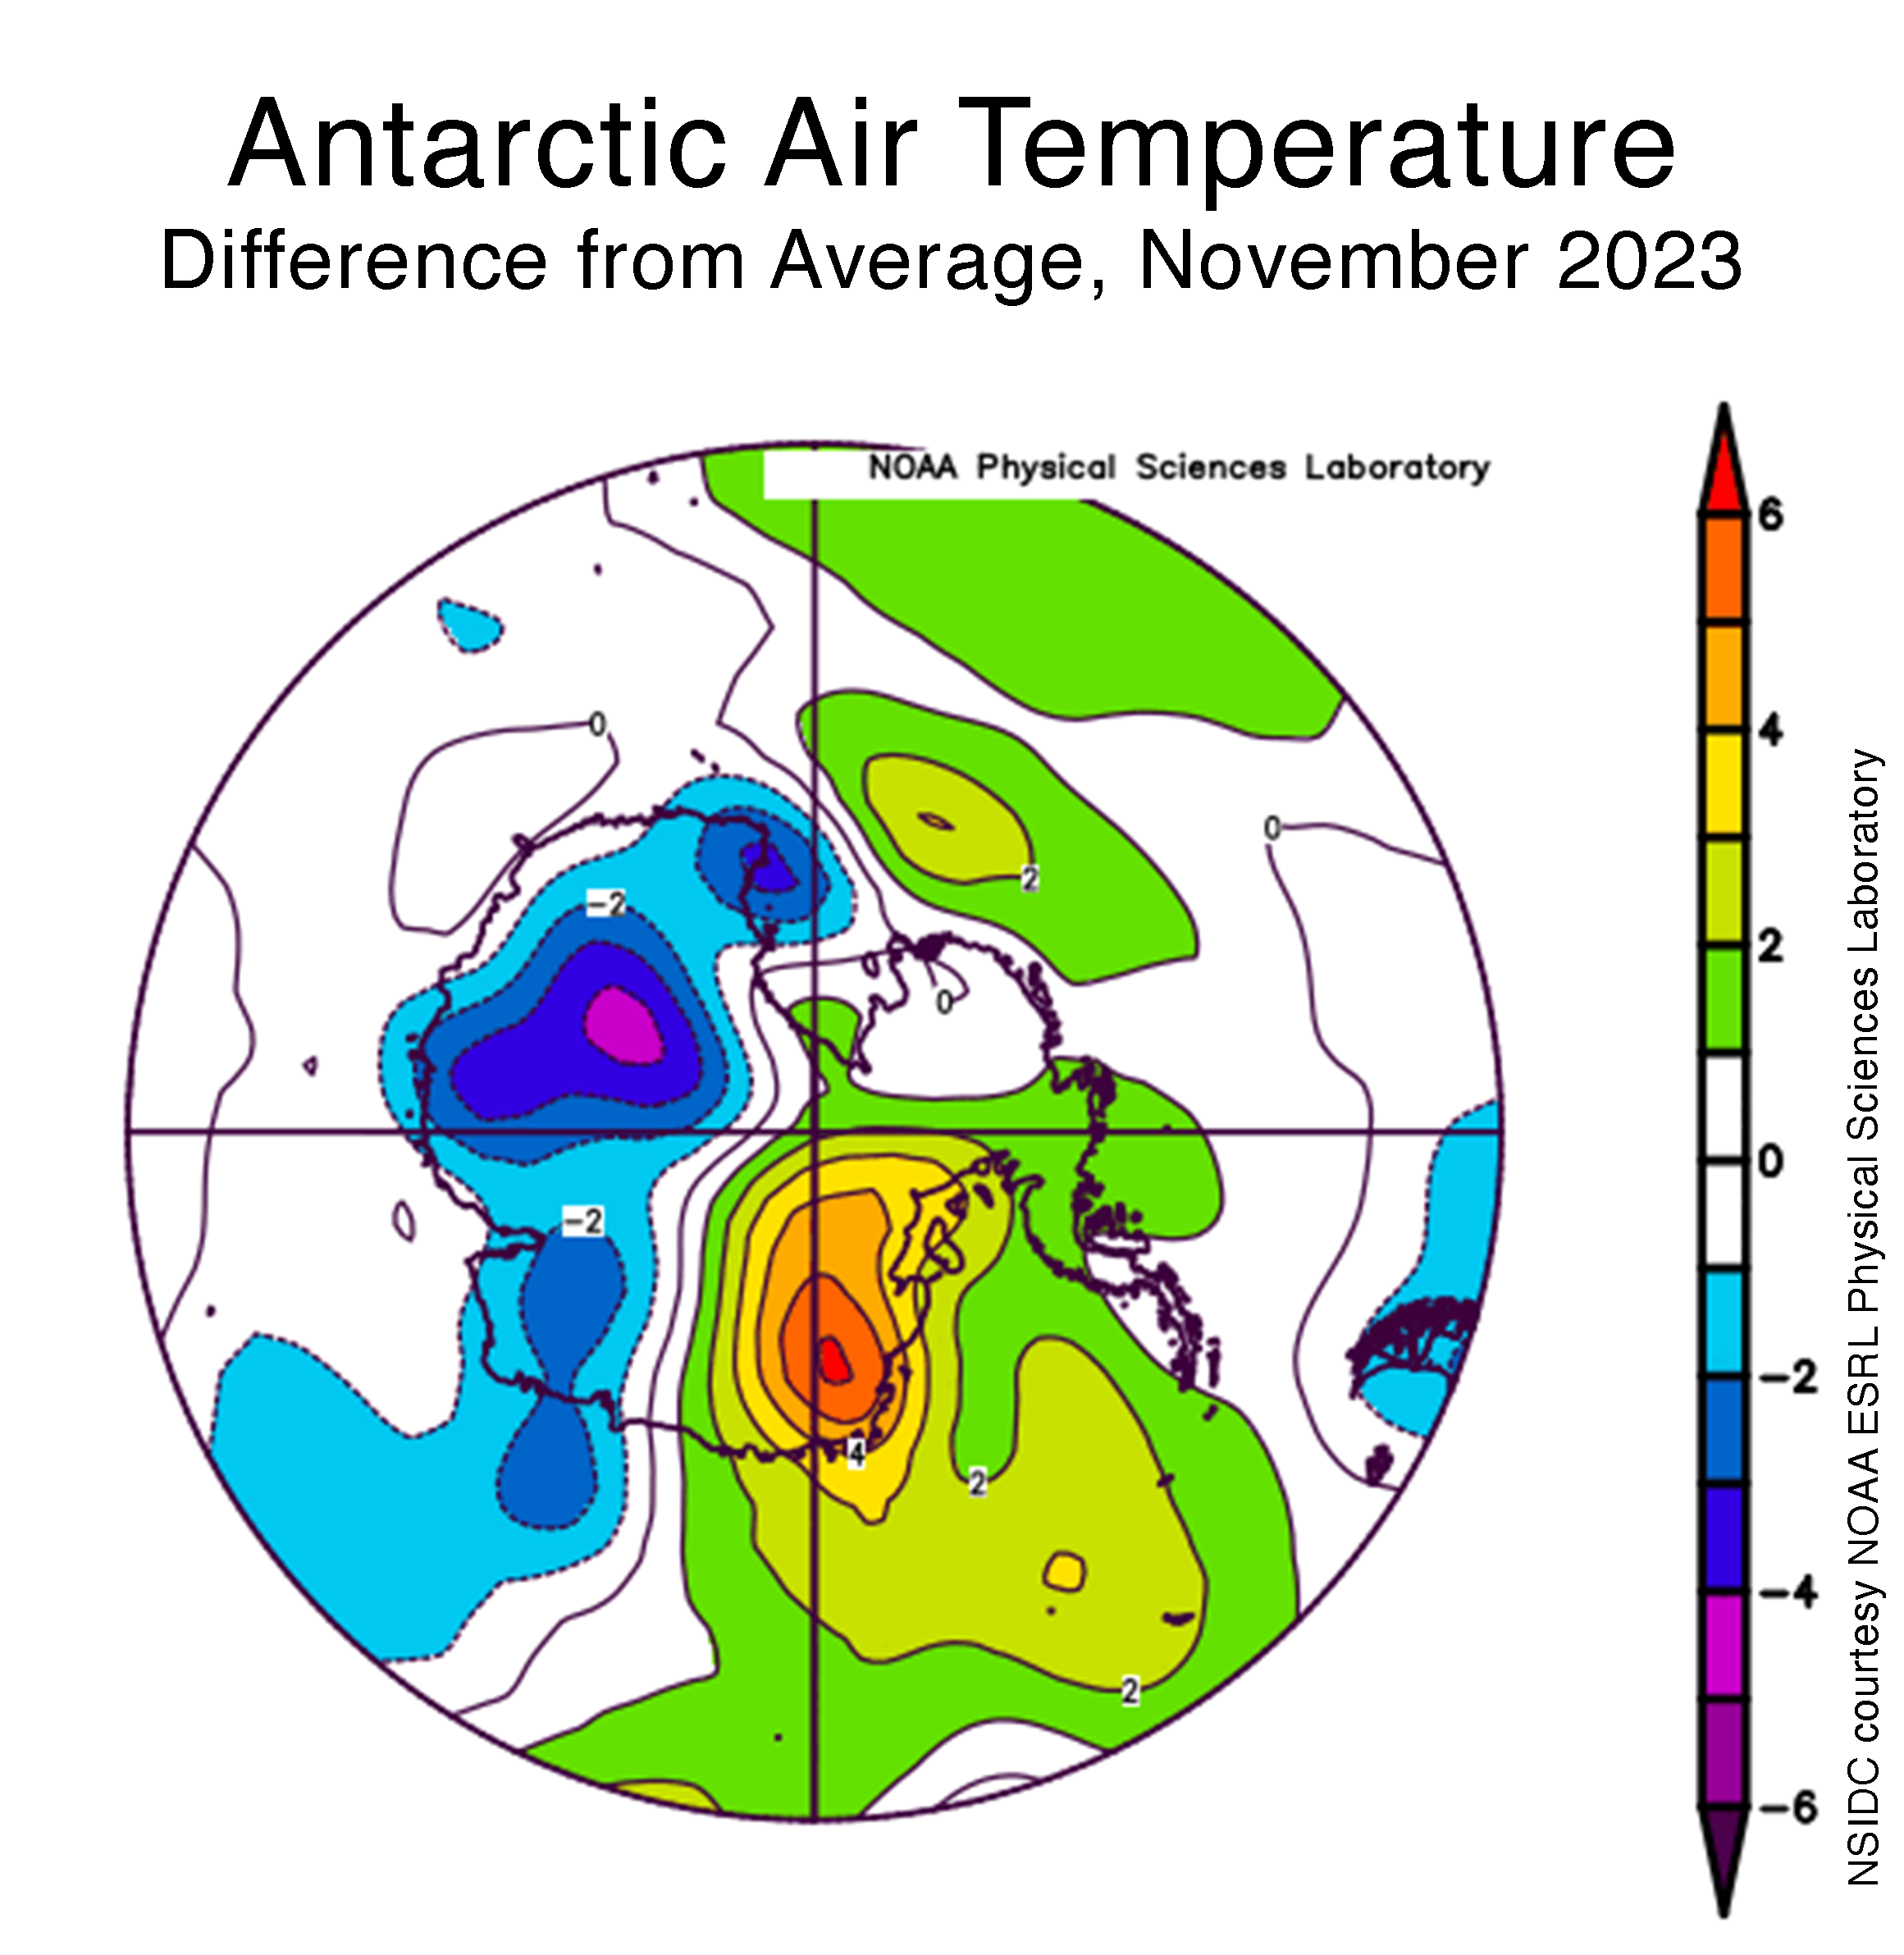
Figure 2a. This plot shows the departure from average air temperature in the Arctic at the 925 hPa level, in degrees Celsius, for September 2023. Yellows and reds indicate above average temperatures; blues and purples indicate below average temperatures.
Credit: NSIDC courtesy NOAA Earth System Research Laboratory Physical Sciences Laboratory
High-resolution image
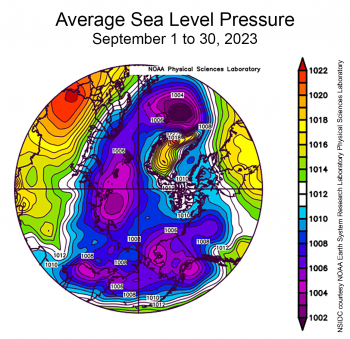
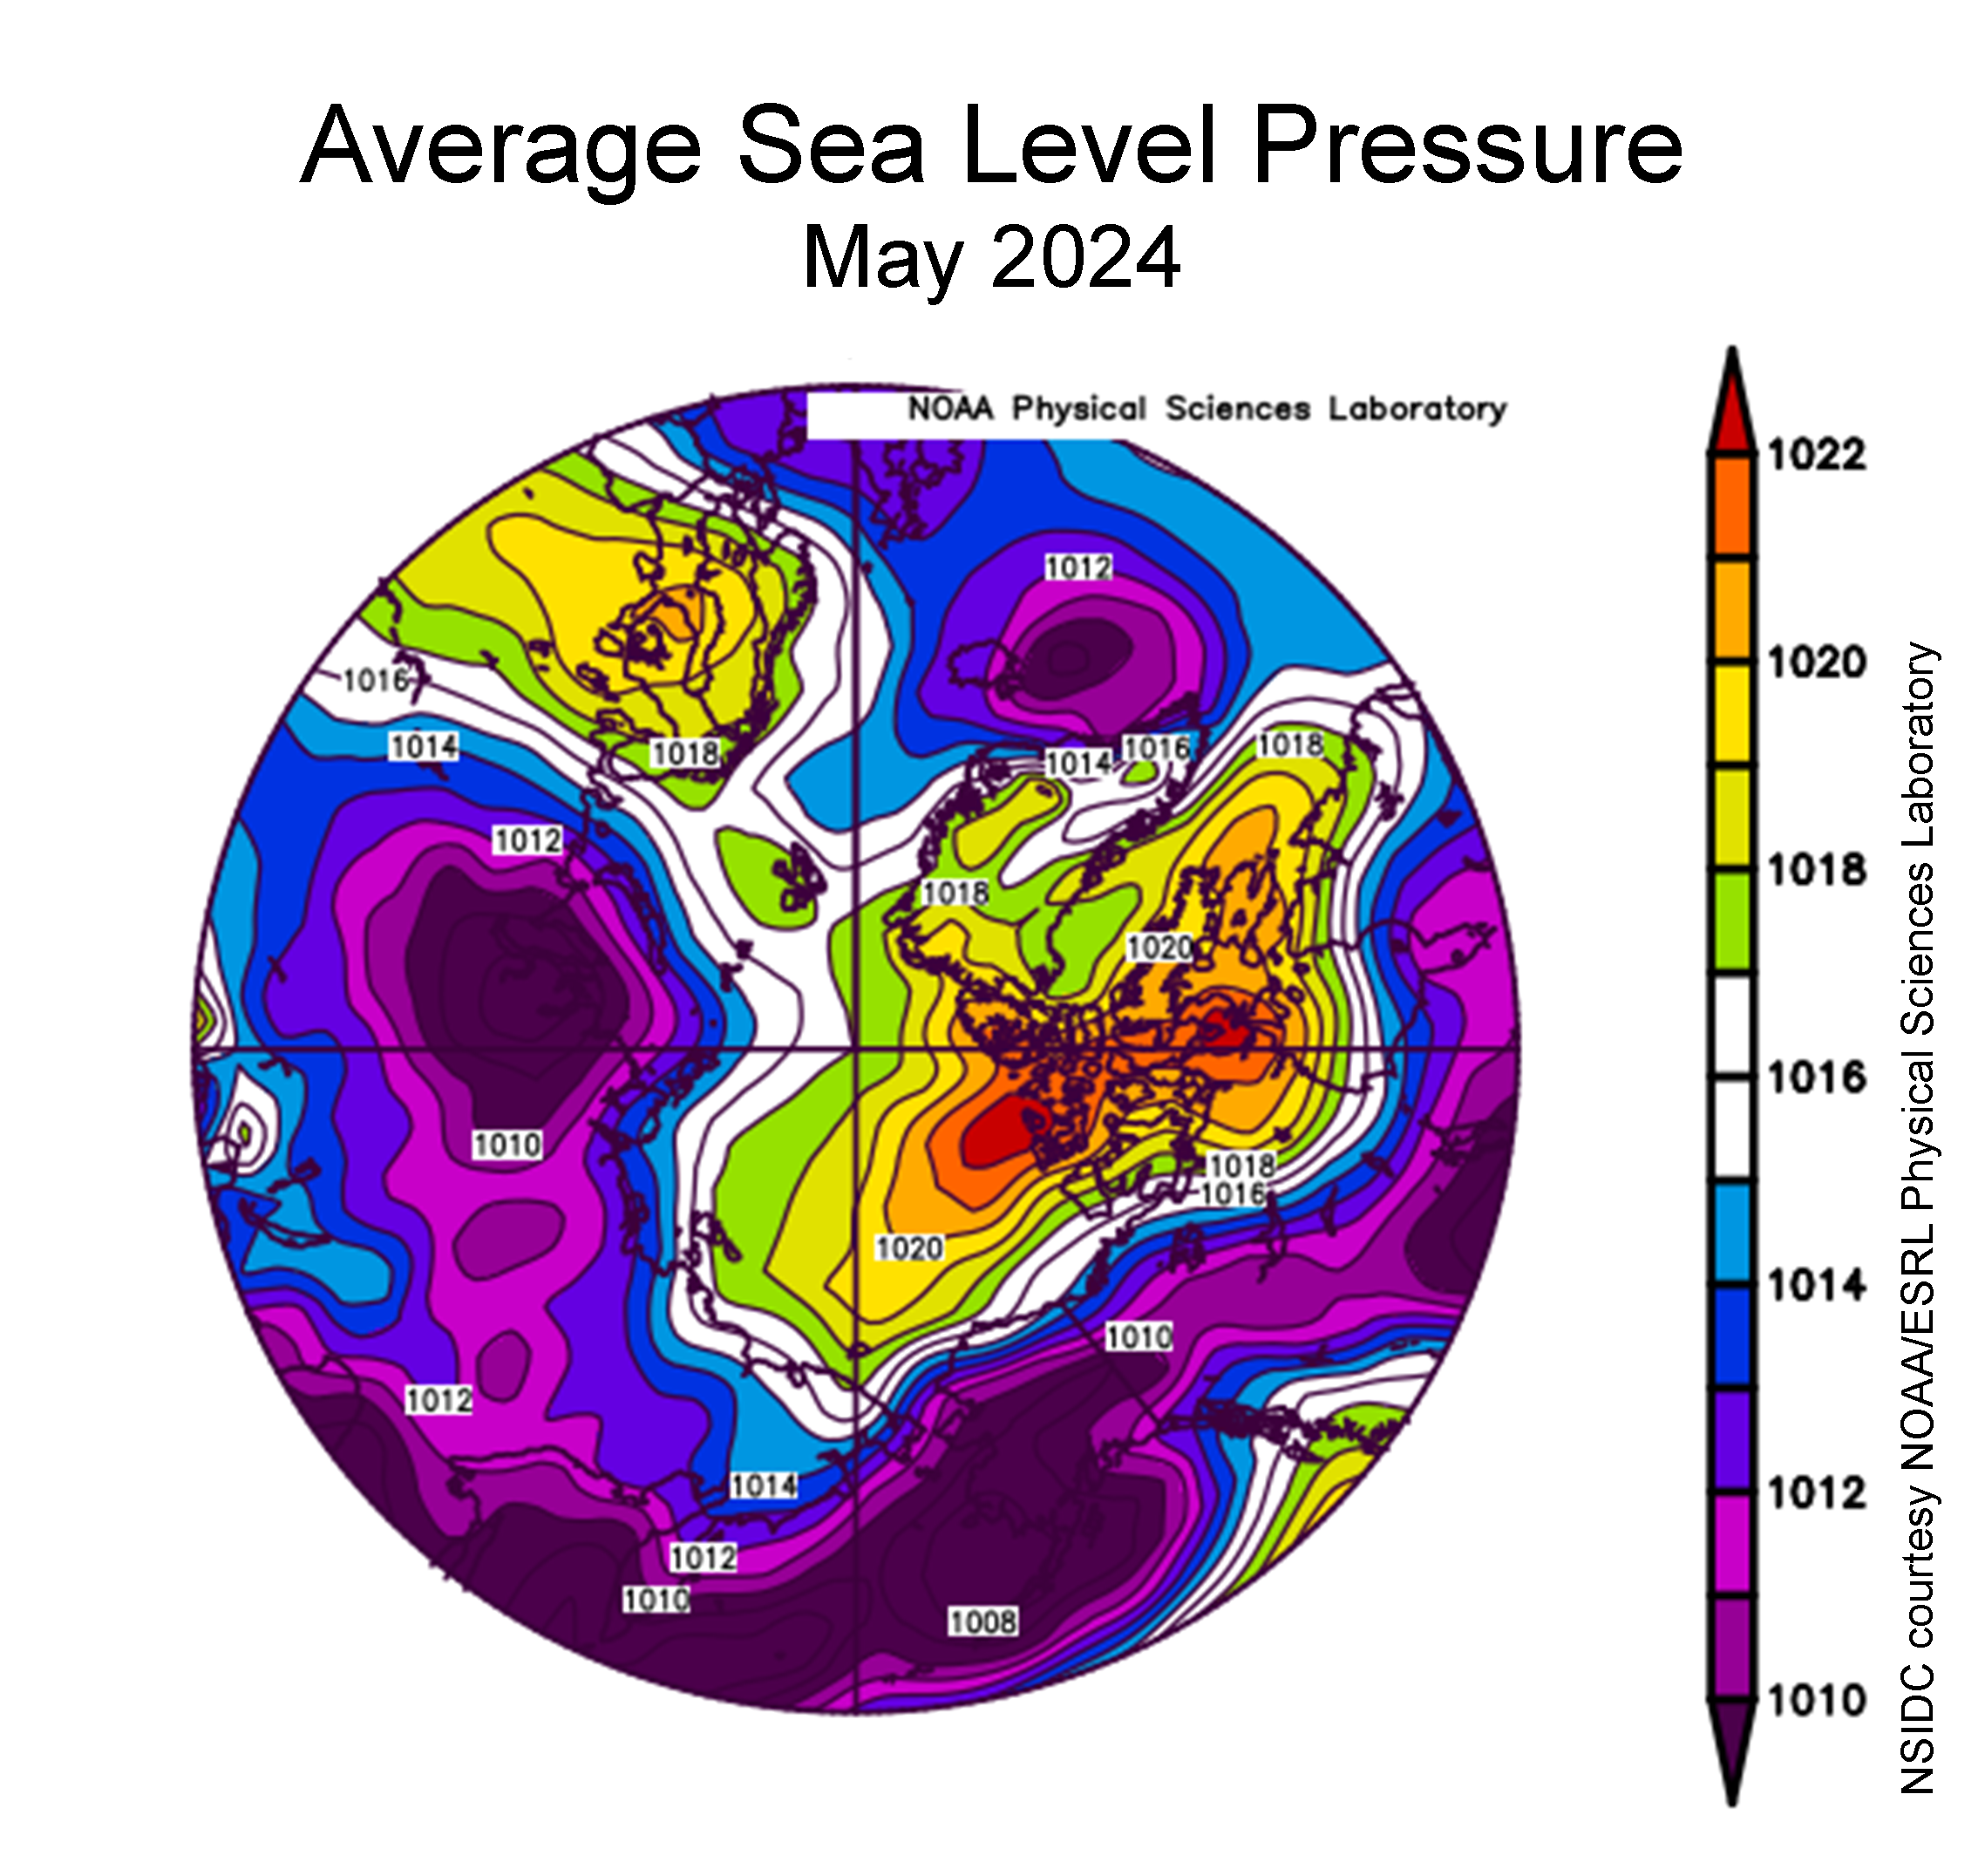
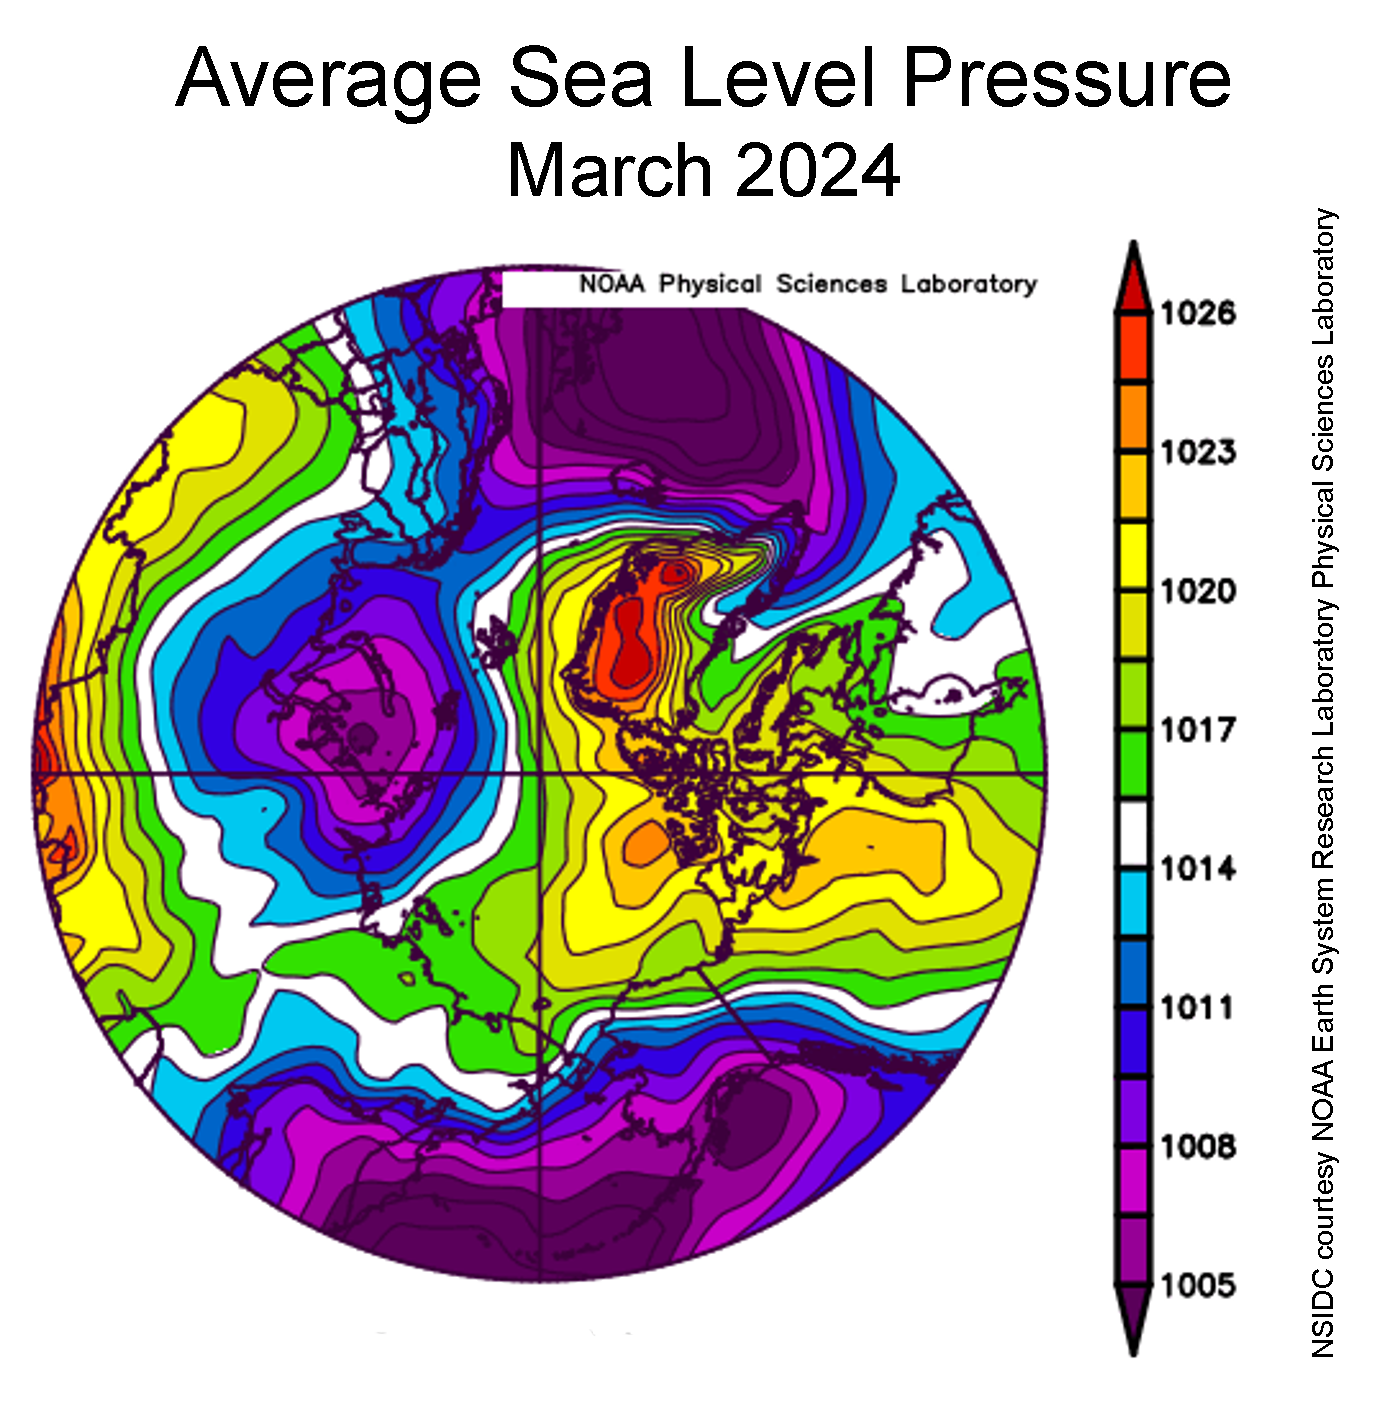
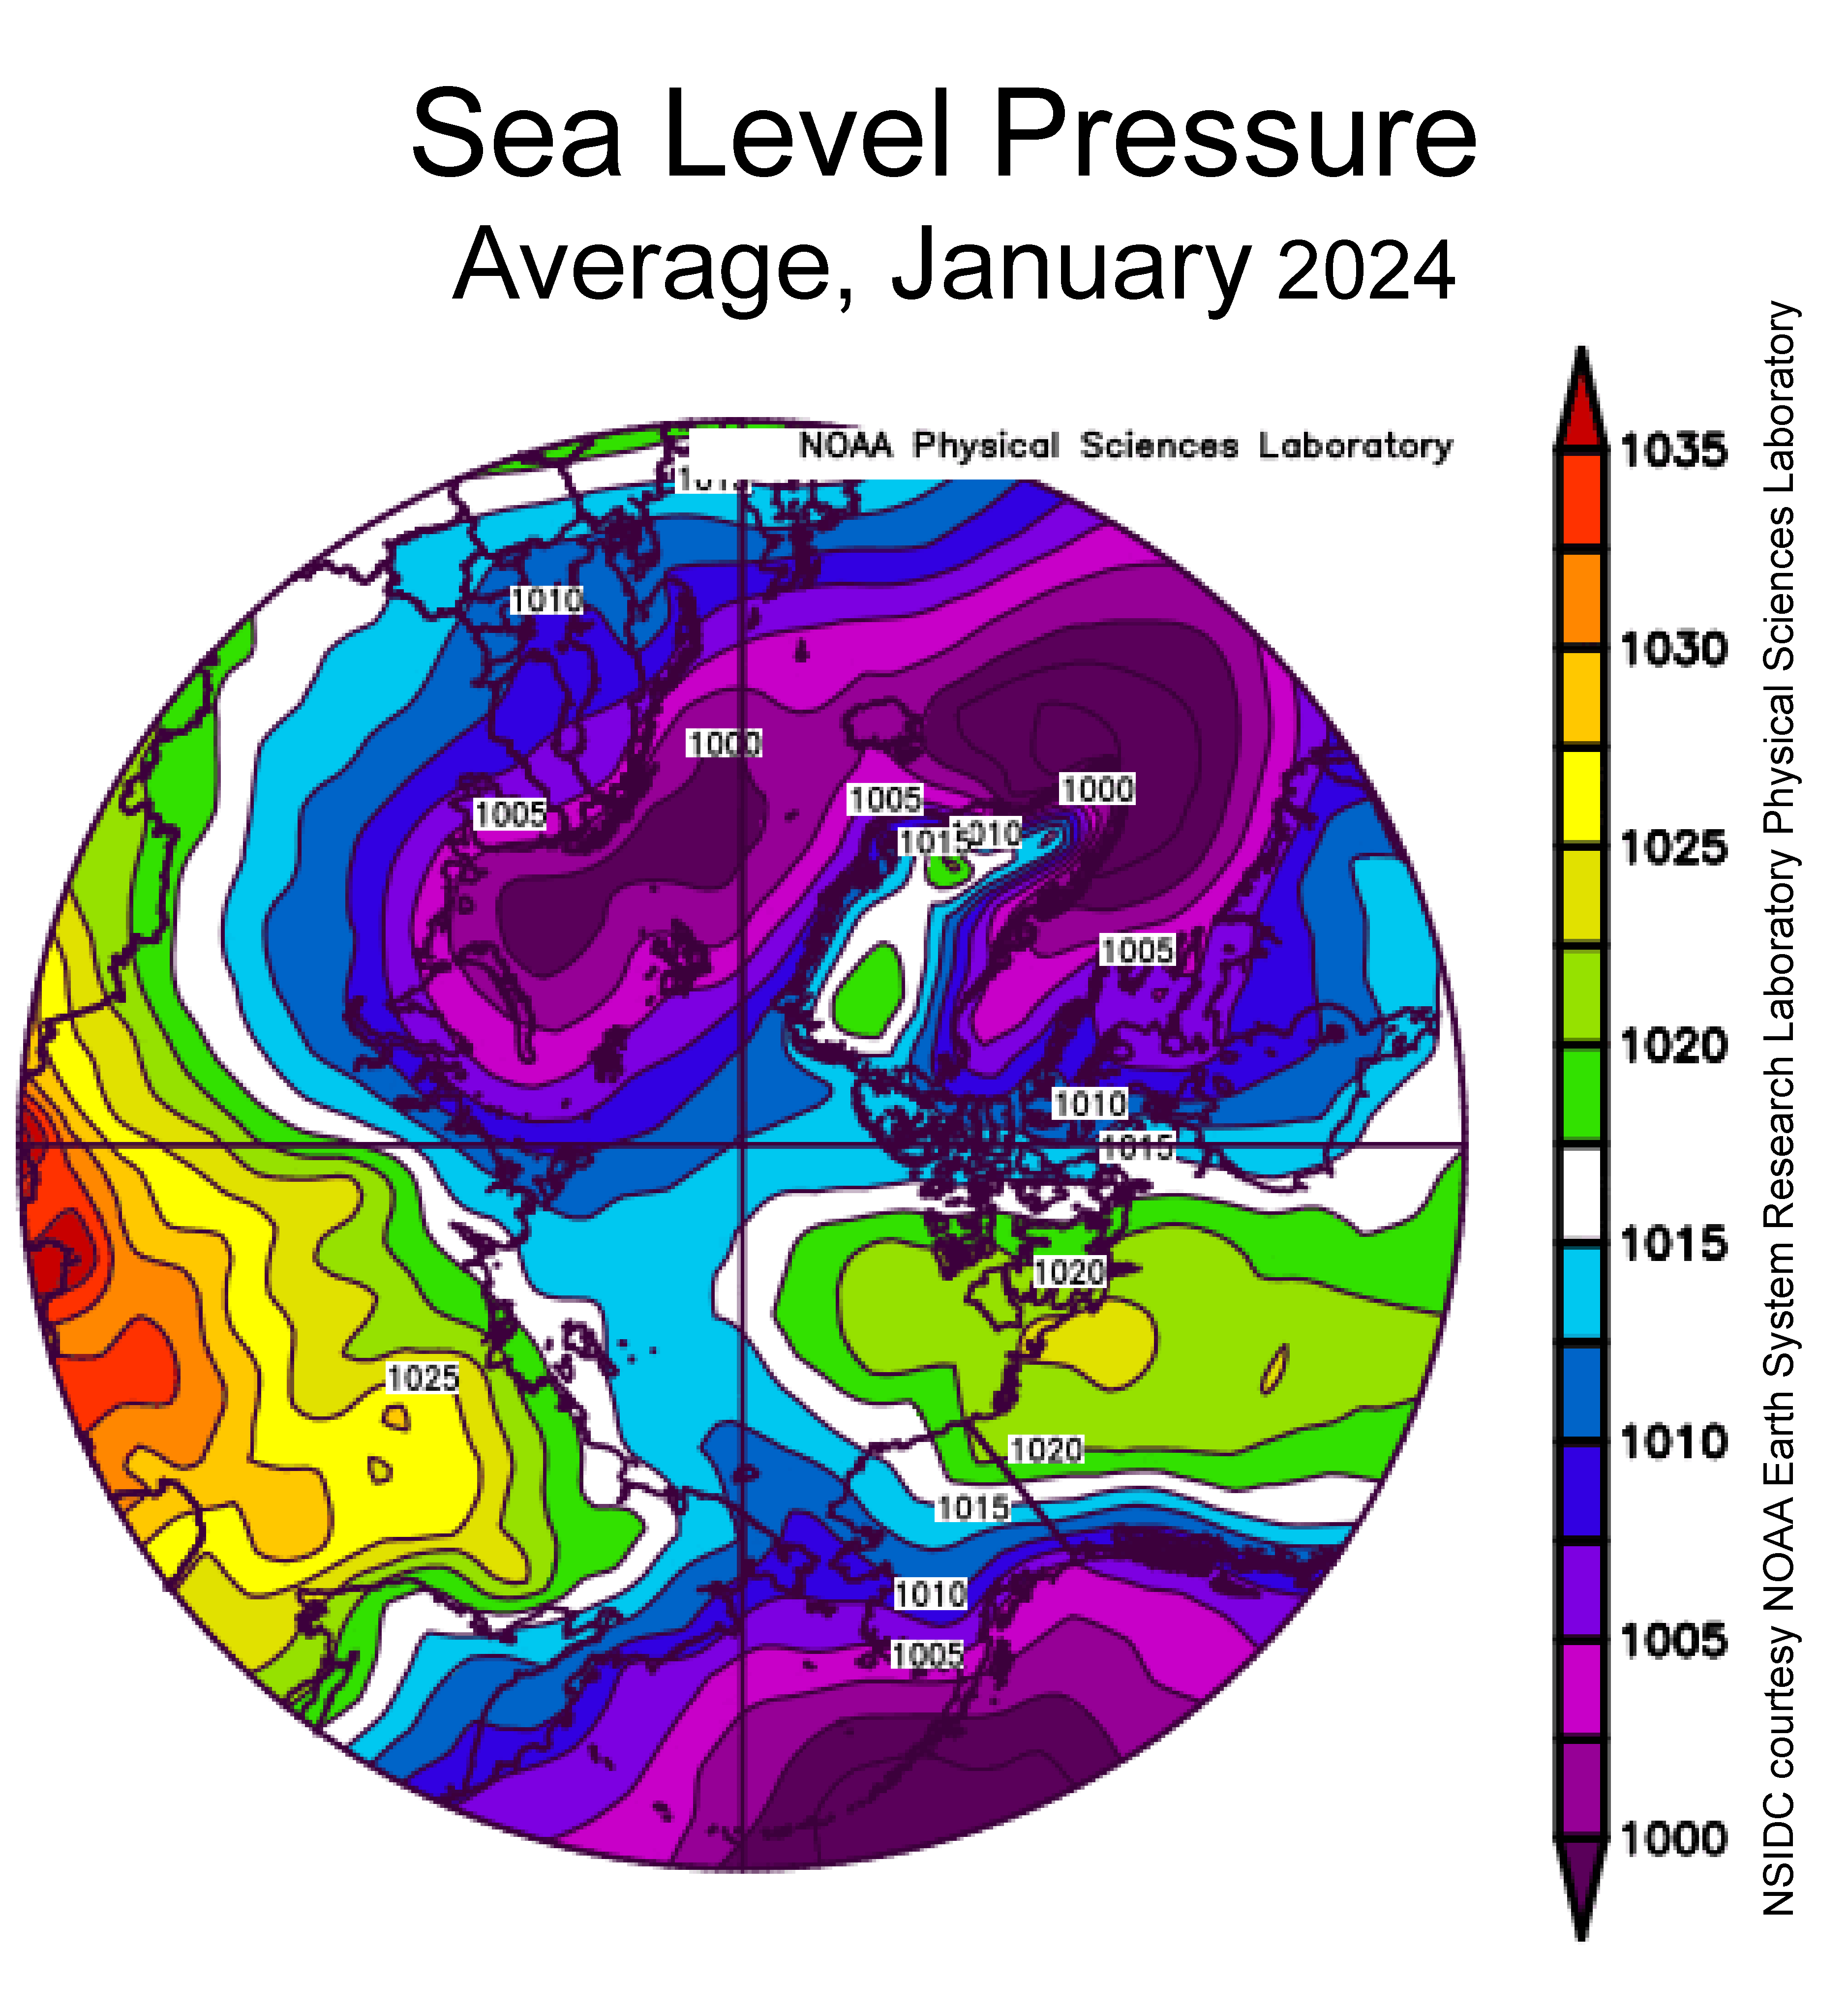
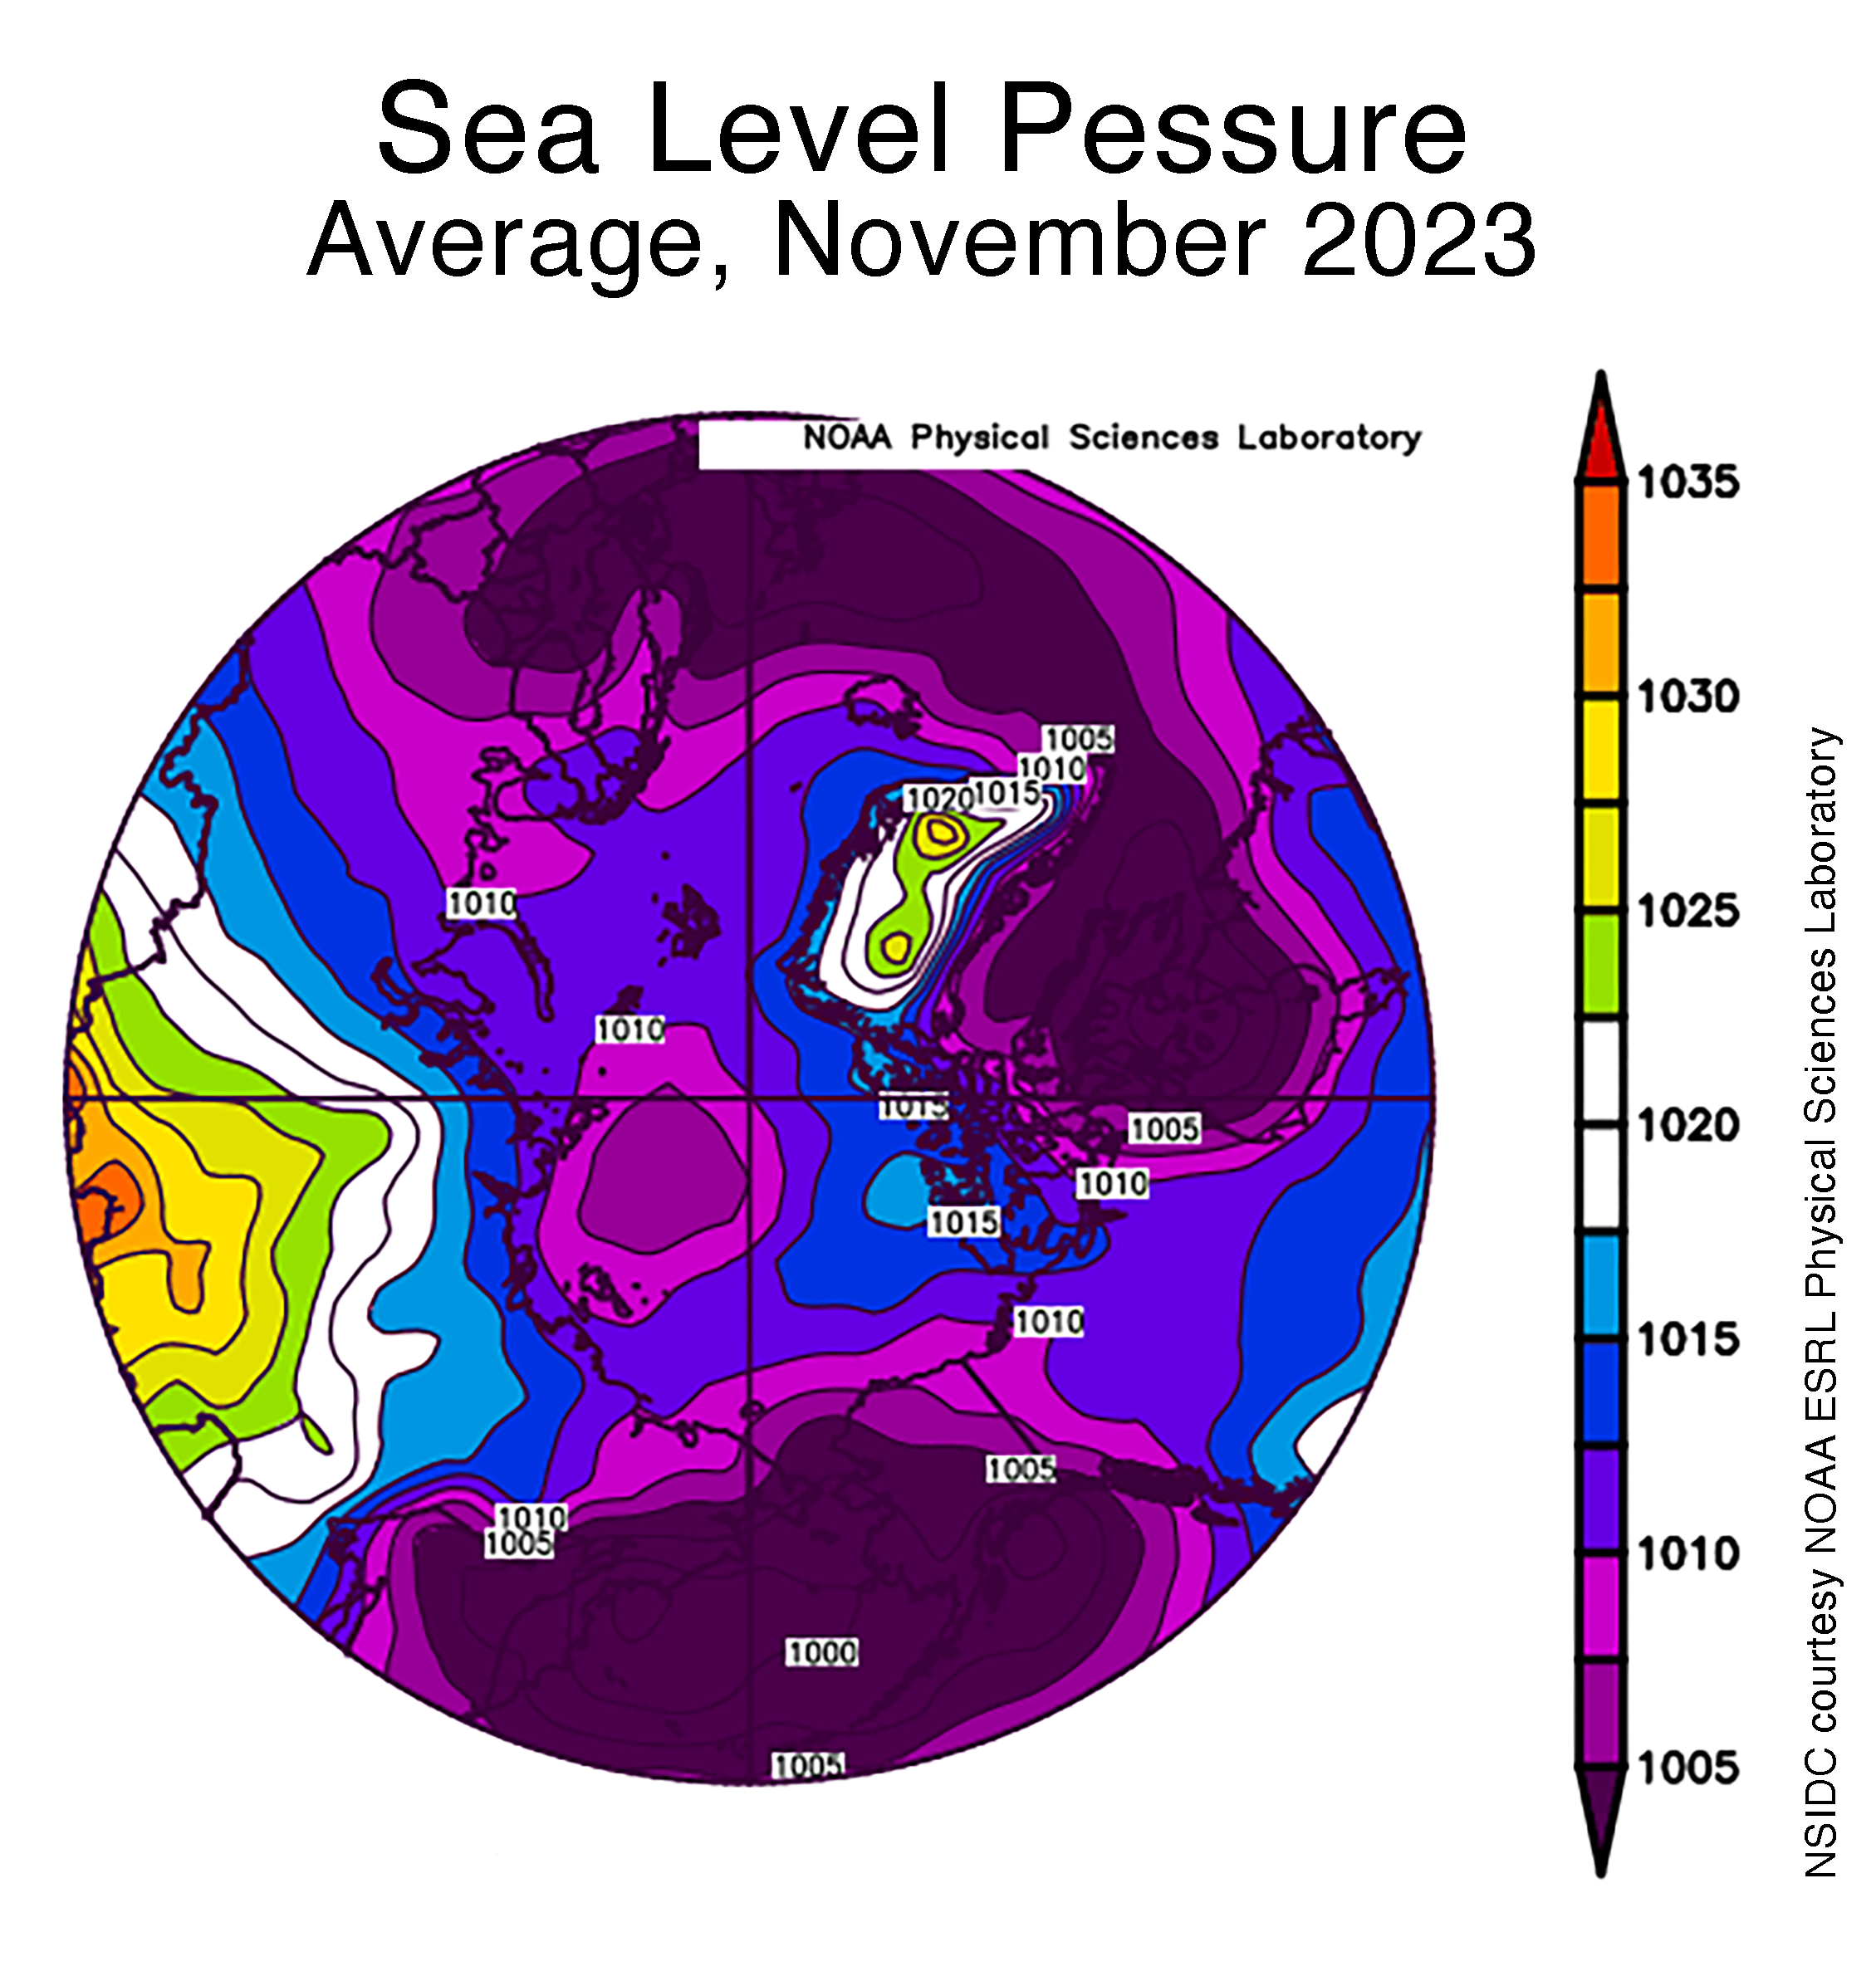
Figure 2b. This plot shows average sea level pressure in the Arctic in millibars for September 2023. Yellows and reds indicate high air pressure; blues and purples indicate low pressure.
Credit: NSIDC courtesy NOAA Earth System Research Laboratory Physical Sciences Laboratory
High-resolution image
Air temperatures at the 925 hPa level (approximately 2,500 feet above the surface) for September were modestly above average, with temperatures 1 to 3 degrees Celsius (2 to 5 degrees Fahrenheit) over most of the Arctic Ocean (Figure 2a). Warm conditions prevailed in the ice-free Norwegian, Barents, and Kara Seas. Over land, Canada and northwestern Eurasia experienced warm conditions, as much at 5 degrees Celsius (9 degrees Fahrenheit) above average.
The atmospheric circulation for September was characterized by fairly low pressure over most of the Arctic Ocean, notably north of the Barents and Laptev Seas and east of Greenland (Figure 2b). Over land, high pressure prevailed over Eurasia and eastern Canada.
September 2023 compared to other years
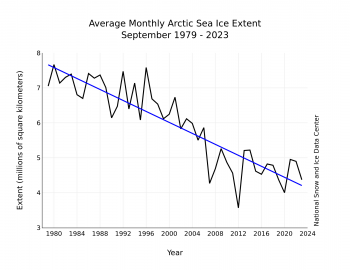
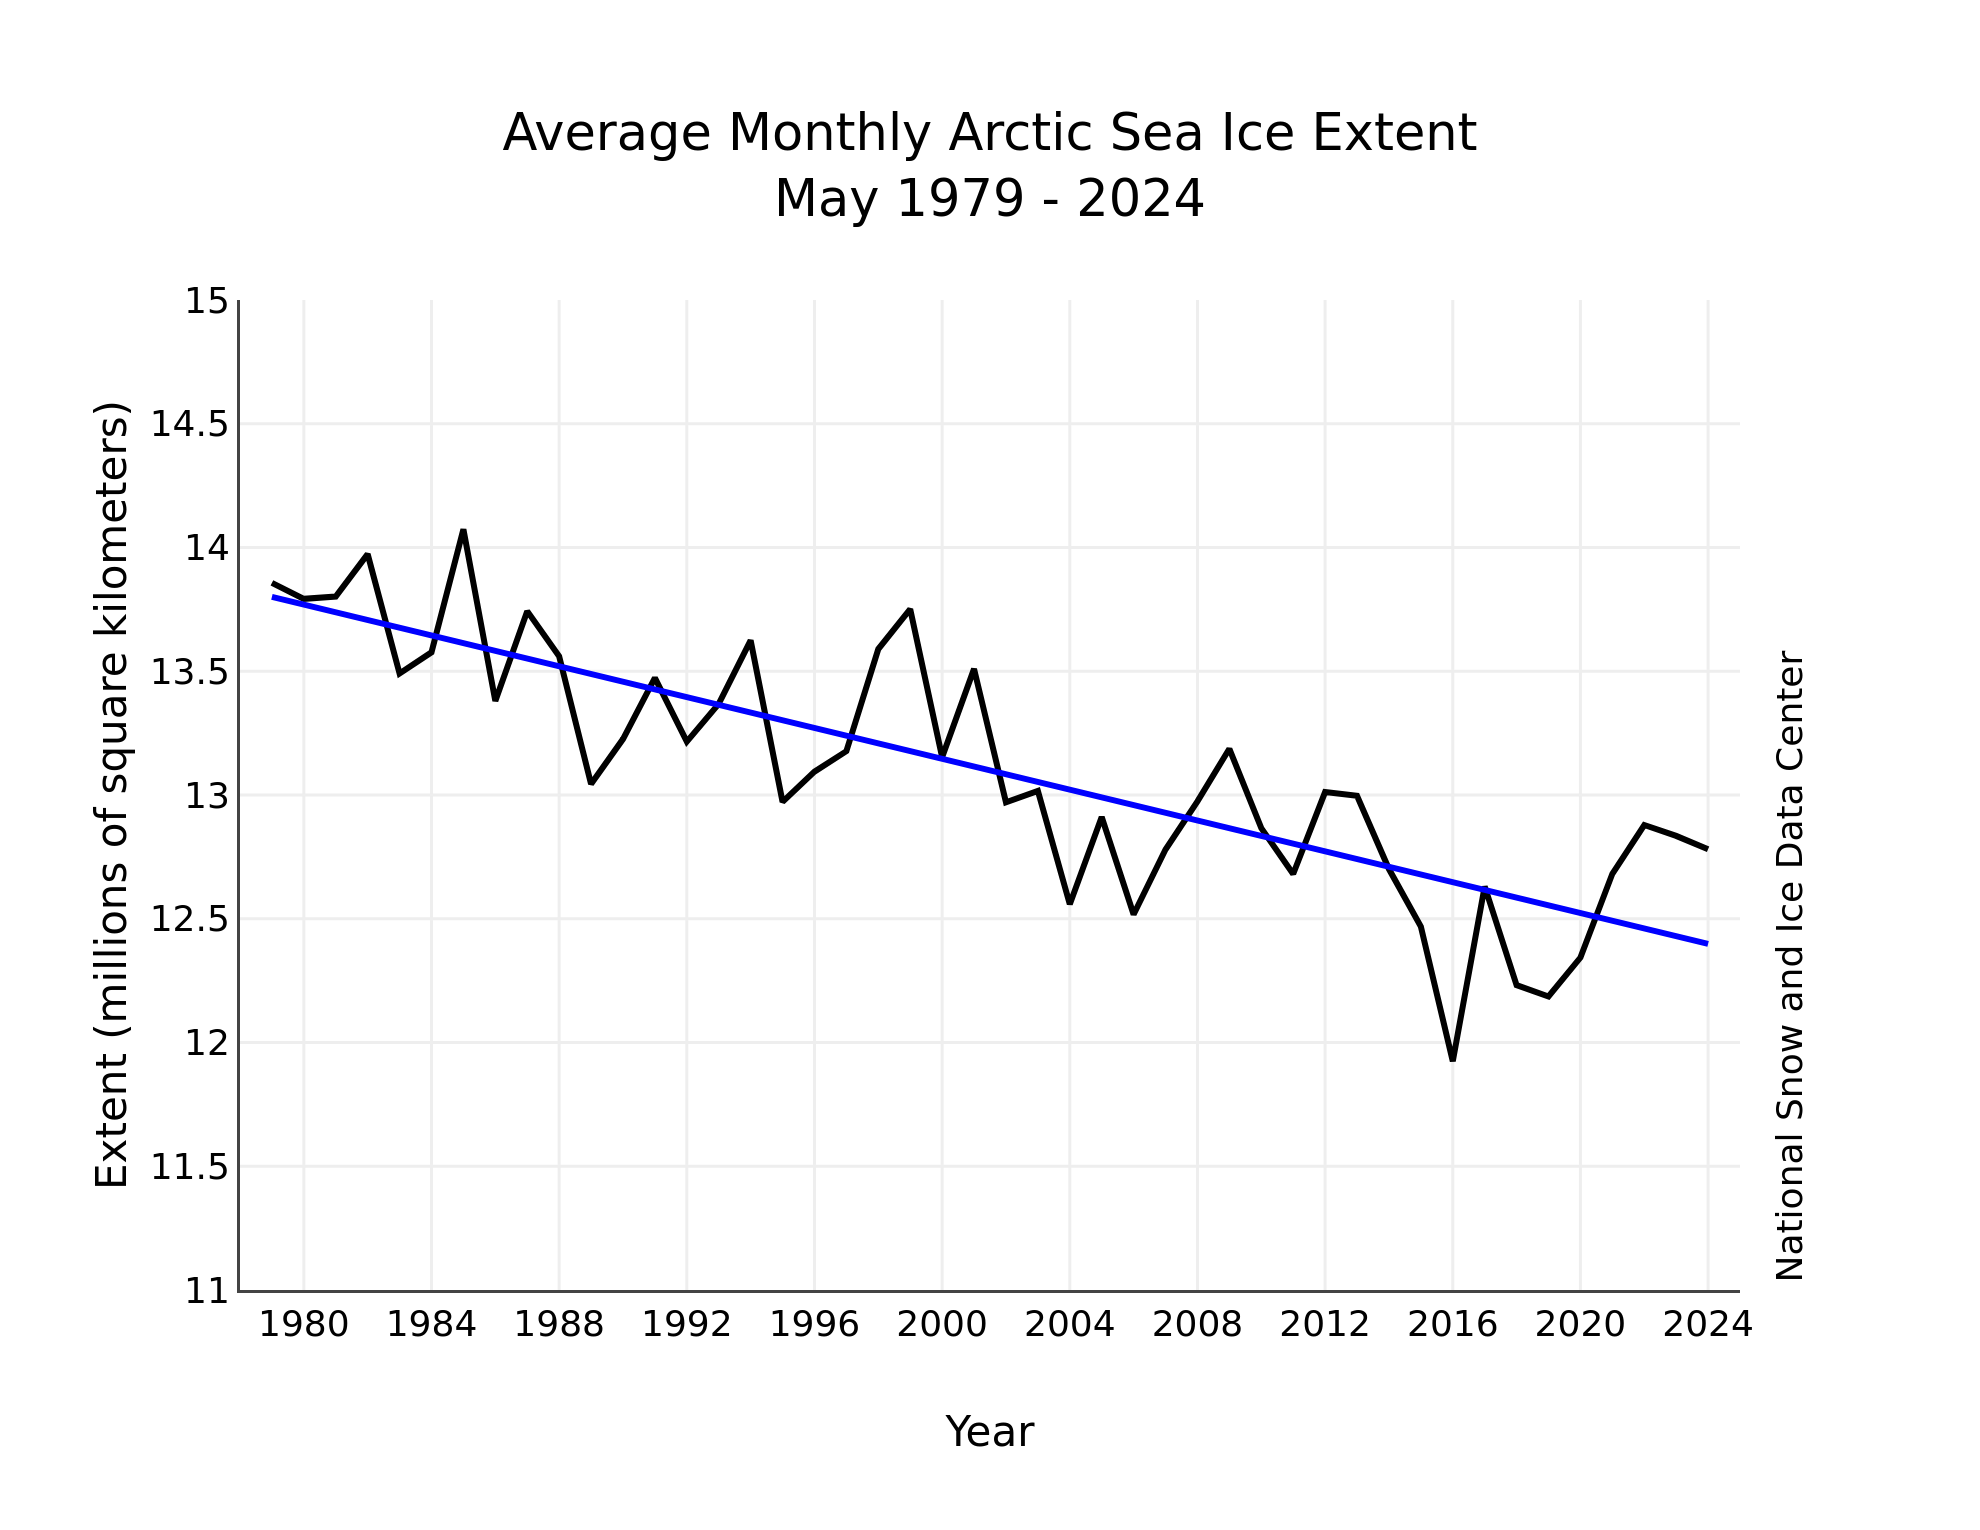
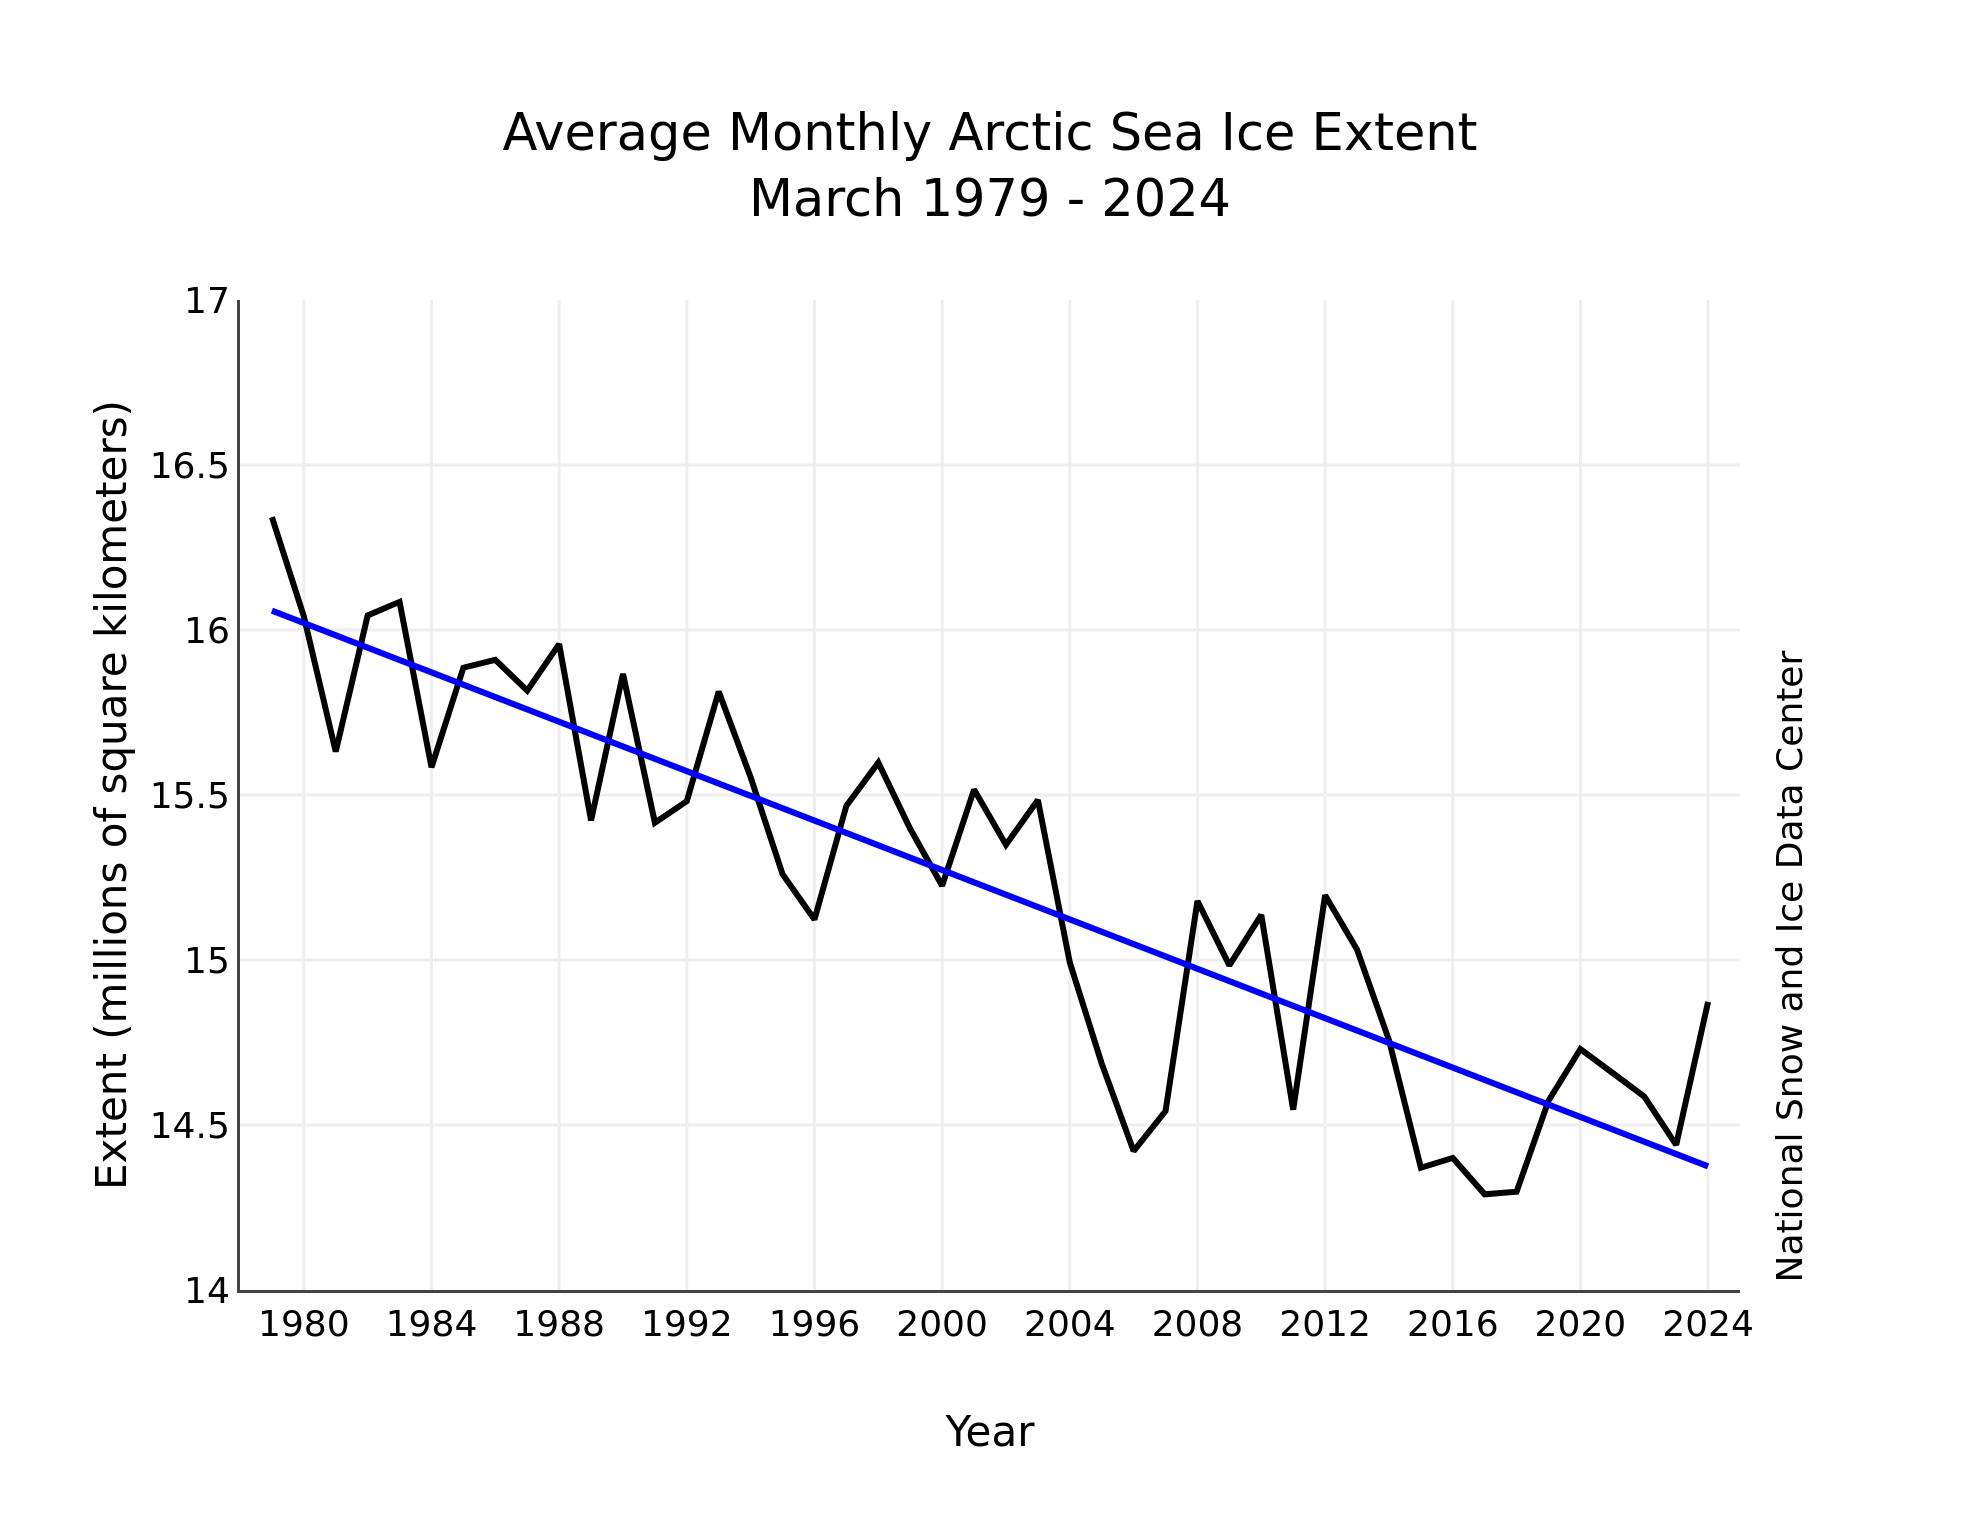
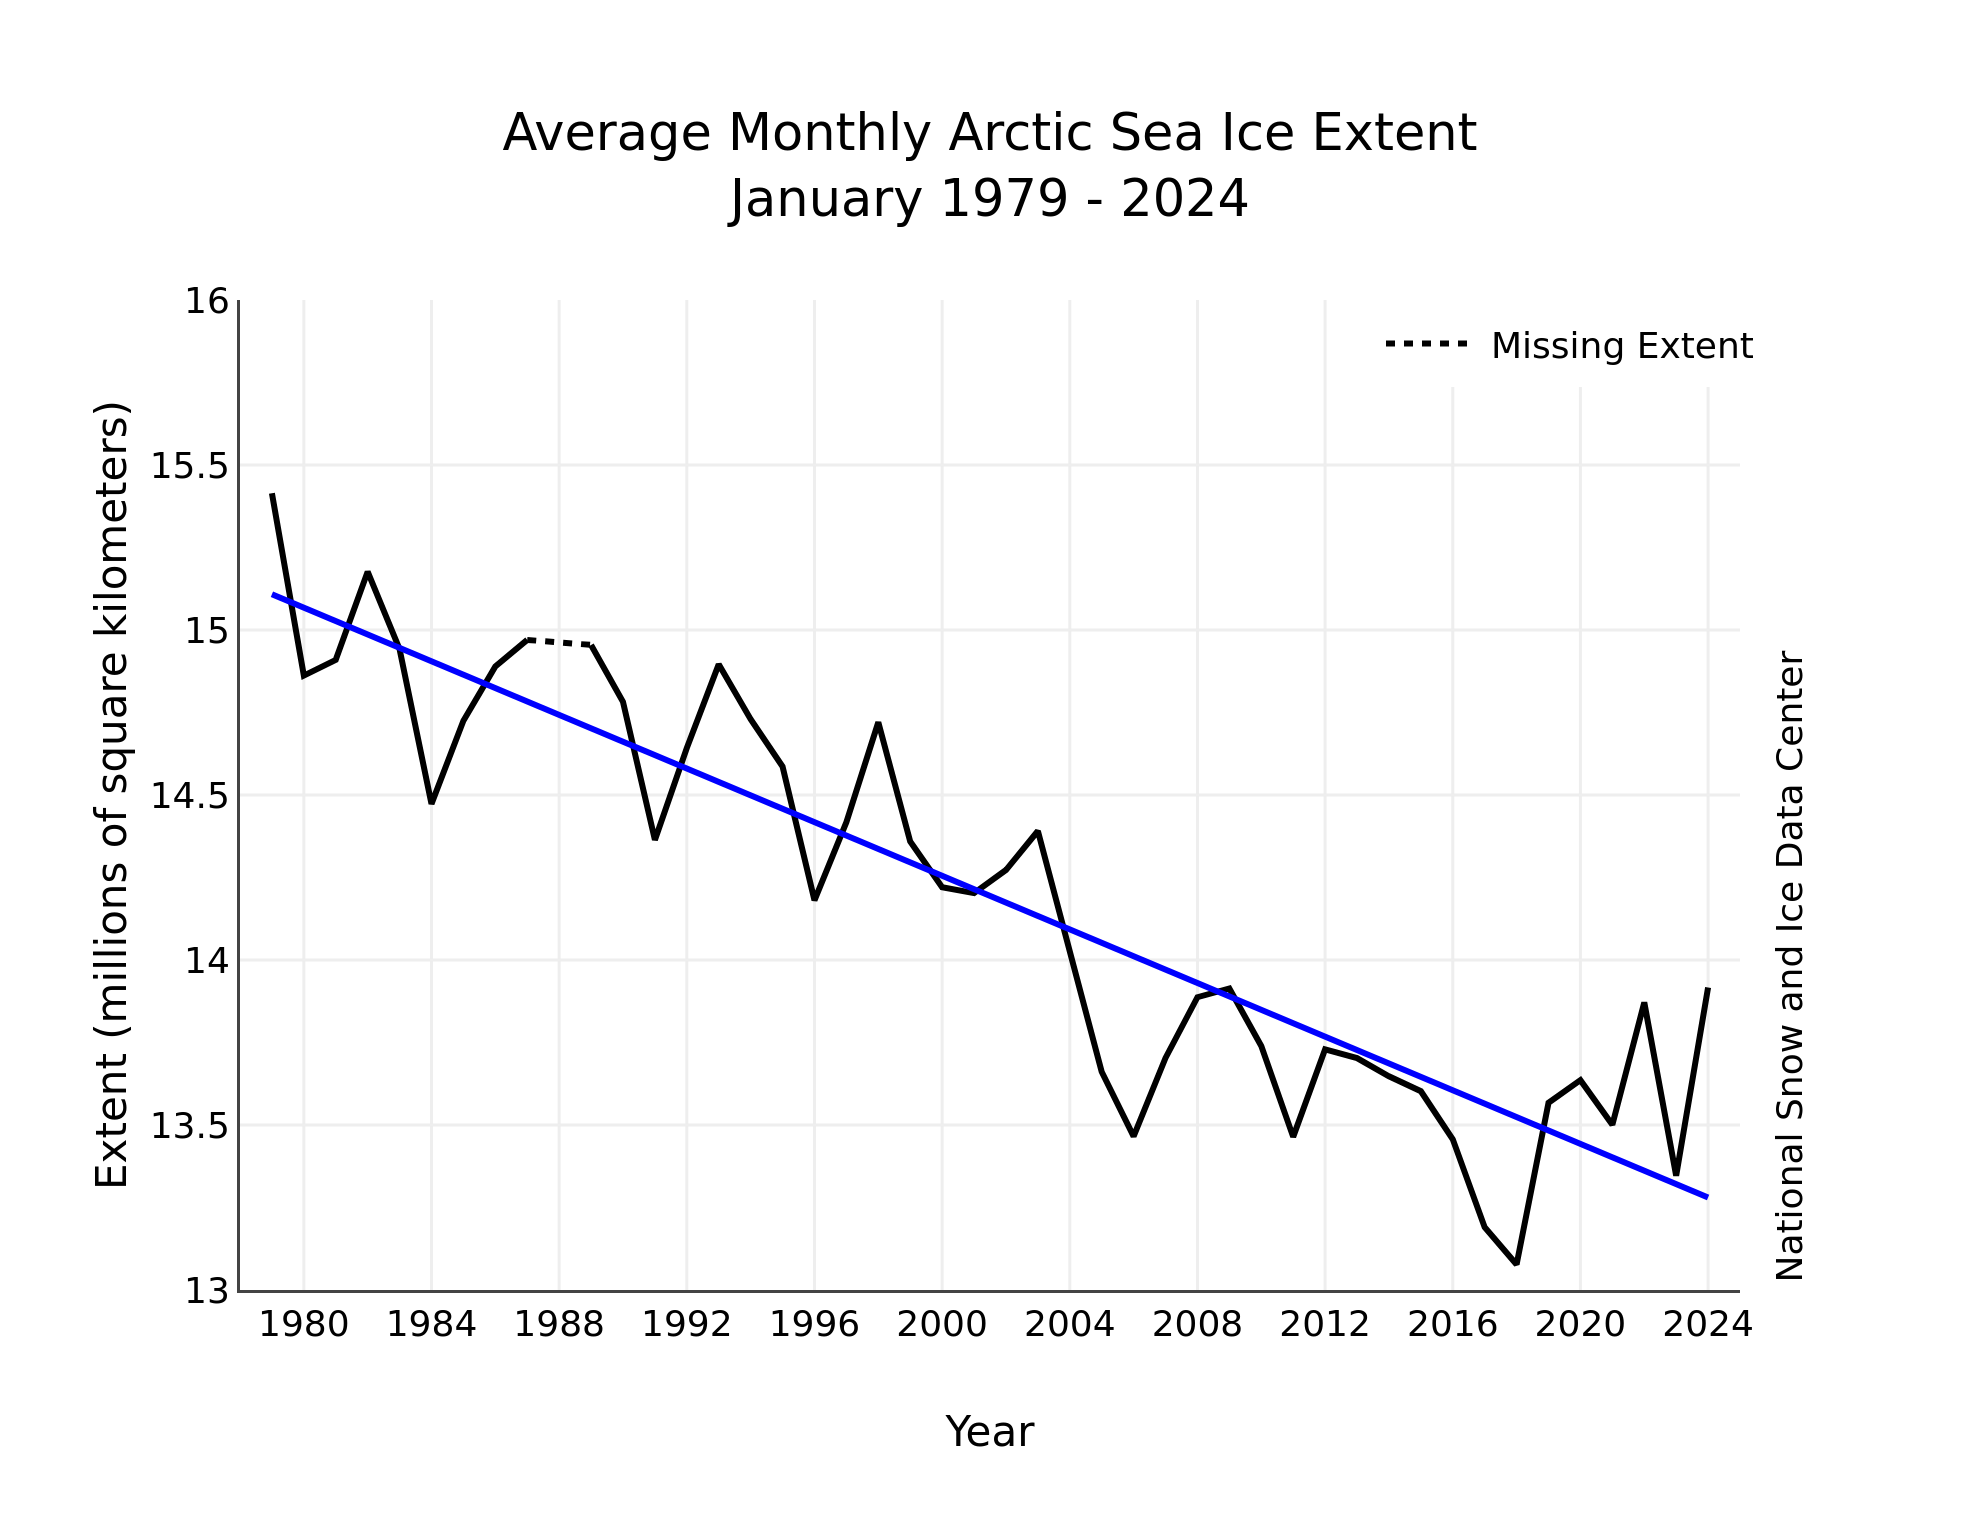
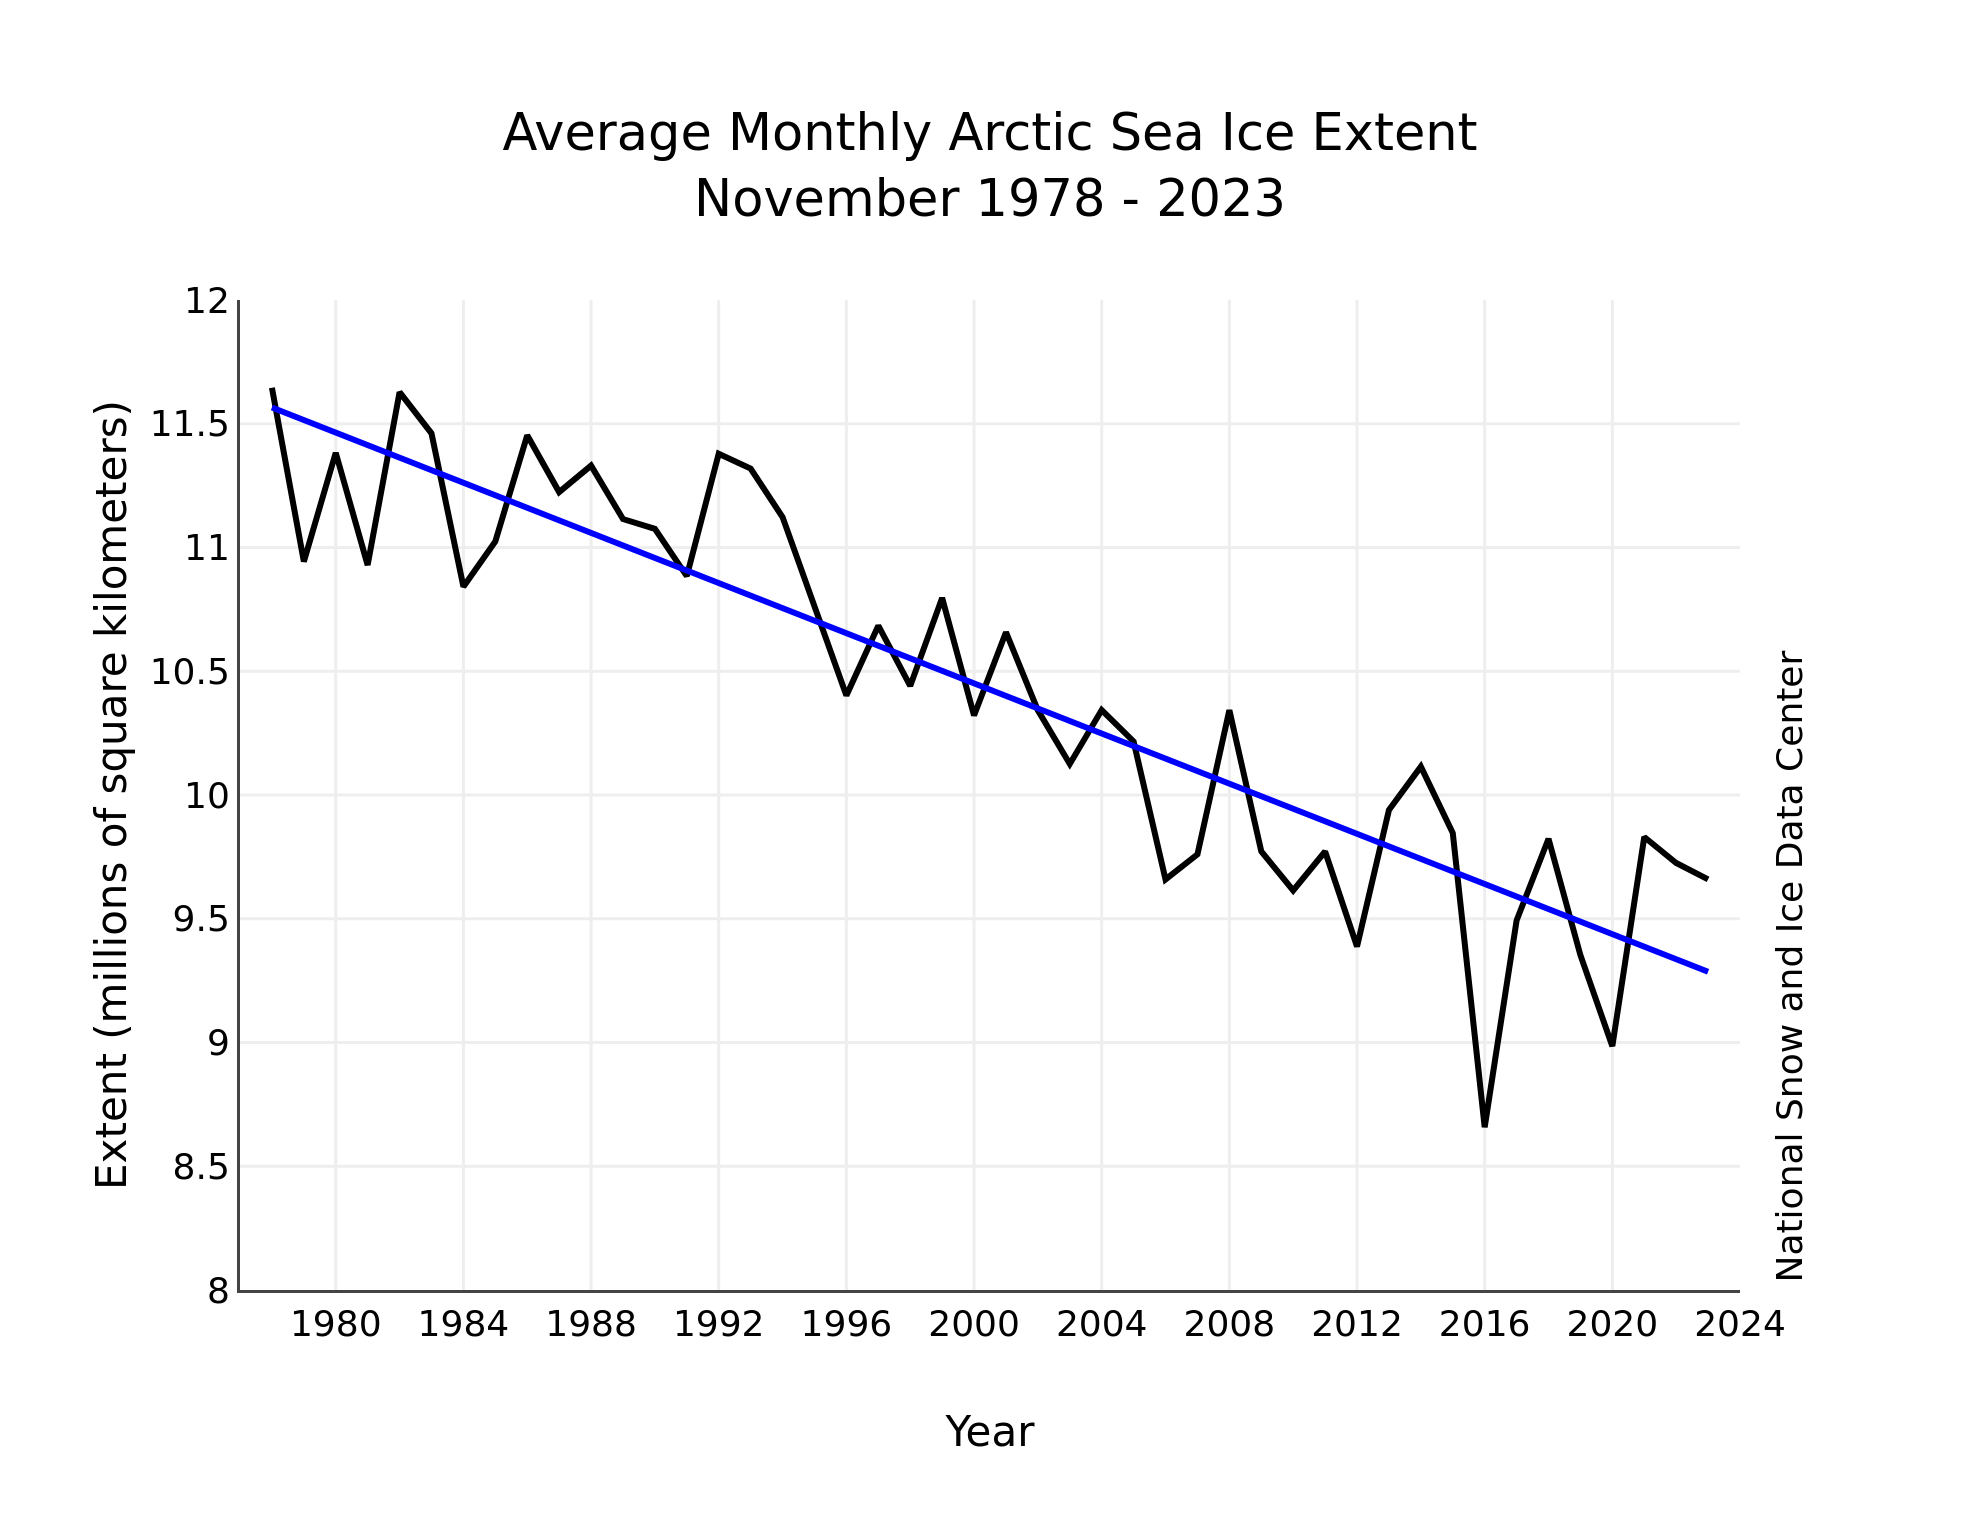
Figure 3. Monthly September ice extent for 1979 to 2023 shows a decline of 12.2 percent per decade.
Credit: National Snow and Ice Data Center
High-resolution image
The downward linear trend in Arctic sea ice extent for September over the 45-year satellite record is 78,500 square kilometers (20,300 square miles) per year, or 12.2 percent per decade relative to the 1981 to 2010 average (Figure 3). Based on the linear trend, since 1979, September has lost 3.45 million square kilometers (1.33 million square miles) of ice. This is roughly equivalent to twice the size of Alaska or Iran.
The Northern Hemisphere’s summer 2023 in review

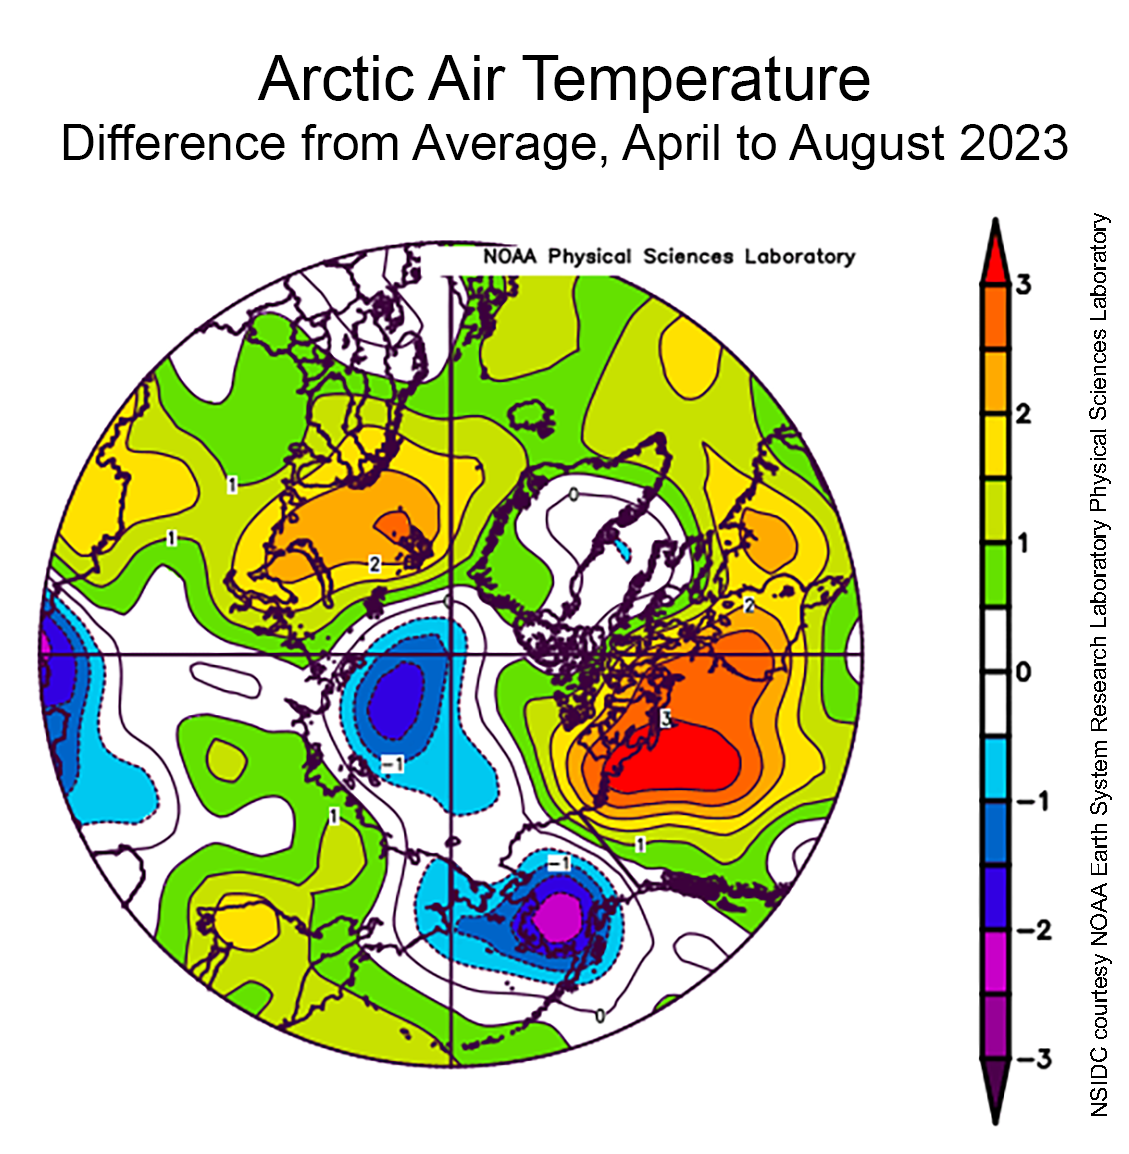
Figure 4a. This plot shows the departure from average air temperature in the Arctic at the 925 hPa level, in degrees Celsius, from April to August 2023. Yellows and reds indicate above average temperatures; blues and purples indicate below average temperatures.
Credit: NSIDC courtesy NOAA Earth System Research Laboratory Physical Sciences Laboratory
High-resolution image
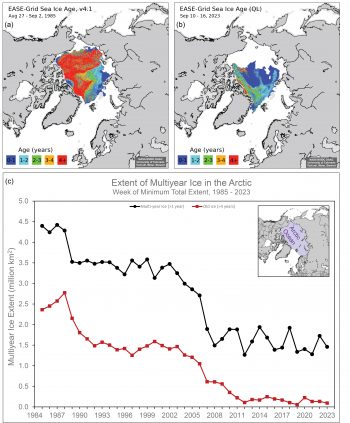
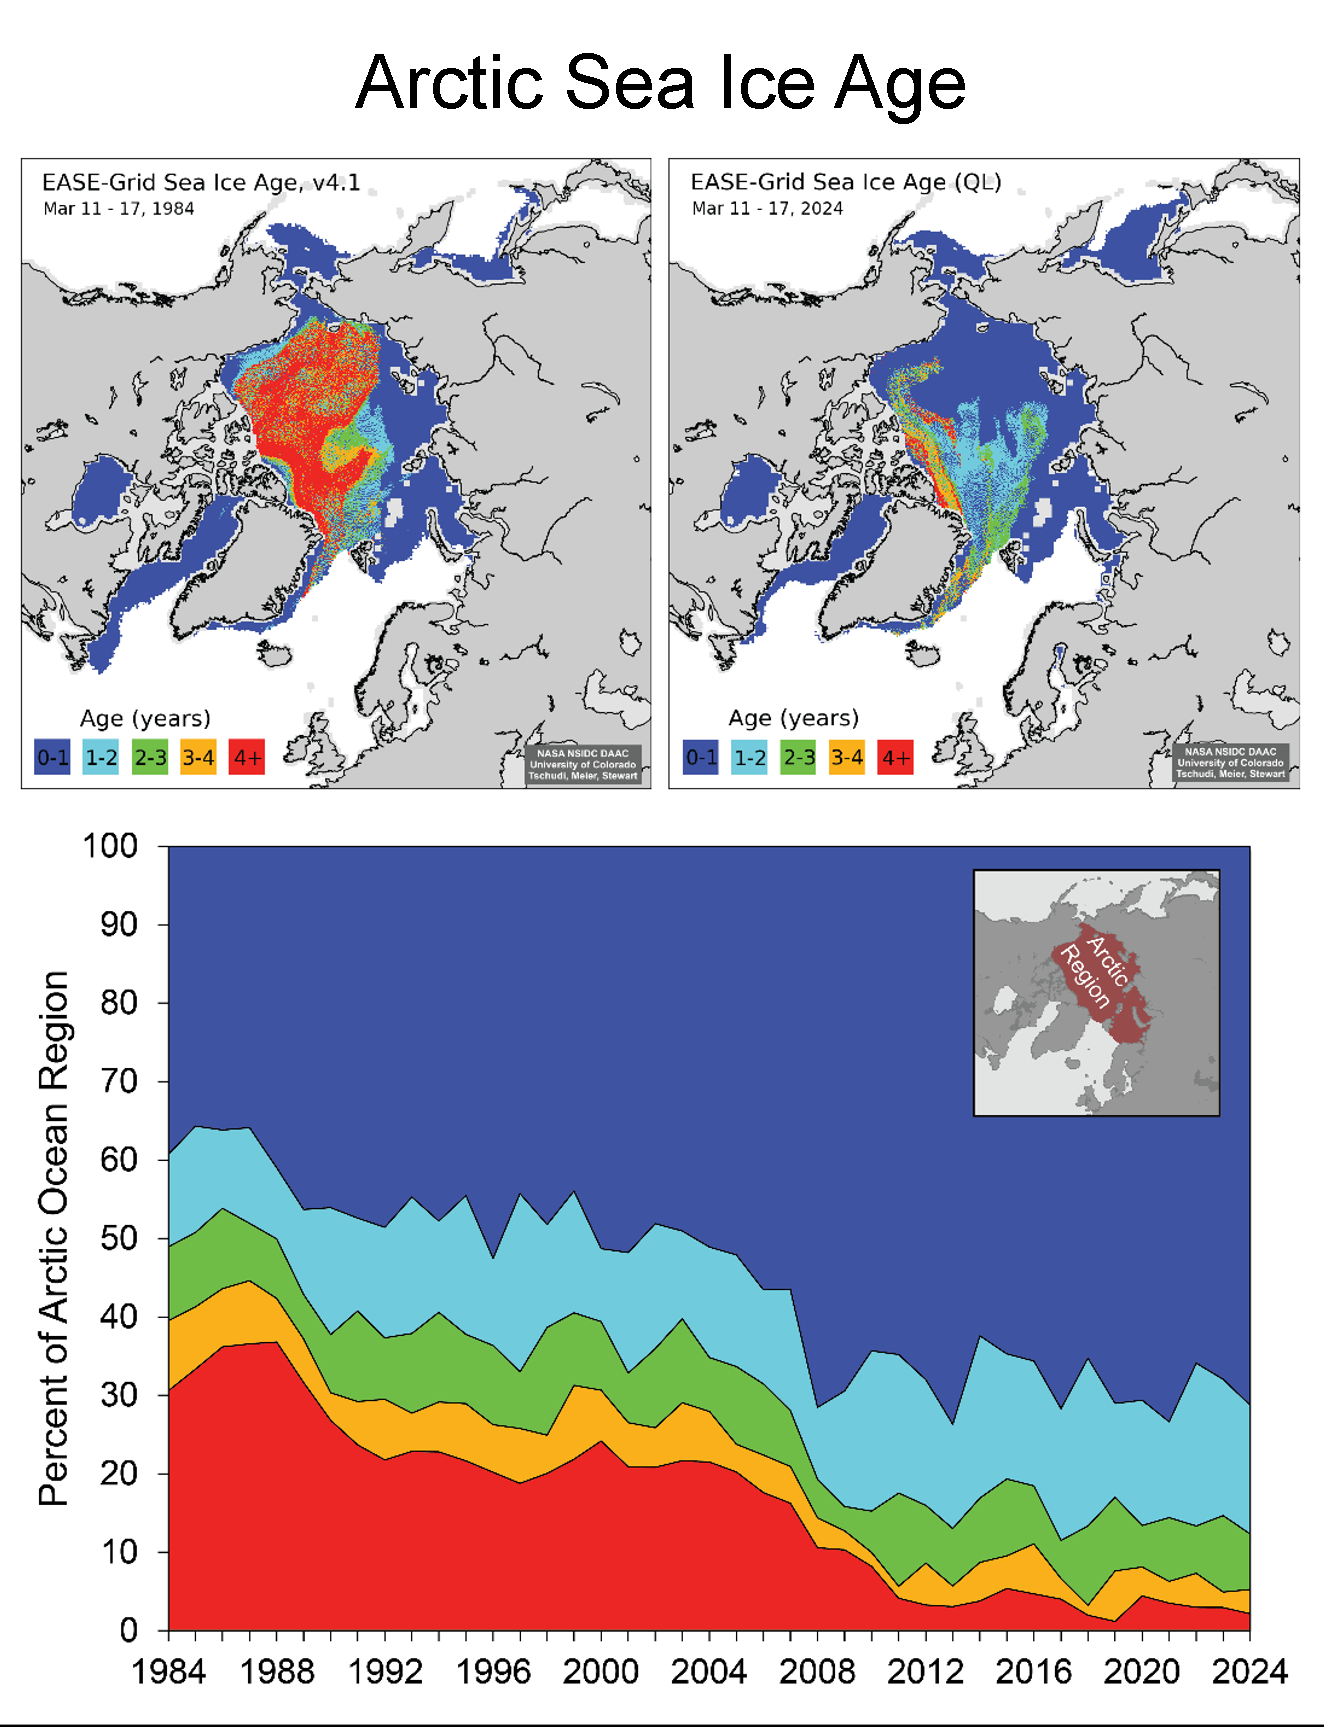
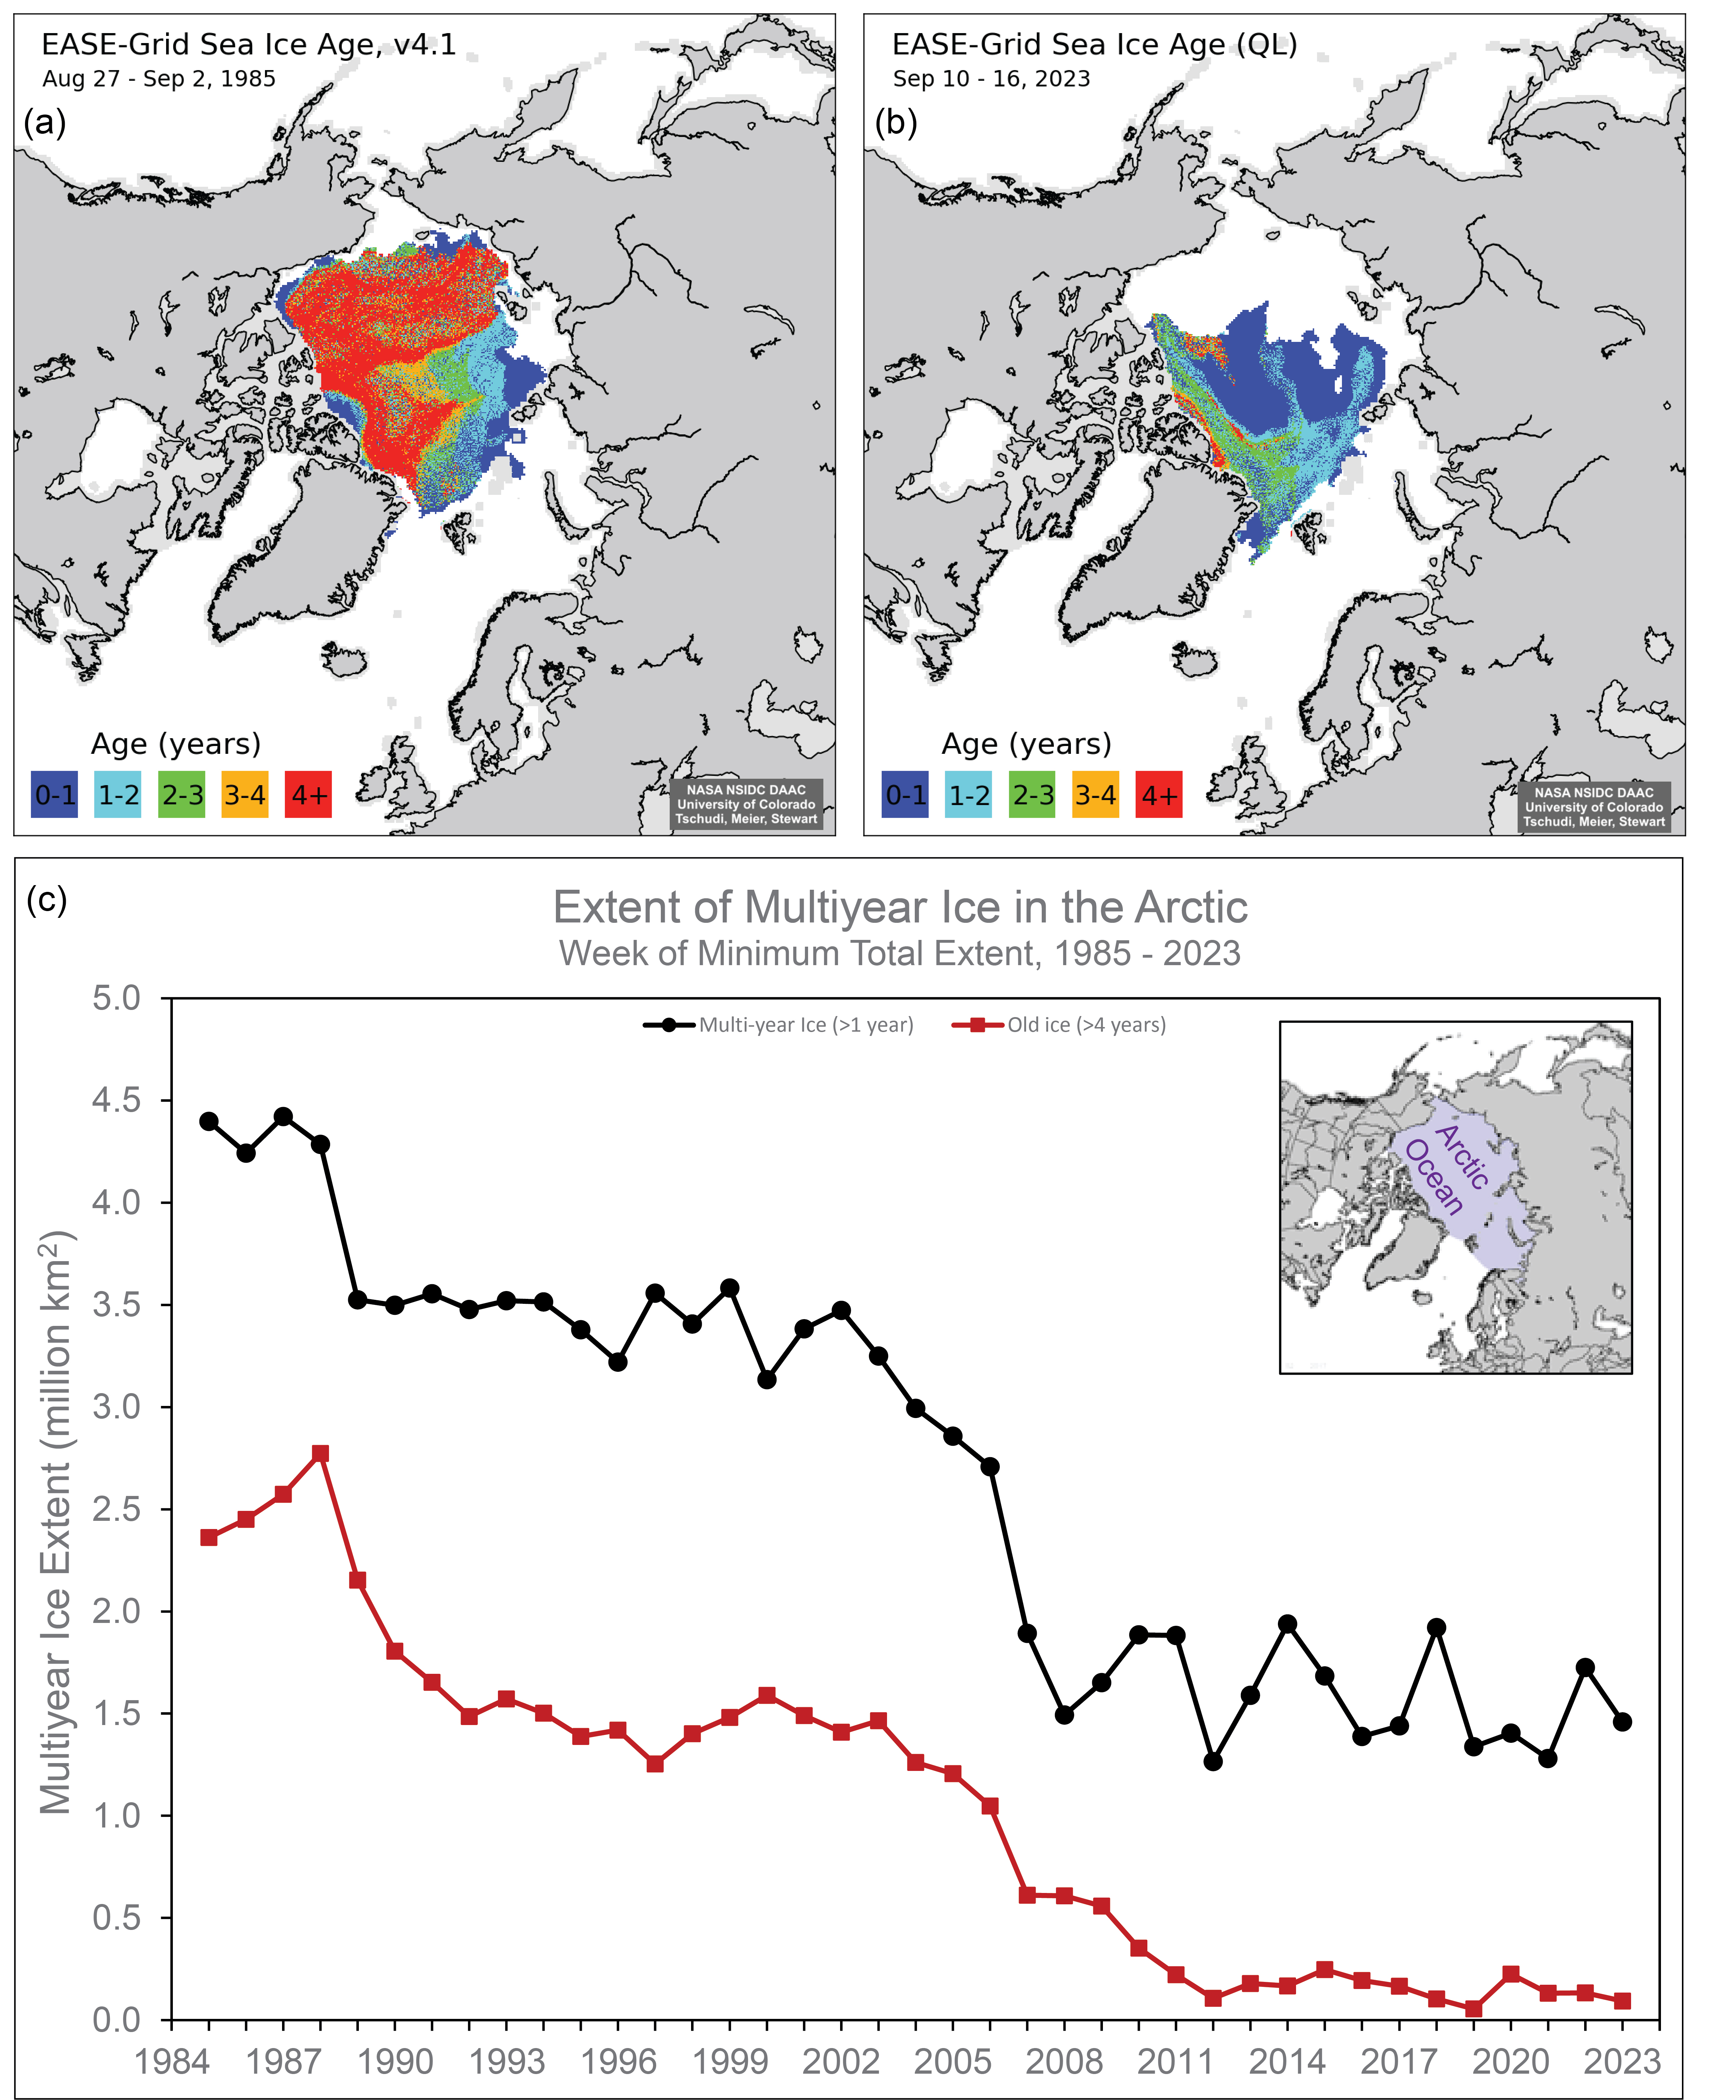
Figure 4b. The top maps show Arctic sea ice age at the end of summer, a week before the seasonal minimum, for 1985 on the left and 2023 on the right. The bottom time series shows extent of multiyear ice in black and ice >4 years old in red at the seasonal minimum for 1985 to 2023. The oldest (4+ year old) ice is in red.
Credit: Data and images from Tschudi et al., 2019a and 2019b
High-resolution image
With the passing of the seasonal maximum in Arctic sea ice extent on March 6, the melt season started slowly, but daily extents remained among the third to sixth lowest in the satellite record. The pattern of slow ice loss persisted through April—average extent for April ranked tied with 2002 as tenth lowest in the satellite record. The rate of ice loss picked up towards the end of May, dropping extent below the interdecile range after spending most of the month just above the lower part of the inter-decile range. Nevertheless, extent for the month as a whole ranked only thirteenth lowest in the satellite record. June sea ice loss proceeded at only an average rate and by month’s end, it was clear that a record low September ice extent was highly unlikely. While the rate of Ice loss picked up in August, the sea ice minimum reached on September 19 ended up as sixth lowest in the satellite record. The April through August average air temperate map at the 925 hPa level tells the basic story of 2023—temperatures were below average over much of the Arctic Ocean, limiting melt (Figure 4a). The year nevertheless ended up as notable for the combination of ice-fee conditions in the southern (Amundsen’s) Northwest Passage route and very mild ice conditions in the northern (deepwater) route; this is consistent with the above average temperatures at the 925 hPa level over the Canadian Arctic Archipelago.
Multiyear ice extent at the end of summer was quite low, as has been the case for the last several years (Figure 4b). A band of multiyear ice persists on the Atlantic side, extending from the Laptev Sea across the Arctic north of the Kara and Barents Seas. Much of this ice will likely drift out of the Arctic Ocean with the Transpolar Drift Stream over the next several months to a year. Very little of the oldest (4+ years old) ice remains in the Arctic, with small patches north of Greenland and an area north of the Beaufort Sea. The total extent of the oldest sea ice is 93,000 square kilometers (36,000 square miles), the second lowest in the satellite record since 1985, only higher than 55,000 square kilometers (21,000 square miles) in 2019. This is in stark contrast to the 1980s when old ice covered over 2.5 million square kilometers (965,000 square miles) of the Arctic Ocean.
Note that operational ice services track sea ice daily primarily for the safety of on-ice operations and ships at sea. These services use data sources that go beyond the single source used here. For example, analysts at the US National Ice Center (USNIC) depend on radar and visible-band data when mapping Arctic ice. USNIC tracks Arctic-wide sea ice extent using charts they produce. NSIDC archives these charts. Currently, the USNIC analysis indicates a minimum of 5.05 million square kilometers (1.95 million square miles) on September 27. The USNIC extent values differ from the Sea Ice Index values used by ASINA because of the different imagery and analysis techniques employed.
The Southern Hemisphere’s winter 2023 in review
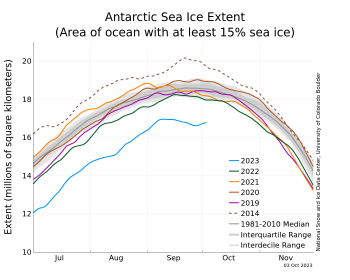
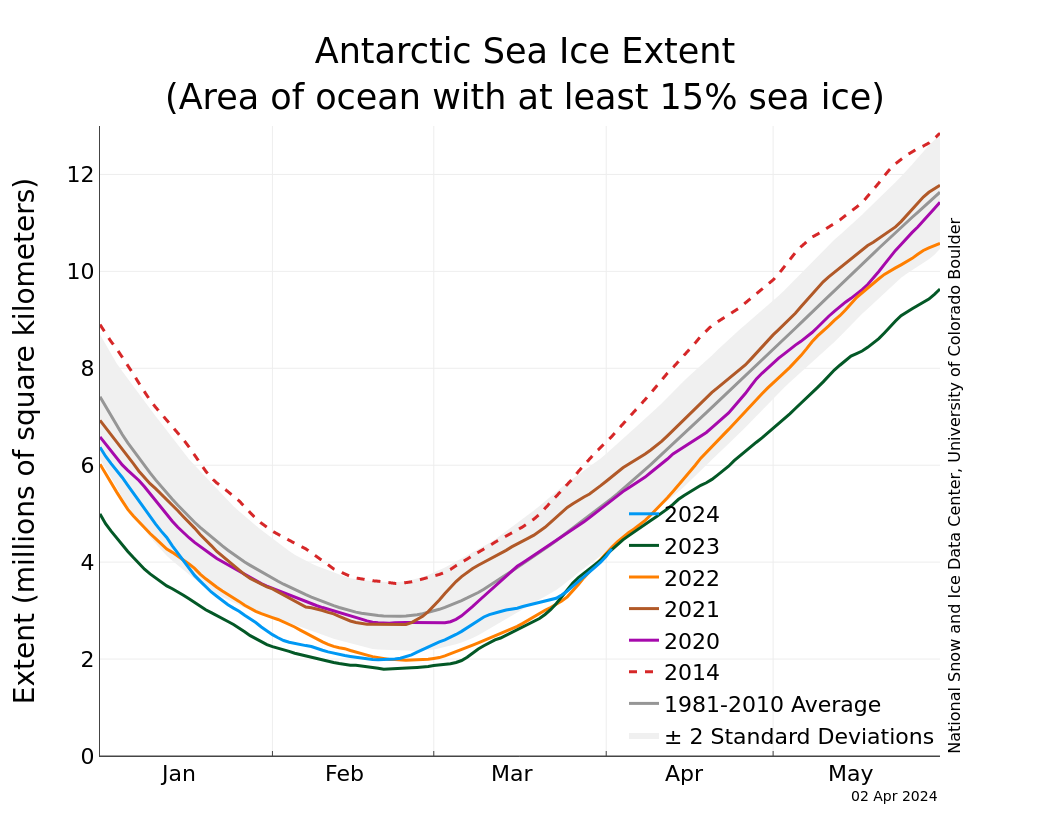
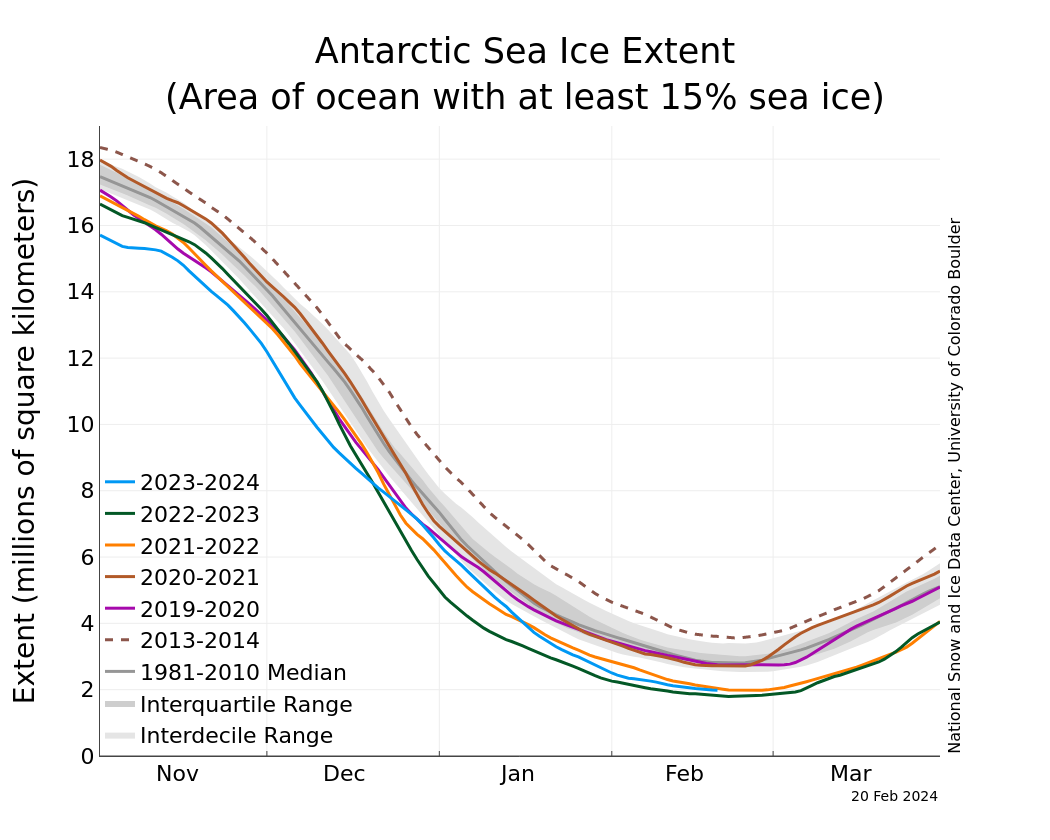
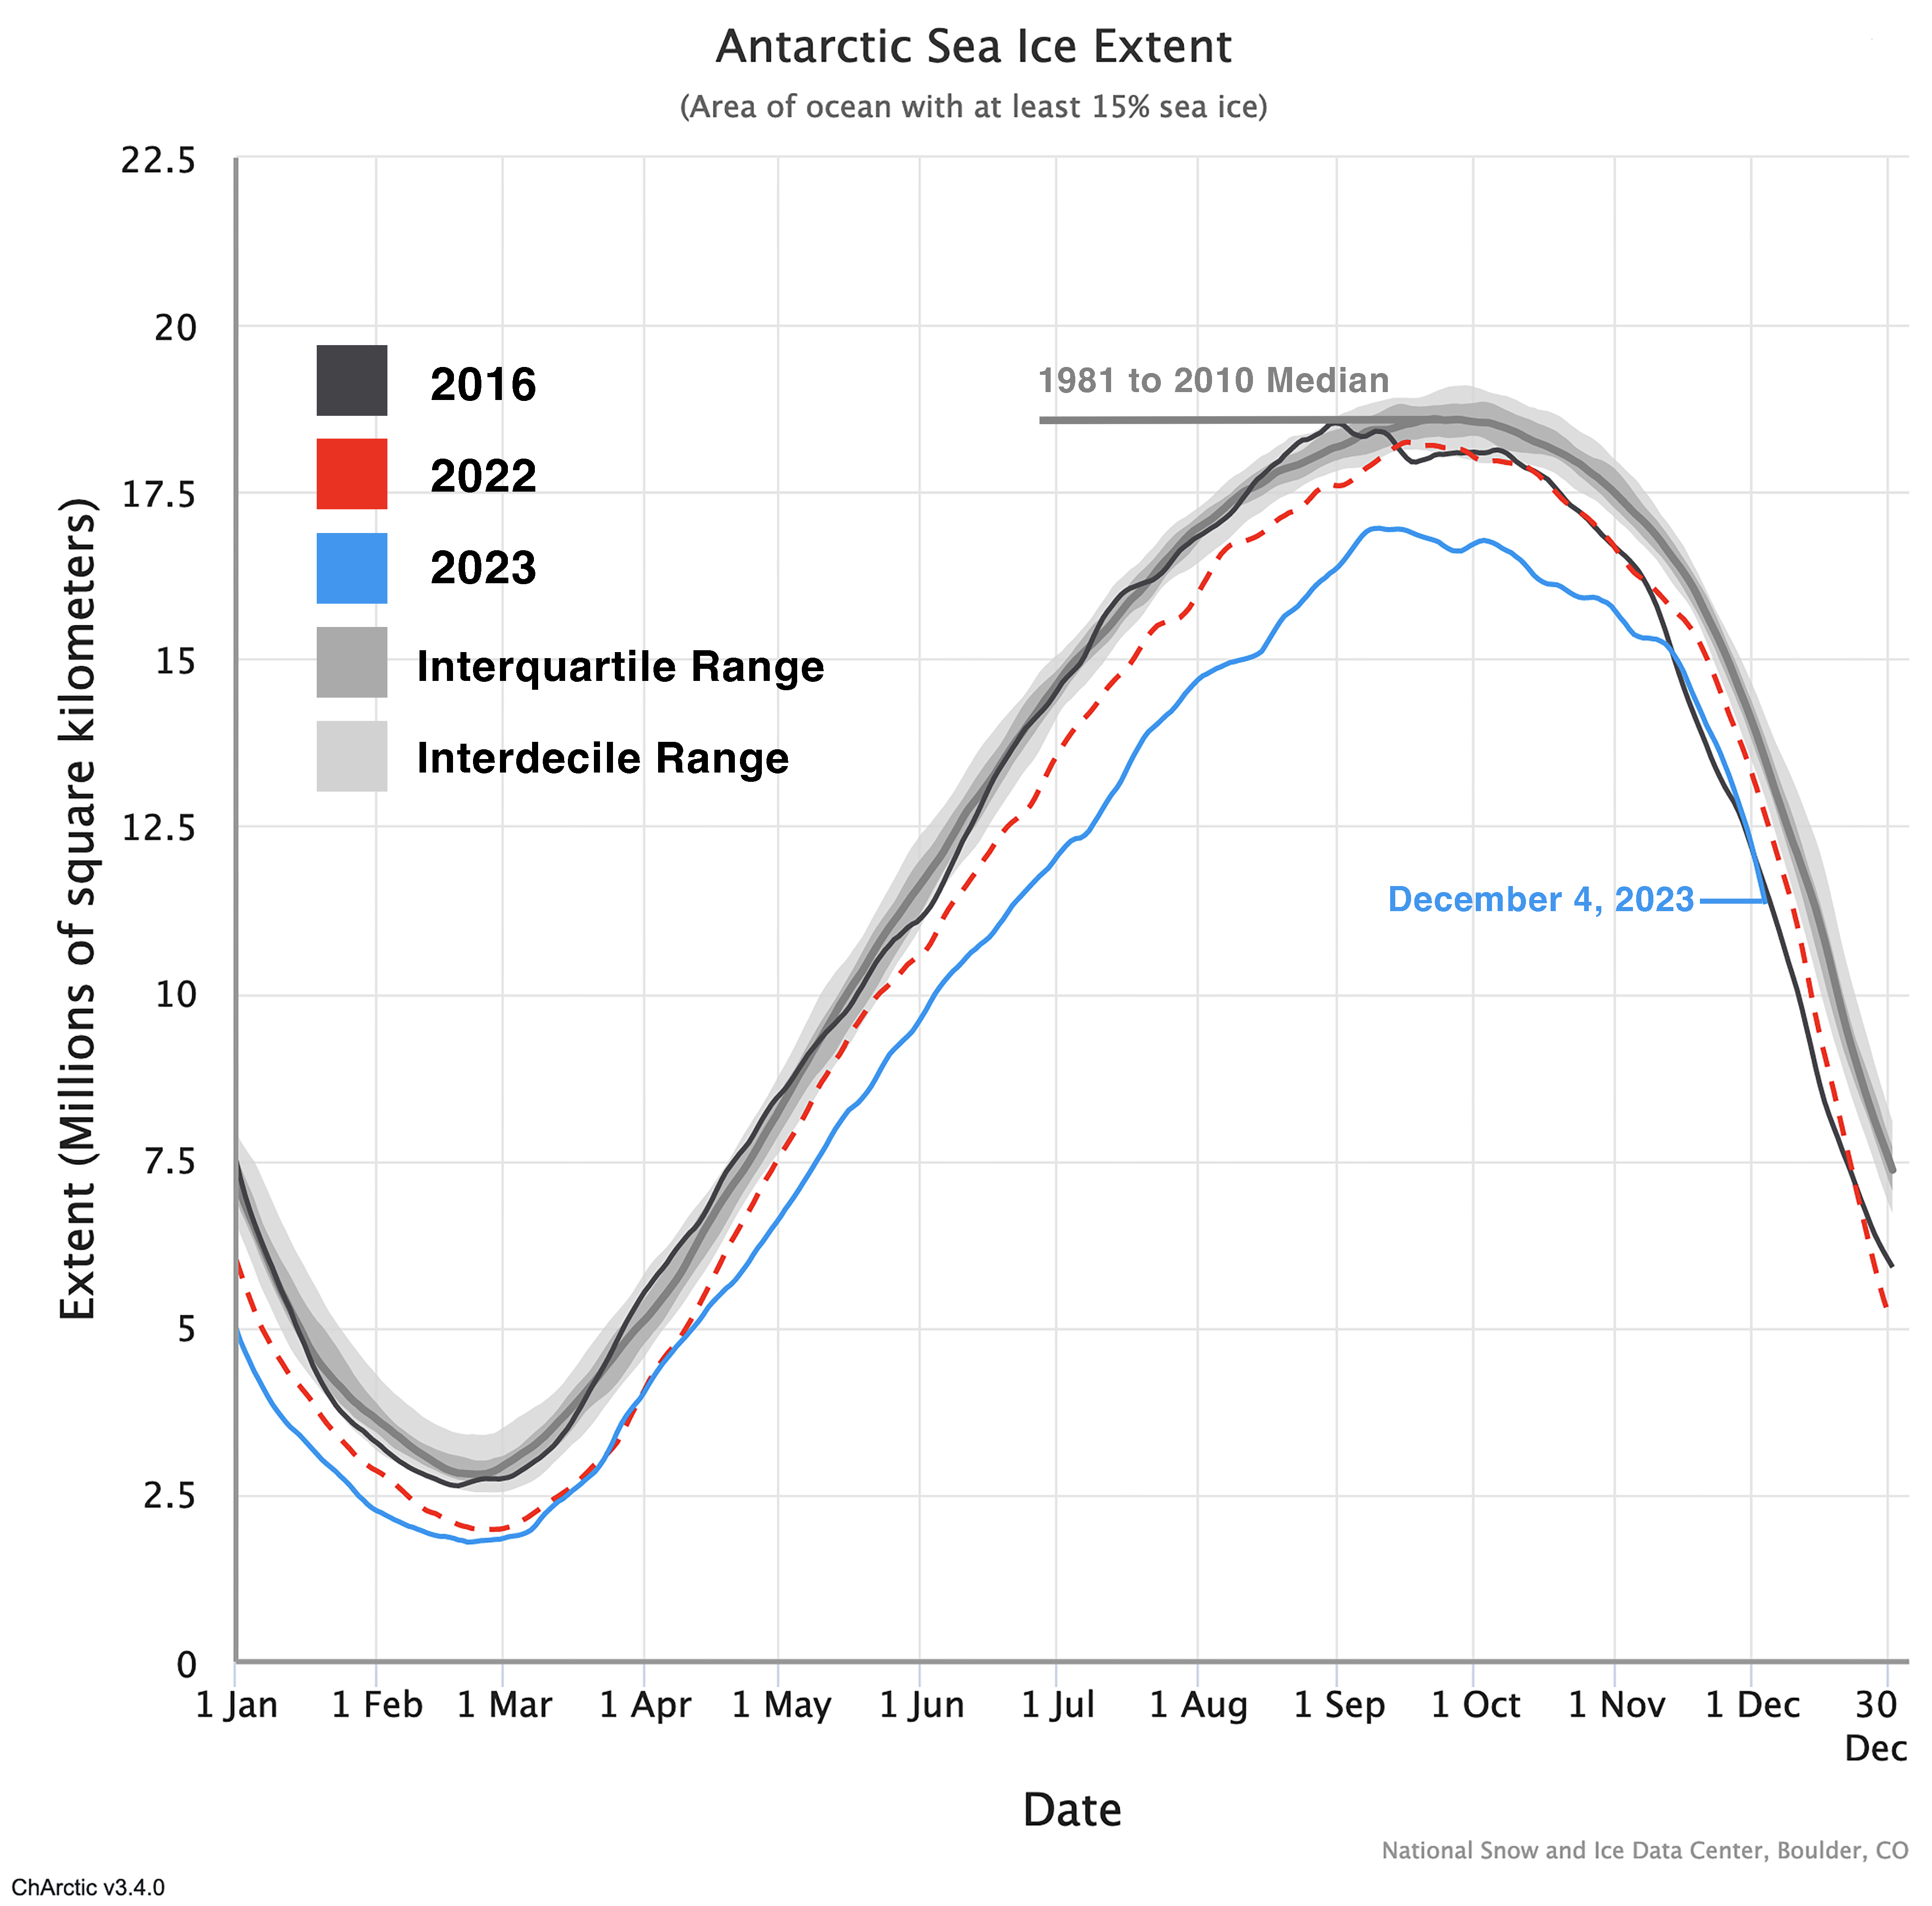
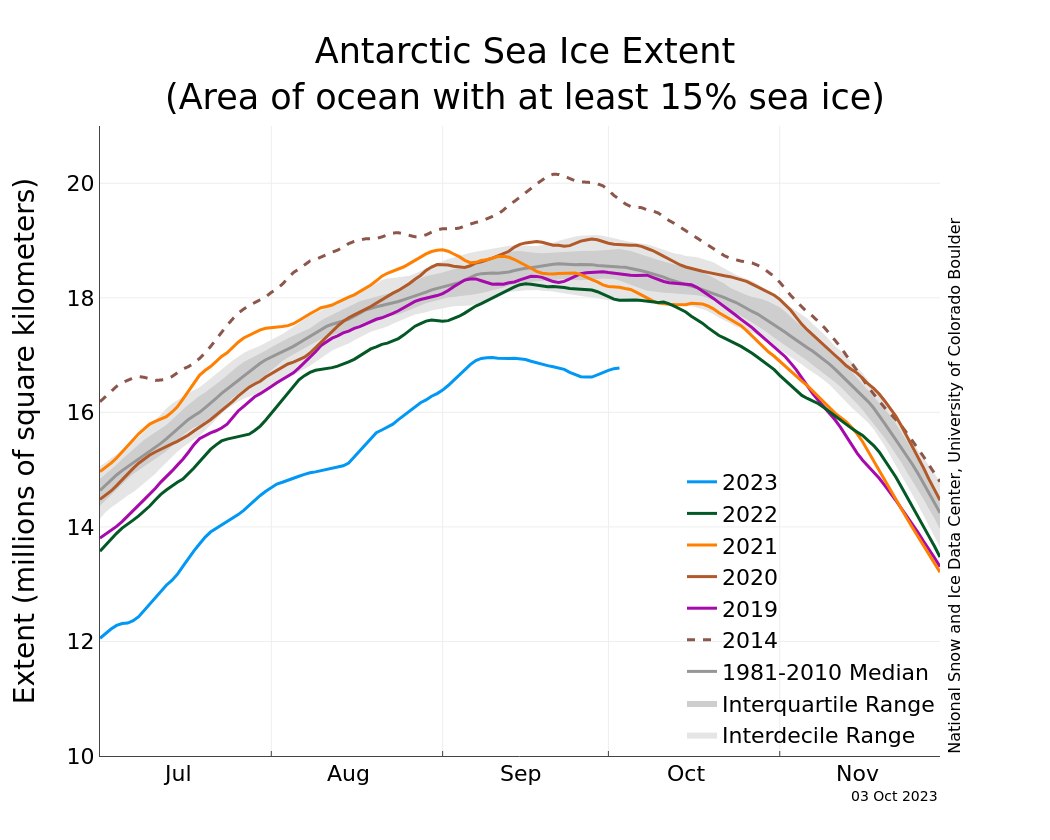
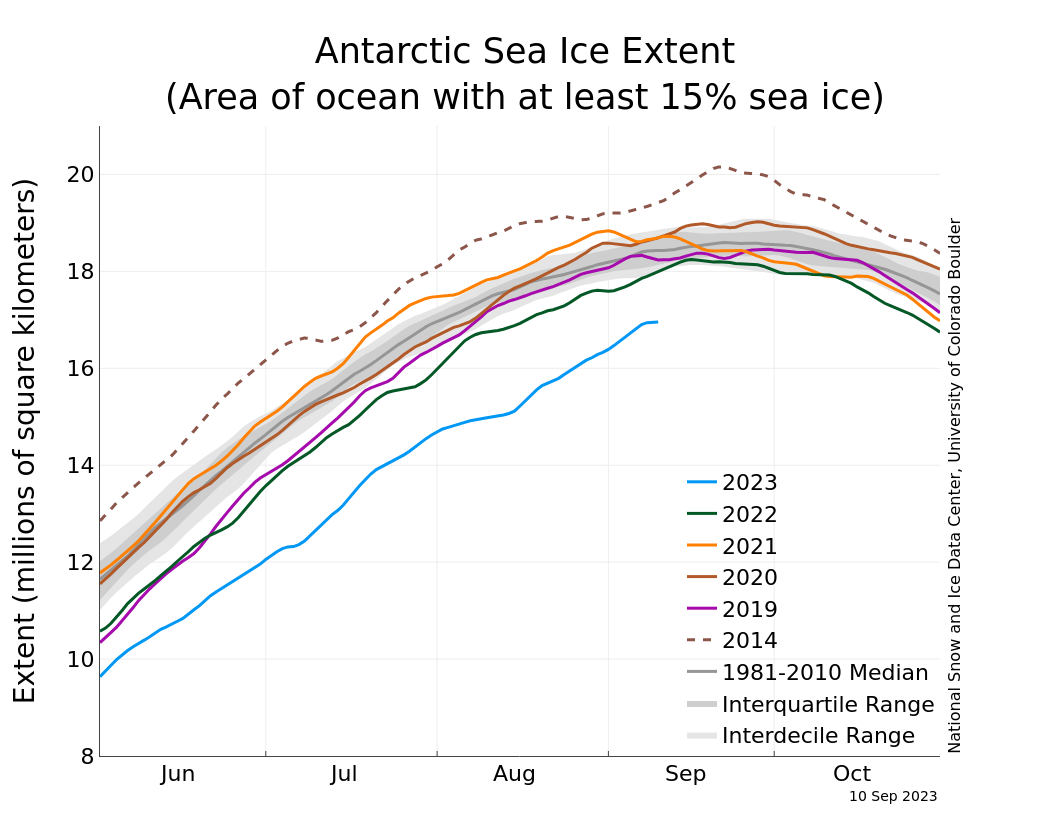
Figure 5a. The graph above shows Antarctic sea ice extent as of October 3, 2023, along with daily ice extent data for four previous years and 2014, the record maximum year. 2023 is shown in blue, 2022 in green, 2021 in orange, 2020 in brown, 2019 in magenta, and 2014 in dashed brown. The 1981 to 2010 median is in dark gray. The gray areas around the median line show the interquartile and interdecile ranges of the data. Sea Ice Index data.
Credit: National Snow and Ice Data Center
High-resolution image
Figure 5b. Click on image to begin the animation. From 2013 through 2023, Antarctic sea ice exhibited its highest and lowest extents in the satellite record dating back to 1979. From 2013 through 2015, extents were mostly above the 1981 to 2010 average, including the record-high 2014 winter maximum. Beginning in 2016, extents were mostly below the 1981 to 2010 average. Antarctic sea ice extent fell to the lowest minimum on record in March 2023 and the lowest maximum in September 2023.
Credit: Animation by Michon Scott, based on NSIDC’s Charctic Interactive Sea Ice Graph
High-resolution image

Figure 5c. This image show the sea ice edge for the last week of August 1966 using the minimum Advanced Vidicon Camera System on the NASA Nimbus satellite. Superimposed is the sea ice edge, depicted as a black line, from the manual analysis.
Credit: Gallagher et al. 2014
High-resolution image
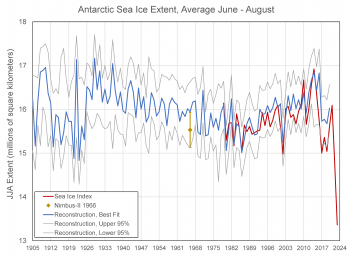
Figure 5d. This graph shows the average Antarctic extent for June through August for multiple decades. The blue line depicts the “best fit” from 1905 to 2020; the grey line depicts the upper and lower 95 percent range for the same time period; and the red line depicts the modern satellite data from the Sea Ice Index from 1979 to 2023. The Nimbus-II 1966 value is marked as a gold diamond within the uncertainty range, which is drawn as vertical gold line.
Credit: W. Meier, NSIDC
High-resolution image
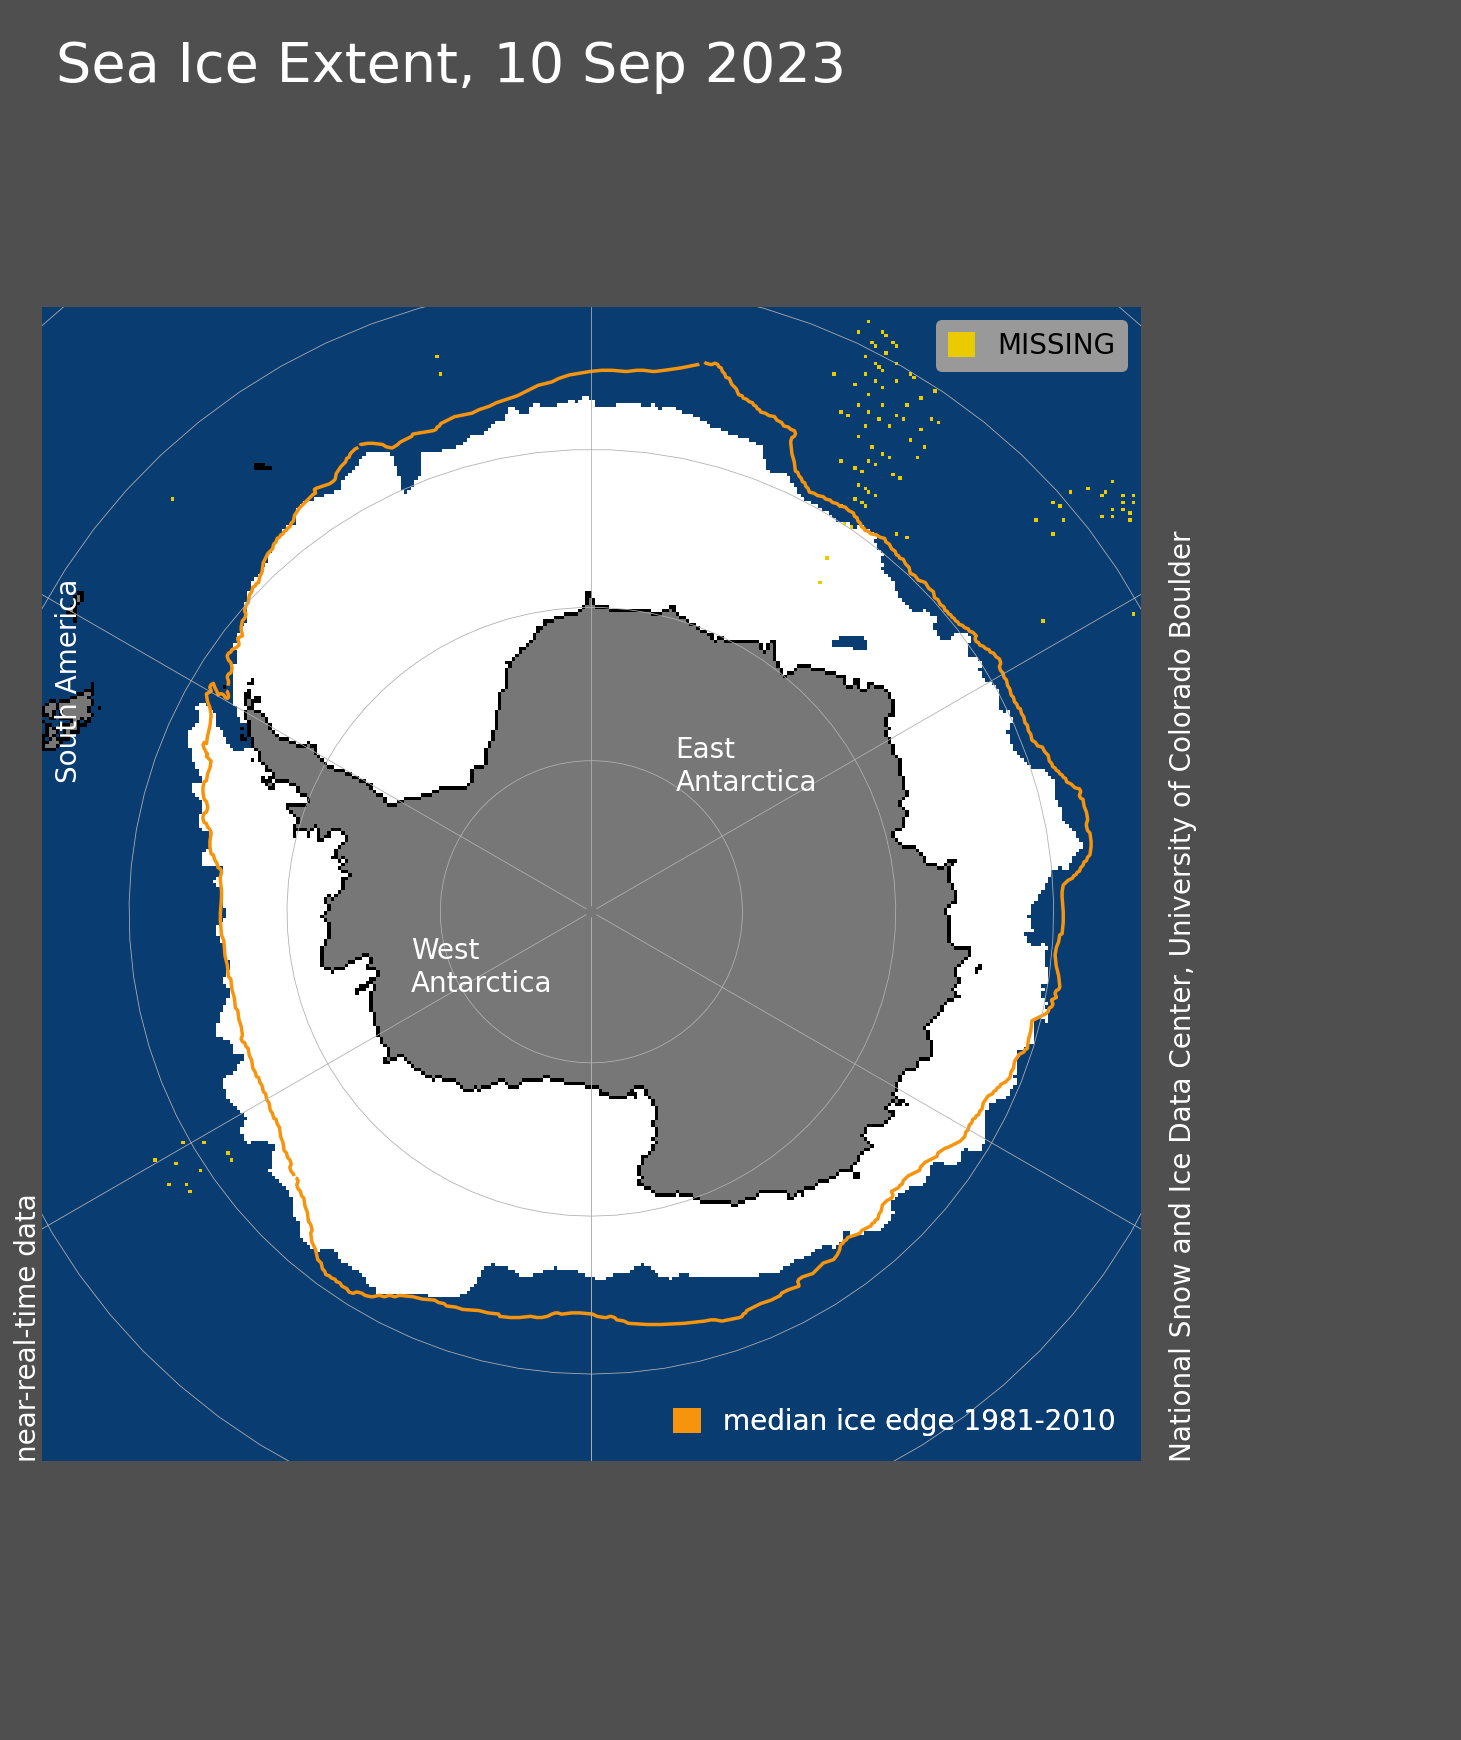
The story for the southern hemisphere was very different. After a record low minimum extent in February 2023, the seasonal increase in ice extent was near average through March, but then began to slow in April (Figure 5a). By May, it became clear that Antarctic sea ice extent, while of course growing in response to seasonal cooling, was lagging far below previous daily lows in the satellite record. Extent was particularly low in the Bellingshausen Sea, Weddell Sea, and western Ross Sea regions. By the middle of July, the heart of austral winter, extent stood at more than 2.60 million square kilometers (1.00 million square miles) below the 1981 to 2010 average, an area nearly as large as Argentina or the combined areas of Texas, California, New Mexico, Arizona, Nevada, Utah, and Colorado. August saw particularly low extent in the Ross Sea and eastern Weddell Sea sectors, but with some recovery in the Bellingshausen Sea. On September 10, 2023, Antarctic extent reached an annual maximum of 16.96 million square kilometers (6.55 million square miles). This year’s maximum was 1.03 million square kilometers (398,000 square miles) below the previous record low set in 1986. There is growing evidence that the Antarctic sea ice system has entered a new regime, featuring a much stronger influence of warm ocean waters limiting ice growth (Figure 5b).
Average Antarctic sea ice extent for September was 16.80 million square kilometers (6.49 million square miles), also far below the previous record for the month. Average September sea ice extent was 1.69 million square kilometers (653,000 square miles) below the 1981 to 2010 average extent of 18.49 million square kilometers (7.14 million square miles). More remarkably, it was 880,000 million square kilometers (340,000 square miles) below 1986, the previous lowest September.
The extents this year have been far outside anything observed in the 45-year modern satellite record that began in 1979. However, some earlier satellite data, including that from the Nimbus satellites in the mid-1960s, point to extents that may rival 2023. Estimates derived from Nimbus-II data suggest that extent for 1966 may have been only slightly higher than 2023 (Gallaher et al., 2014). However, Nimbus-II carried only a visible sensor, which could not collect data during cloudy conditions, resulting in sparse coverage of the Antarctic sea ice region (Figure 5c).
Data was not collected for September when the maximum generally occurs, but only for May through August. In addition, the data quality was limited, making discrimination between ice and ocean difficult. It seems clear that while the 1966 May, June, and July estimates are on par with the 1979 to 2022 values, August 1966 was an outlier with lower extent than July 1966. This is not reasonable given the seasonality of the ice cover. The recovery of such old satellite data is valuable for providing long-term context; however, as just discussed data quality issues preclude making quantitative comparisons with the modern satellite record.
As discussed in the August 2 post, another source of pre-1979 data was recently published at NSIDC (Fogt et al., 2023). It is based on the reconstruction of sea ice extent from climate indices, atmospheric reanalyses, and other information (Fogt et al., 2022). A reconstruction approach uses relationships between observed sea ice extent from satellites and the collection of climate indices to derive a relationship between the two. This relationship is then extrapolated to the pre-satellite period. The reconstruction data set encompasses 1905 to 2020 as seasonal 3-month averages. Comparing the June to August average from that product with the satellite data indicates that this year is well outside average ranges of the 115-year reconstruction (Figure 5d). Like the Nimbus-II data, such reconstructions also have high uncertainty and depend on the assumption that the relationships between satellite data and climate indices are valid over the pre-satellite period.
Sea ice conditions in the Northwest Passage routes during the 2023

Figure 6a. This time series shows total sea ice area for 2023, 2022, 2021, 2029, 2011, and the 1991 to 2020 average within the northern route of the Northwest Passage. Data are from the Canadian Ice Service.
Credit: S. Howell, Environment and Climate Change Canada
High-resolution image
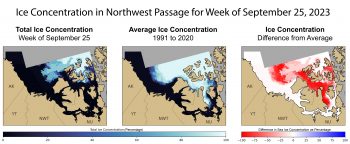
Figure 6b. These maps show sea ice concentration in the Northwest Passage for the week of September 25, 2023. The left map shows spatial distribution of total sea ice concentration; the middle map shows the 1991 to 2020 average sea ice concentration for the same week; and the map on the right shows the difference in sea ice concentrations between the 1991 to 2020 average and the week of September 25, 2023. Red shows a stark decline from the average. Data are from the Canadian Ice Service.
Credit: S. Howell, Environment and Climate Change Canada
High-resolution image
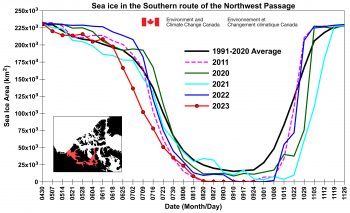
Figure 6c. The time series shows total sea ice area for 2023, 2022, 2021, 2029, 2011, and the 1991 and 2020 average within the southern route of the Northwest Passage. Data are from the Canadian Ice Service.
Credit: S. Howell, Environment and Climate Change Canada
High-resolution image
Our colleague Steve Howell at Environment and Climate Change Canada (ECCC) has provided an up-to-date summary of sea ice conditions in the Northwest Passage based on ice charts created by the Canadian Ice Service. While ice conditions at the end of the 2023 melt season were certainly remarkable, the northern route of Northwest Passage route did not break record low conditions of 2011, but still ranks second lowest since 1968 and is well below the 1991 to 2020 average (Figure 6a). Preliminary analysis indicates that the atmospheric circulation over the Canadian Arctic Archipelago during August and September of 2023 was not favorable to Arctic Ocean ice advection, which typically prevents the northern route from clearing. Interestingly, sea ice extent on September 25 is lower than in 2011 during the same time period (Figure 6b). Although the northern route was virtually sea ice free, complete transit without icebreaker escort would be difficult because of sea ice blocking the opening at M’Clure Strait. By contrast, the southern route is sea ice free from end to end (Figure 6c).
Further reading
Fogt, R. L., A. M. Sleinkofer, M. N. Raphael, H. S. and Handcock. 2022. A regime shift in seasonal total Antarctic sea ice extent in the twentieth century. Nature Climate Change 12, 54– 62, doi:10.1038/s41558-021-01254-9.
Fogt, R., M. N. Raphael, and M. S. Handcock. 2023. Seasonal Antarctic Sea Ice Extent Reconstructions, 1905-2020, Version 1 [Data Set]. Boulder, Colorado USA. National Snow and Ice Data Center, doi:10.7265/55×7-we68. Date Accessed 09-28-2023.
Gallaher, D., G. G. Campbell, W. N. Meier. 2014. Anomalous variability in Antarctic sea ice extents during the 1960s with the use of Nimbus data. IEEE Journal of Selected Topics in Applied Earth Observations and Remote Sensing, 3(7), 881-887, doi:10.1109/JSTARS.2013.2264391.
Tschudi, M., W. N. Meier, J. S. Stewart, C. Fowler, and J. Maslanik. 2019a. EASE-Grid Sea Ice Age, Version 4 [Data Set]. Boulder, Colorado USA. NASA National Snow and Ice Data Center Distributed Active Archive Center, doi:10.5067/UTAV7490FEPB. Date Accessed 10-02-2023.
Tschudi, M., W. N. Meier, and J. S. Stewart. 2019b. Quicklook Arctic Weekly EASE-Grid Sea Ice Age, Version 1 [Data Set]. Boulder, Colorado USA. NASA National Snow and Ice Data Center Distributed Active Archive Center, doi:10.5067/2XXGZY3DUGNQ. Date Accessed 10-02-2023.


![Autumn (September, October, November [SON]) trends for sea ice concentration (SIC) (top row), surface air temperature (middle row), and specific humidity (bottom row). Column (a) shows the trends over the full 20-year period (2003-2022) of the AIRS instrument analyzed by Boisvert et al. (2023). Column (b) shows the trends over the first half of the record (2003-2012), and Column (c) shows the trends over the second half of the record (2013-2022). Image from Boisvert et al. (2023).](http://nsidc.org/arcticseaicenews/files/1999/12/WarmerArcticDecades.png)


