While autumn sea ice growth is in full swing, brief pauses are not unusual. Starting November 22, the ice growth stalled almost completely for five days as a series of storms guided an atmospheric river into the Arctic, transporting warm, moist air.
Overview of conditions
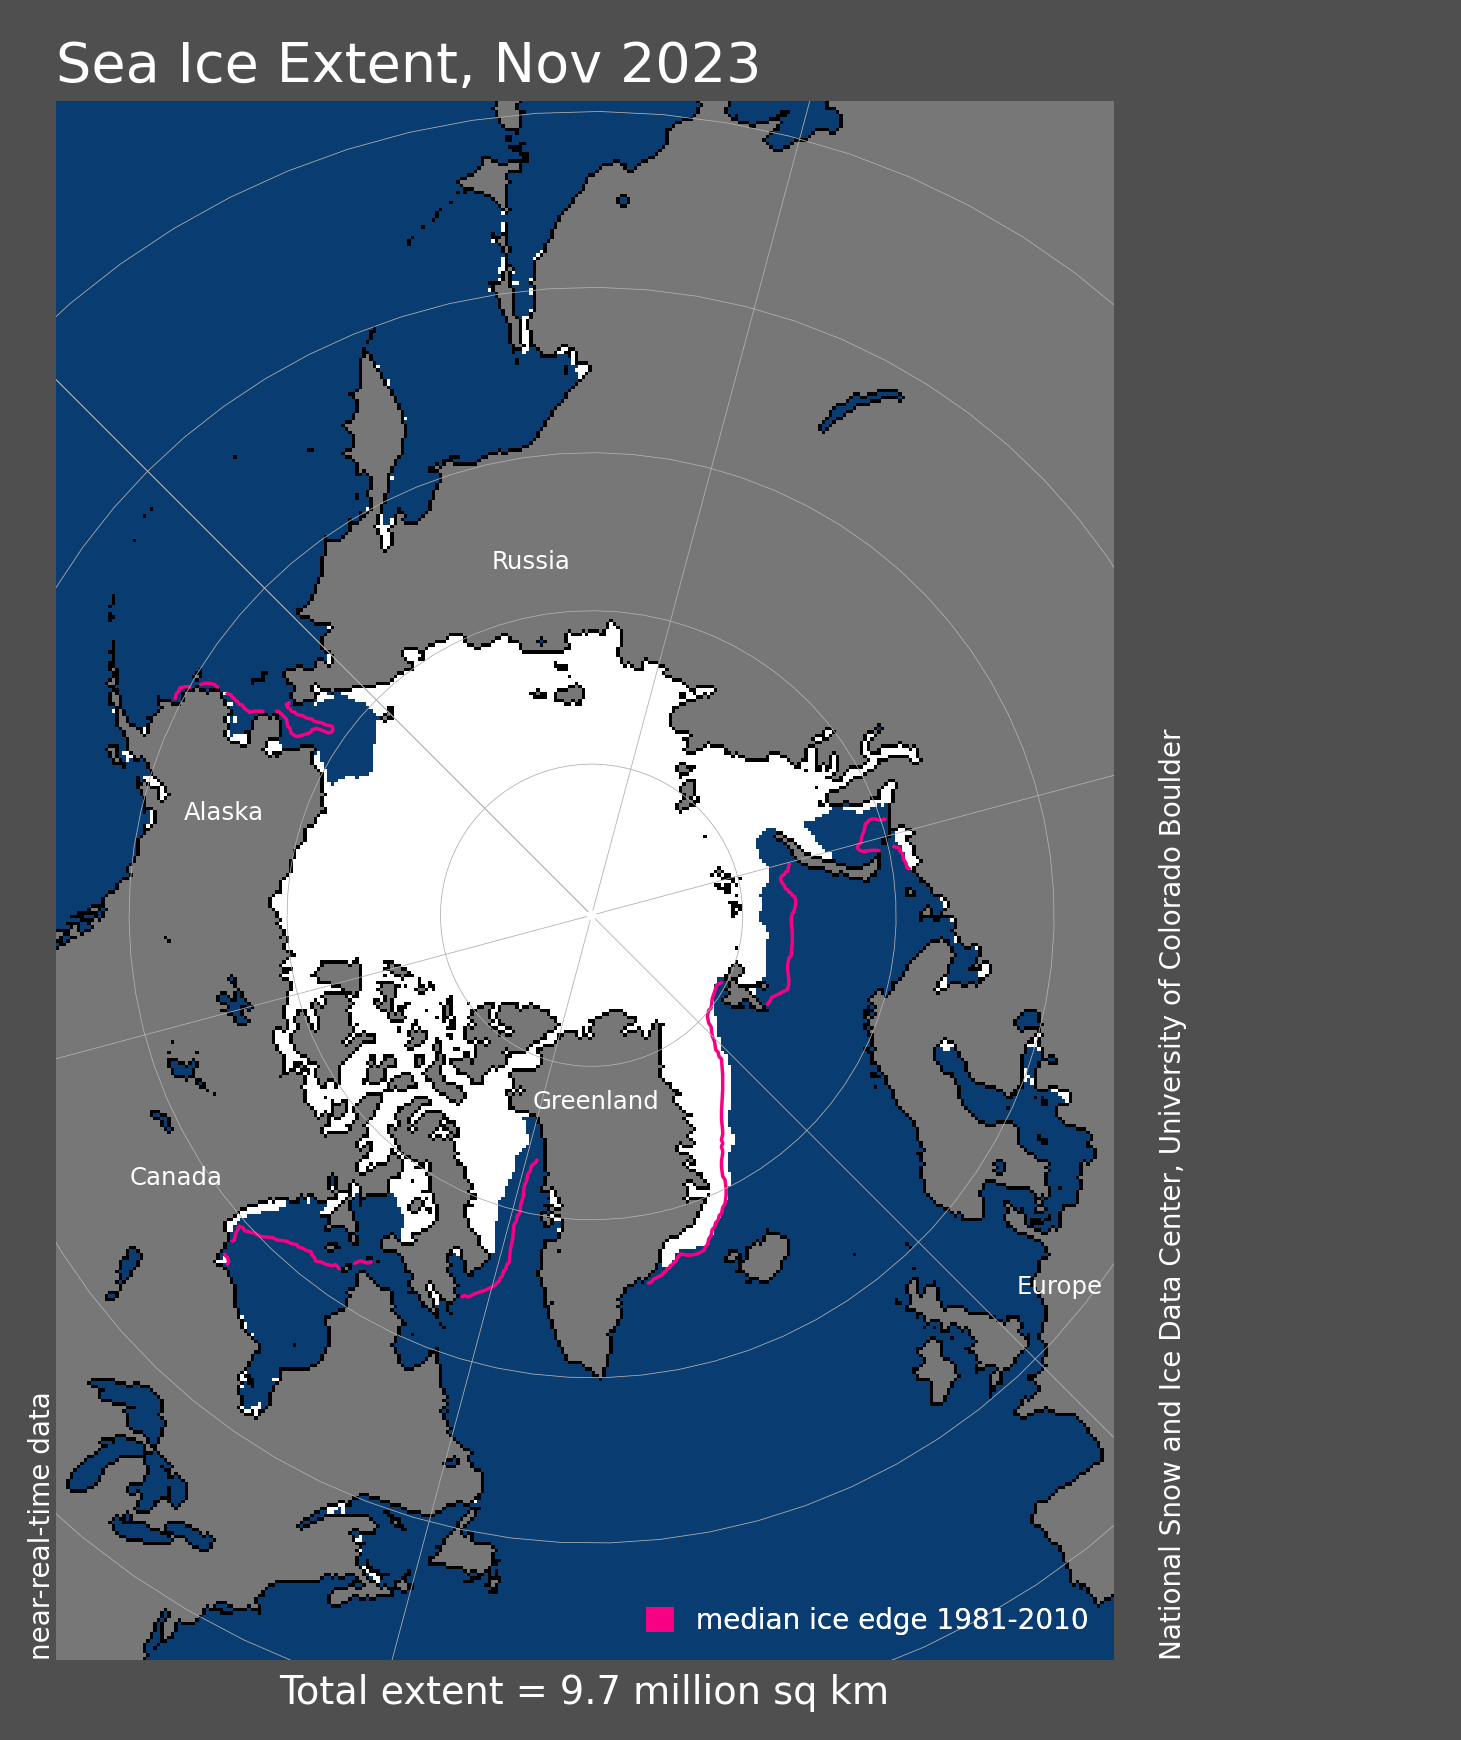
Figure 1a. Arctic sea ice extent for November 2023 was 9.66 million square kilometers (3.73 million square miles). The magenta line shows the 1981 to 2010 average extent for that month. Sea Ice Index data. About the data
Credit: National Snow and Ice Data Center
High-resolution image
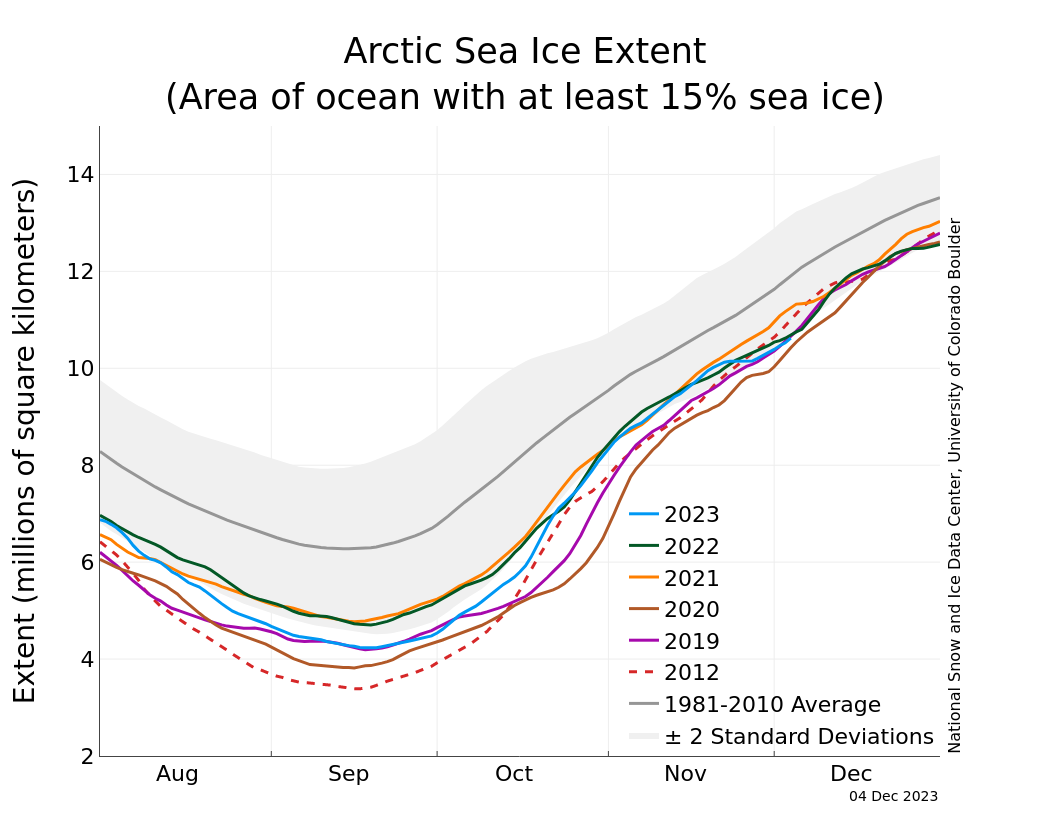
Figure 1b. The graph above shows Arctic sea ice extent as of December 4, 2023, along with daily ice extent data for four previous years and the record low year. 2023 is shown in blue, 2022 in green, 2021 in orange, 2020 in brown, 2019 in magenta, and 2012 in dashed brown. The 1981 to 2010 median is in dark gray. The gray areas around the median line show the interquartile and interdecile ranges of the data. Sea Ice Index data.
Credit: National Snow and Ice Data Center
High-resolution image
Arctic sea ice extent for November 2023 averaged 9.66 million square kilometers (3.73 million square miles), tying with 2006 for seventh lowest in the 45-year satellite record (Figure 1a). Overall, during November, sea ice extent increased by 70,800 thousand square kilometers (27,300 square miles) per day, slightly faster than the 1981 to 2010 average of 69,500 square kilometers (26,800 square miles) per day (Figure 1b). Freeze up temporarily stalled starting November 22, as several cyclones brought warm, moist air into the north Atlantic. The strong winds helped to push the ice edge in the East Greenland and Barents Seas northwards, limiting new ice formation. A cyclone in the Bering Sea around this time also pushed the ice edge polewards in the Chukchi Sea. Ice growth for November occurred all along the margins of the Arctic Ocean, dominated by growth in Baffin Bay and the southern Beaufort Sea.
A November pause in ice growth occurred three times in the past: November 3 to 8, 2013; November 13 to 20, 2016; and now November 19 to 24, 2023. Thus, such events are rare but not unknown.
Conditions in context
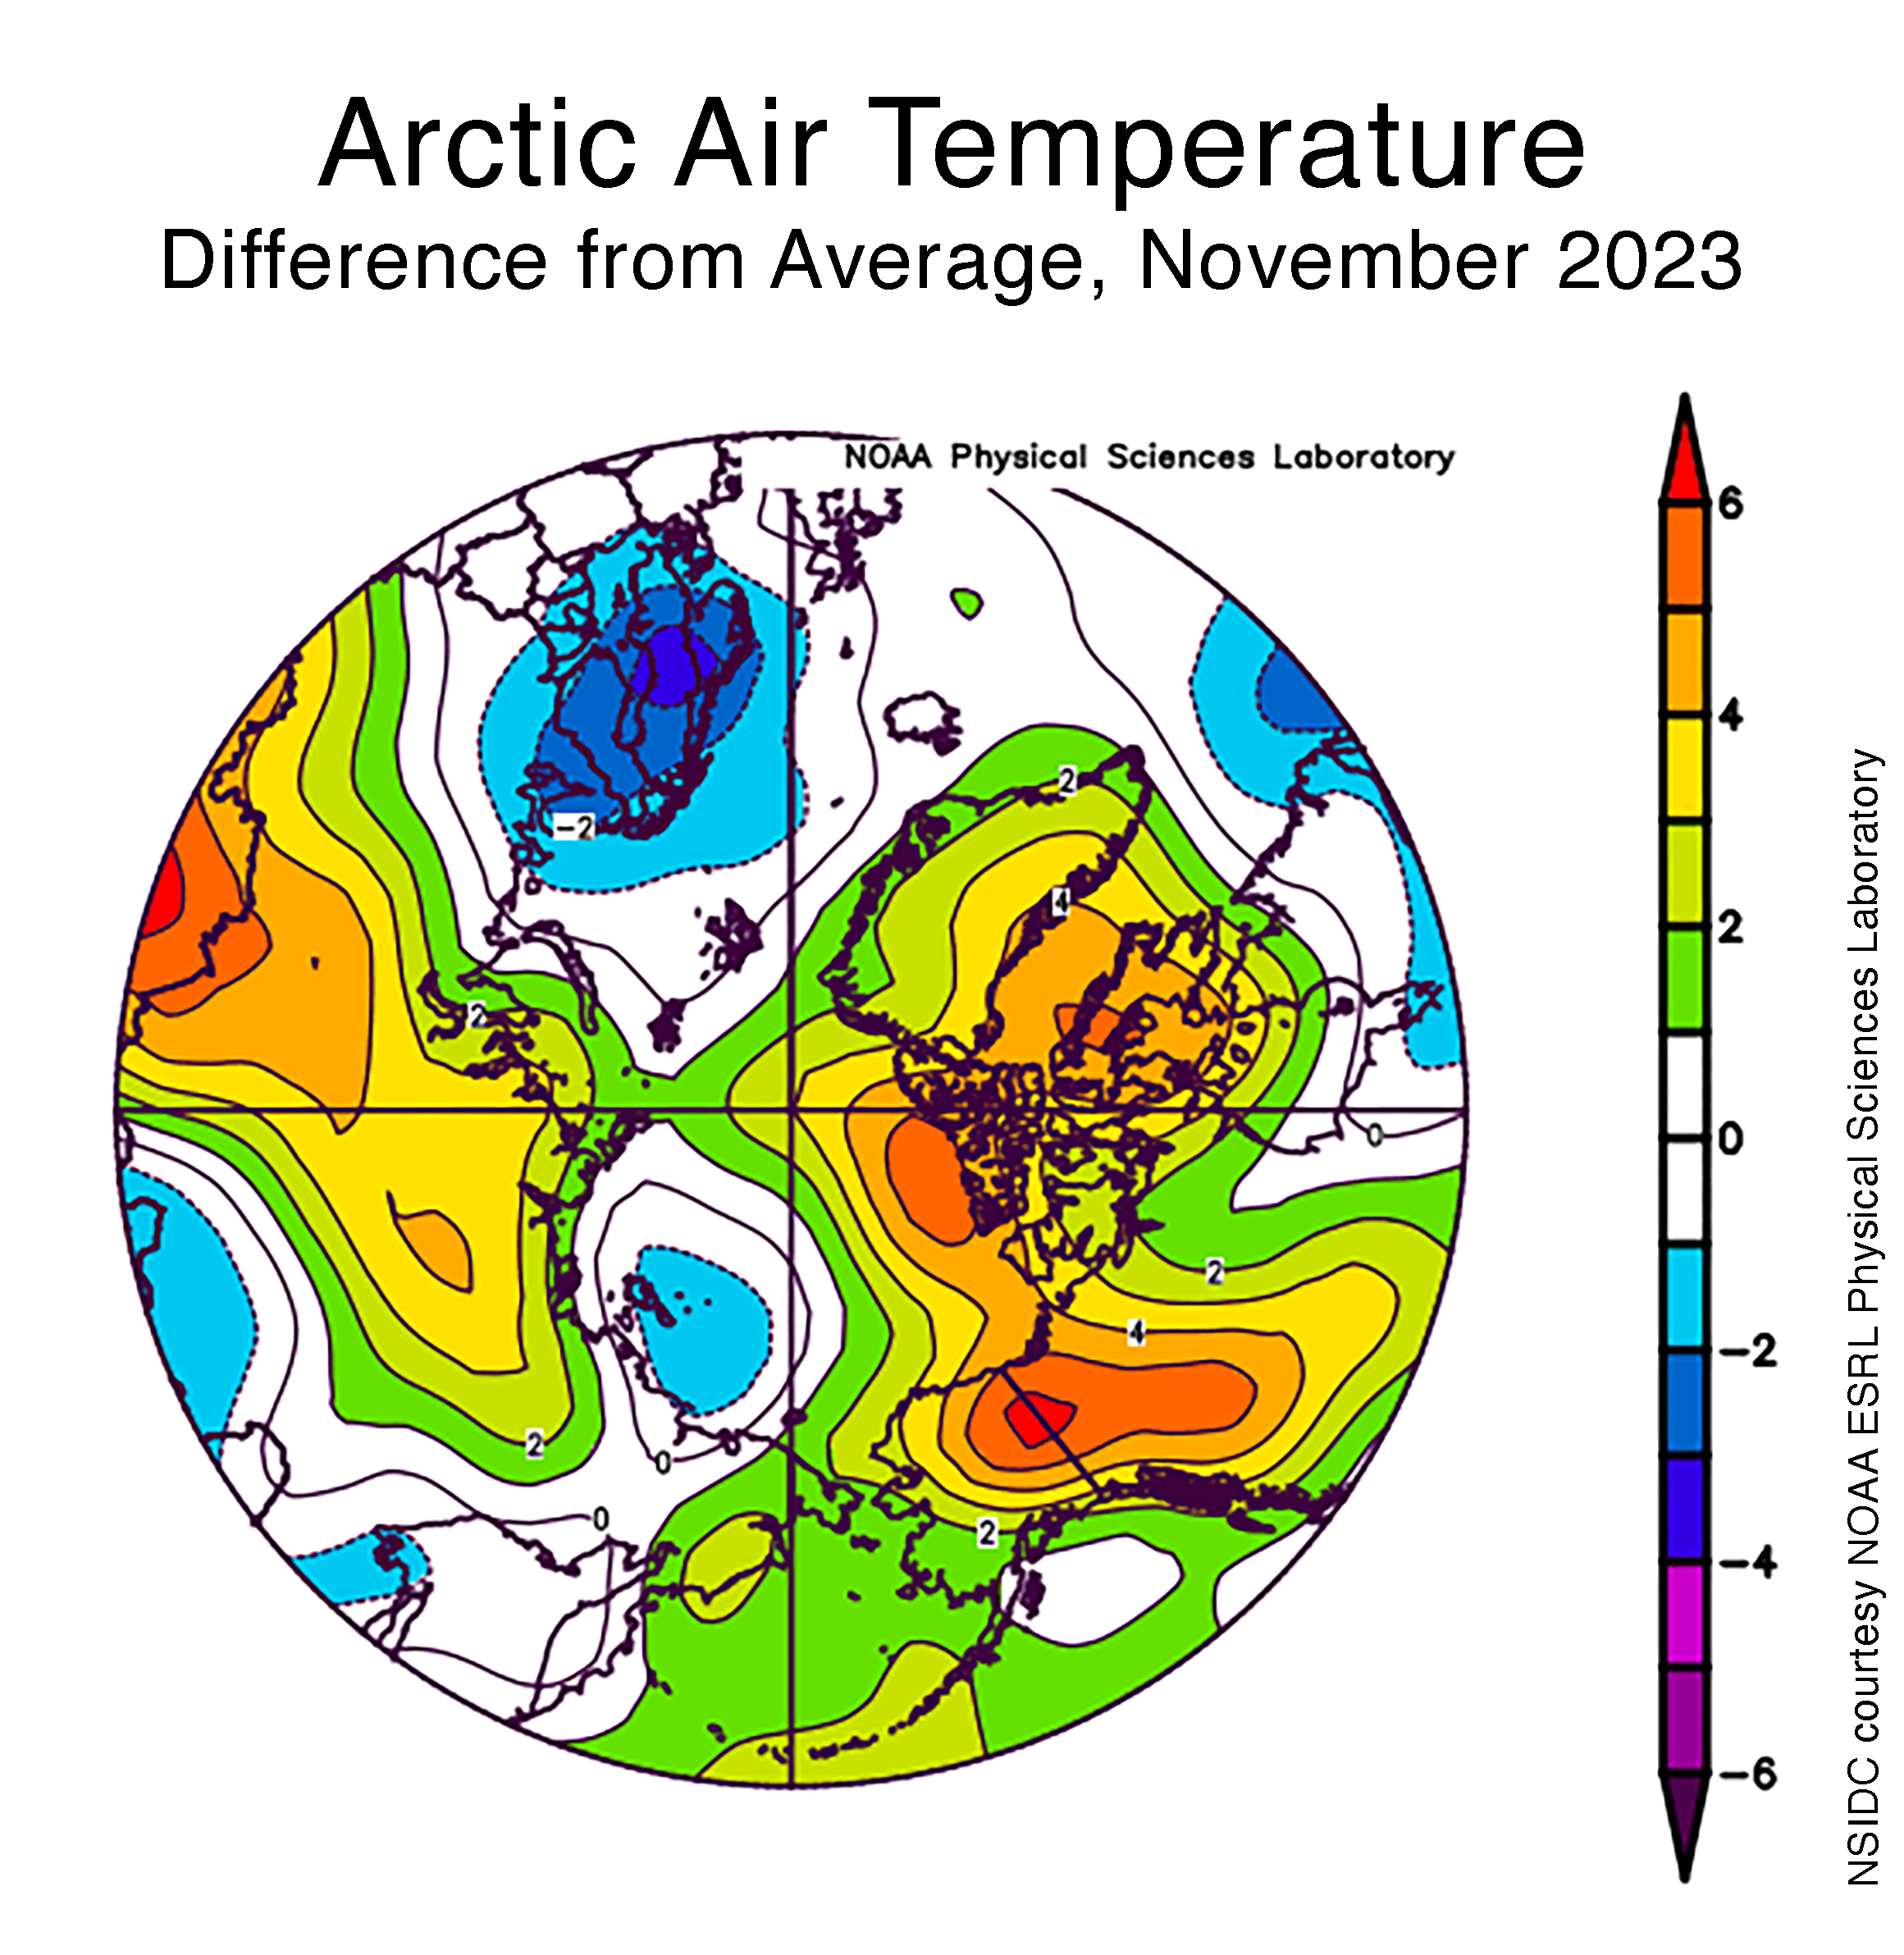
Figure 2a. This plot shows the departure from average air temperature in the Arctic at the 925 hPa level, in degrees Celsius, for November 2023. Yellows and reds indicate above average temperatures; blues and purples indicate below average temperatures.
Credit: NSIDC courtesy NOAA Earth System Research Laboratory Physical Sciences Laboratory
High-resolution image
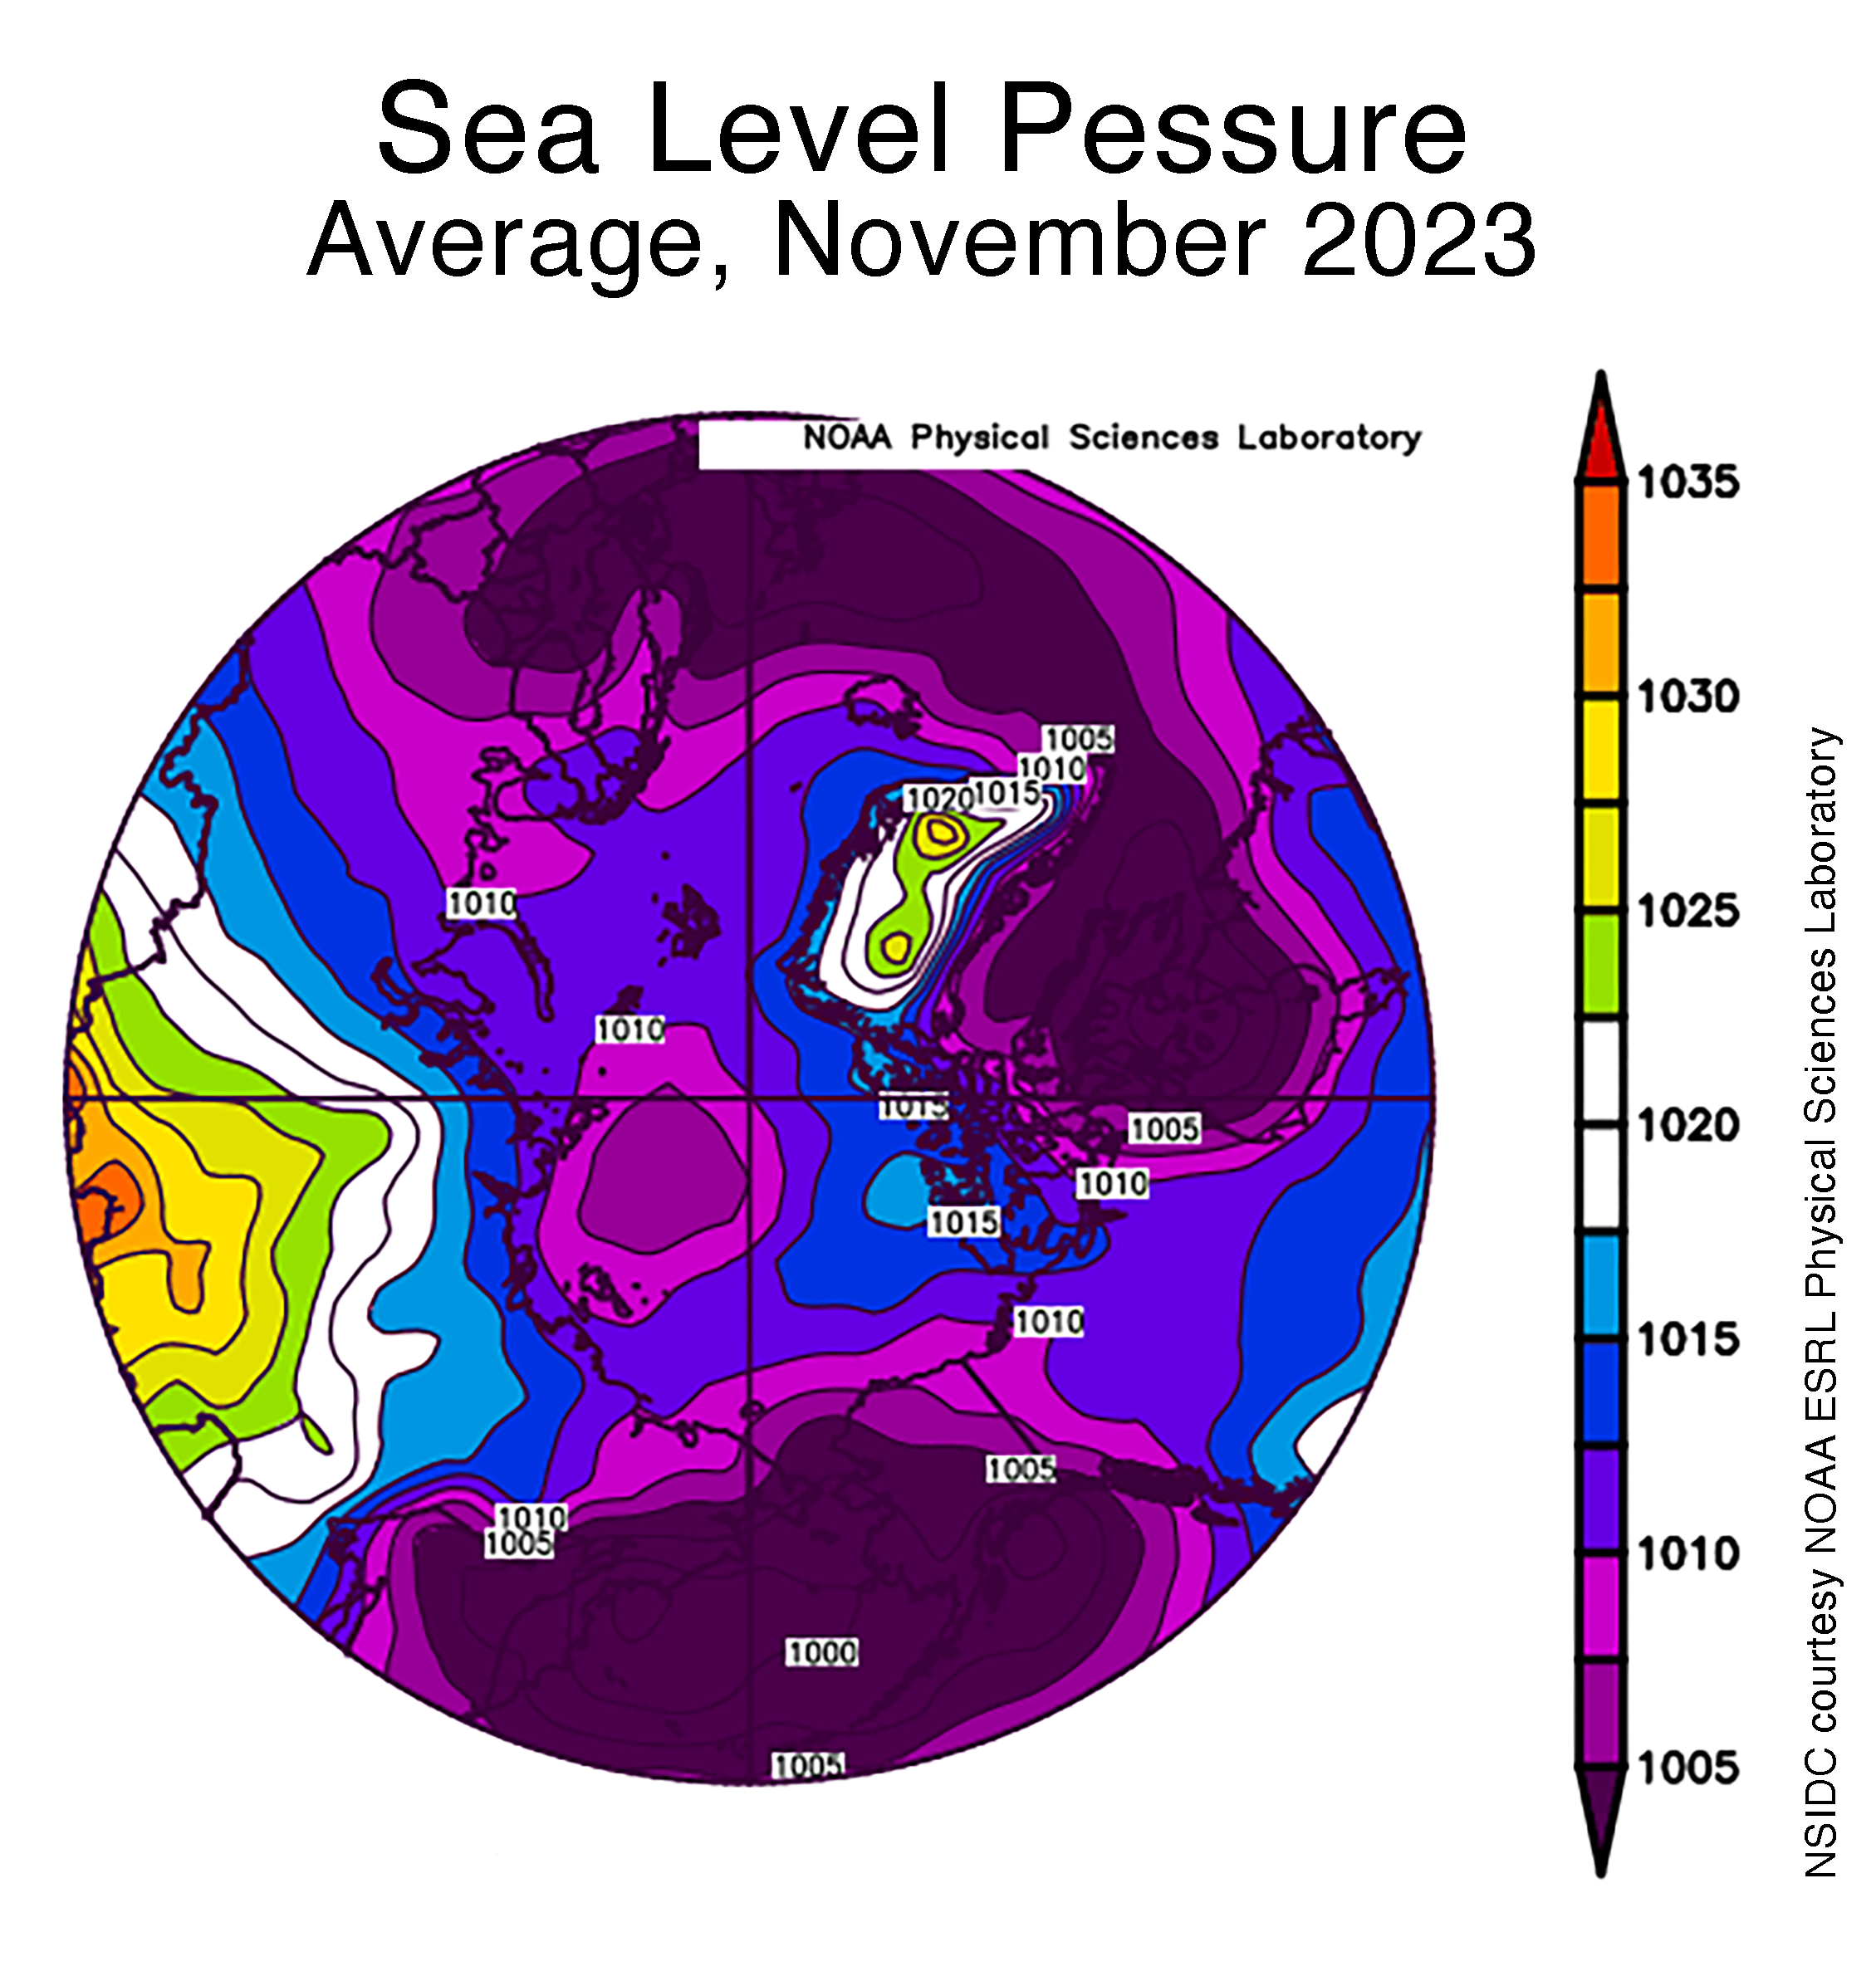
Figure 2b. This plot shows average sea level pressure in the Arctic in millibars for November 2023. Yellows and reds indicate high air pressure; blues and purples indicate low pressure.
Credit: NSIDC courtesy NOAA Earth System Research Laboratory Physical Sciences Laboratory
High-resolution image
Air temperatures over the Arctic Ocean at the 925 millibar level (about 2,500 feet above the surface) in November were broadly similar to those seen in October, with mostly above average warmth in and around the Canadian Archipelago of 4 to 5 degrees Celsius (7 to 9 degrees Fahrenheit) (Figure 2a). Temperatures were modestly above average north of Greenland and stretching towards the Laptev and Kara Seas as well as the southern parts of the Beaufort Sea. The East Siberian Sea experienced near- to slightly-below average temperatures; temperatures were slightly below average over the Barents and Norwegian Seas.
The atmospheric circulation for November featured fairly strong low pressure centered near the North Pole, with strong low pressure also dominating the north Atlantic, Eurasia, Baffin Bay, and North America (Figure 2b).
November 2023 compared to previous years
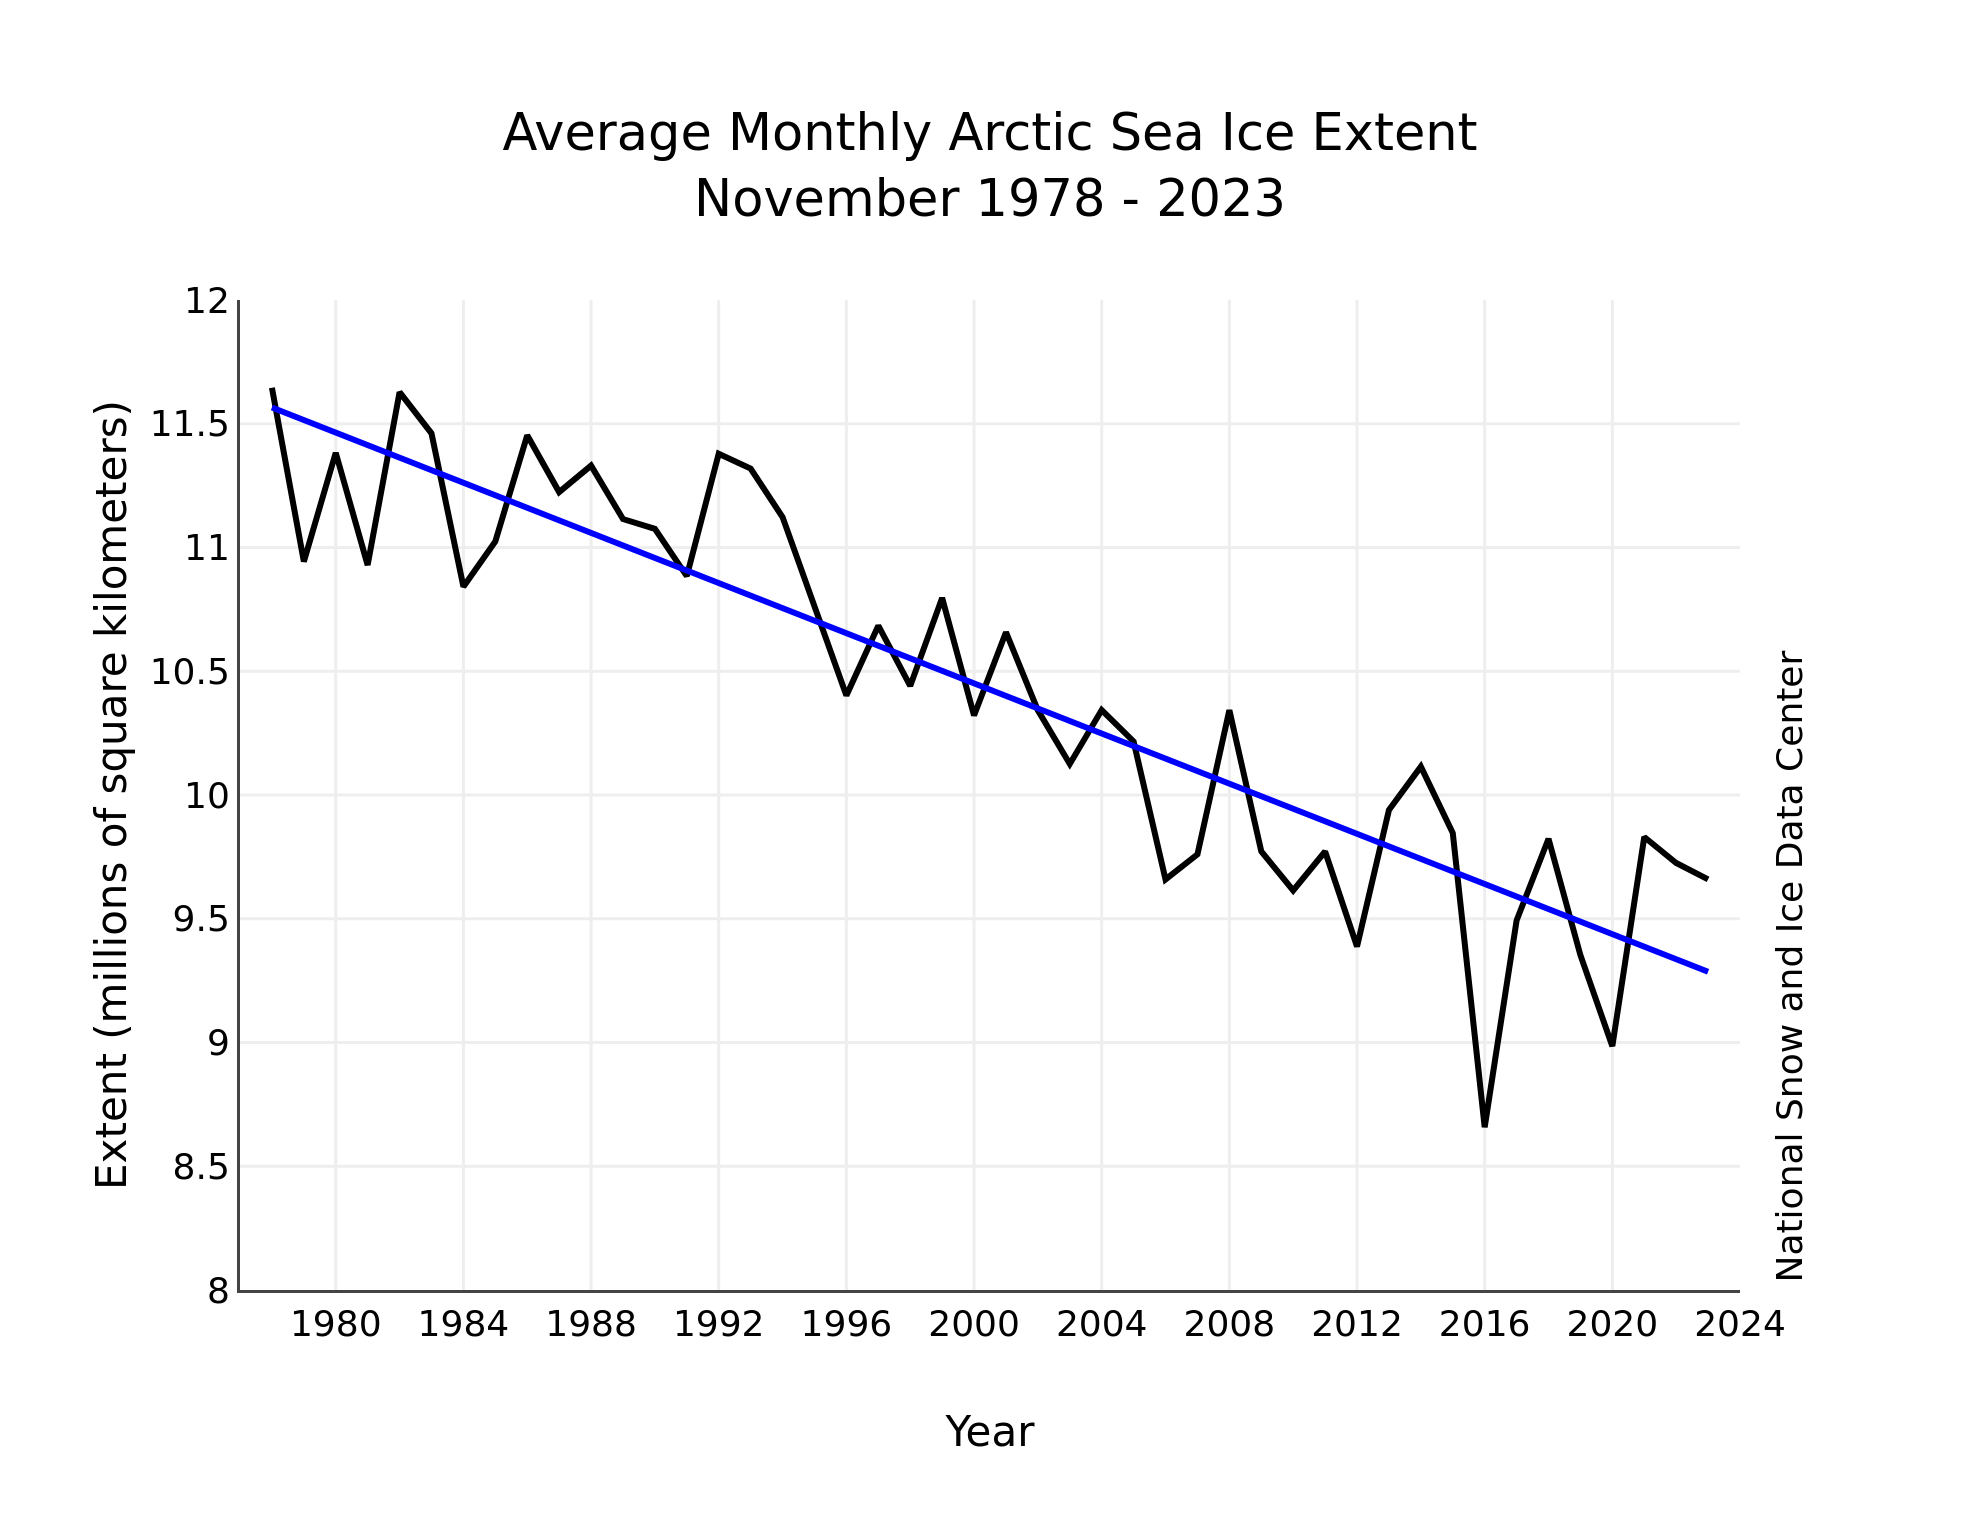
Figure 3. Monthly November ice extent for 1979 to 2023 shows a decline of 4.7 percent per decade.
Credit: National Snow and Ice Data Center
High-resolution image
The downward linear trend in Arctic sea ice extent for November over the 45-year satellite record is 50,600 square kilometers (19,500 square miles) per year, or 4.7 percent per decade relative to the 1981 to 2010 average (Figure 3). Based on the linear trend, November has lost 2.28 million square kilometers (880,000 square miles) of ice since 1979. This is 1.3 times the size of Alaska.
Rivers in the sky slow winter ice growth
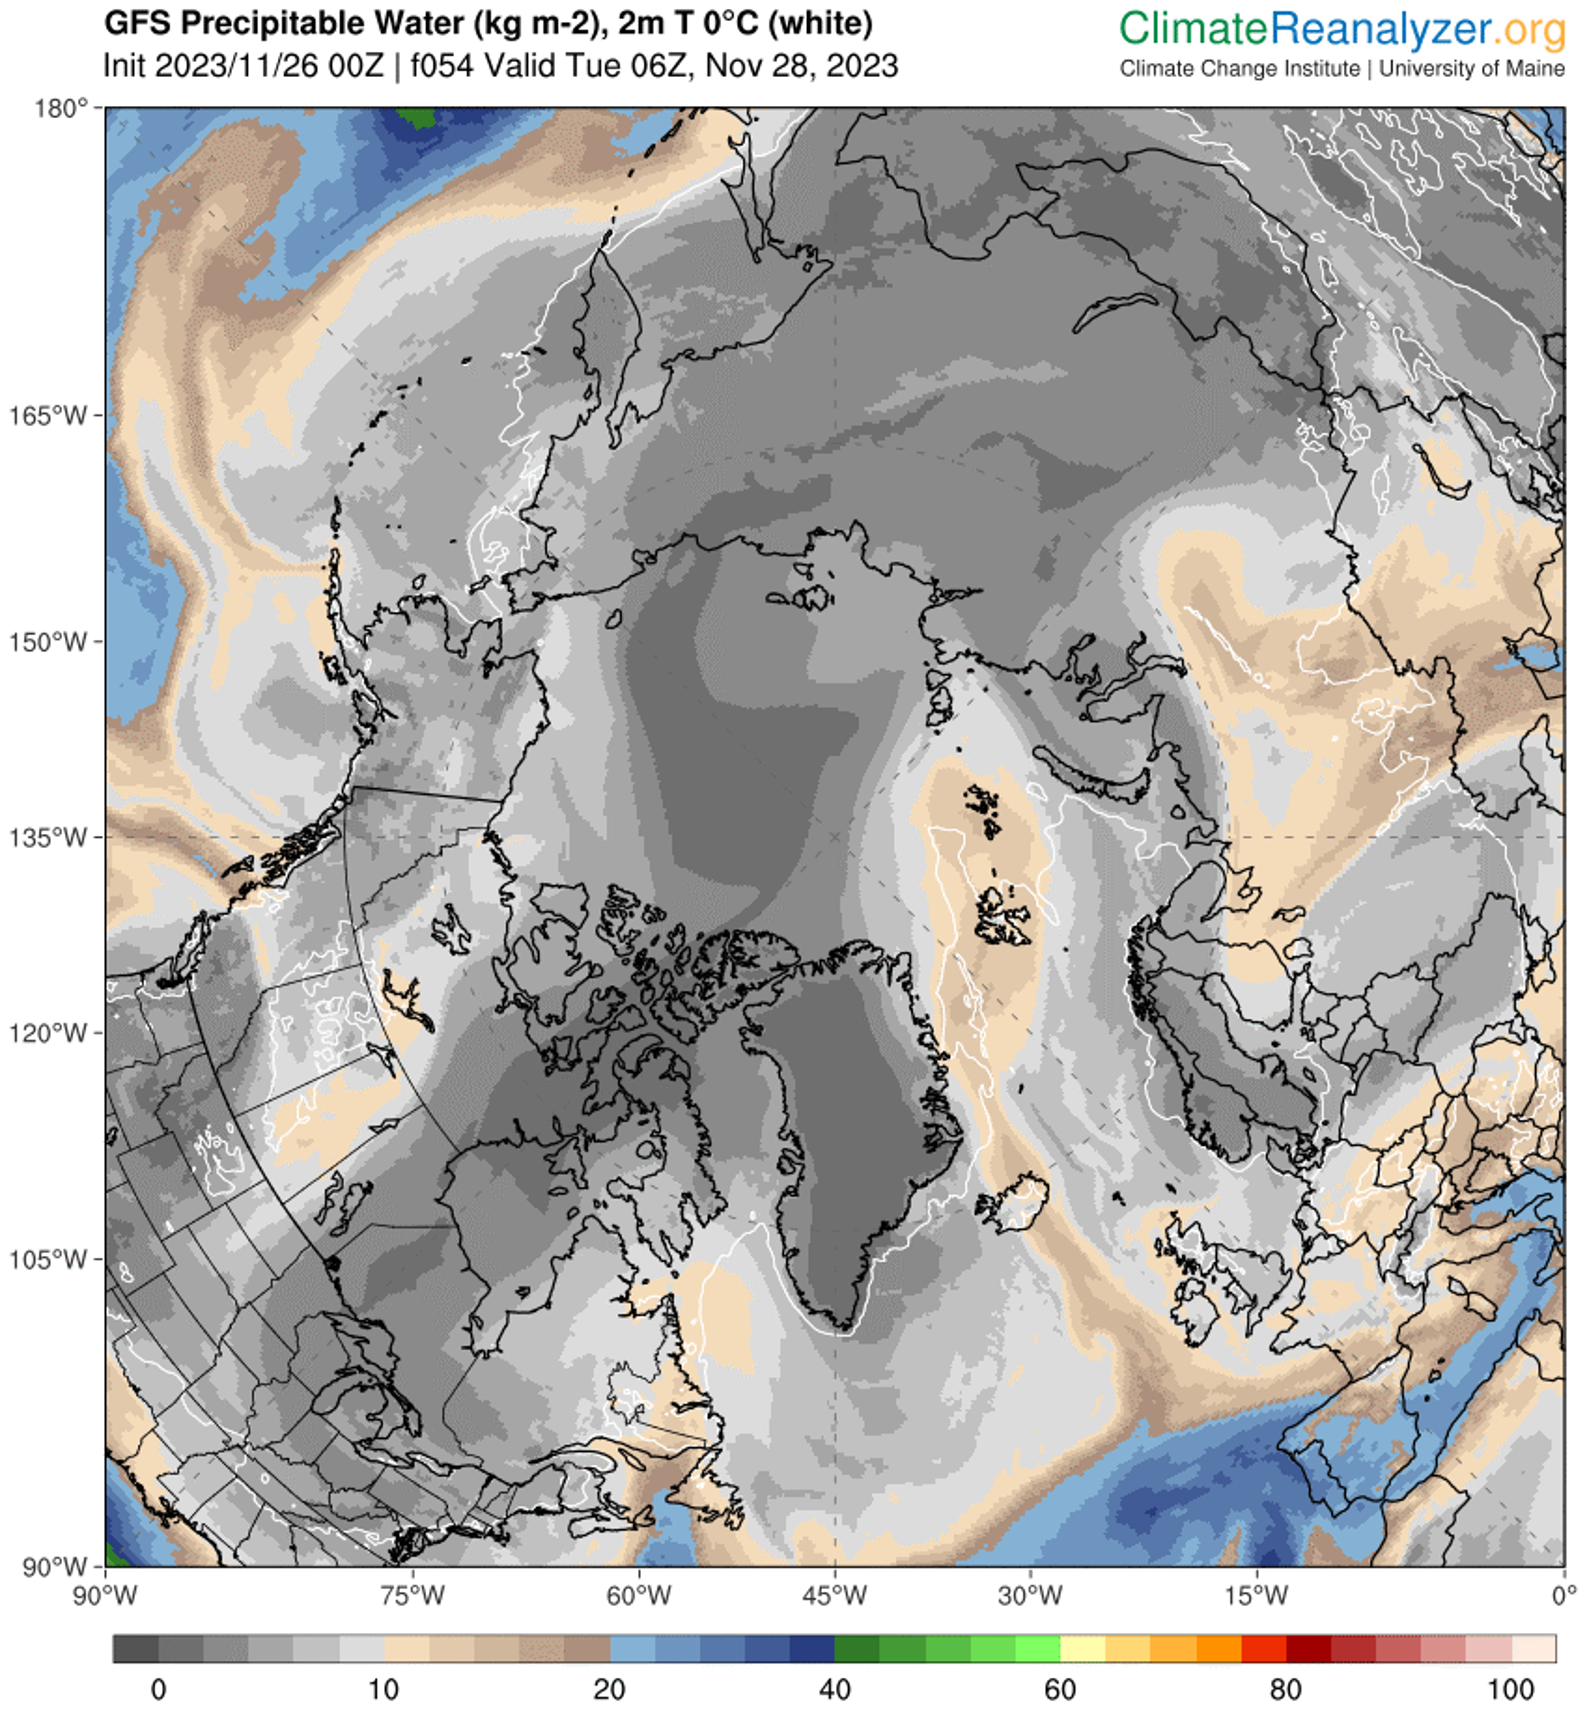
Figure 4a. This image from Climate Reanalyzer shows precipitable water (column water vapor) on November 26, 2023, from the National Oceanic and Atmospheric Administration (NOAA) Global Forecast System (GFS) model. While the Arctic atmosphere tends to be quite dry, an atmospheric river of high water vapor content (beige colors indicating 10 to 20 kilograms per square meter) is visible along the east coast of Greenland and over Svalbard to the north.
Credit: Climate Reanalyzer
High-resolution image
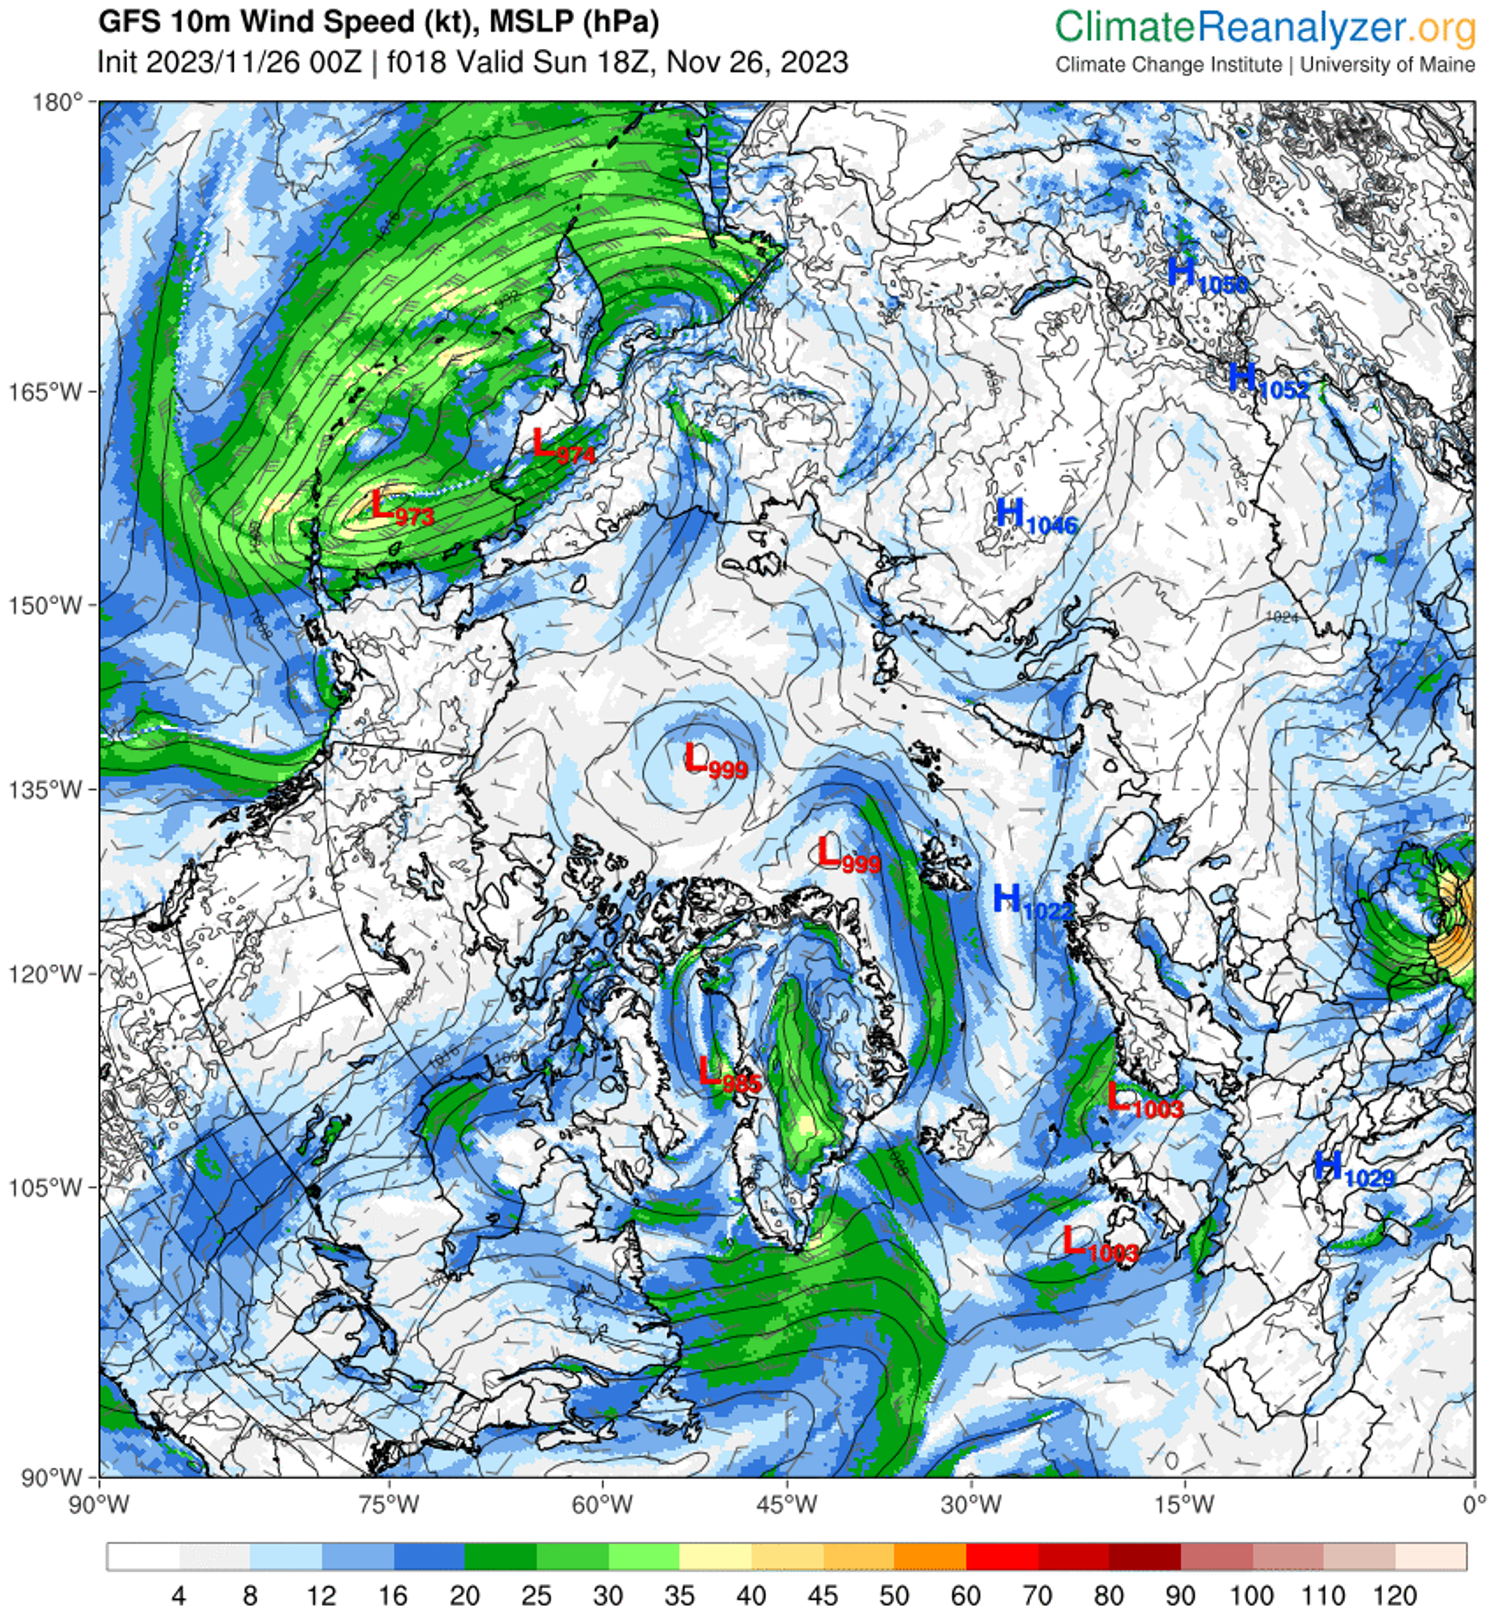
Figure 4b. This image from Climate Reanalyzer shows wind speed at 10 meters above the surface on November 26, 2023, from the National Oceanic and Atmospheric Administration (NOAA) Global Forecast System (GFS) model. Higher winds speeds (blue and green shades, 15 to 30 knots), which are from the south, are seen in the same area as the atmospheric river of high water vapor content extending into the Arctic Ocean.
Credit: Climate Reanalyzer
High-resolution image
From November 21 to 28, a series of three extratropical cyclones followed a common track from the northeast coast of Greenland eastward along the northern edge of the Barents, Kara, and Laptev Seas. As each storm moved into the Arctic Ocean, it merged with its predecessors, creating a persistent cyclonic (counter clockwise) wind regime. The first and third of these storms originated in the Icelandic Low region before migrating up the east side of Greenland. The second storm originated just north of Greenland. Simultaneously, a center of high pressure developed over the ice-free part of the Barents Sea, becoming especially strong on November 26 to 28.
This combination of persistent low pressure to the north and west of Svalbard and a high-pressure center to the southeast created a strong, persistent flow from the south of relatively warm and moist air from the North Atlantic Ocean toward Svalbard, which then turned eastward along the marginal ice zone. This is seen as an extension of an atmospheric river into the Arctic. Atmospheric rivers are long narrow corridors that carry a large amount of water vapor. A recent study suggests that atmospheric rivers lead to ice loss by transporting warm, moist air into the Arctic that can limit sea ice growth. This is consistent with the observed pause in seasonal ice growth in late November.
A wetter and warmer Arctic
![Autumn (September, October, November [SON]) trends for sea ice concentration (SIC) (top row), surface air temperature (middle row), and specific humidity (bottom row). Column (a) shows the trends over the full 20-year period (2003-2022) of the AIRS instrument analyzed by Boisvert et al. (2023). Column (b) shows the trends over the first half of the record (2003-2012), and Column (c) shows the trends over the second half of the record (2013-2022). Image from Boisvert et al. (2023).](http://nsidc.org/arcticseaicenews/files/1999/12/WarmerArcticDecades.png)
Figure 5. The top row of maps shows trends for surface air temperature during Autumn (September, October, November [SON]), and the bottom row shows specific humidity during the same period. Column (a) shows the trends over the full 20-year period from 2003 to 2022 of the Atmospheric Infrared Sounder (AIRS) instrument analyzed by Boisvert et al. 2023. Column (b) shows the trends over the first half of the record from 2003 to 2012, and Column (c) shows the trends over the second half of the record from 2013 to 2022.
Credit: Boisvert et al. 2023
High-resolution image
Antarctic sea ice: race to the bottom
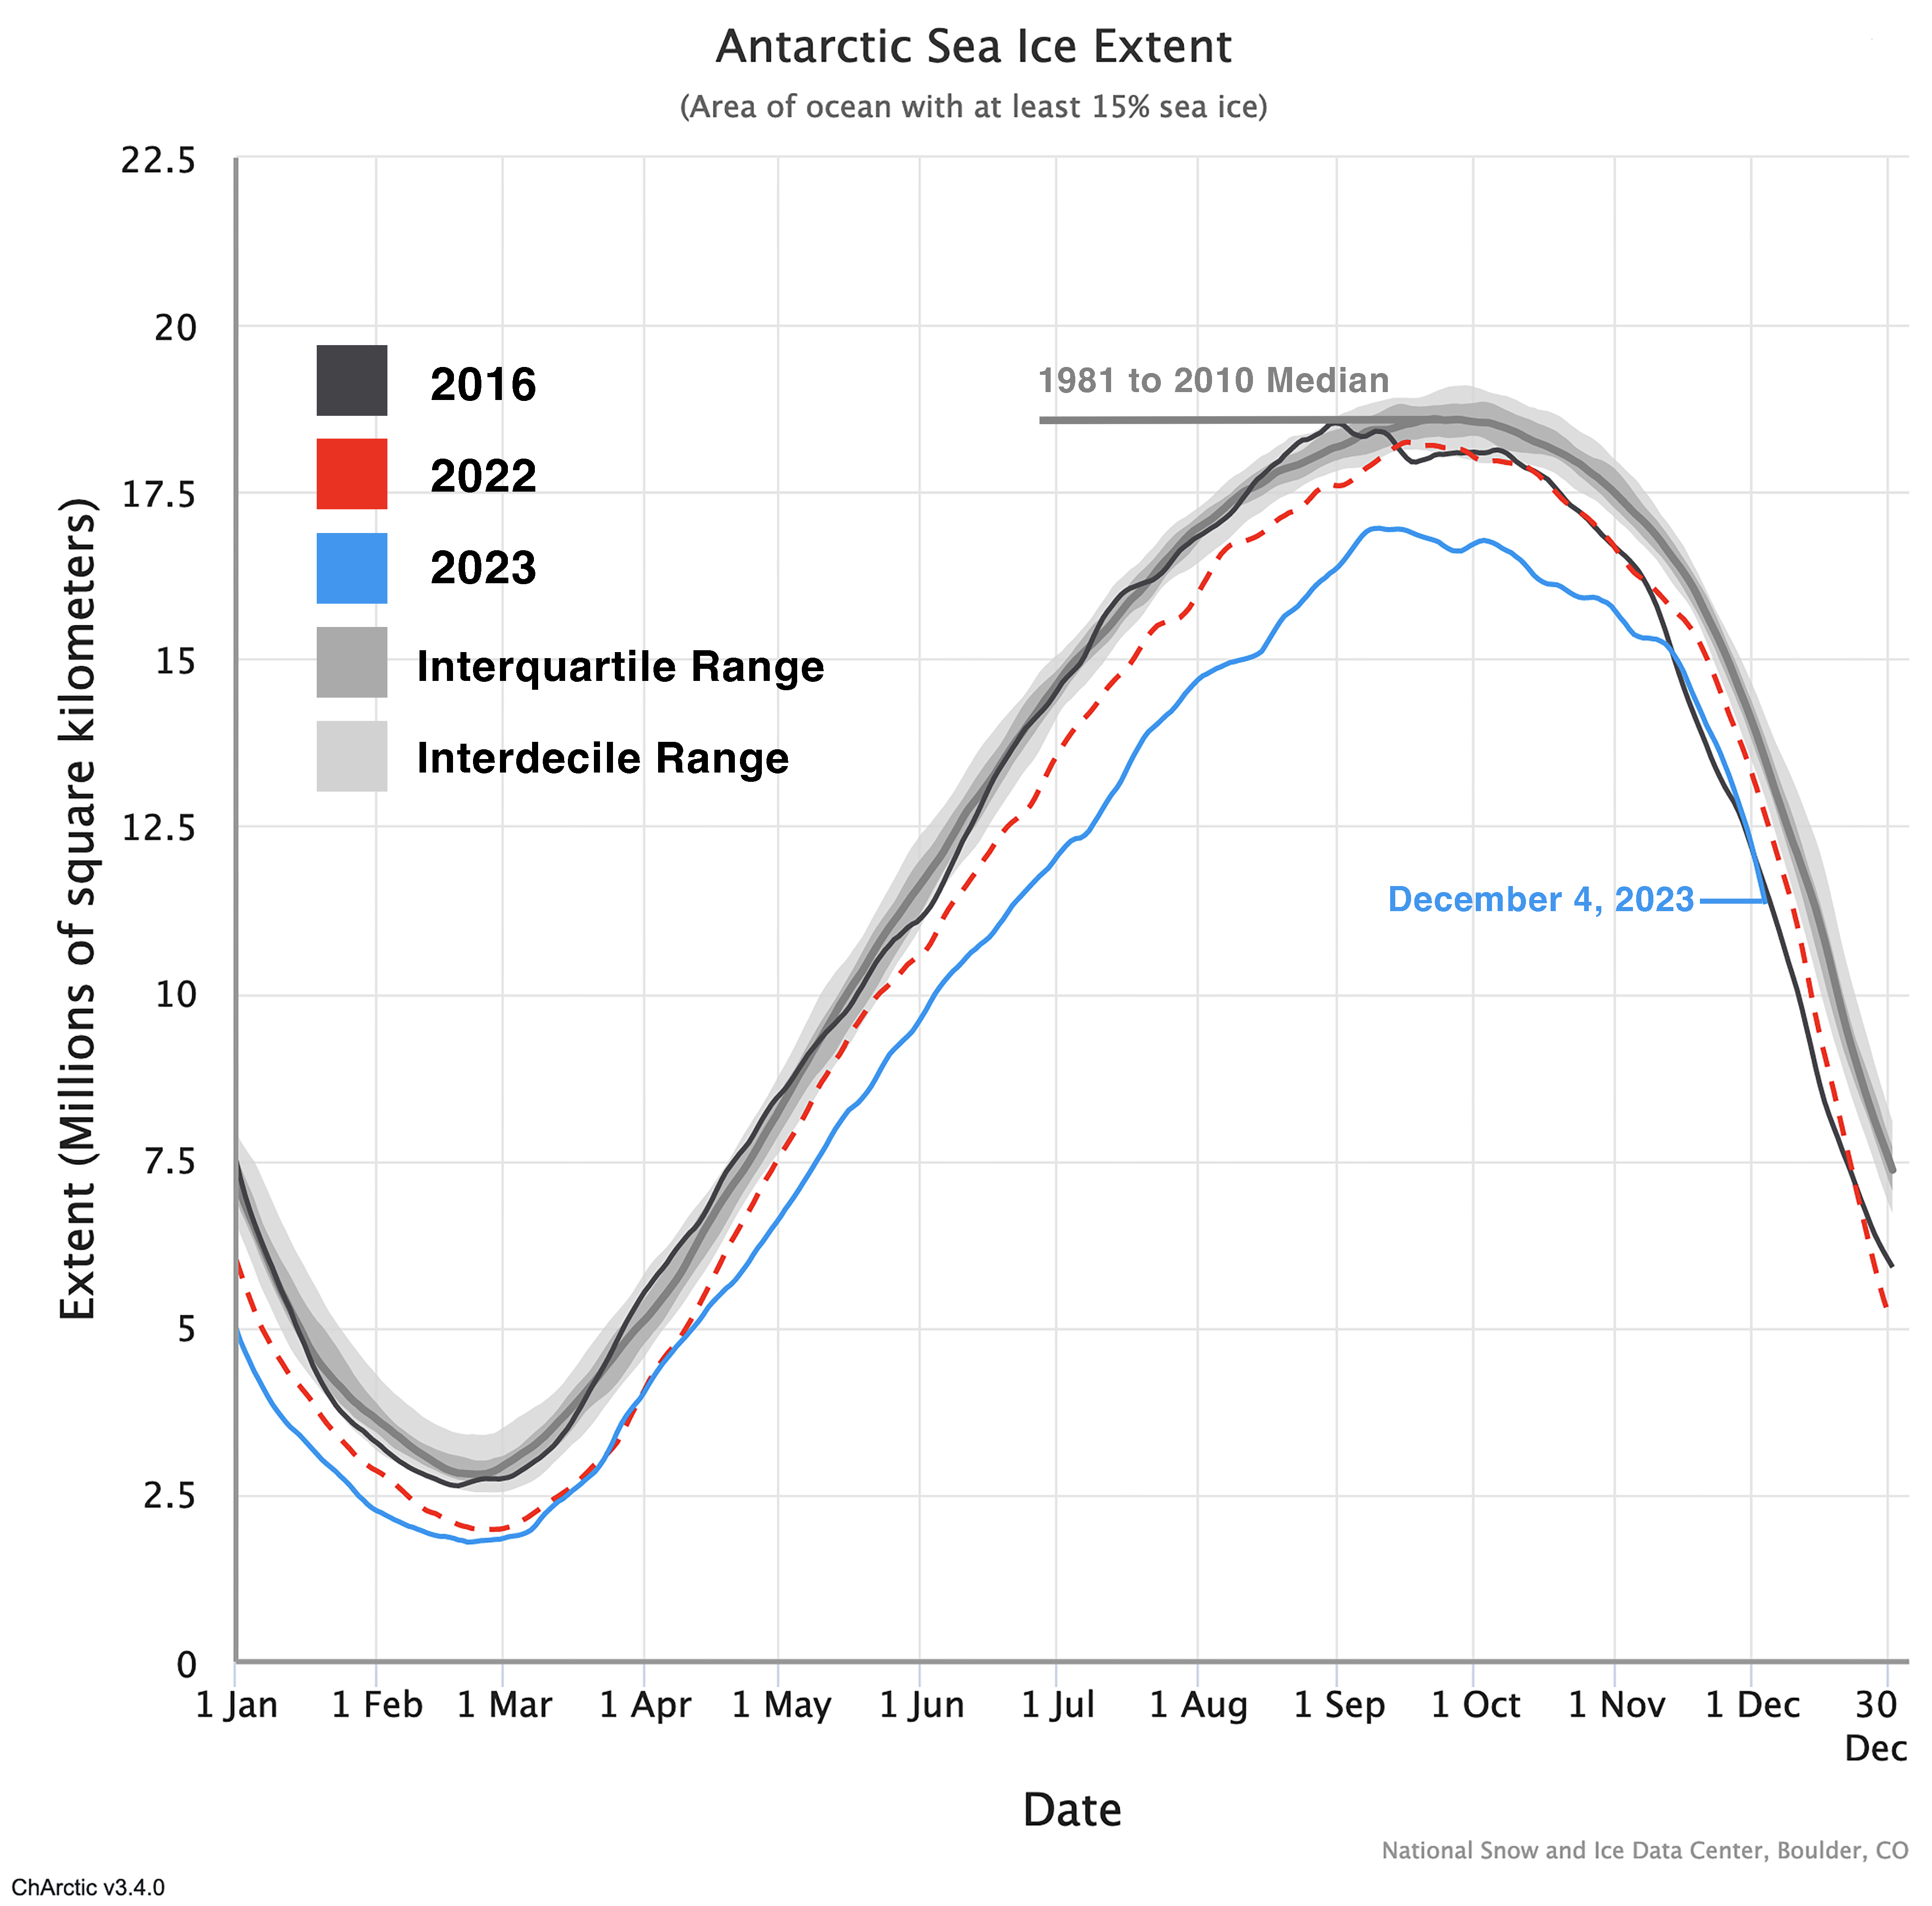
Figure 6a. The graph above shows Antarctic sea ice extent as of December 4, 2023, along with daily ice extent data for 2016 and 2022, the second lowest year. 2016 is shown in dark gray, 2022 in dashed red, and 2023 in blue. The 1981 to 2010 median is in dark gray. The gray areas around the median line show the interquartile and interdecile ranges of the data. Sea Ice Index data.
Credit: National Snow and Ice Data Center
High-resolution image
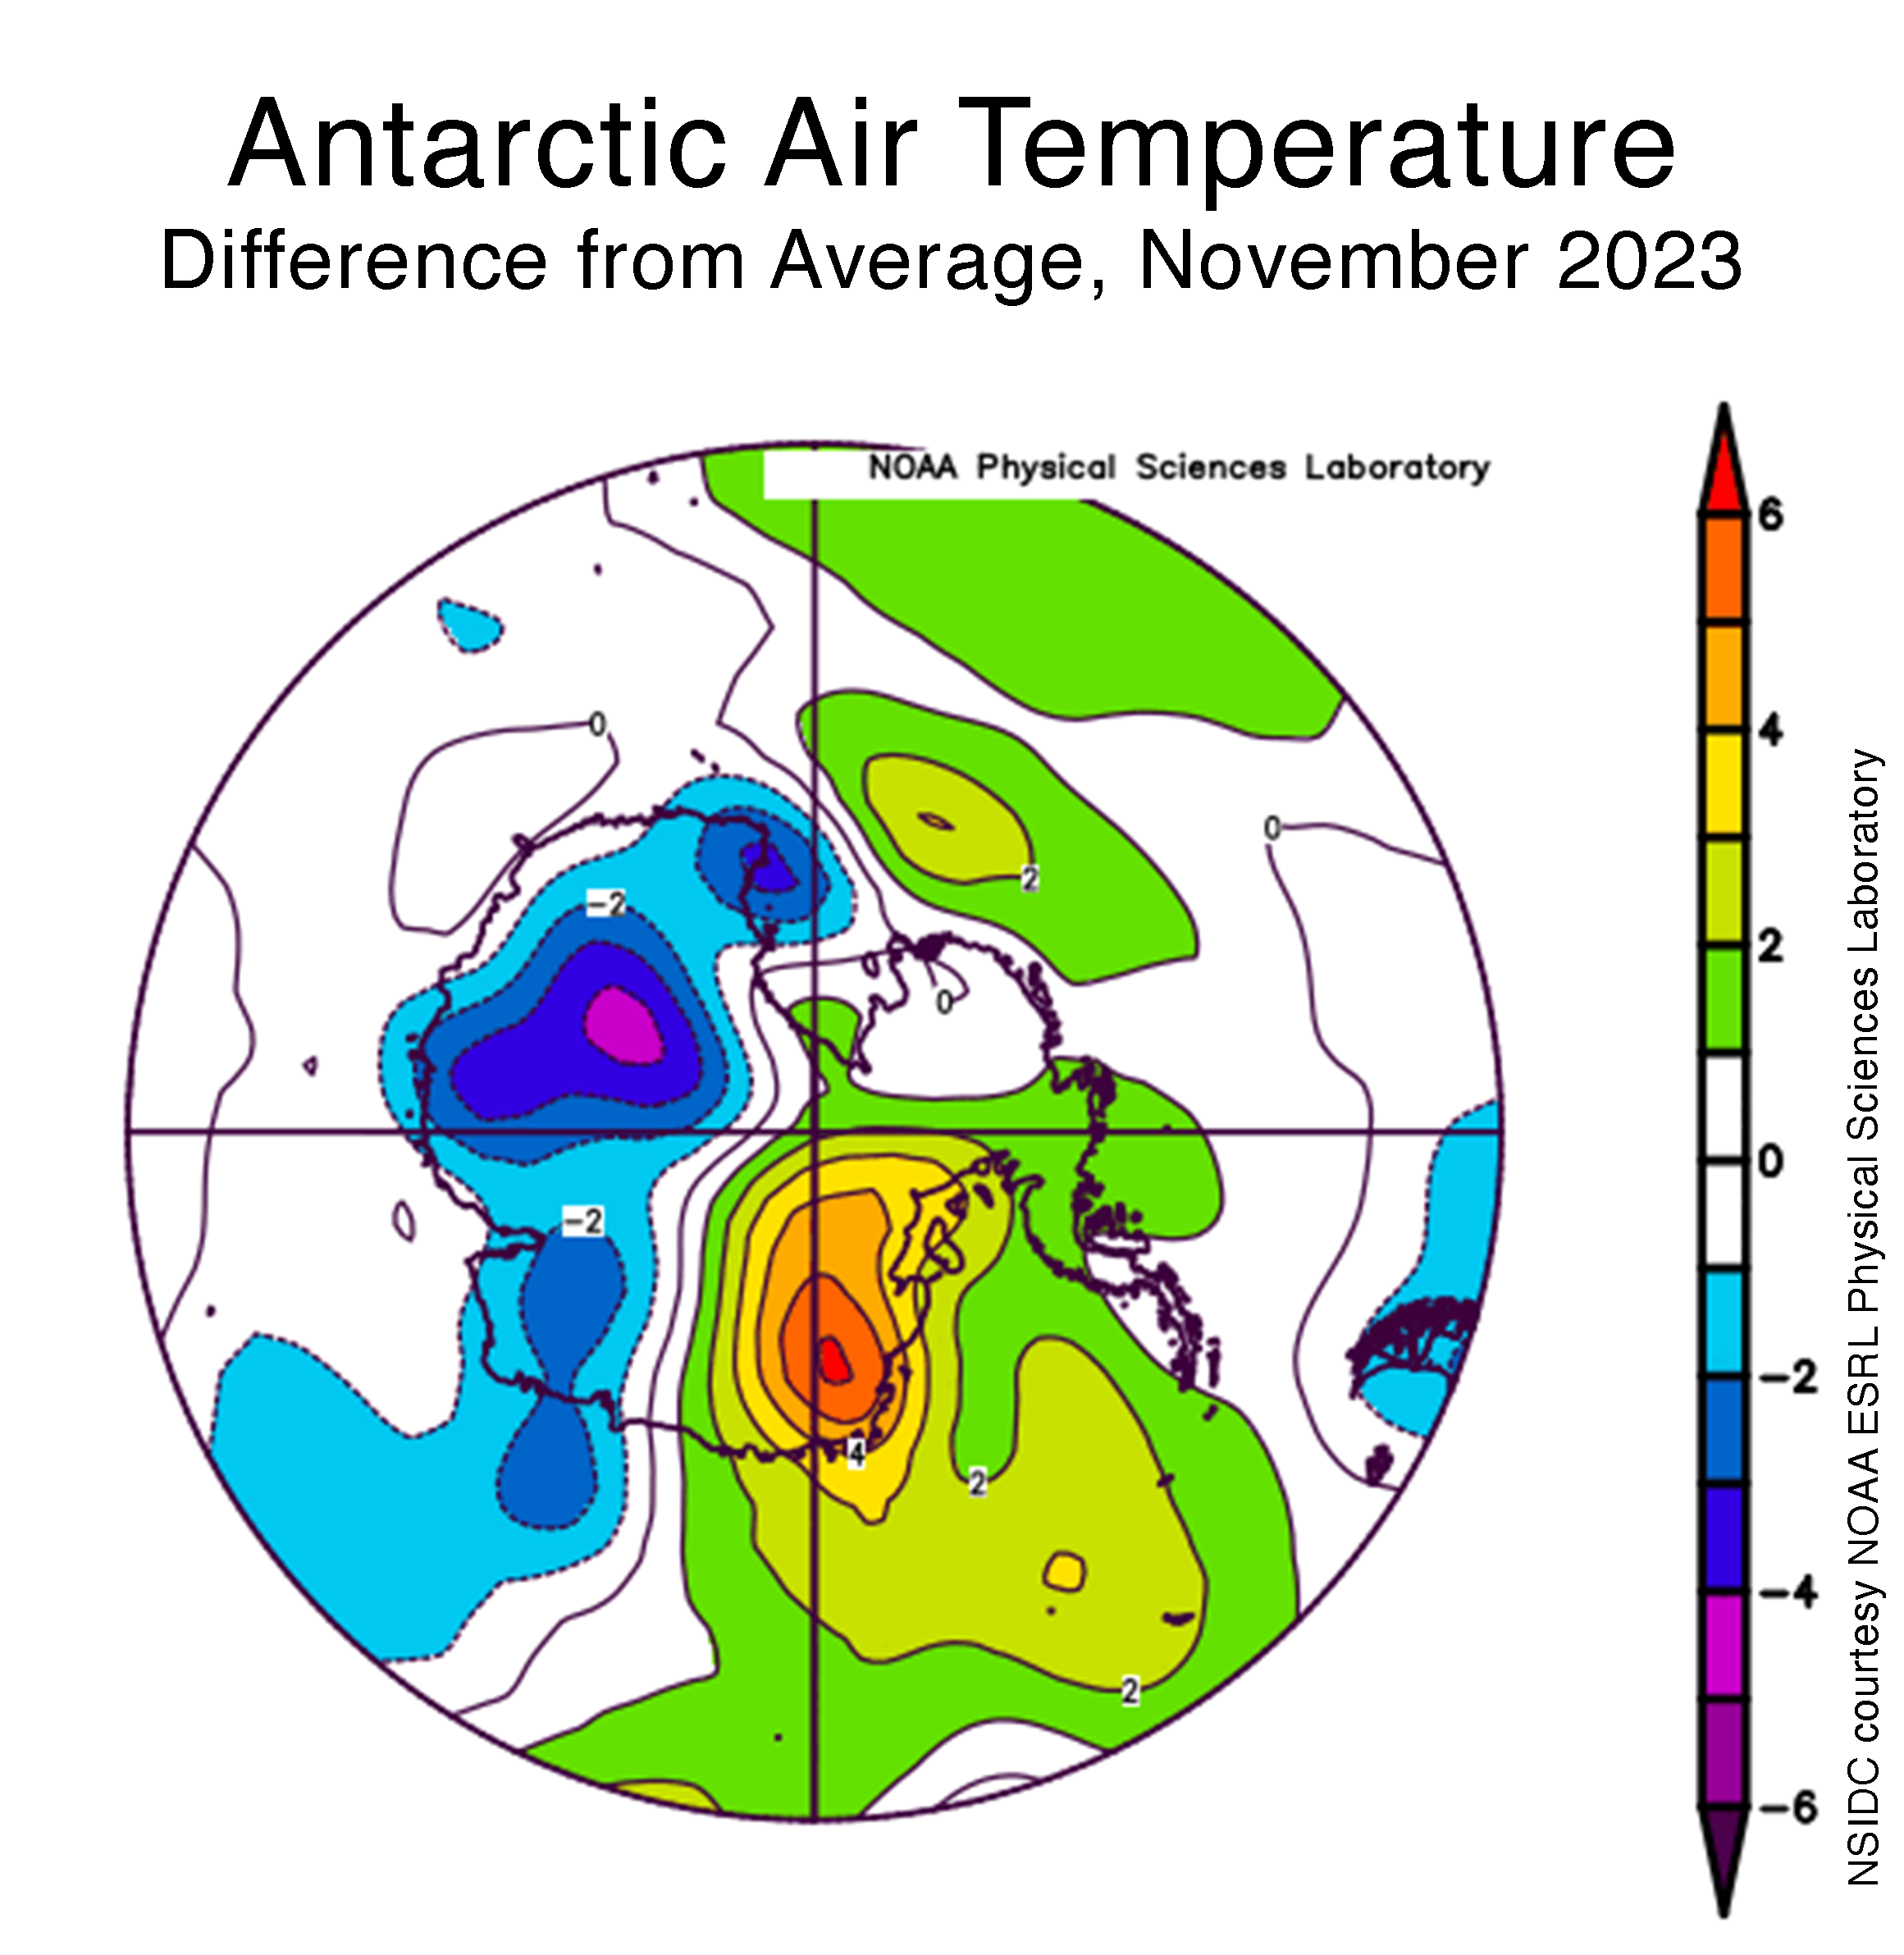
Figure 6b. This plot shows the departure from average air temperature in Antarctica at the 925 hPa level, in degrees Celsius, for November 2023. Yellows and reds indicate above average temperatures; blues and purples indicate below average temperatures.
Credit: NSIDC courtesy NOAA Earth System Research Laboratory Physical Sciences Laboratory
High-resolution image
The decline in Antarctic sea ice extent paused for a few days around November 9, which caused it to surpass the daily extents for November 2016 for most of the month, making it the second-lowest extent in the 45-year record. This was the first time that the 2023 extent was not the lowest in the record for each day since early May. However, the seasonal decline then picked up and closely followed the path of the record low 2016 daily extents, remaining slightly above but close to the 2016 daily values (Figure 6a). At month’s end, ice extent remained persistently low in the Weddell, Cosmonaut, and Ross Seas, but above the 1981 to 2010 average in the Bellingshausen and Amundsen Seas. Unusually warm conditions over the eastern Weddell Sea and strong offshore winds just to the east (Dronning Maud Land coast) caused retreat of ice along that coast and opened a wide shore polynya in that area (Figure 6b).
Further reading
Boisvert, L., C. Parker, and E. Valkonen. 2023. A warmer and wetter Arctic: Insights from a 20-years AIRS record. Journal of Geophysical Research: Atmospheres, 128, e2023JD038793. doi:10.1029/2023JD038793.
Fritts, R. 2023. Rivers in the sky are hindering winter Arctic sea ice recovery. Eos,104,13 March 2023. doi:10.1029/2023EO230098.
Zhang, P., G. Chen, M. Ting, and et al. 2023. More frequent atmospheric rivers slow the seasonal recovery of Arctic sea ice. Nature Climate Change, 13, 266–273. doi:10.1038/s41558-023-01599-3.

