The year 2019 saw an early melt onset and high sea surface temperatures during summer in the Beaufort and Chukchi Seas. The September minimum extent ended up tied with 2007 and 2016 for second lowest in the satellite record. Autumn freeze up was slow. In December, the Chukchi Sea finally completely refroze, Hudson Bay iced over, and sea ice extended south into the Bering Sea. The year 2019 still ended up with low extent in the Bering Sea. Taking a longer view, the defining feature of the decade of the 2010s was consistently low Arctic sea ice extent compared to long-term averages.
Overview of conditions
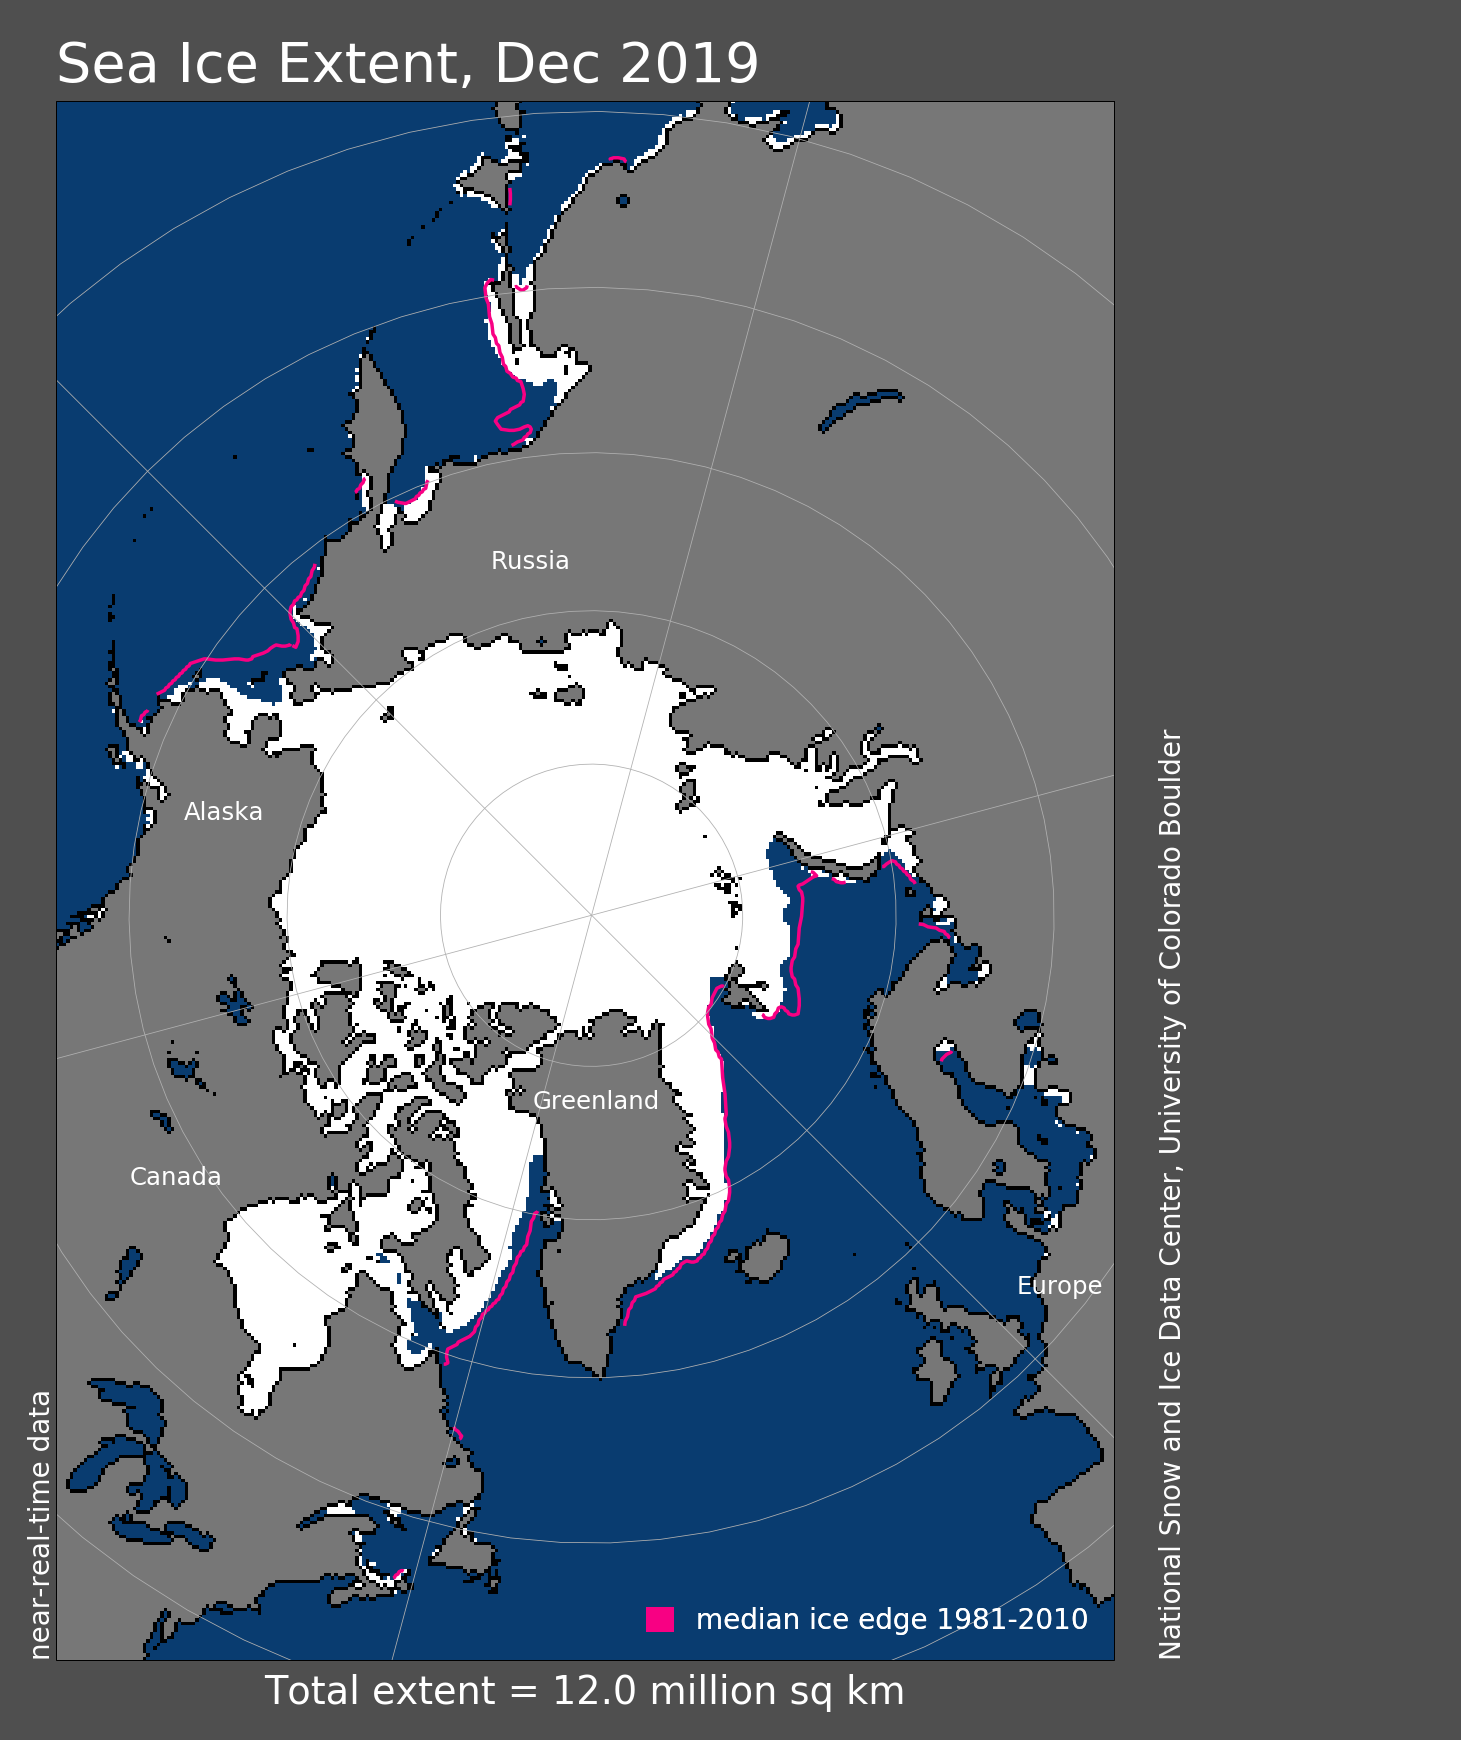
Figure 1. Arctic sea ice extent for December 2019 was 11.95 million square kilometers (4.61 million square miles). The magenta line shows the 1981 to 2010 average extent for that month. Sea Ice Index data. About the data
Credit: National Snow and Ice Data Center
High-resolution image
At the close of December, sea ice growth had gained enough ground for daily extent to rank only seventh lowest, the highest at this time since 2014. Extent averaged for the month was 11.95 million square kilometers (4.61 million square miles), tied with 2006 as the fifth lowest December extent in the satellite record. This was 890,000 square kilometers (344,000 square miles) below the 1981 to 2010 December average and 490,000 square kilometers (189,000 square miles) above the record low mark for December set in 2016.
Total ice extent is less variable this time of year as compared to summer. The reason is that over most longitudes, ice extends to the coast and, thus, cannot grow southward. The only place where extent varies is where the southern limit of ice is not bound by land—the Bering Sea, Sea of Okhotsk, East Greenland Sea, Barents Sea, and Baffin Bay. Other than the East Greenland Sea, which is essentially at average levels, these other regions have slightly below average extents. The Chukchi Sea finally froze up completely on December 24. Only 2016 and 2017 saw open water in the Chukchi later in the season.
Conditions in context
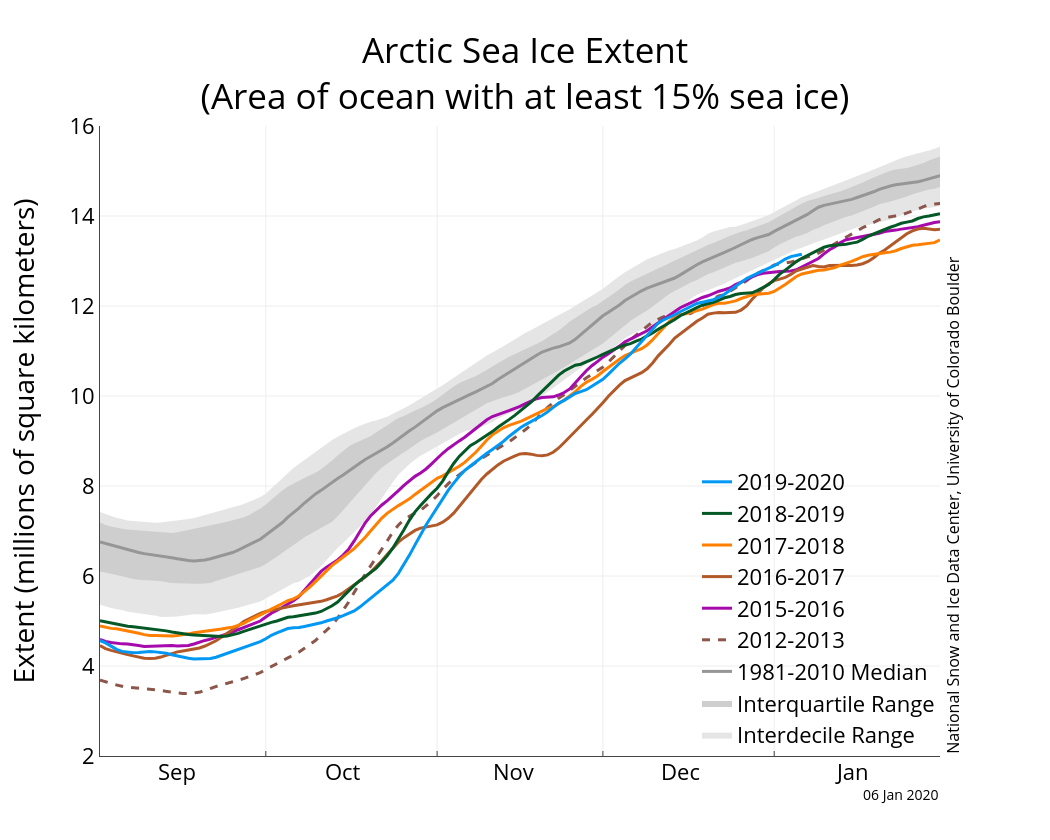
Figure 2a. The graph above shows Arctic sea ice extent as of January 6, 2020, along with daily ice extent data for four previous years and the record low year. 2019 to 2020 is shown in blue, 2018 to 2019 in green, 2017 to 2018 in orange, 2016 to 2017 in brown, 2015 to 2016 in purple, and 2012 to 2013 in dotted brown. The 1981 to 2010 median is in dark gray. The gray areas around the median line show the interquartile and interdecile ranges of the data. Sea Ice Index data.
Credit: National Snow and Ice Data Center
High-resolution image

Figure 2b. This plot shows the departure from average air temperature in the Arctic at the 925 hPa level, in degrees Celsius, for December 2019. Yellows and reds indicate higher than average temperatures; blues and purples indicate lower than average temperatures.
Credit: NSIDC courtesy NOAA Earth System Research Laboratory Physical Sciences Division
High-resolution image
December 2019 sea ice grew by an average of 82,100 square kilometers (31,700 square miles) per day. This is faster than the 1981 to 2010 average gain of 64,100 square kilometers (24,700 square miles per day) and is the third fastest December ice growth rate in the satellite record, behind 2006 and 2016. Such fast growth is not surprising. There was considerable ocean heat, particularly in the Chukchi Sea, which delayed freeze up. When the Chukchi waters finally lost their heat, the Arctic was in 24-hour darkness and the cold atmosphere allowed ice to grow rapidly.
Temperatures at the 925 mb level (about 2,500 feet above sea level) were above average over most of the Arctic Ocean. As expected due to continued open water during much of the month, the Chukchi Sea was particularly warm, up to 5 degrees Celsius (9 degrees Fahrenheit) above average (Figure 2b). However, temperatures north of Greenland were also 5 degrees Celsius (9 degrees Fahrenheit) above average. This may be related to strong low pressure over Scandinavia combined with higher than average pressure over the central Arctic Ocean, acting to funnel in warm air from the south.
December 2019 compared to previous years
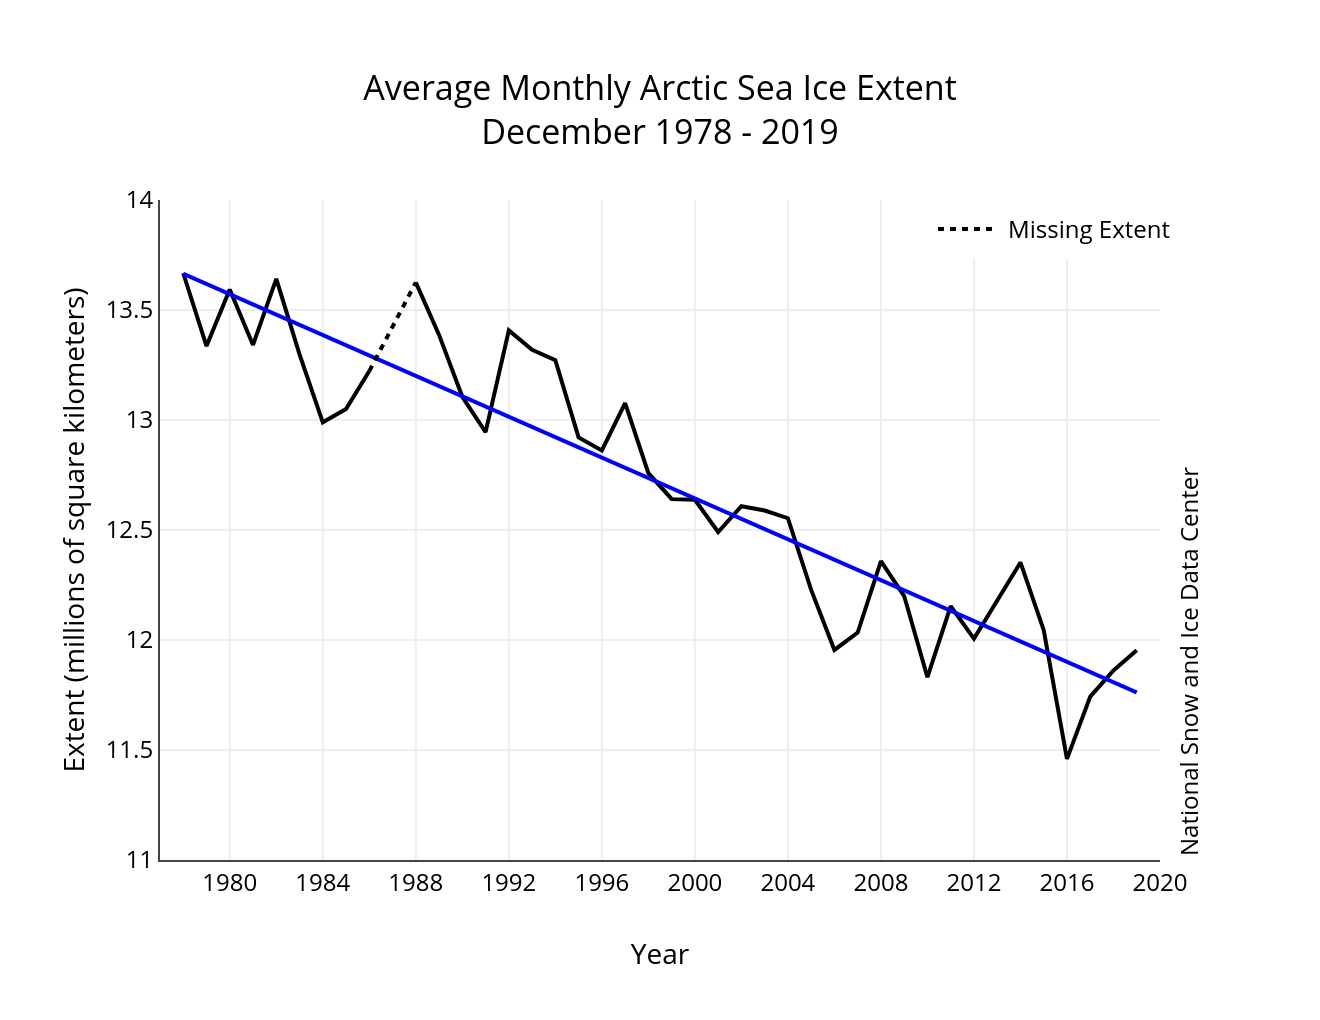
Figure 3. Monthly December ice extent for 1979 to 2019 shows a decline of 3.6 percent per decade.
Credit: National Snow and Ice Data Center
High-resolution image
Including 2019, the linear rate of decline for December ice extent is 3.6 percent per decade. This corresponds to a trend of 46,500 square kilometers (18,000 square miles) per year, which is roughly twice the size of the state of New Jersey. Over the 41-year satellite record, the Arctic has lost about 1.9 million square kilometers (734,000 square miles) of ice in December, based on the difference in linear trend values in 2019 and 1979. This is comparable to the size of Alaska and California combined.
The Arctic Report Card and a view from the north
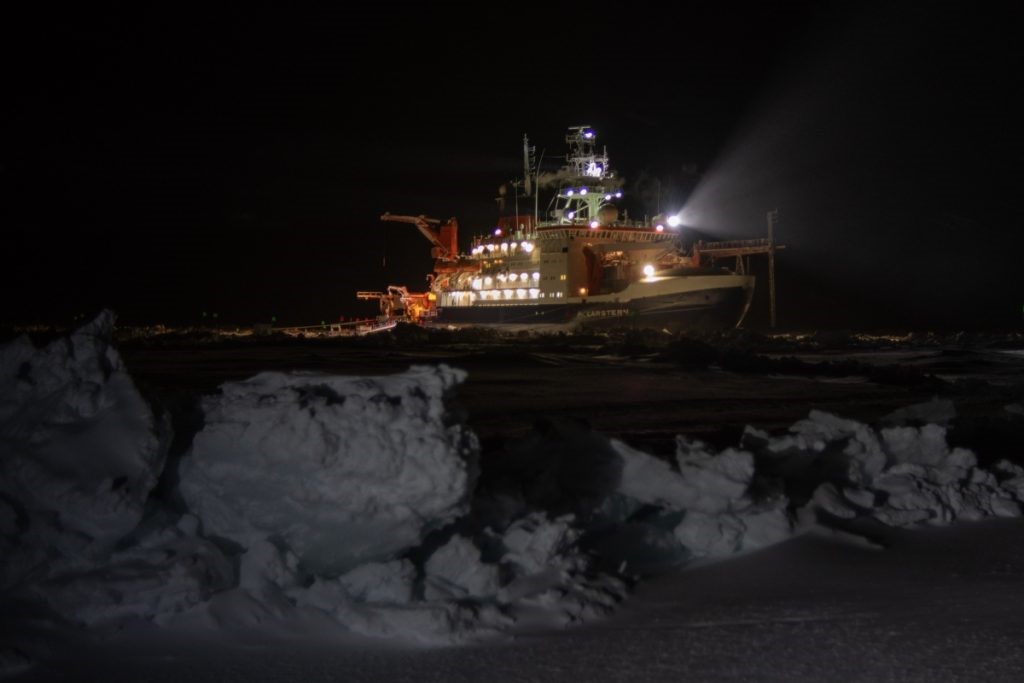
Figure 4. This photo shows the RV Polarstern, the German icebreaker that is frozen into Arctic sea ice during the Multidisciplinary drifting Observatory for the Study of Arctic Change expedition.
Photo credit: Alfred-Wegener-Institut/Esther Horvath
High-resolution image
On December 10, the National Oceanic and Atmospheric Administration (NOAA) 2019 Arctic Report Card was released at the American Geophysical Union Fall Meeting in San Francisco. The report focuses on conditions over the past year in the Arctic. One of the primary topics presented was the impact of low sea ice extent and other changes in the Arctic on Indigenous Peoples, who for the first time contributed directly to the report.
In mid-December, NSIDC senior research scientist and ASINA-contributor Julienne Stroeve joined the second leg of the Multidisciplinary drifting Observatory for the Study of Arctic Change (MOSAiC) expedition. She is now aboard the RV Polarstern, a German icebreaker that is frozen into sea ice north of Siberia, and she will stay on the ship through mid-February. The ship will remain locked in sea ice for a year, hosting several hundred scientists studying the ice, the atmosphere, and the ocean and its biogeochemistry as it drifts across the Arctic Ocean toward Greenland. Stroeve reports that as of January 4, 2020, the ship is located at 87 degrees N and 115 degrees E, about 335 kilometers (208 miles) from the pole. Air temperatures have ranged between -25 to -35 degrees Celsius (-13 to -31 degrees Fahrenheit), with a wind chill of -55 degrees Celsius (-67 degrees Fahrenheit) at times. The ship has been enveloped in complete darkness since mid-October, and the sun will not rise above the horizon until mid-March.
Stroeve is part of the “Remote Sensing City” group, a team that is using passive and active microwave instruments to study the sea ice and to gather improved information on sea ice thickness and snow depth. The extreme conditions of the far north have offered unique challenges to the scientists, including the arrival of a major storm that opened up a lead directly under their research site. The storm endangered the group’s equipment, though they were luckily able to move their instruments to safer ice. The instruments are currently situated on multiyear ice but the group is considering moving them to first-year ice to obtain data on salinated ice and snow. Moving the instruments and cables to a new site would require a major effort from the group, but gathering data from first-year ice would be valuable.
The expedition can be followed via the MOSAiC website as well as through a blog written by our Cooperative Institute for Research in Environmental Sciences (CIRES) colleague, Matthew Shupe, who is an atmospheric scientist and a co-coordinator of the MOSAiC project.
The southern view
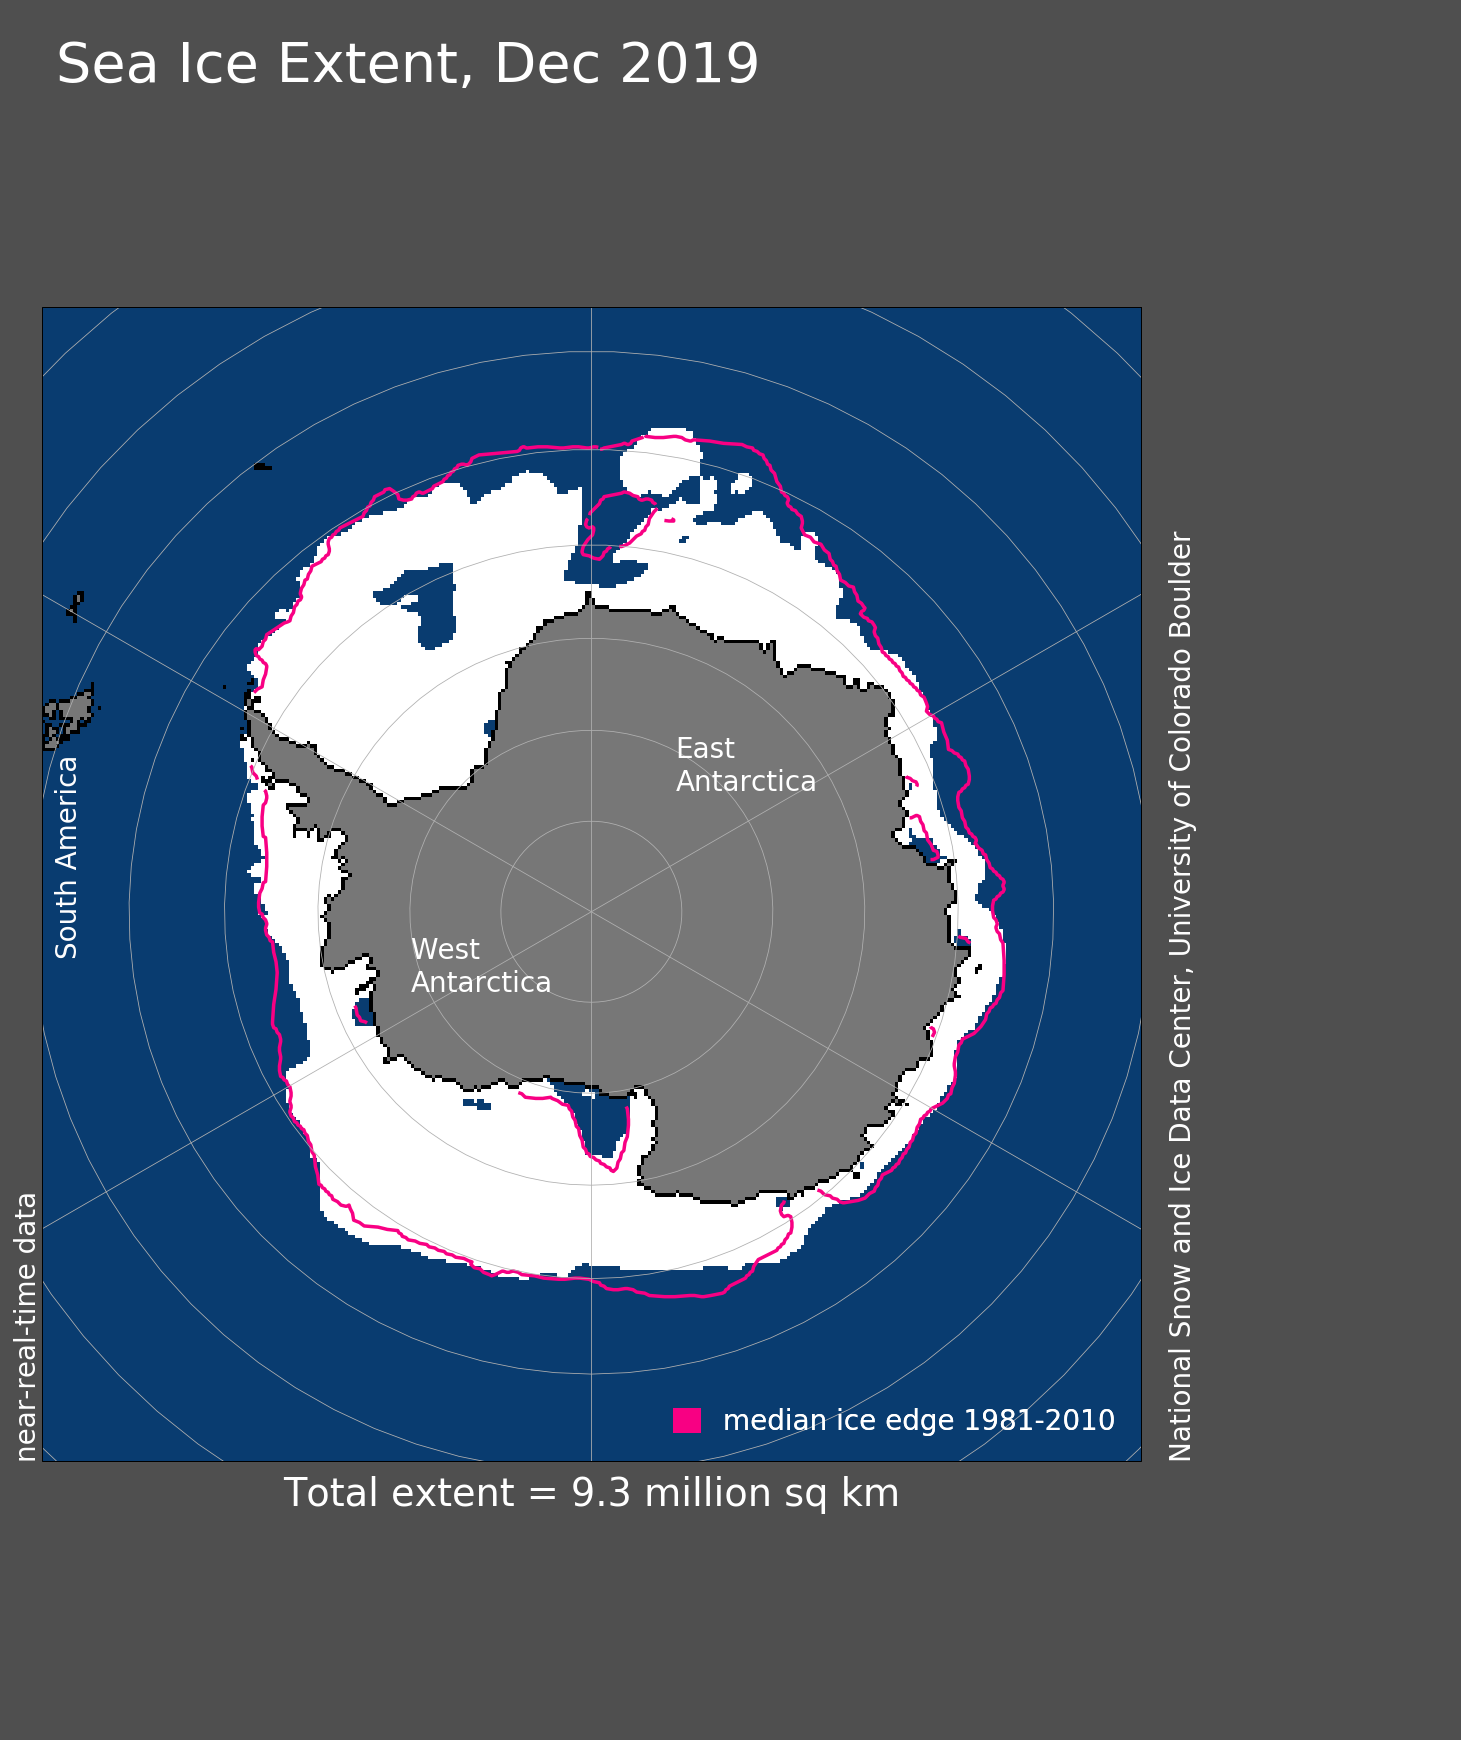
Figure 5. Antarctic sea ice extent for December 2019 was 9.30 million square kilometers (3.59 million square miles). The orange line shows the 1981 to 2010 average extent for that month. Sea Ice Index data. About the data
Credit: National Snow and Ice Data Center
High-resolution image
In the Southern Hemisphere, the summer ice loss rate slowed somewhat during the month. Daily sea ice extent remains below average, but is well above the record low levels seen in 2018. The December monthly average extent was 9.30 million square kilometers (3.59 million square miles). This is the fifth lowest December extent in the satellite record, above the record low mark set in 2016 as well as 2018, 1982, and 1979. Regionally, there was markedly low extent in the eastern Weddell Sea, while extent in the sector between the Ross and Amundsen Seas was well above average. Slightly above-average extent remained along much of the East Antarctic coast.
CIRES scientist and ASINA-contributor Ted Scambos is currently in Antarctica studying Thwaites Glacier as part of the International Thwaites Glacier Collaboration, a five-year partnership between the US National Science Foundation and the UK Natural Environment Research Council. Scambos is the lead American scientific coordinator for the mission and a member of the Thwaites-Amundsen Regional Survey and Network (TARSAN) project team.
2019: The year in review
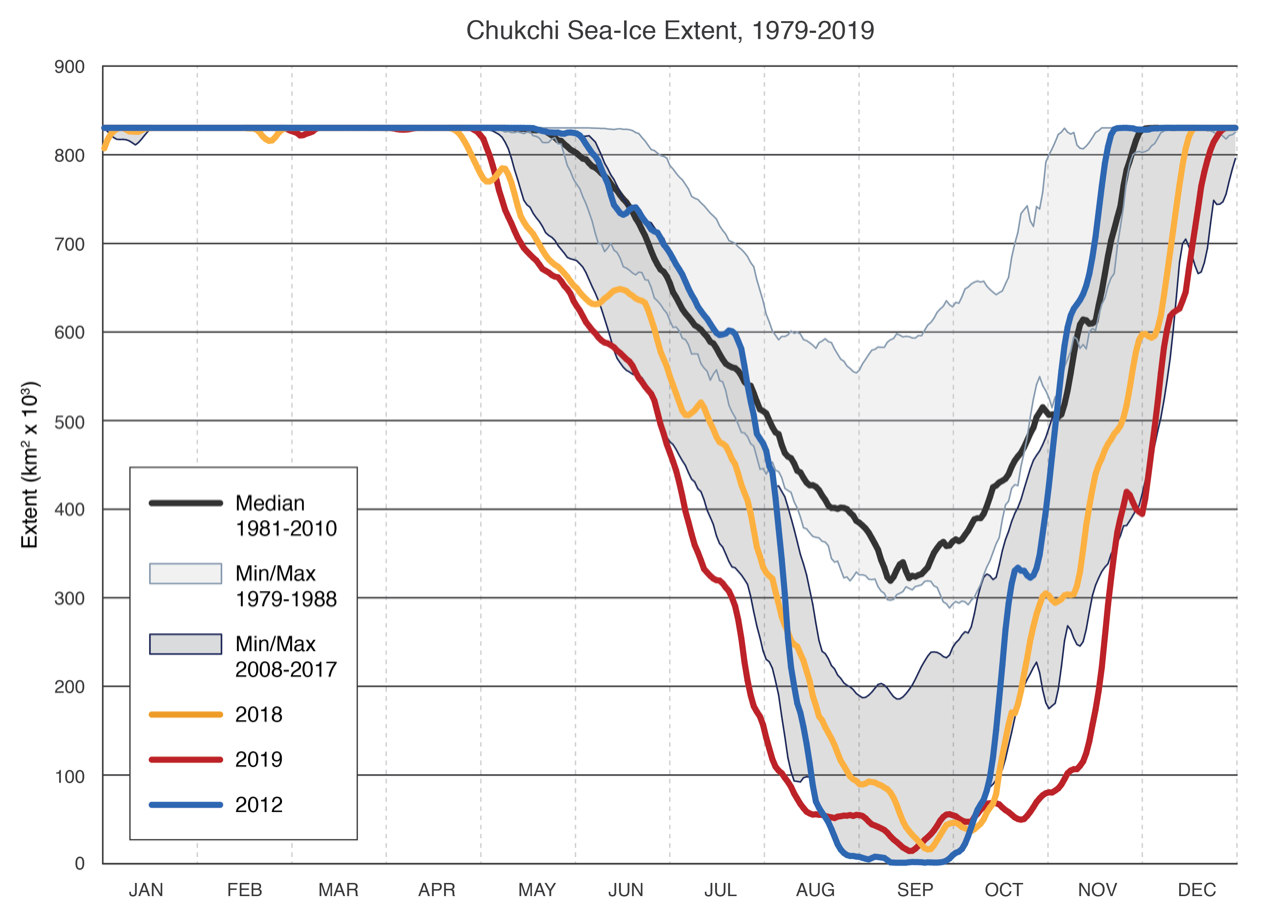
Figure 6a. This figure shows Chukchi Sea ice extent for 2019, 2018, and 2012, along with the 1981 to 2010 median and minima and maxima for different periods.
Credit: Kevin Wood, University of Washington Joint Institute for the Study of the Atmosphere and Ocean (JISAO) and the NOAA Pacific Marine Environmental Laboratory
High-resolution image
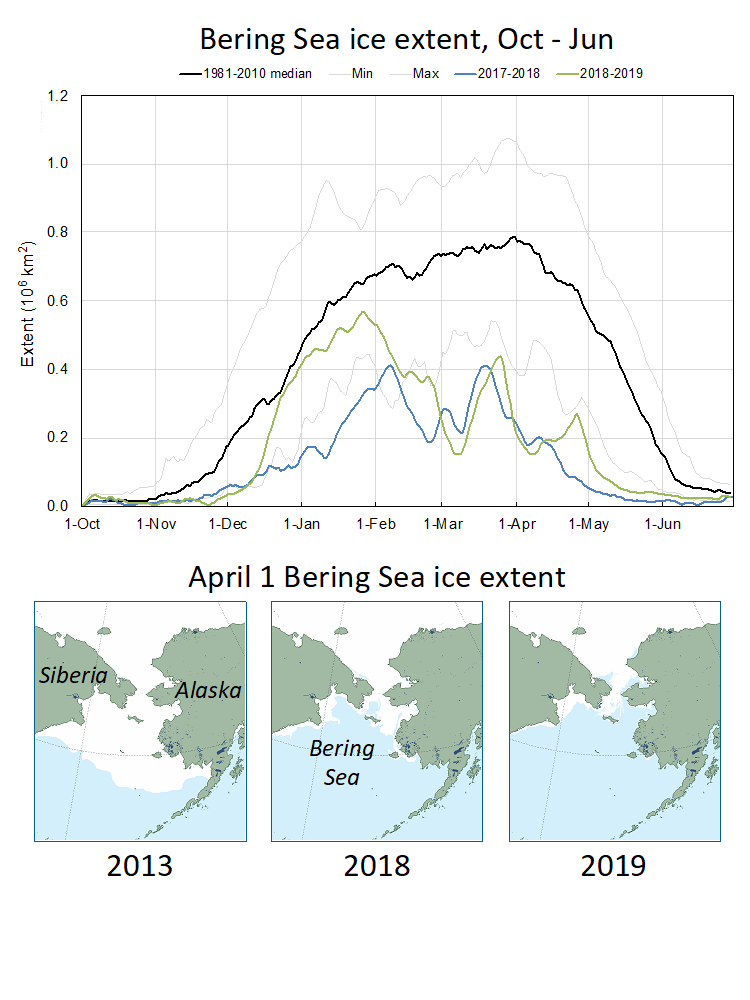
Figure 6b. The graph, based on NSIDC Sea Ice Index Data, shows the daily Bering Sea ice extent for October through June 2017 to 2018 and 2018 to 2019 compared to average. The three maps show Bering Sea ice extent for April 1 in 2013, 2018, and 2019, the date of the average maximum extent for the region, from the Multisensor Analyzed Sea Ice Extent (MASIE) product.
Credit: National Snow and Ice Data Center
High-resolution image
Throughout the year, below average extent characterized Arctic sea ice, but with much variation. Overall, winter extent was not as low as compared to the previous four years from 2015 to 2018. The seasonal maximum, reached on March 13, was seventh lowest in the satellite record. The seasonal onset of melt was particularly early, contributing to record low extent during April. During May and June, the rate of ice loss remained well below average. Extent dropped to record low levels in mid-July through early August but the loss then slowed considerably compared to average. The minimum extent, reached on September 18, tied with 2007 and 2016 as the second lowest extent in the satellite record at 4.15 million square kilometers (1.60 million square miles). Autumn freeze up was initially slow, particularly in the Chukchi Sea (Figure 6a). Here, sea ice extent was at record low levels during October and November; sea surface temperatures remained 5 to 7 degrees Celsius (9 to 13 degrees Fahrenheit) above average well into the autumn.
As was also the case in 2018, the Bering Sea had extremely low sea ice cover during the winter of 2019 (Figure 6b). NSIDC Distributed Active Archive Center scientist and ASINA-contributor Walt Meier was a co-author on a recently-published study (Thoman et al., 2020) reporting that the extreme low sea ice extent in this region was unlikely to have occurred without anthropogenic warming.
Air temperatures in the Arctic region were above average throughout the year, particularly during spring and summer. Zach Labe of the University of California, Irvine, using data from the NCEP/NCAR Reanalsysis, noted that 925 mb air temperatures north of 70 degrees N latitude were among the three highest—since the satellite record began in 1979—for all months between April and October, including record highs in May and August. The NASA Goddard Institute for Space Studies data record shows that the 2019 annual average Arctic temperatures were the second highest in the satellite record, below 2016. Sea surface temperatures, as shown in Upper layer Temperature of the Polar Oceans (UpTempO) buoys, were above average throughout the summer, with temperatures in many ice-free areas exceeding 5 degrees Celsius (9 degrees Fahrenheit) above average. Warm ocean conditions lingered well into autumn, inhibiting ice growth.
In the Antarctic, the summer extent (January through March) was higher than in recent years, but still below the 1981 to 2010 average. The winter extent reached near-average levels until a steep decline in the early spring put extent well below average, with near record low extent by November. More moderate declines thereafter kept extents low, but well above record values, through the end of 2019.
A look back at the 2010s
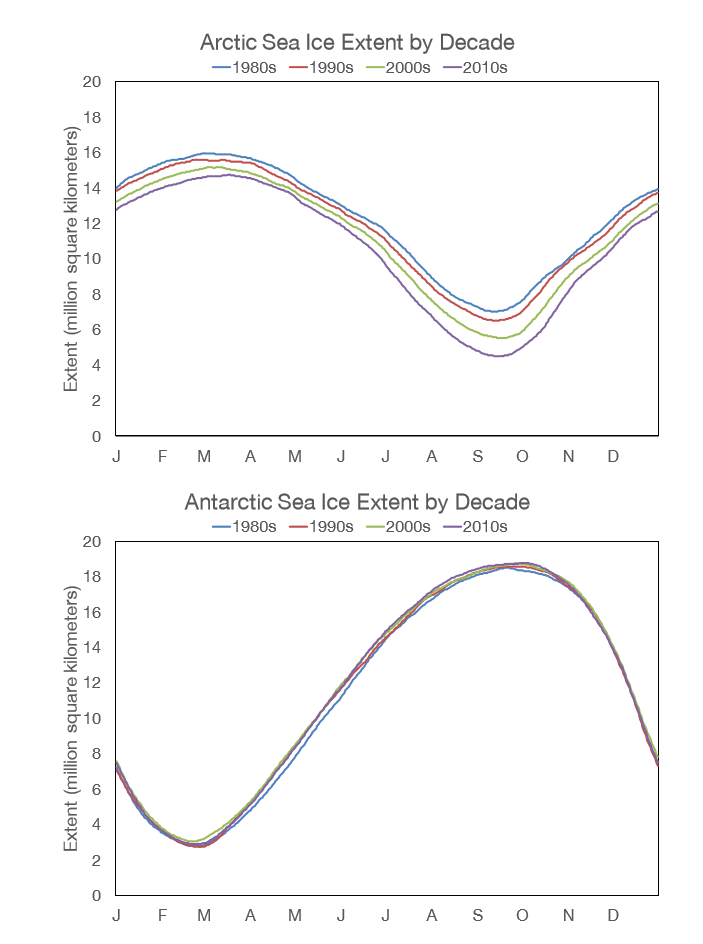
Figure 7a. This figure shows decadal-average daily sea ice extent for the Arctic (top) and the Antarctic (bottom).
Credit: National Snow and Ice Data Center
High-resolution image
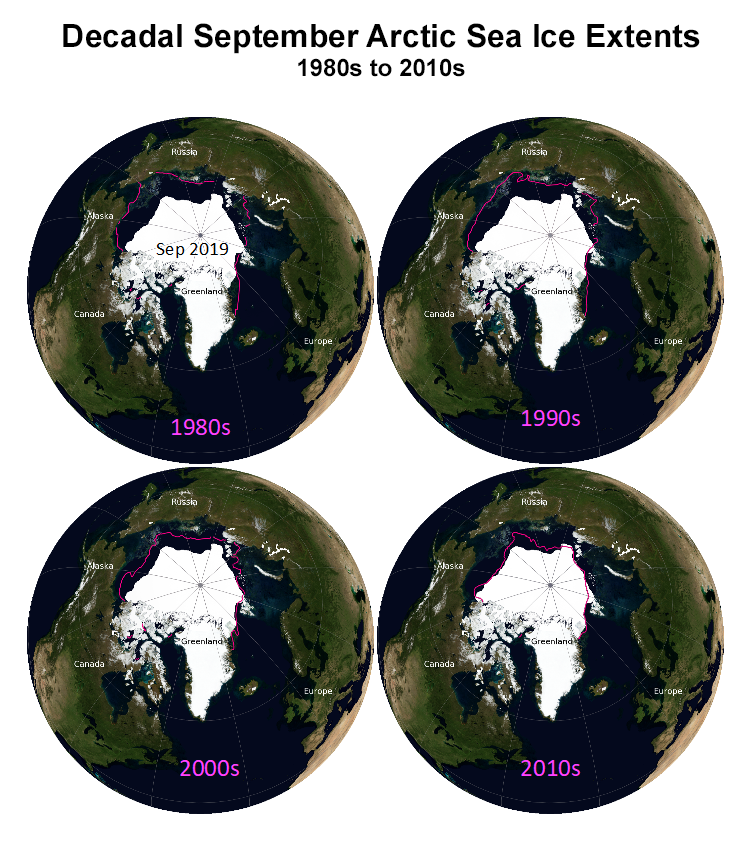
Figure 7b. This figure shows the September 2019 Arctic sea ice extent (white), overlaid with contours (magenta) of decadal average September extents for the 1980s, 1990s, 2000s, and 2010s. The image base map is from the NASA Blue Marble.
Credit: National Snow and Ice Data Center
High-resolution image
Arctic sea ice extent was persistently low through the decade, punctuated by the record low September minimum of 2012. Overall, eight of the ten lowest September monthly average extents in the satellite record occurred during the past decade and the thirteen lowest extents have occurred in the last thirteen years from 2007 to 2019. Because consistently low extents defined the decade, the September trend was essentially zero over 2010 to 2019. October and April showed the largest downward trends during the decade of 10.3 percent and 8.3 percent, respectively. This may reflect later freeze up and earlier melt onset indicative of higher spring and autumn temperatures. However, caution should be used in interpreting trends over a ten-year period because year-to-year variations are high and outliers can strongly affect the trend value over such a short period. Another way to examine decadal changes is by comparing decadal averages. Extent in the 1990s was lower than the 1980s, extent in the 2000s was lower than the 1990s, and the 2010s had the lowest extent (Figure 7a and 7b).
The story is much different in the Antarctic. Ice extents between the decades are nearly indistinguishable from each other (Figure 7a). The 1980s had slightly lower extents during March through June and the 2010s had slightly higher extents because of record high extents earlier in the decade. But overall, the differences are small.
Arctic thickness and volume also remained low throughout the decade, as indicated by the Pan-Arctic Ice Ocean Modeling and Assimilation System (PIOMAS) volume estimates and thickness estimates from the European Space Agency (ESA) CryoSat-2 satellite. Sea ice age fields show that multiyear ice, or ice that has survived at least one summer melt season, covered about 30 percent of the Arctic Ocean winter ice cover on average during the 2010s compared to about 50 percent in the 1980s. The oldest ice (more than 4-years old), which once covered about 30 percent of the Arctic Ocean in the 1980s, has nearly disappeared by the end of this decade.
There were significant research advances in the past decade, far more than can be recapped here. However, we discuss a few as examples. First, our ability to observe the ice greatly increased with the advent of satellite altimeters allowing researchers to estimate thickness over the entire Arctic Ocean. The European Space Agency CryoSat-2 satellite was launched at the beginning of the decade in April 2010, while the NASA ICESat-2 satellite, short for Ice, Cloud and land Elevation Satellite, launched near the end of the decade. Also spanning the decade was NASA Operation IceBridge, an airborne mission that flew over sea ice and land ice for over 10 years, filling in key observational gaps between ICESat, which de-orbited in 2010, and ICESat-2, which launched in 2018.
Modeling studies helped gain a better understanding of what the future holds. Countering speculation after the 2007 record low extent that a sea ice “tipping point” may have been reached, modeling studies (e.g., Tietsche et al., 2011) show that a tipping point scenario is unlikely. Over the long-term, it seems that sea ice is responding largely linearly to rising carbon dioxide levels, suggesting that our future emission trajectory will determine when and whether ice-free summer conditions will occur (Notz and Stroeve, 2016). Under our current emission trajectory, ice-free conditions are likely in the coming decades. However, modeling studies indicate that natural climate variability will play a big role in determining the first occurrence of a seasonally ice free Arctic Ocean, with at least a 20-year uncertainty window (Jahn et al., 2016).
There was great interest in potential links between strong Arctic warming and mid-latitude weather patterns. Jennifer Francis at the University of Rutgers and Steve Vavrus at the University of Wisconsin (Francis and Vavrus, 2012) argued for a link between the Arctic warming and changes in the jet stream that would result in more extremes in mid-latitude weather. This initiated heated debate within the science community. Some studies found support for the hypothesis, but others presented contradicting evidence (Cohen et al., 2019). At this point, the issue remains open.
The Intergovernmental Panel on Climate Change recently published their Special Report on the Oceans and Cryosphere in a Changing Climate, providing an overview of the state of the science.
Further Reading
Cohen, J. and co-authors. 2019. Divergent consensuses on Arctic amplification influence on midlatitude severe winter weather. Nature Climate Change. doi:10.1038/s41558-019-0662-y.
Francis, J. A., and S. J. Vavrus. 2012. Evidence linking Arctic amplification to extreme weather in mid-latitudes. Geophysical Research Letters. doi:10.1029/2012GL051000.
Jahn, A., J. E. Kay, M. M. Holland, and D. M. Hall. 2016. How predictable is the timing of a summer ice-free Arctic? Geophysical Research Letters. doi:10.1002/2016GL070067.
Notz, D., and J. Stroeve. 2016. Observed Arctic sea-ice loss directly follows anthropogenic CO2 emission. Science. doi:10.1126/science.aag2345.
Thoman, Jr., R. L., U. S. Bhatt, P. A. Bieniek, B. R. Brettschneider, M. Brubaker, S. L. Danielson, Z. Labe, R. Lader, W. N. Meier, G. Sheffield, and J. E. Walsh. 2020. The record low Bering Sea ice extent in 2018: Context, impacts, and an assessment of the role of anthropogenic climate change. Bulletin of the American Meterological Society. doi:10.1175/BAMS-D-19-0175.1.
Tietsche, S., D. Notz, J. H. Jungclaus, and J. Marotzke. 2011. Recovery mechanisms of Arctic summer sea ice. Geophysical Research Letters. doi:10.1029/2010GL045698.

