Sea ice extent for January 2020 tracked well below average, with the monthly average tied at eighth lowest in the satellite record. While air temperatures were above average across much of the Arctic Ocean, it was colder than average over the northern Barents Sea, Alaska, the eastern Canadian Arctic Archipelago, and Greenland.
Overview of conditions
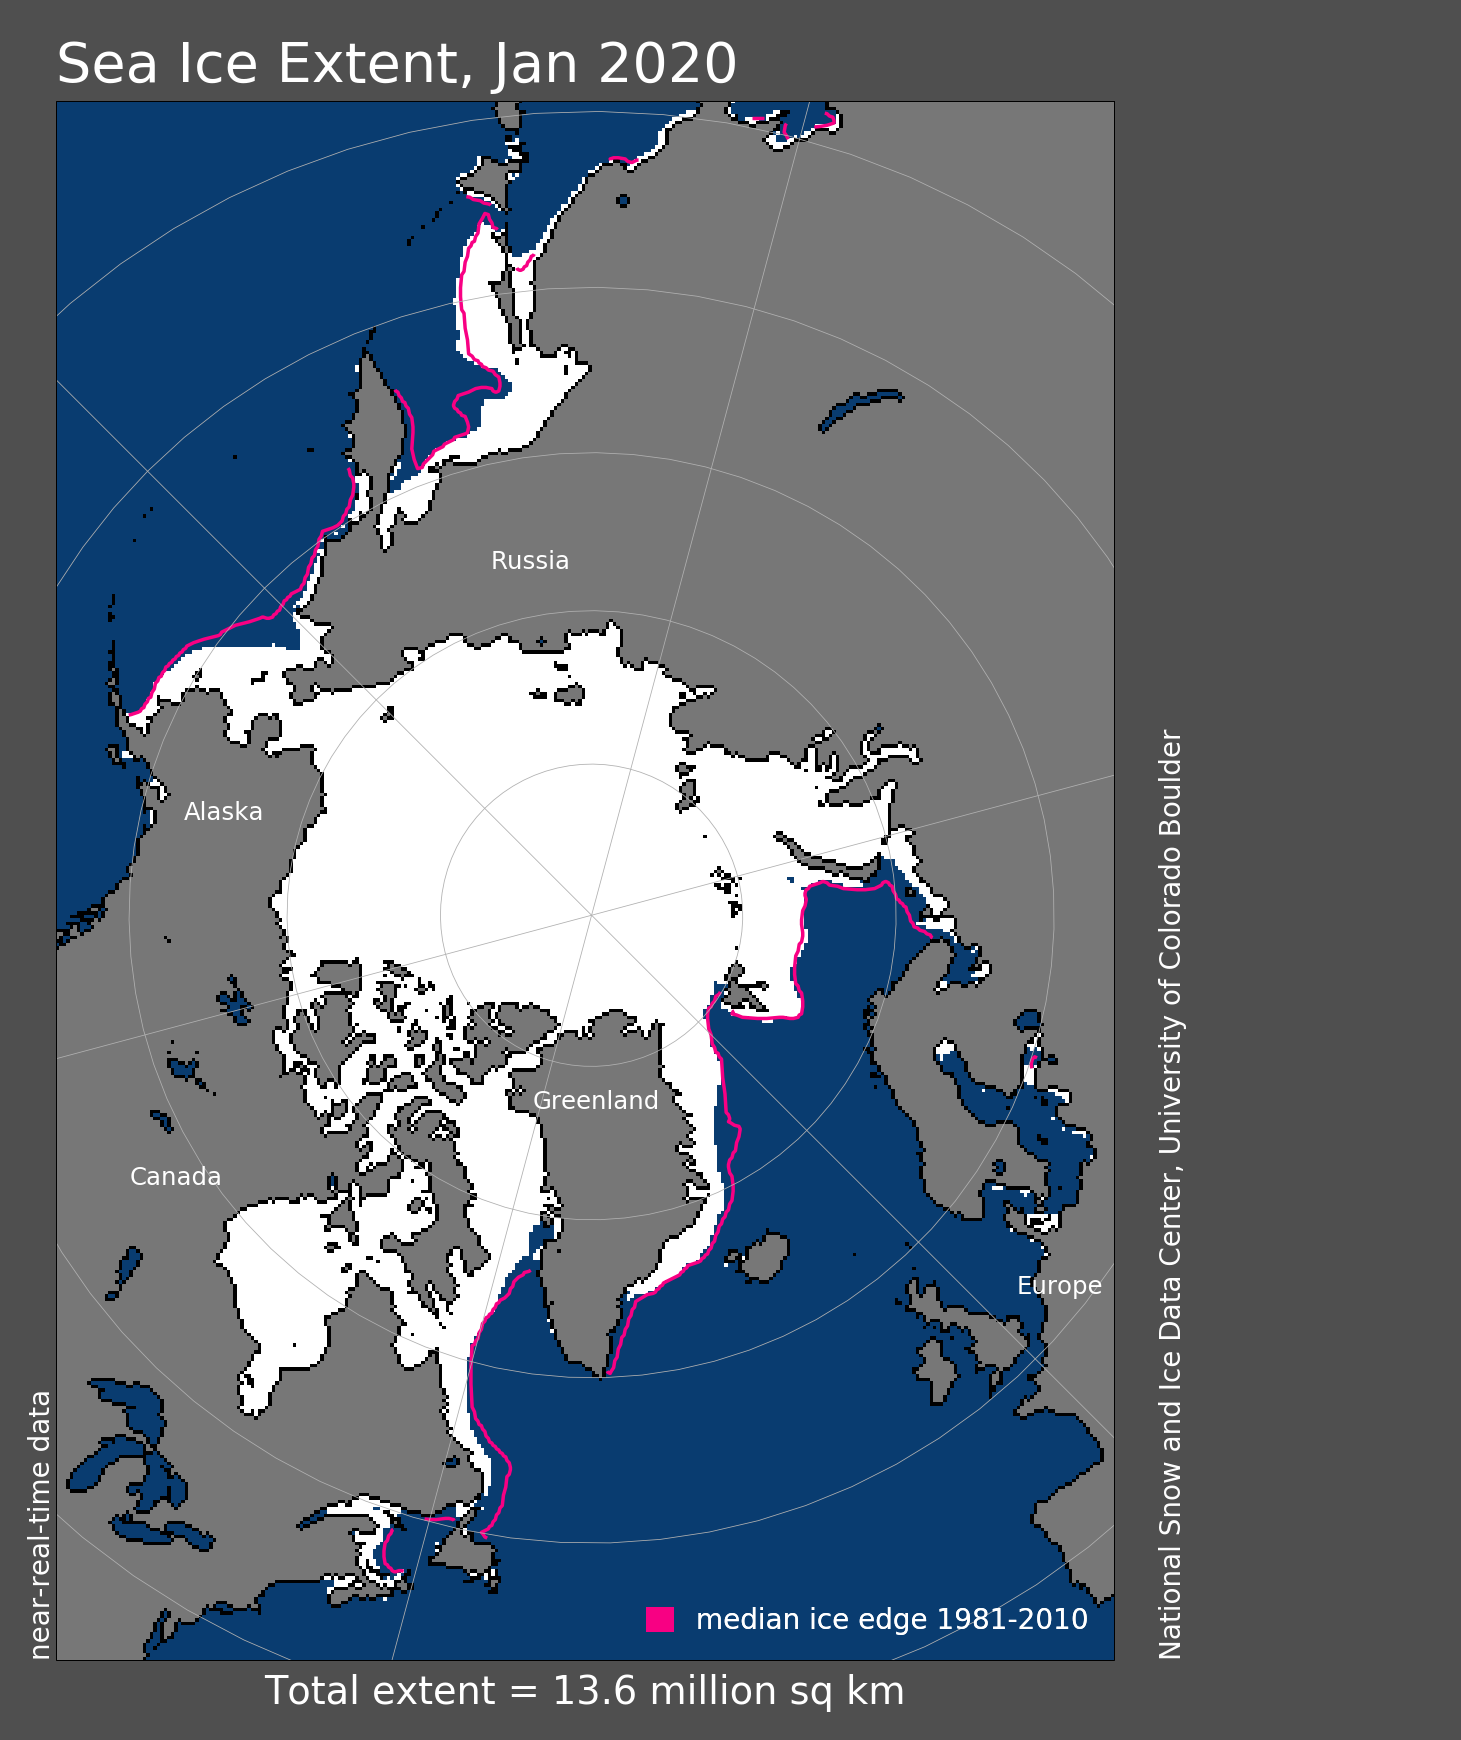
Figure 1. Arctic sea ice extent for January 2020 was 13.65 million square kilometers (5.27 million square miles). The magenta line shows the 1981 to 2010 average extent for that month. Sea Ice Index data. About the data
Credit: National Snow and Ice Data Center
High-resolution image
Arctic sea ice extent for January 2020 was 13.65 million square kilometers (5.27 million square miles), placing it eighth lowest in the satellite record along with 2014. This was 770,000 square kilometers (297,000 square miles) below the 1981 to 2010 January average and 570,000 square kilometers (220,000 square miles) above the record low mark for January set in 2018. At the end of January, ice extent was below average over parts of the Bering Sea, the Sea of Okhotsk, and the East Greenland Sea. The near average extent in the Barents Sea contrasts with recent years, which were characterized by well below average extent in this area.
Conditions in context
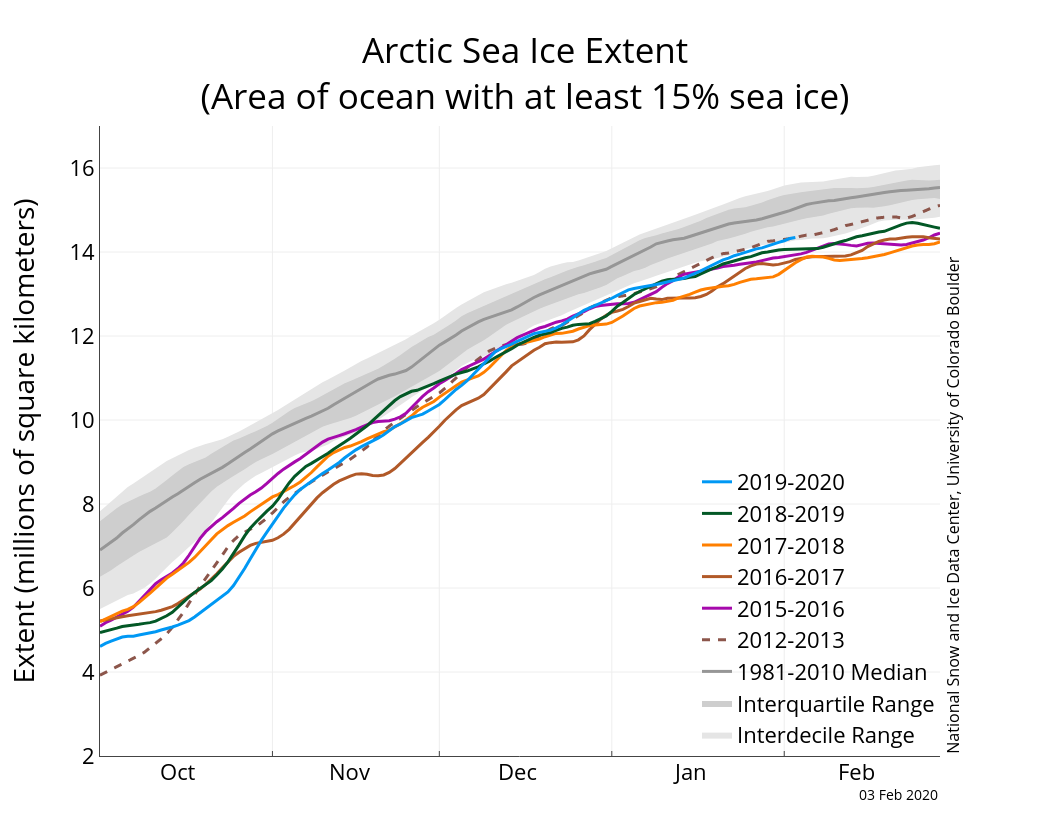
Figure 2a. The graph above shows Arctic sea ice extent as of February 3, 2020, along with daily ice extent data for four previous years and the record low year. 2019 to 2020 is shown in blue, 2018 to 2019 in green, 2017 to 2018 in orange, 2016 to 2017 in brown, 2015 to 2016 in purple, and 2012 to 2013 in dotted brown. The 1981 to 2010 median is in dark gray. The gray areas around the median line show the interquartile and interdecile ranges of the data. Sea Ice Index data.
Credit: National Snow and Ice Data Center
High-resolution image
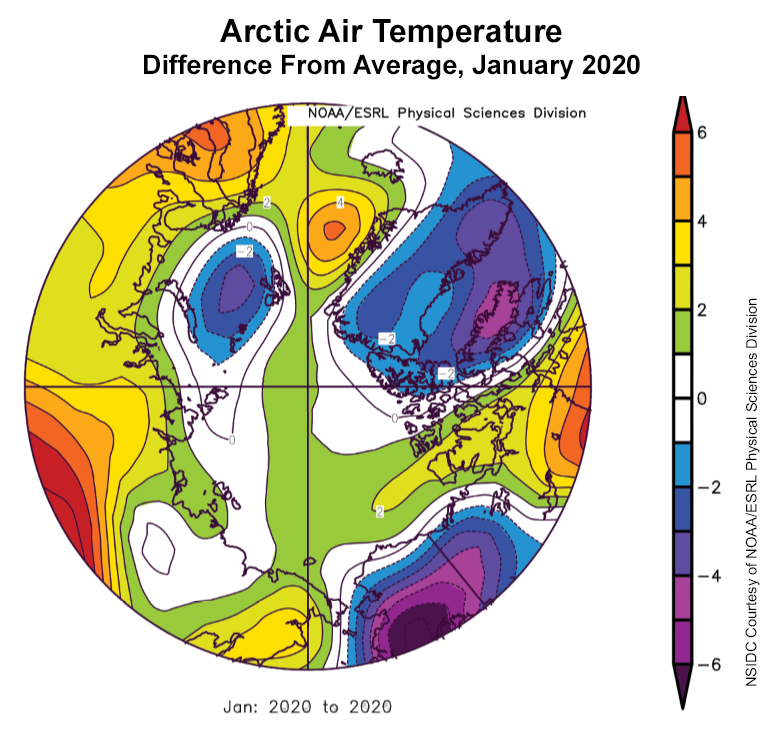
Figure 2b. This plot shows the departure from average air temperature in the Arctic at the 925 hPa level, in degrees Celsius, for January 2020. Yellows and reds indicate higher than average temperatures; blues and purples indicate lower than average temperatures.
Credit: NSIDC courtesy NOAA Earth System Research Laboratory Physical Sciences Division
High-resolution image
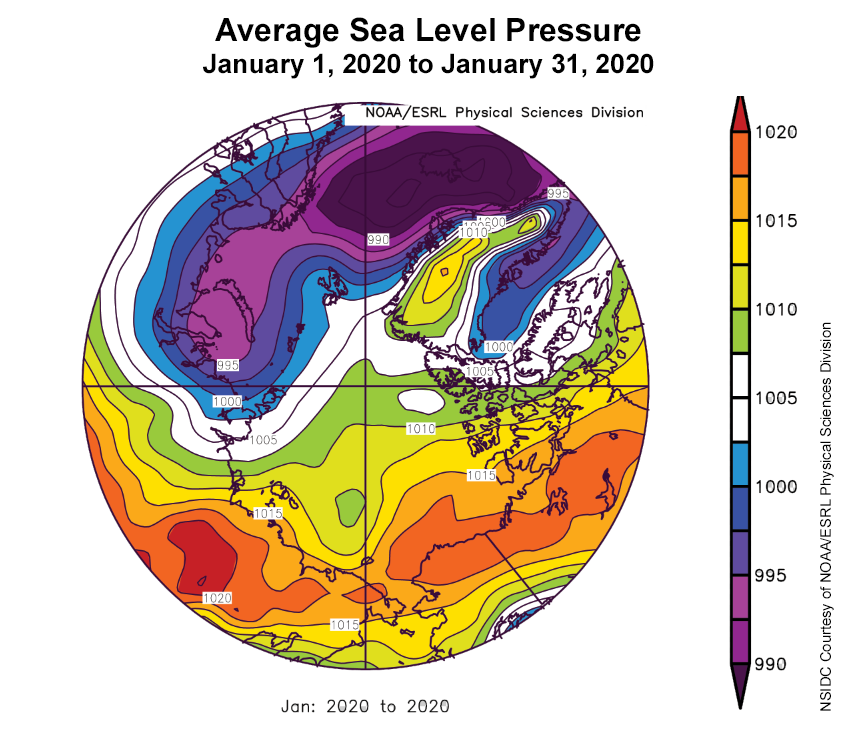
Figure 2c. This plot shows average sea level pressure in the Arctic in millibars (hPa) from January 1, 2020 to January 31, 2020. Yellows and reds indicate high air pressure; blues and purples indicate low pressure.
Credit: NSIDC courtesy NOAA Earth System Research Laboratory Physical Sciences Division
High-resolution image
Through the month, sea ice grew by an average of 45,200 square kilometers (17,500 square miles) per day, fairly close to the average rate over the 1981 to 2010 period of 42,700 square kilometers (16,500 square miles per day). This contrasts with December, when the growth rate was considerably faster than average.
Air temperatures at the 925 hPa level (about 2,500 feet above the surface) were from 1 to 3 degrees Celsius (2 to 5 degrees Fahrenheit) above average across much of the Arctic Ocean, but temperatures were up to 5 to 6 degrees Celsius (9 to 11 degrees Fahrenheit) below average over the northern Barents Sea and southern Alaska (Figure 2b). Temperatures were also below average over much of the eastern Canadian Arctic Archipelago and Greenland.
The sea level pressure pattern average for the month was somewhat unusual, with low pressure extending from the northern North Atlantic into the Kara Sea, contrasting with high pressure over eastern Eurasia and extending across Alaska and northern Canada (Figure 2c). Pressures over the Kara Sea region were as much as 15 hPa below the 1981 to 2010 average. This pattern was associated with a strongly positive phase of the Arctic Oscillation through most of the month. However, toward the end of January, the Arctic Oscillation Index had returned to near neutral conditions.
January 2020 compared to previous years

Figure 3. Monthly January ice extent for 1979 to 2020 shows a decline of 3.15 percent per decade.
Credit: National Snow and Ice Data Center
High-resolution image
Including 2020, the linear rate of decline for January ice extent is 3.15 percent per decade. This corresponds to a trend of 45,400 square kilometers (17,500 square miles) per year, which is roughly twice the size of the state of New Hampshire. Over the 42-year satellite record, the Arctic has lost about 1.86 million square kilometers (718,000 square miles) of ice in January, based on the difference in linear trend values in 2020 and 1979. This is an area larger than the state of Alaska.
Check-in on Antarctic sea ice
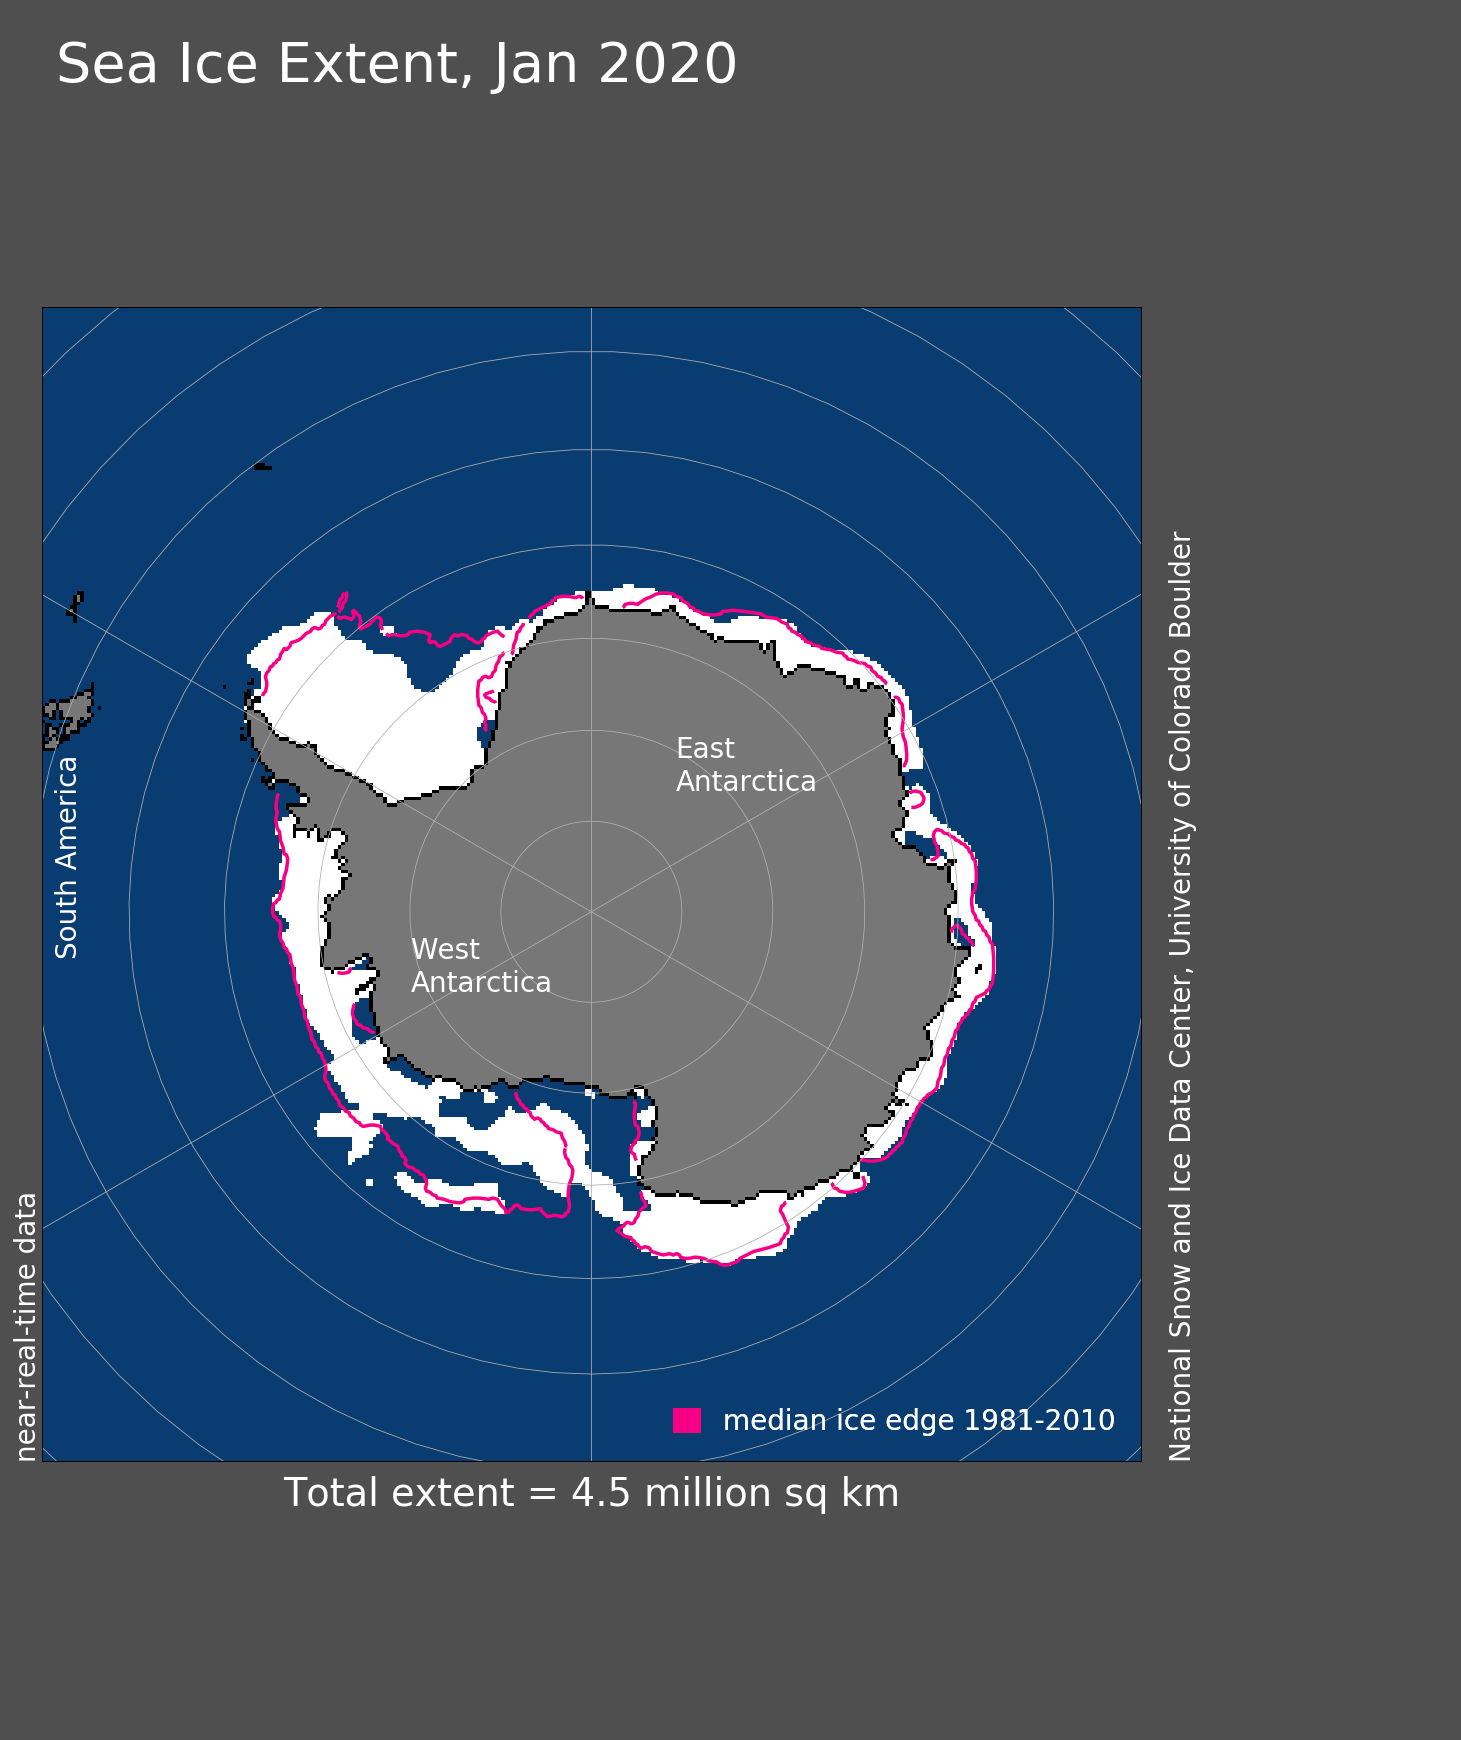
Figure 4. Antarctic sea ice extent for January 2020 was 4.51 million square kilometers (1.74 million square miles). The magenta line shows the 1981 to 2010 average extent for that month. Sea Ice Index data. About the data
Credit: National Snow and Ice Data Center
High-resolution image
In the Antarctic, the rate of ice loss slowed considerably over the month of January. During the month, extent declined 3.19 million square kilometers (1.23 million square miles), which is slower than the 1981 to 2010 average loss of 3.79 million square kilometers (1.46 million square miles). By the end of the month, extent was nearly within the interquartile range of the median extent, though still below average. January is the month of the second largest seasonal ice loss, behind December, as the Antarctic extent approaches its annual minimum, usually in February. Extent was lower than average in the eastern and southeastern part of the Weddell Sea, where cooler conditions prevailed (1 to 2 degrees Celsius, or 2 to 4 degrees Fahrenheit, below average) and higher than average in the northern Weddell. In the eastern Ross Sea, ice cover was dispersed and lower than average despite fairly cool conditions there. Elsewhere around Antarctica, extent was near average, with the ice retreating back to near the coast. The northern Peninsula and much of the Wilkes Land sector of the Southern Ocean was 1 to 2 degrees Celsius (2 to 4 degrees Fahrenheit) above average .
New study implicates ozone-destroying substances in Arctic warming
A new study from Columbia University presents evidence that half of the Arctic sea ice loss and surface warming over the 1955 to 2005 period can be attributed to the greenhouse effect of ozone-depleting substances (ODS). This includes, for example, chlorofluorocarbons—better known as CFCs. ODS concentrations peaked towards the end of the last century, well after the Montreal Protocol of 1987, which called for an end to their production. While the continuing decline of ODS concentrations should lead to healing of the well-known Antarctic Ozone Hole, the fact that that these ODS are also potent greenhouse gases implies that their continued decline in the atmosphere will help to reduce the rate of Arctic warming.
Further Reading:
Polvani, L. M., M. Previdi, M. R. England, G. Chiodo and K. L. Smith. 2020. Substantial twentieth-century Arctic warming caused by ozone-depleting substance. Nature Climate Change. doi:10.1038/s41558-019-0677-4.
Erratum
A reader alerted us that we mistakenly said January 2020 was had the ninth lowest monthly average for sea ice extent. On February 7, we corrected this to say it was tied for eighth lowest.

