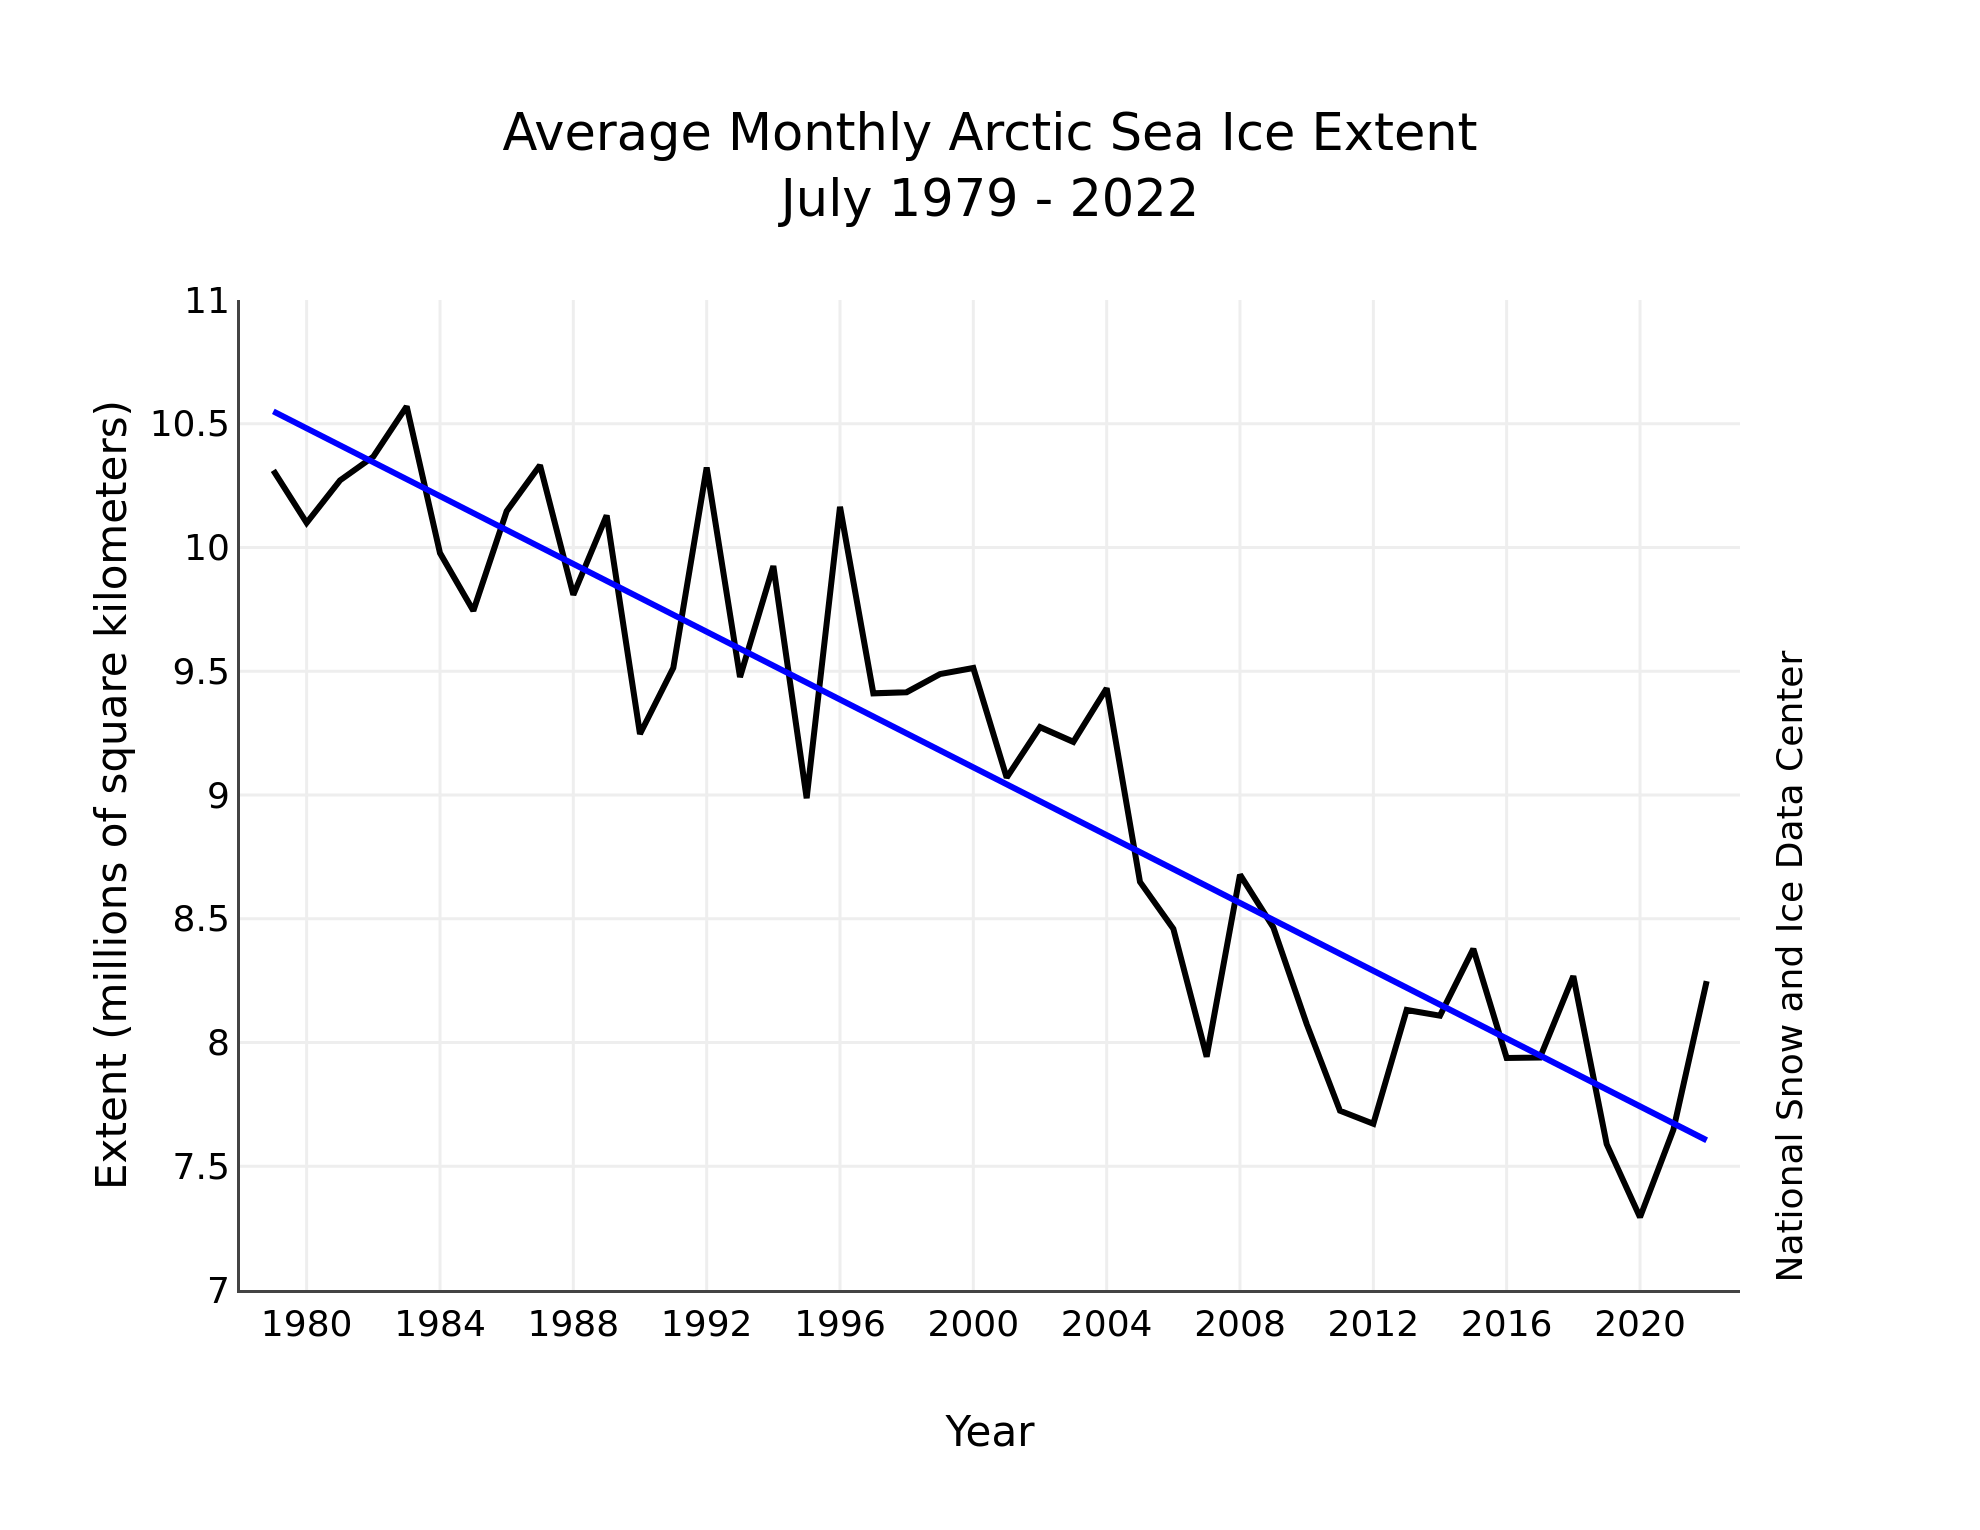
As the sun dips lower on the horizon, air temperatures over the central Arctic Ocean are dropping to near freezing conditions. Further retreat of the ice cover will largely depend on ocean temperatures and wind patterns that can either compact the ice or spread it out. In the Antarctic, sea ice extent continues to track at record low values for this time of year.
Overview of conditions
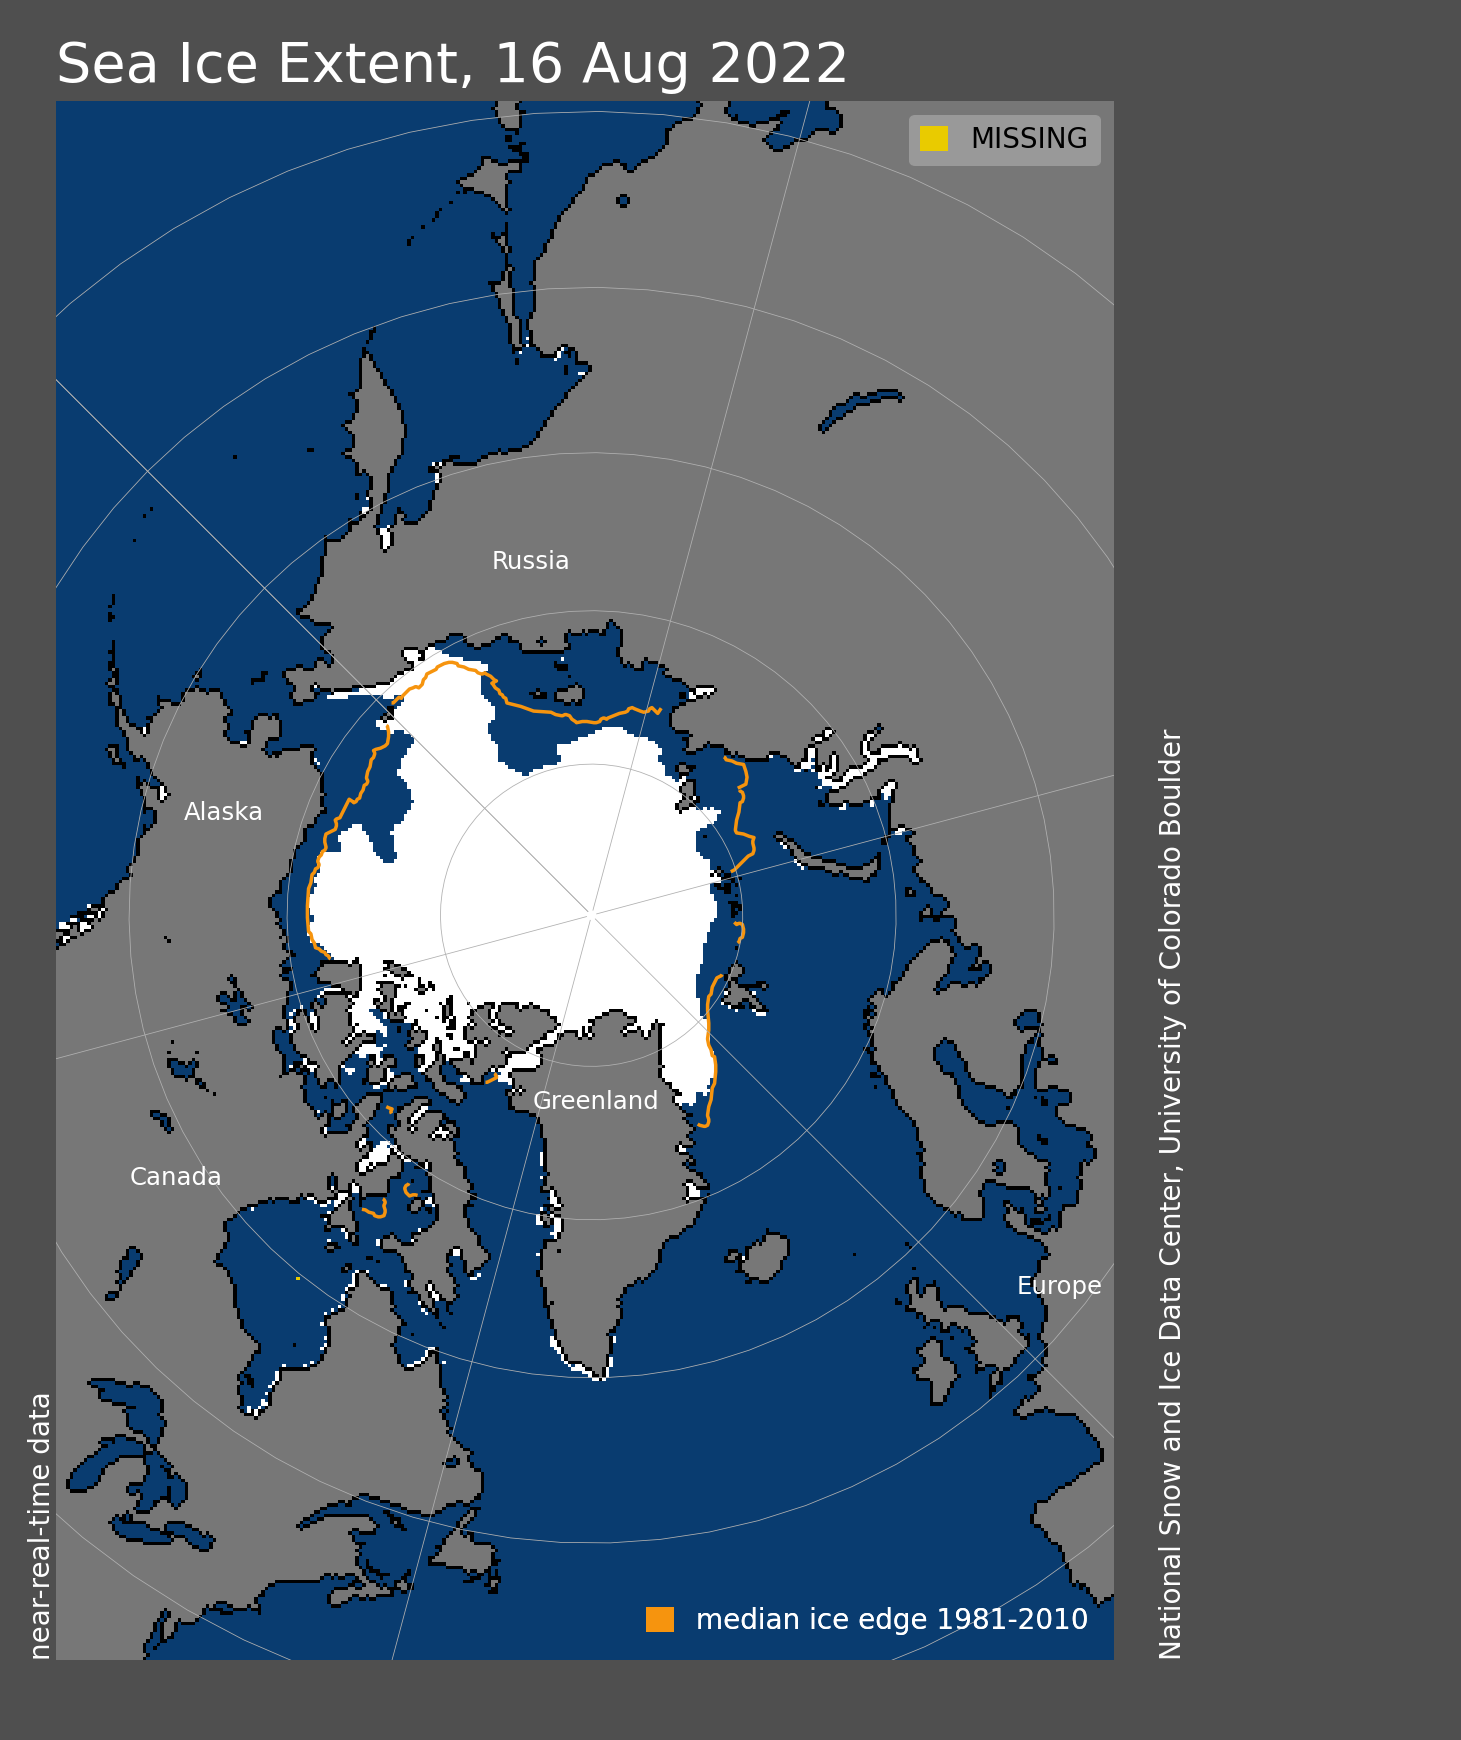
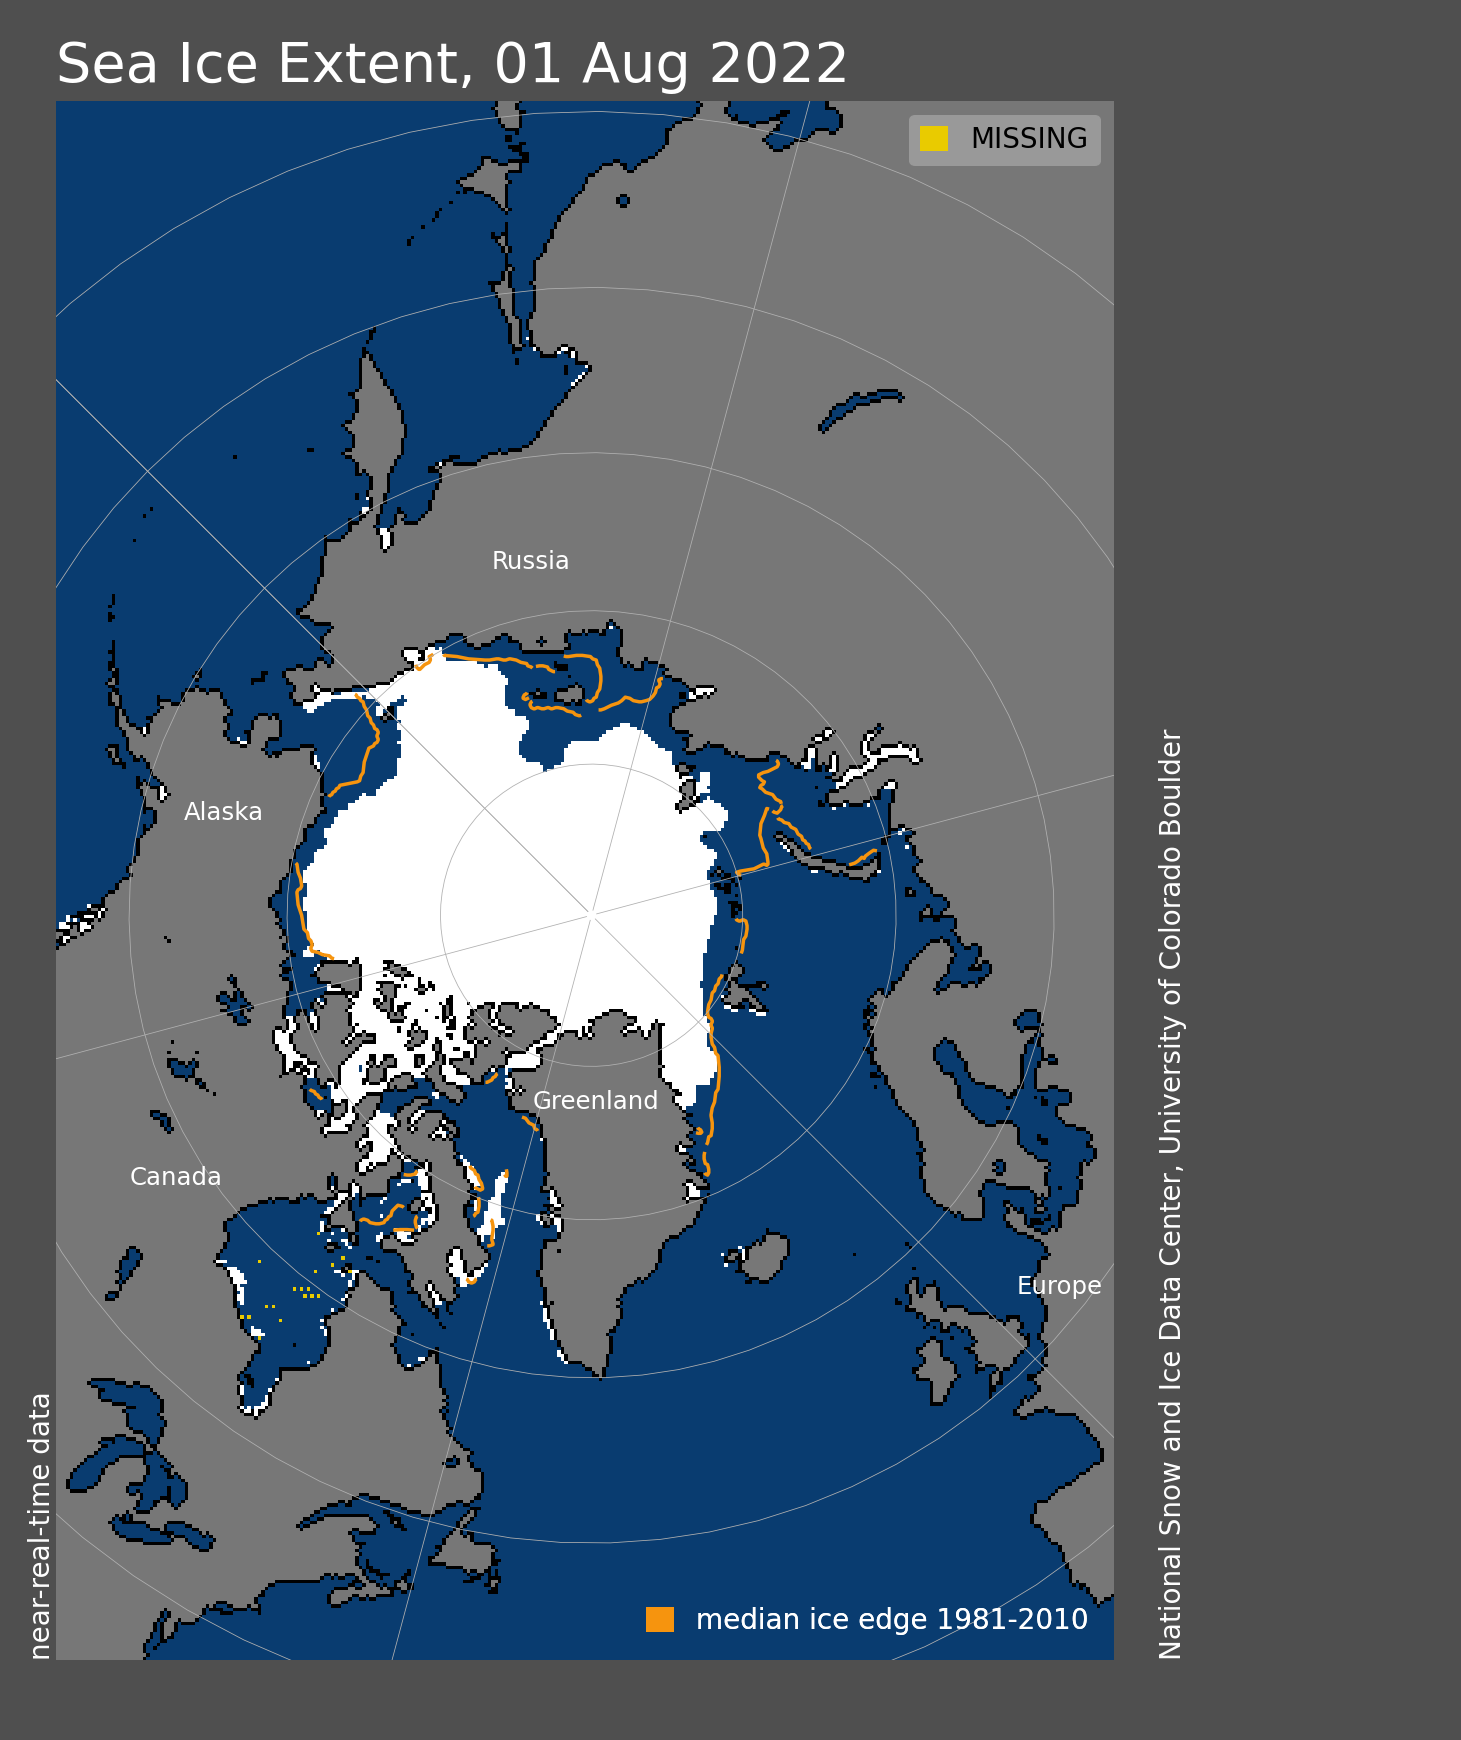
Figure 1a. Arctic sea ice extent for August 16, 2022 was 6.12 million square kilometers (2.36 million square miles). The orange line shows the 1981 to 2010 average extent for that day. Sea Ice Index data. About the data
Credit: National Snow and Ice Data Center
High-resolution image
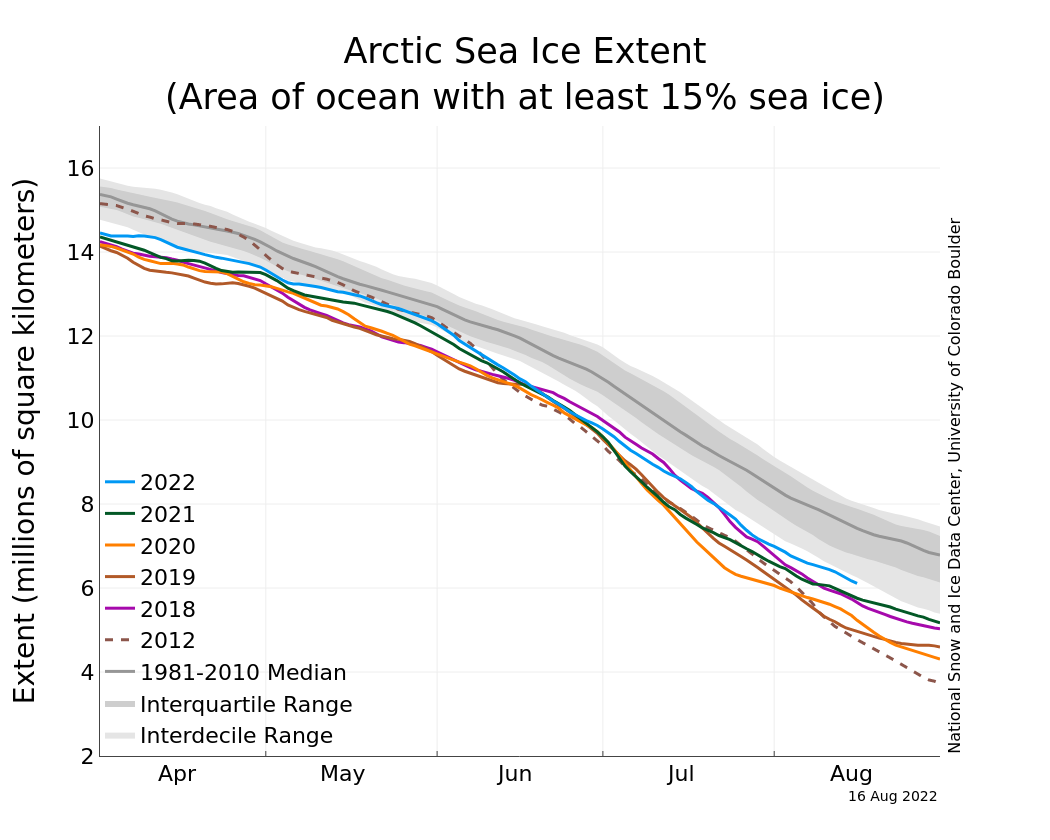
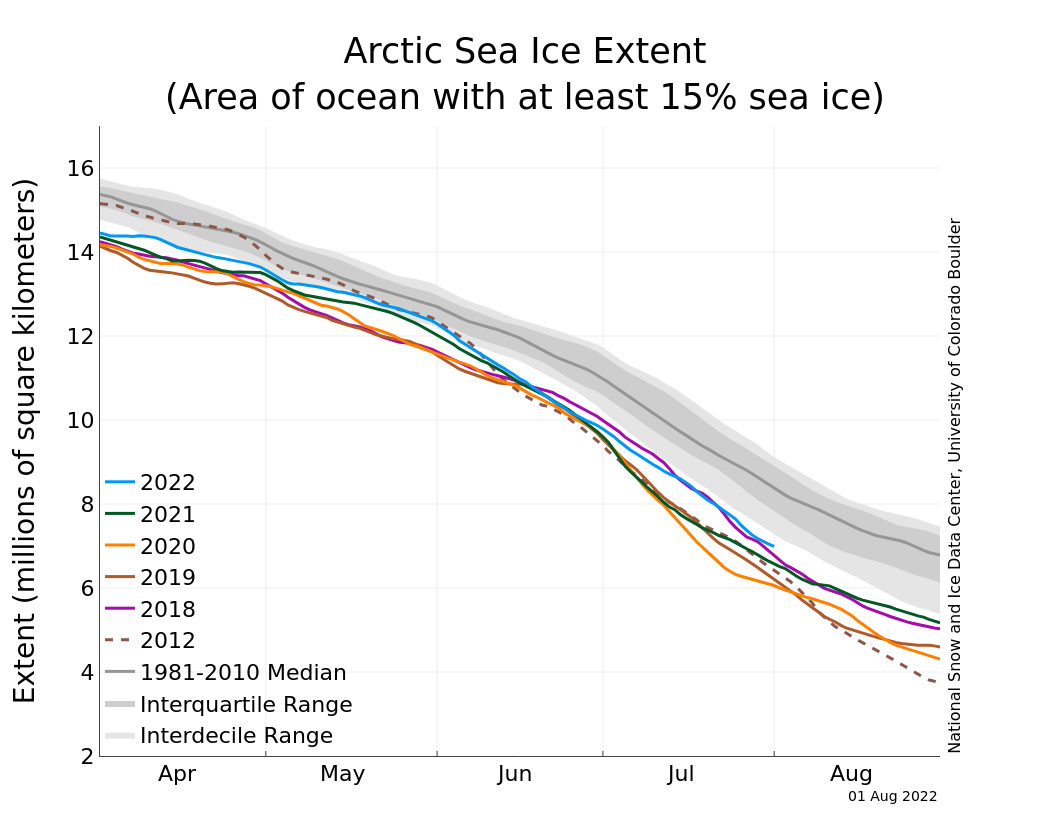
Figure 1b. The graph above shows Arctic sea ice extent as of August 16, 2022, along with daily ice extent data for four previous years and the record low year. 2022 is shown in blue, 2021 in green, 2020 in orange, 2019 in brown, 2018 in magenta, and 2012 in dashed brown. The 1981 to 2010 median is in dark gray. The gray areas around the median line show the interquartile and interdecile ranges of the data. Sea Ice Index data.
Credit: National Snow and Ice Data Center
High-resolution image

Figure 1c. This map shows Arctic sea ice concentration based on data from the Advanced Microwave Scanning Radiometer-2 (AMSR-2) data. Yellows indicate sea ice concentration of 75 percent, dark purples indicate sea ice concentration of 100 percent.
Credit: University of Bremen
High-resolution image
As of August 16, Arctic sea ice extent stood at 6.11 million square kilometers (2.36 square miles) (Figure 1a). This was similar to the total extent observed in 2008 and 2013 for this time of year, within 80,000 square kilometers (30,900 square miles) and 40,000 square kilometers (15,400 square miles), respectively. Extent was higher than all other years since 2007 except for 2009 and 2014 (Figure 1b). Since the beginning of August, the ice edge has remained relatively stable in the northern Barents and Kara Seas, with most of the ice retreating in the northern Chukchi Sea, the East Siberian Sea northwest of the New Siberian Islands, and within the channels of the Canadian Arctic Archipelago. Regionally, ice extent remains below the 1981 to 2010 average in the Barents, Kara, and Laptev Seas, and the northern part of the Chukchi Sea. Ice has persisted along the coast in the East Siberian Sea, where winds have pushed some of the multiyear ice against the shore. The southern route of the Northwest Passage through the Canadian Archipelago appears to be mostly free of ice according to sea ice concentrations from the Advanced Microwave Scanning Radiometer-2 (Figure 1c). However, the Canadian Ice Service reports some ice remains within Victoria Strait. For the first time since 2008, the Northern Sea Route along Eurasia may not become ice free.
While sea ice is overall more extensive than in recent summers, the ice pack is diffuse throughout the Beaufort Sea, the northern part of the Chukchi Sea, and within the East Siberian Sea. Polynyas have opened near 80 degrees N, north of the Kara Sea. With summer nearing its end, the surface of the ice in the central Arctic Ocean is beginning to refreeze. Any remaining loss of sea ice will be largely dominated by melting within the marginal ice zone by heat stored in the ocean. Ocean-driven melting can persist for another few weeks. The the regions of low ice concentration may still melt out. Wind patterns may also compact the ice in some regions and spread it out in others.
Conditions in context
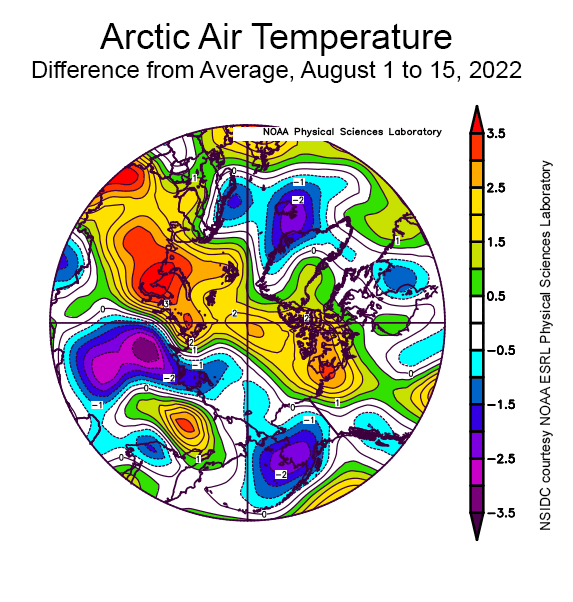
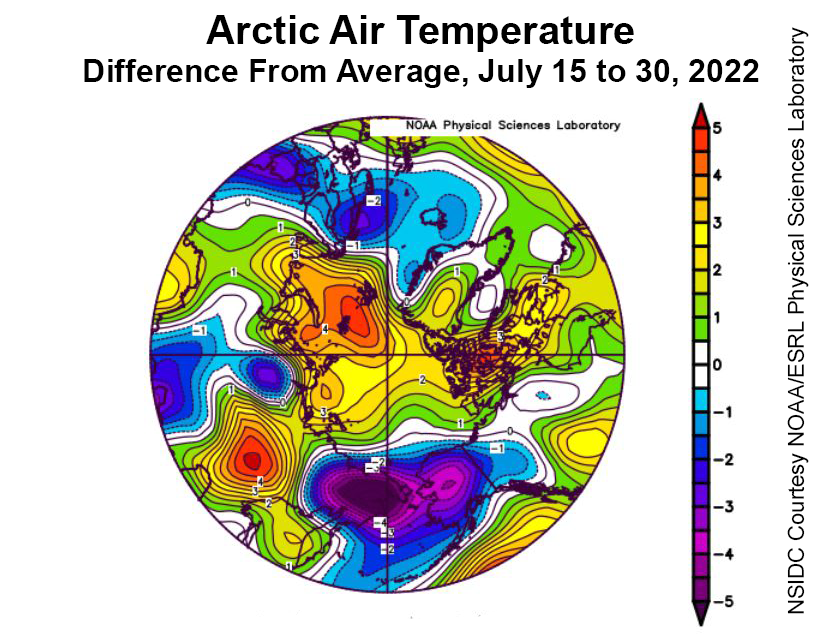
Figure 2. This plot shows the departure from average air temperature in the Arctic at the 925 hPa level, in degrees Celsius, from August 1 to 15, 2022. Yellows and reds indicate higher than average temperatures; blues and purples indicate lower than average temperatures.
Credit: NSIDC courtesy NOAA Earth System Research Laboratory Physical Sciences Laboratory
High-resolution image
During the first half of August, air temperatures at the 925 hPa level (about 2,500 feet above the surface) were modestly above average from the Beaufort Sea across the pole and towards the Kara and Barents Seas (Figure 2). By contrast, temperatures over parts of the East Siberian and Laptev Seas as well as the Bering Sea were slightly below average. While temperatures over the central Arctic Ocean were slightly above average, they are near the freezing point.
Seasonal melt onset a mixed bag
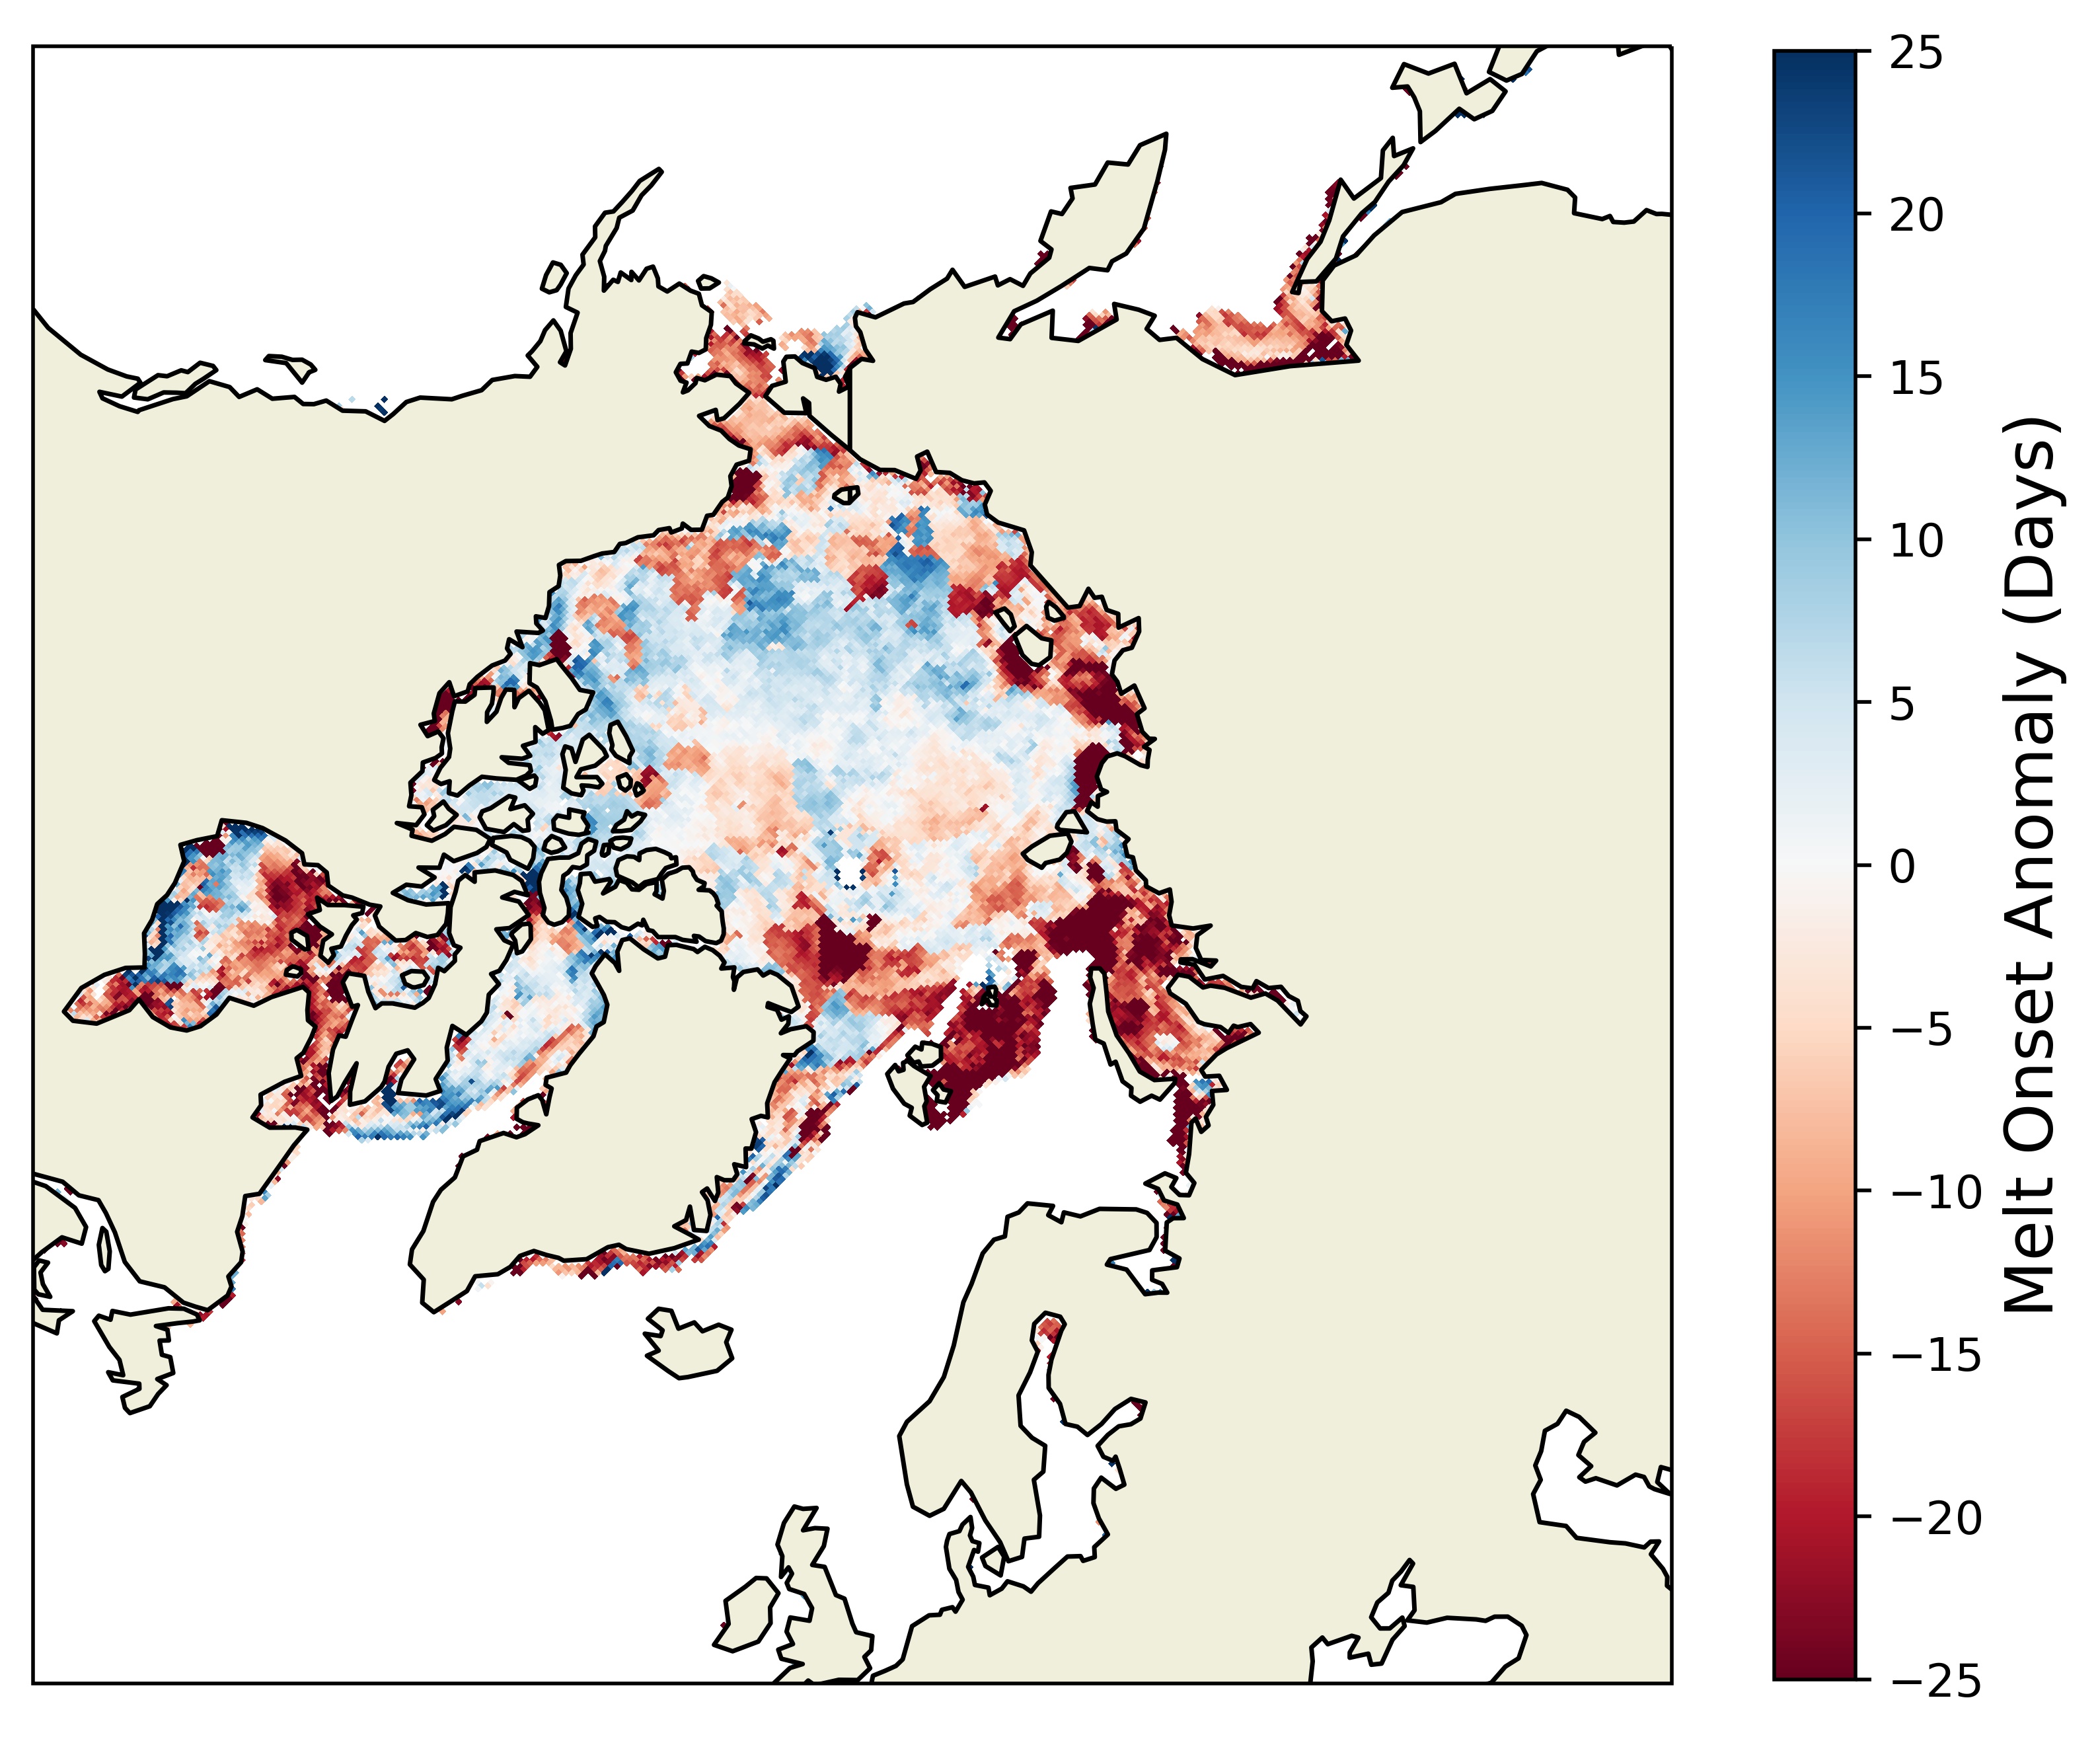
Figure 3. This map shows the date of sea ice melt onset in the Arctic for the 2021 melt season compared to the 1981 to 2010 average. Shades in red depict sea ice melt up to 30 days earlier than average, while shades in blue depict melt up to 30 days later than average.
Credit: Walt Meier, NSIDC; data courtesy J. Miller, NASA Goddard
High-resolution image
Melt onset began nearly a month earlier than the 1981 to 2010 average this year in the Kara and Barents Seas, Northern and Eastern Hudson Bay, and along the coast in the Laptev Sea. In the Bering Sea and the Sea of Okhotsk melt onset was between one and two weeks earlier than average. However, melt onset was later than average over most of the central Arctic Ocean and Baffin Bay. The timing of melt onset plays an important role in the ice-albedo feedback. Early melt onset darkens the surface and reduces its reflectivity, facilitating earlier development of melt ponds and open water areas that absorb more of the sun’s energy, hastening further melt. Early melt onset within the Laptev, Kara, and Barents Seas thus likely fostered faster retreat of the ice cover in those regions. Similarly, late melt onset in Baffin Bay and Davis Strait is consistent with a more extensive ice cover in this region early in the melt season.
Will the extent drop below 5 million square kilometers?
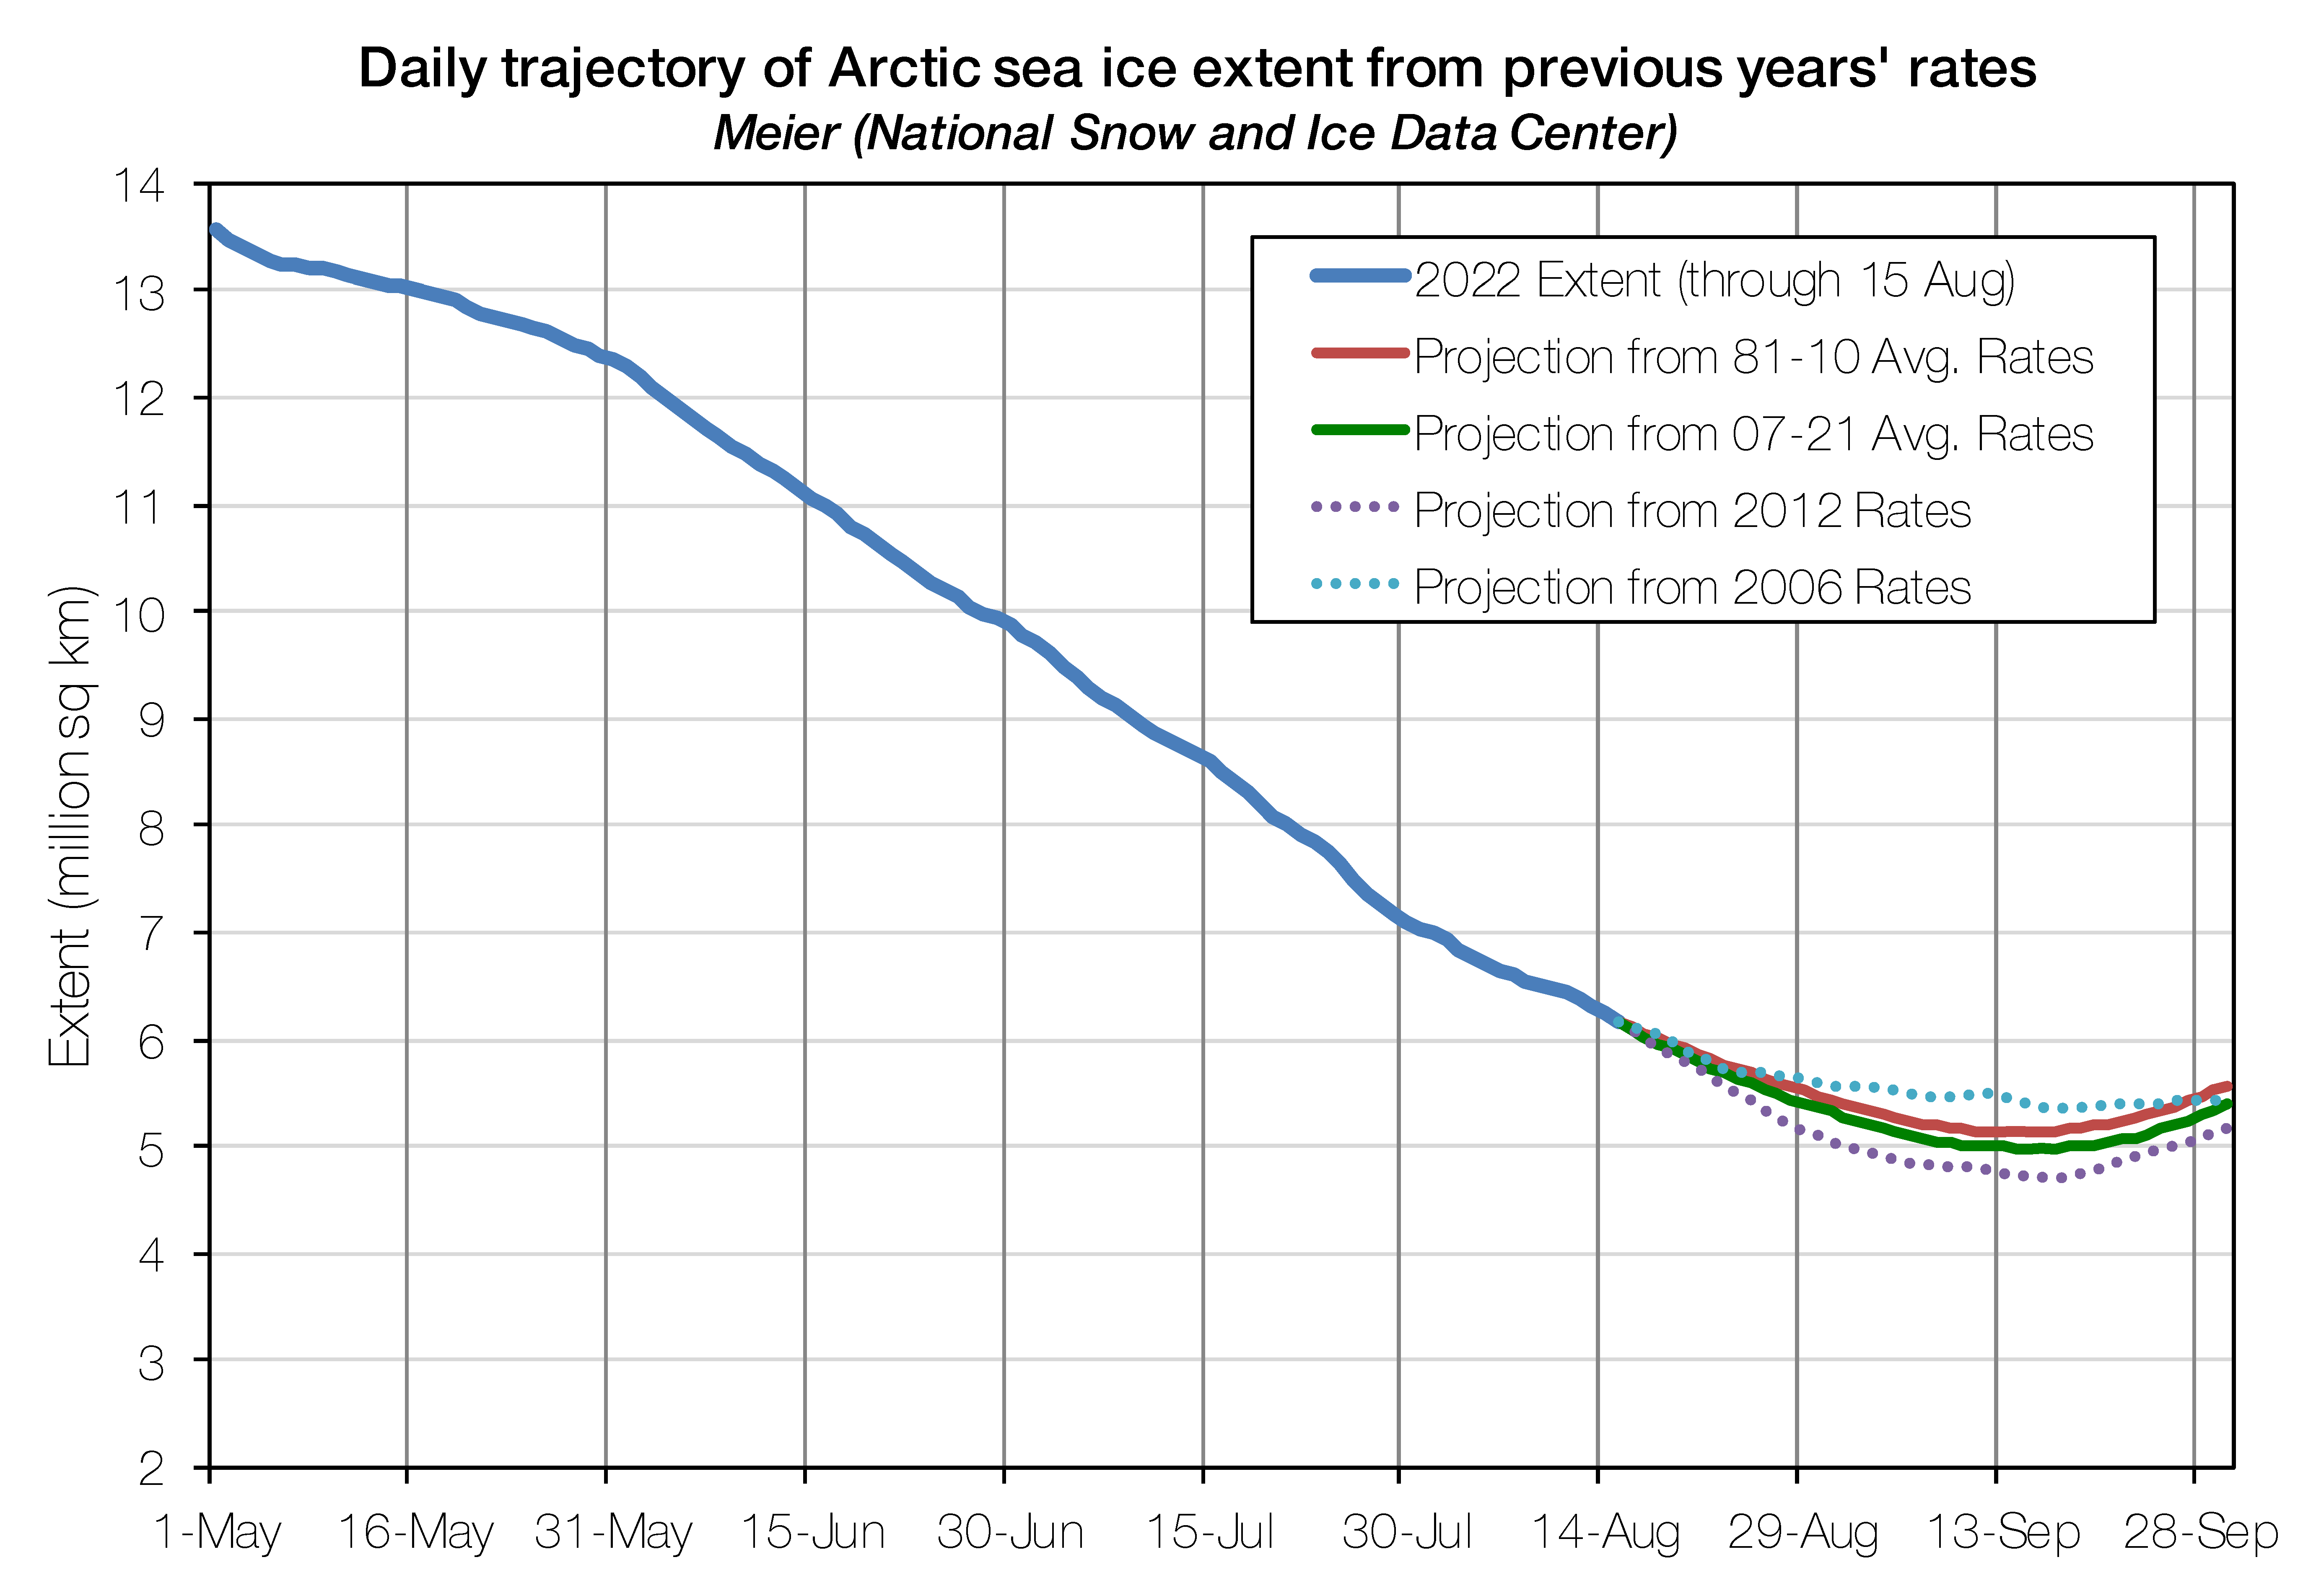
Figure 4. This figure shows Arctic sea ice extent projections for the 2022 minimum using data through August 15, 2022. The solid blue line depicts sea ice extent from May 1 to August 15, 2022. The projections are based on the average loss rates for the 1981 to 2010 average in red, the 2007 to 2021 average in green, 2012 rates in dotted purple, and 2006 rates in dotted teal. 2012 yields the lowest projected minimum, while 2006 yields the highest projected minimum. This figure has been submitted to the 2022 Sea Ice Outlook August report.
Credit: Walt Meier, National Snow and Ice Data Center
High-resolution image
One simple way to estimate how much ice will be left at the end of this summer is to use ice loss rates from previous years and apply them to this year. Starting on August 15 and forecasting 6 weeks into the future suggests a 30 percent chance the total extent this summer may stay above 5 million square kilometers (1.93 million square miles), something that has not happened since 2014. The fastest ice loss rates occurred in 2012, the year which ended up with the record minimum ice extent. With this unlikely trajectory, extent would bottom out at about 4 million square kilometers (1.54 million square miles). We expect that the September minimum ice extent will rank between the seventh and fifteenth lowest this year.
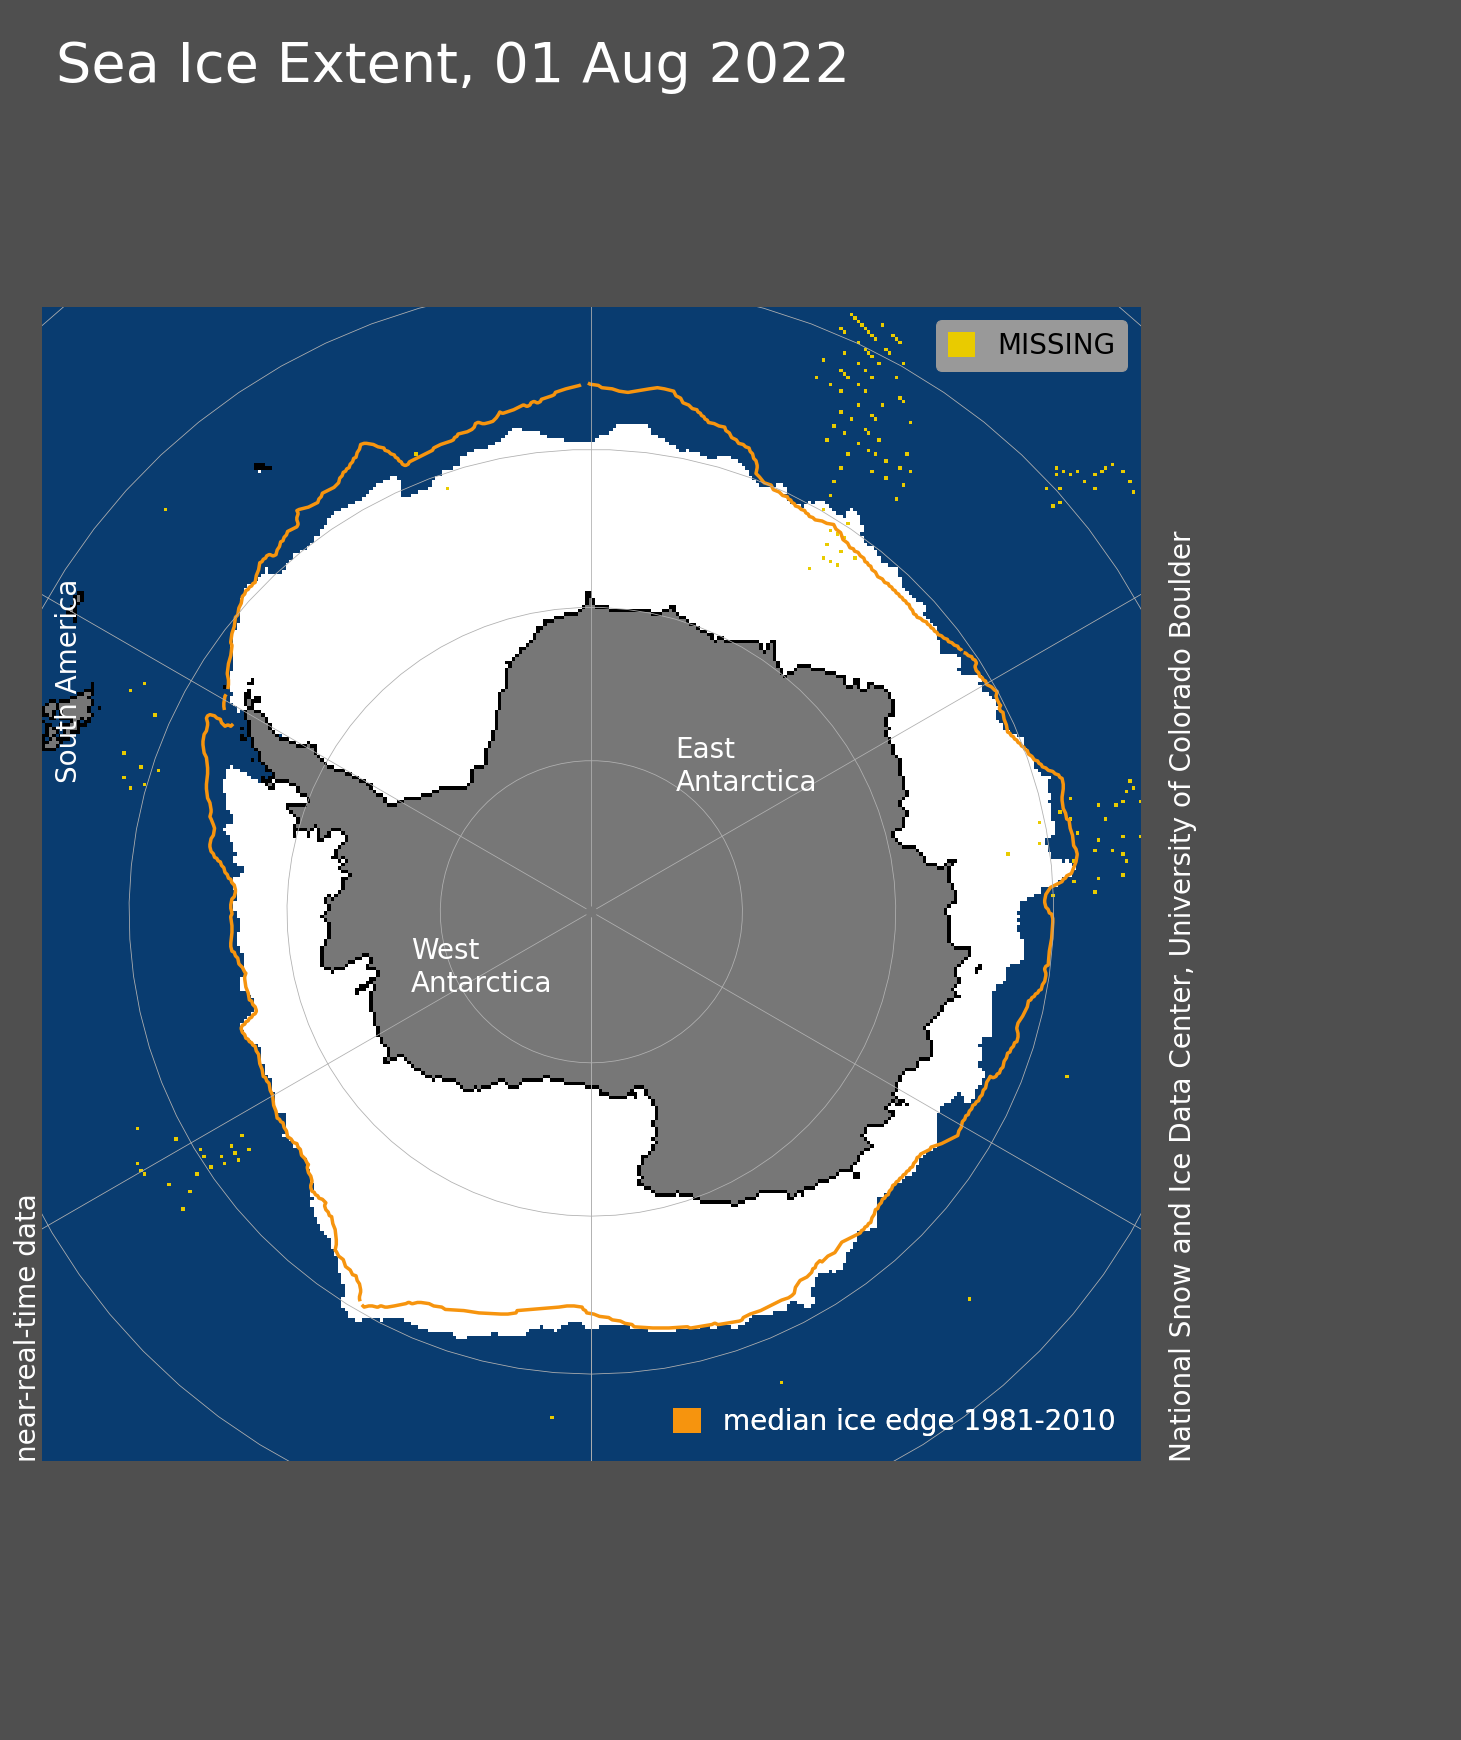
Antarctic sea ice still tracking at record lows
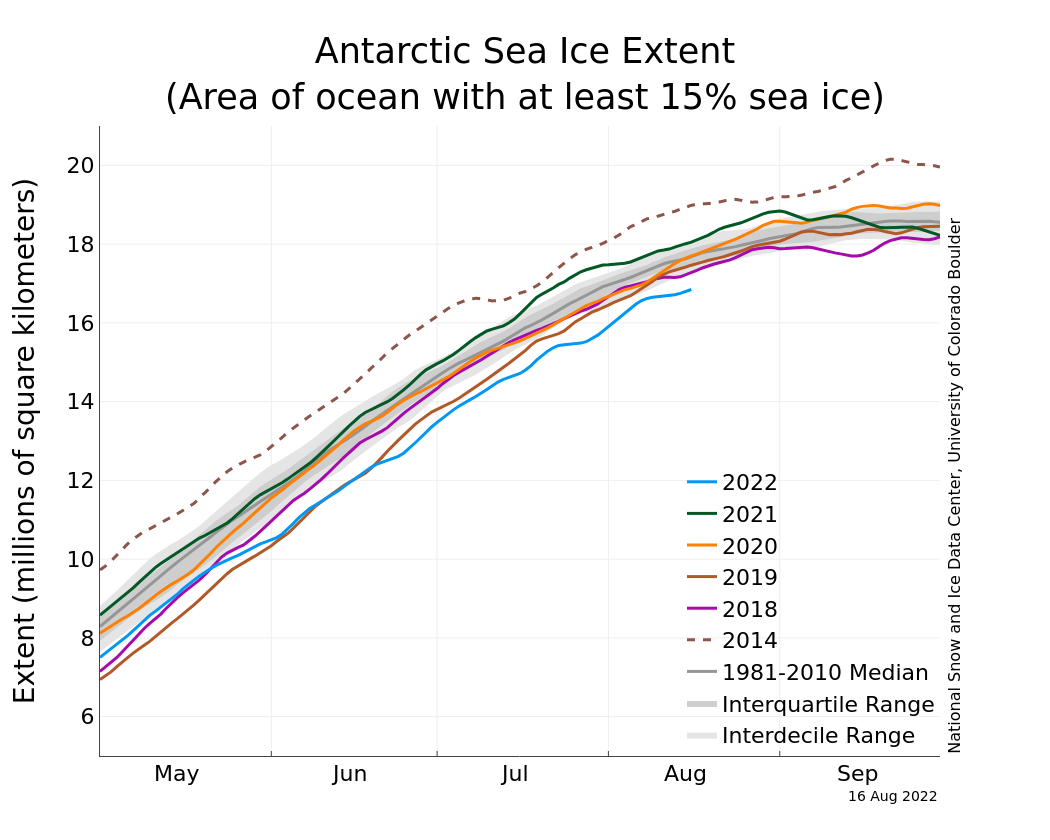
Figure 5. The graph above shows Antarctic sea ice extent as of August 16, 2022, along with daily ice extent data for four previous years and the record high year. 2022 is shown in blue, 2021 in green, 2020 in orange, 2019 in brown, 2018 in magenta, and 2014 in dashed brown. The 1981 to 2010 median is in dark gray. The gray areas around the median line show the interquartile and interdecile ranges of the data. Sea Ice Index data.
Credit: National Snow and Ice Data Center
High-resolution image
As of August 16, Antarctic sea ice extent was tracking below all previous years. At the start of August, it was tracking at second lowest. Ice retreated in the Bellingshausen Sea and parts of the Indian Ocean the first two weeks of August, whereas the ice edge expanded in the Weddell and Ross Seas. In the Bellingshausen Sea, air temperatures at the 925 millibar level have been as much as 7 degrees Celsius (13 degrees Fahrenheit) above average the first two weeks of August, as winds from the north have pushed warmer air and the ice edge towards the Antarctic coast.