Arctic sea ice has likely reached its maximum extent for the year, at 14.88 million square kilometers (5.75 million square miles) on February 25. The 2022 maximum is the tenth lowest in the 44-year satellite record. On the same day, on the other pole, Antarctic sea ice reached a record minimum extent, at 1.92 million square kilometers (741,000 square miles).
Overview of conditions
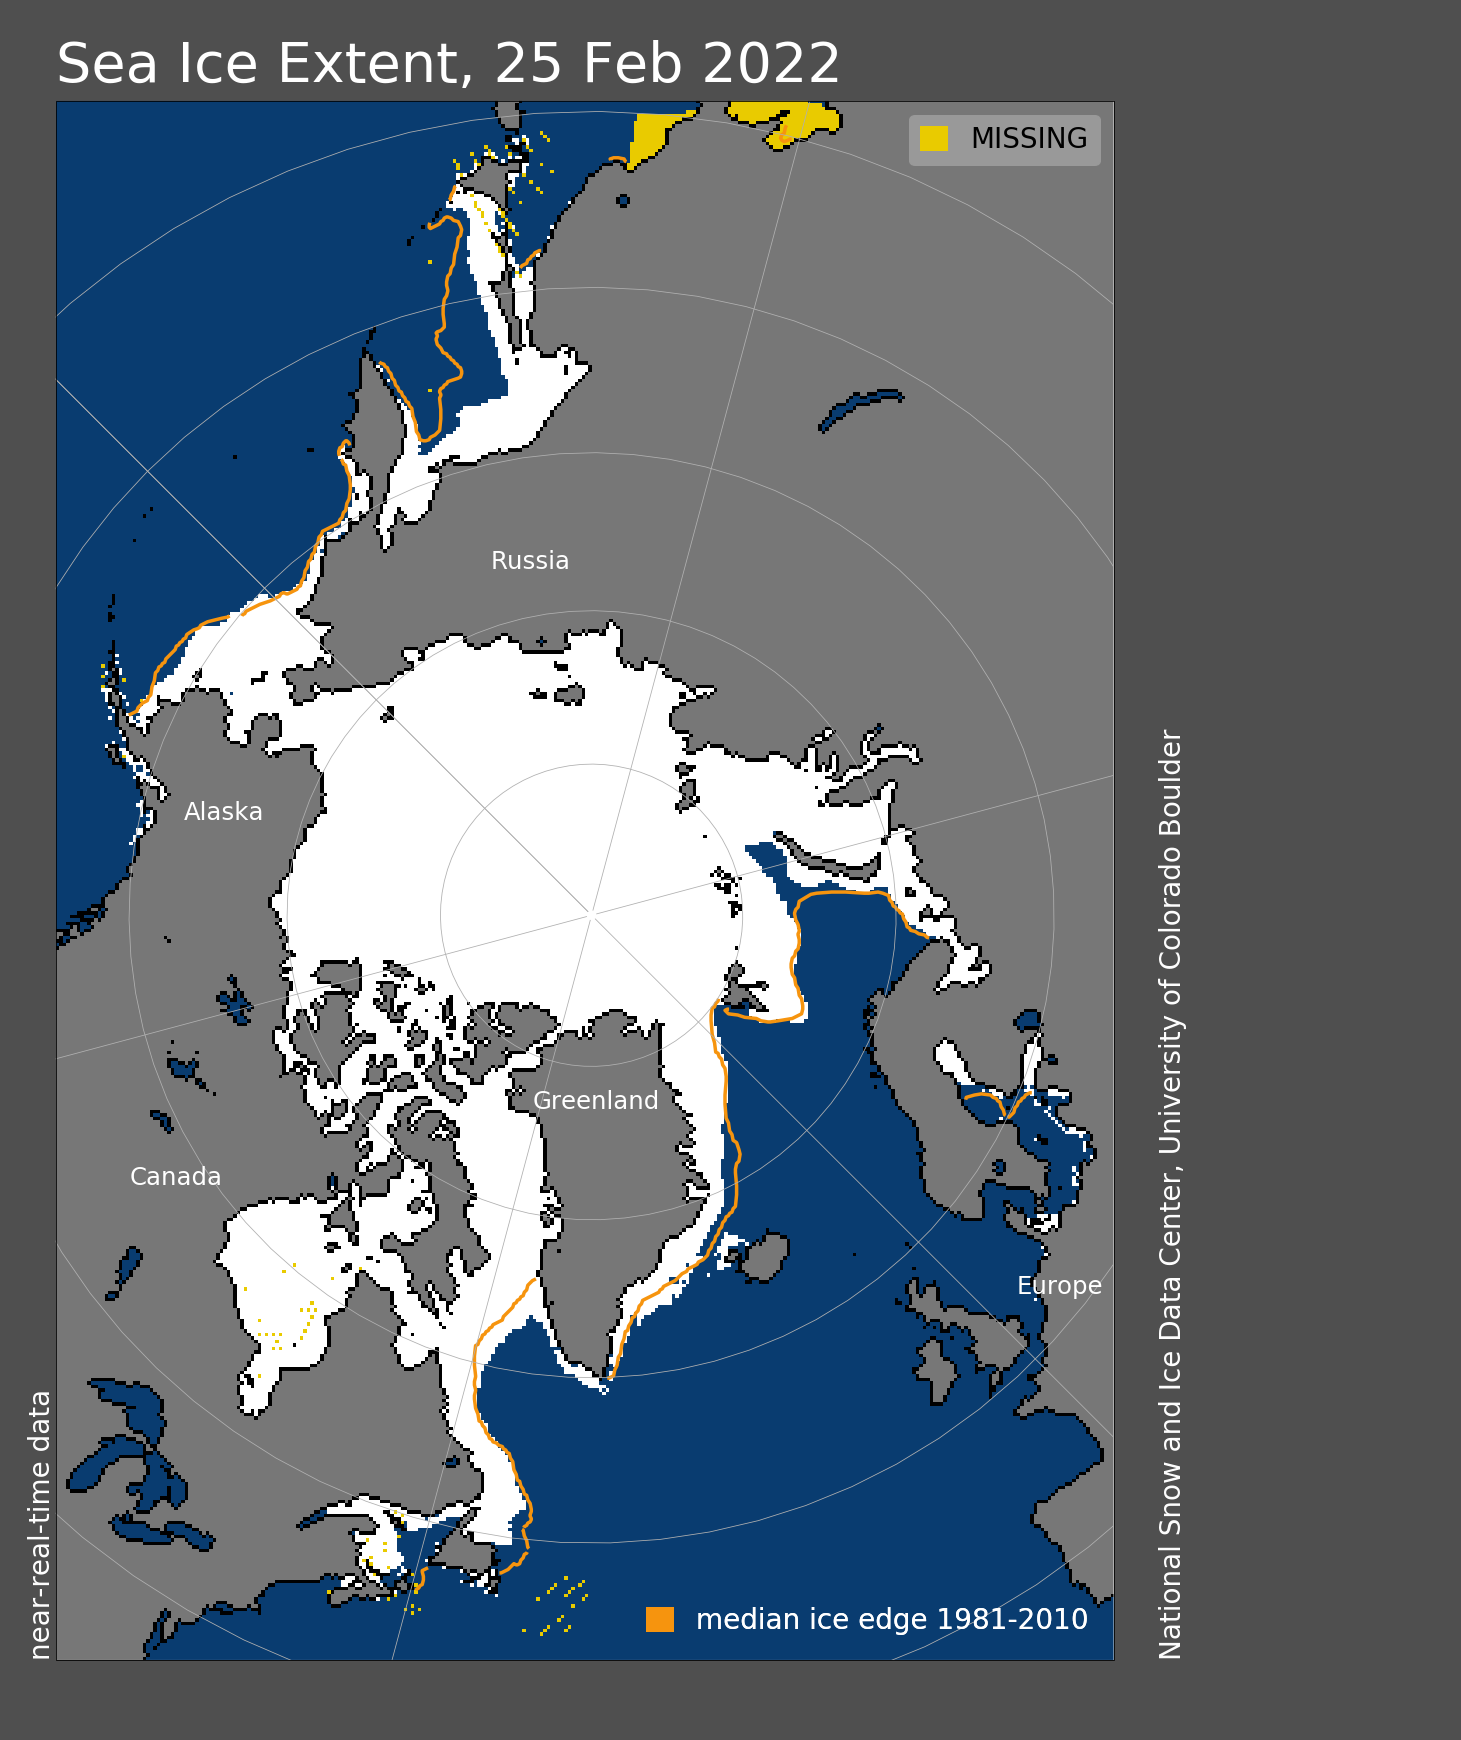
Figure 1. Arctic sea ice extent for February 25, 2022, was 14.88 million square kilometers (5.75 million square miles). The orange line shows the 1981 to 2010 average extent for that day. Sea Ice Index data. About the data
Credit: National Snow and Ice Data Center
High-resolution image
On February 25, 2022, Arctic sea ice likely reached its maximum extent for the year, at 14.88 million square kilometers (5.75 million square miles), the tenth lowest extent in the satellite record. This year’s maximum extent is 770,000 square kilometers (297,000 square miles) below the 1981 to 2010 average maximum of 15.65 million square kilometers (6.04 million square miles) and 470,000 square kilometers (182,000 square miles) above the lowest maximum of 14.41 million square kilometers (5.56 million square miles) set on March 7, 2017. Prior to 2019, the four lowest maximum extents occurred from 2015 to 2018.
The date of the maximum this year, February 25, was fifteen days earlier than the 1981 to 2010 average date of March 12. Only two years had an earlier maximum, 1987 and 1996, both on February 24. This year is the second earliest date on the satellite record, tying with 2015, which also reached its maximum extent on February 25.
Conditions in context
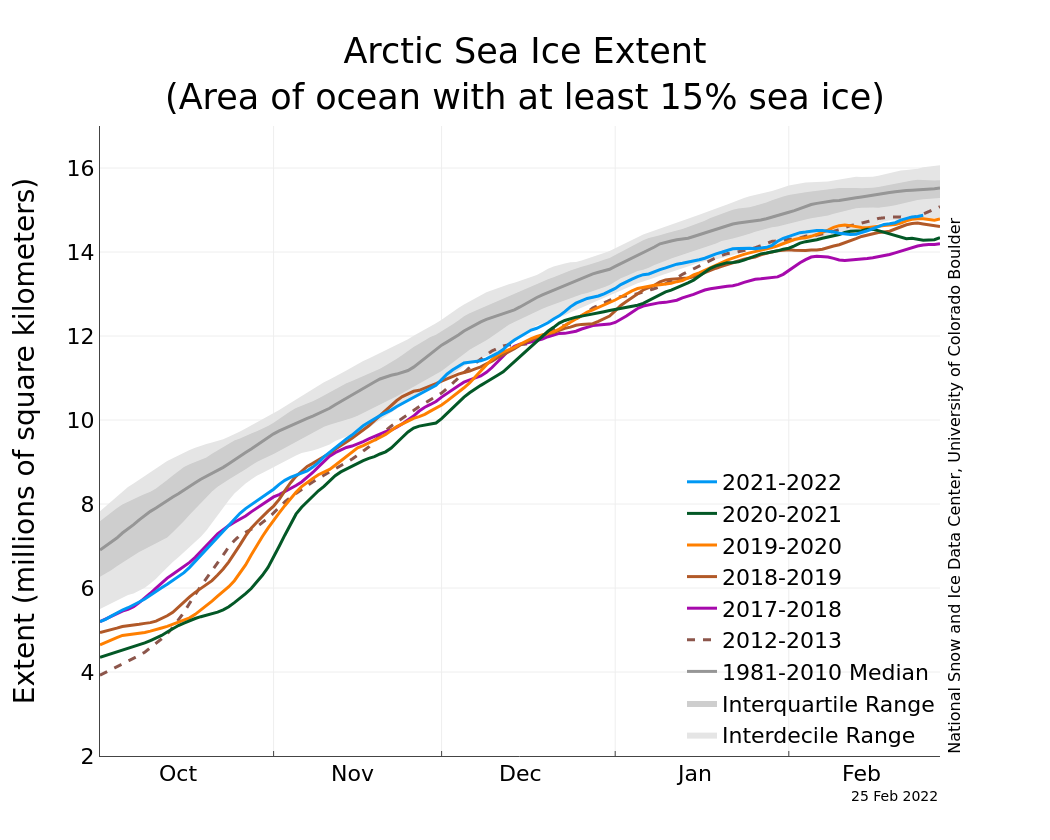
Figure 2. The graph above shows Arctic sea ice extent on February 25, 2022, along with daily ice extent data for four previous years and the record low year. 2021 to 2022 is shown in blue, 2020 to 2021 in green, 2019 to 2020 in orange, 2018 to 2019 in brown, 2017 to 2018 in magenta, and 2012 to 2013 in dashed brown. The 1981 to 2010 median is in dark gray. The gray areas around the median line show the interquartile and interdecile ranges of the data. Sea Ice Index data.
Credit: National Snow and Ice Data Center
High-resolution image
The ice growth season ended with near average sea ice extent in the Bering Sea, above average in Baffin Bay and off the coast of south-eastern Greenland, and below average in the Barents Sea with a narrow open-water wedge north of Novaya Zemlya. Extent was well below average in the Gulf of St. Lawrence and the Sea of Okhotsk.
Since the maximum on February 25, extent has dropped about 390,000 square kilometers (151,000 square miles), with losses primarily in the Sea of Okhotsk and the Barents Sea. These losses have been offset by gains in the Bering Sea, Baffin Bay, and the Labrador Sea.
Table 1. Ten lowest maximum Arctic sea ice extents (satellite record, 1979 to present)
| Rank | Year | In millions of square kilometers | In millions of square miles | Date |
| 1 | 2017 | 14.41 | 5.56 | March 7 |
| 2 | 2018 | 14.47 | 5.59 | March 17 |
| 3 | 2016 2015 |
14.51 14.52 |
5.60 5.61 |
March 23 February 25 |
| 5 | 2011 2006 |
14.67 14.68 |
5.66 5.67 |
March 9 March 12 |
| 7 | 2007 2021 |
14.77 14.77 |
5.70 5.70 |
March 12 March 21 |
| 9 | 2019 | 14.82 | 5.72 | March 13 |
| 10 | 2022 | 14.88 | 5.75 | February 25 |
For the Arctic maximum, which typically occurs in March, the uncertainty range is ~34,000 square kilometers (13,000 square miles), meaning that extents within this range must be considered effectively equal.
The Antarctic minimum
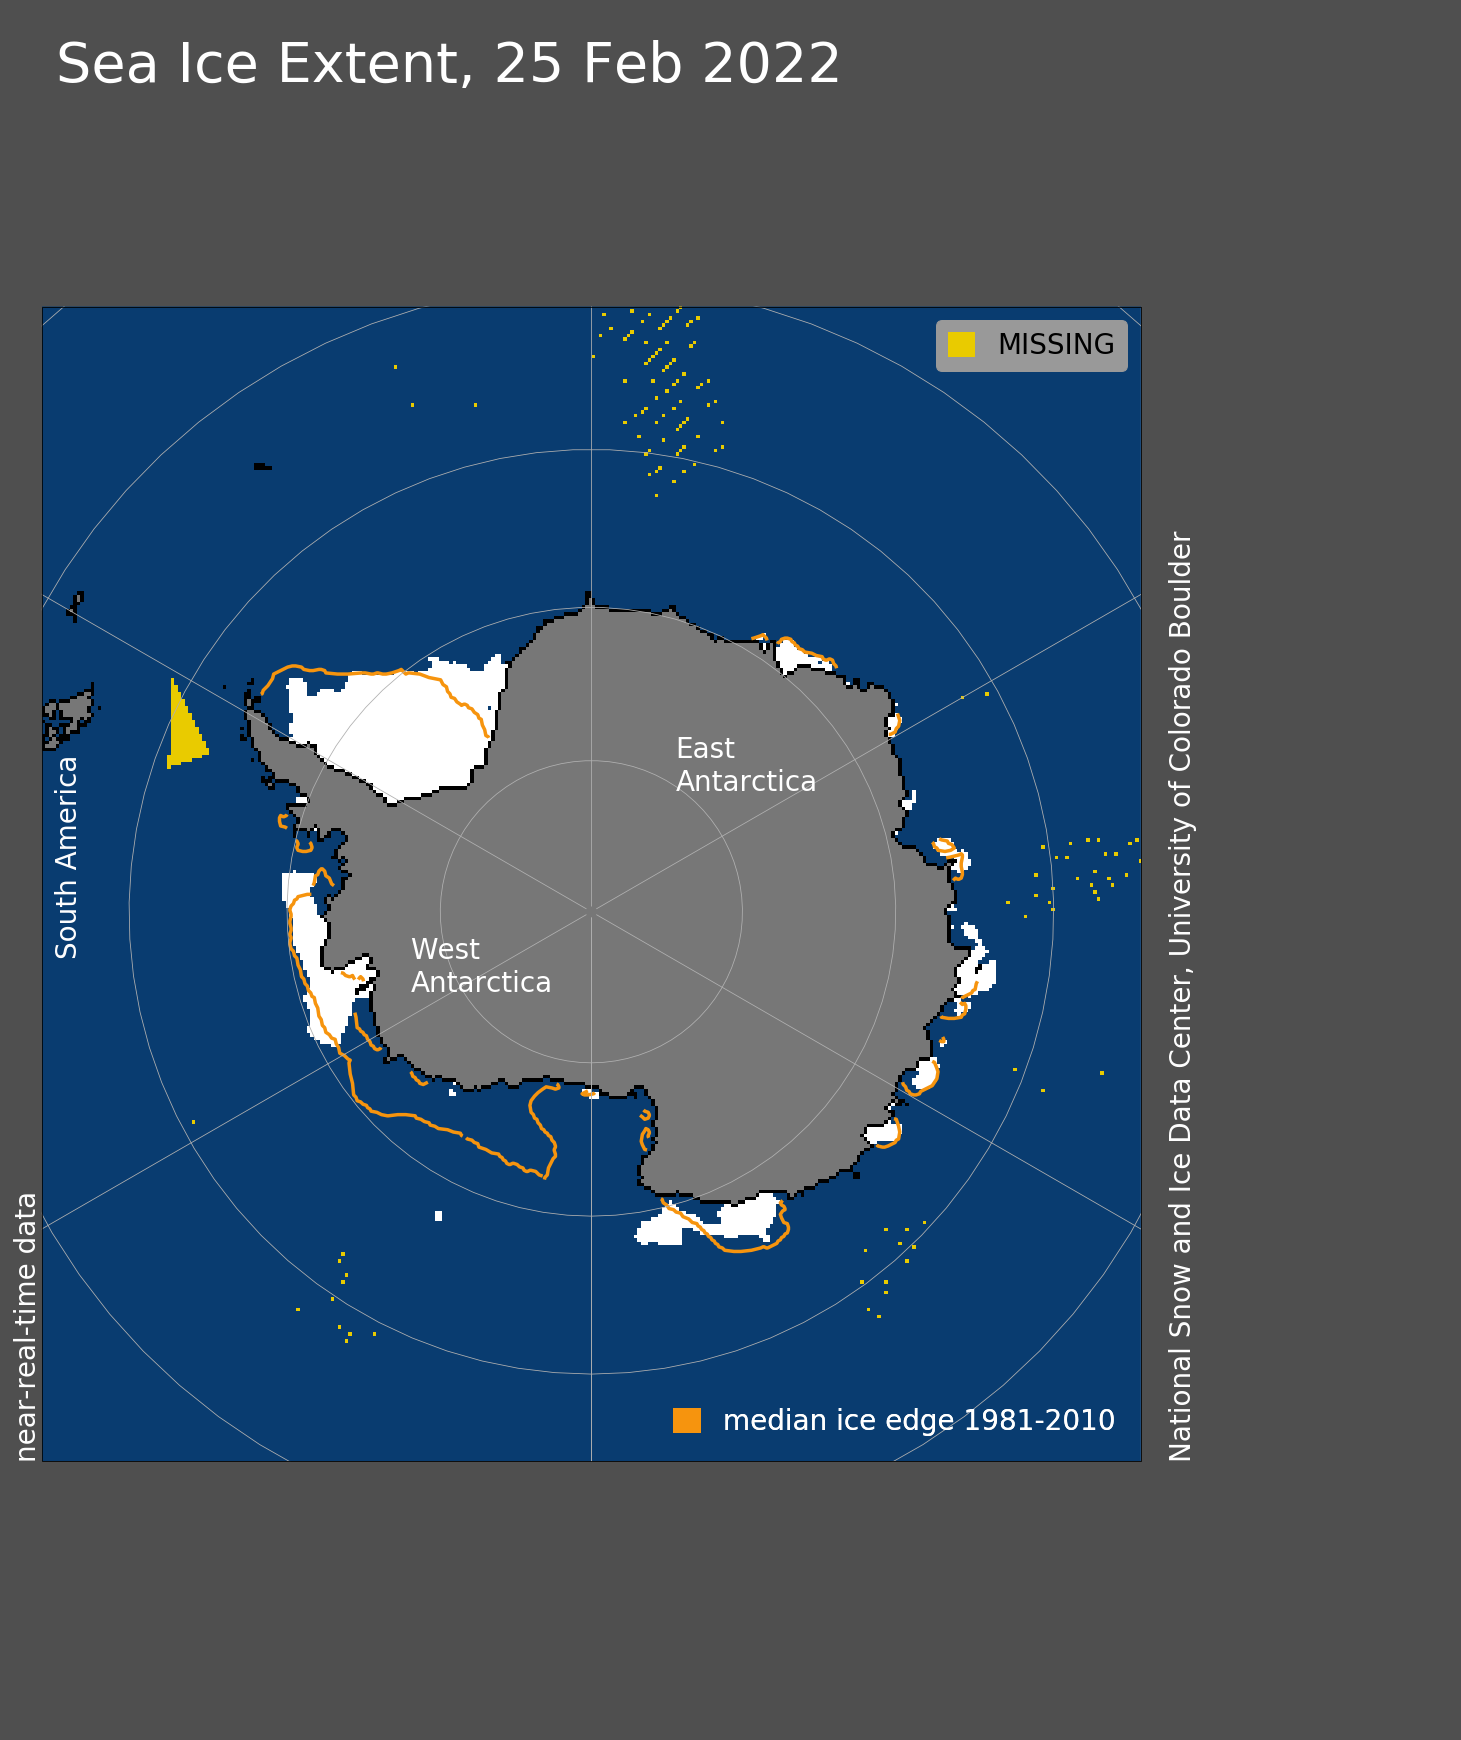
Figure 3. Antarctic sea ice extent for February 25, 2022, was 1.92 million square kilometers (741,000 square miles). The orange line shows the 1981 to 2010 average extent for that day. Sea Ice Index data. About the data
Credit: National Snow and Ice Data Center
High-resolution image
As noted in our previous post, in the Southern Hemisphere, sea ice reached its record minimum extent for the year on the same day, February 25. For the first time in the satellite record, which began in 1979, extent fell below 2 million square kilometers (772,000 square miles) at 1.92 million square kilometers (741,000 square miles). This year’s minimum extent was 190,000 square kilometers (73,400 square miles) below the previous record set on March 3, 2017. The Antarctic minimum extent is 930,000 square kilometers (359,000 square miles) below the 1981 to 2010 average minimum of 2.85 million square kilometers (1.10 million square miles).
The February 25 timing of the minimum was only a day later than the 1981 to 2010 median date of February 24 for the minimum. Over the satellite record, the Antarctic minimum has occurred as early as February 15 and as late as March 6.
Average austral summer air temperatures at the 925 mb level (about 2,500 feet above sea level) over Antarctic sea ice regions have been near average. However, winds have been much stronger and generally in a more northward direction, helping to break up the ice and melt it in warmer ocean waters. One exception was the Weddell Sea, where winds came more from the north, but that served to push the ice edge southward, reducing extent near the Antarctic Peninsula.
Since the minimum on February 25, ice growth has progressed at a near-average rate with growth around most of the continent, except off the coast of Dronning Maud Land and Enderby Land, which lie to the south of Africa.
Final analysis pending
Please note this is a preliminary announcement. At the beginning of April, NSIDC scientists will release a full analysis of winter conditions in the Arctic, along with monthly data for March.

