By July 15, 2020, Arctic sea ice extent was at a record low over the period of satellite observations for this time of year. The Siberian heat wave this past spring initiated early ice retreat along the Russian coast, leading to very low sea ice extent in the Laptev and Barents Seas. The Northern Sea route appears to be nearly open.
Overview of conditions
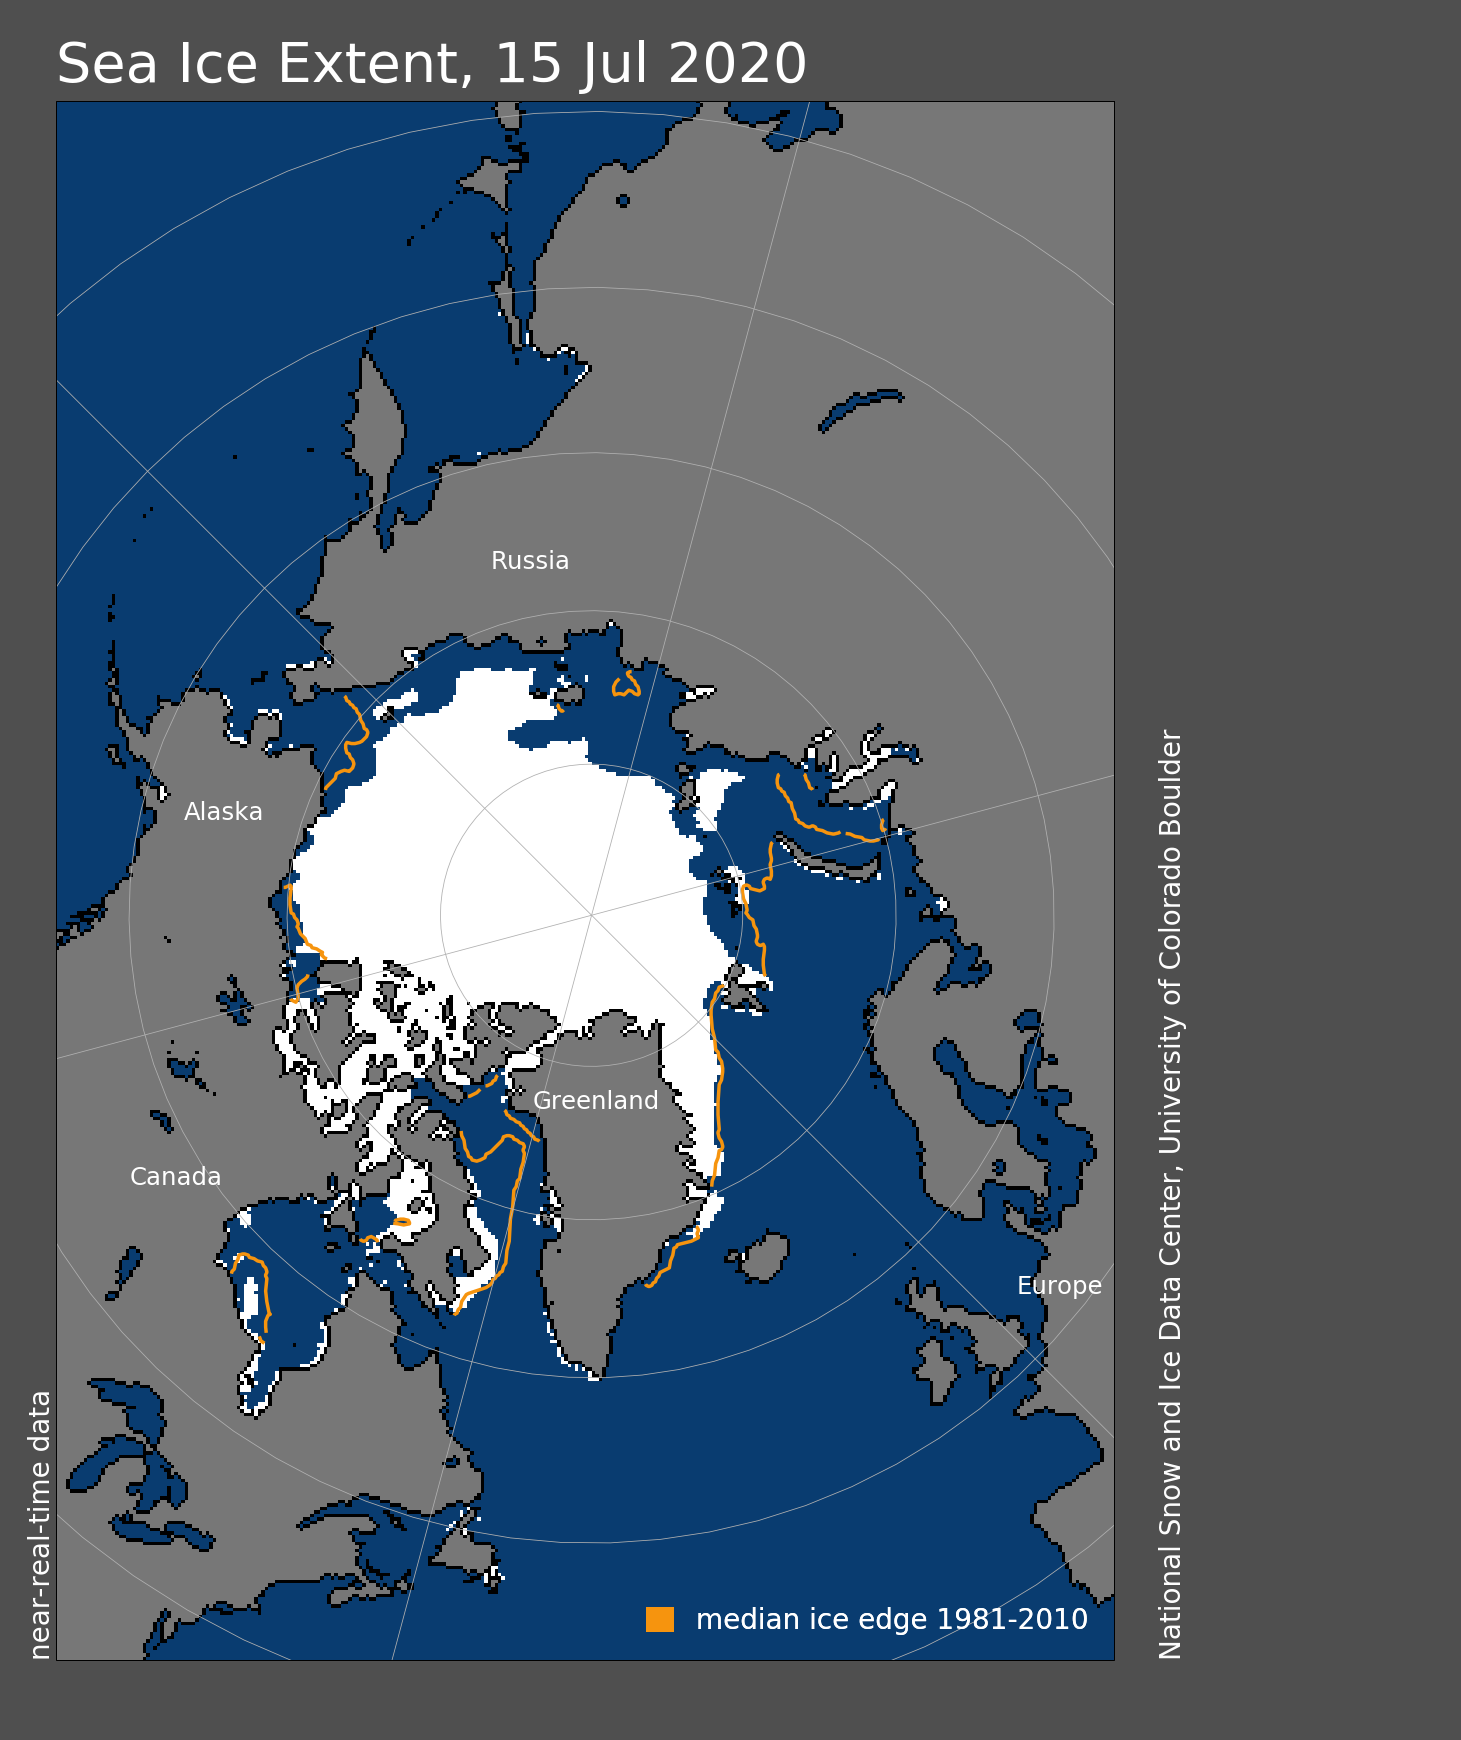
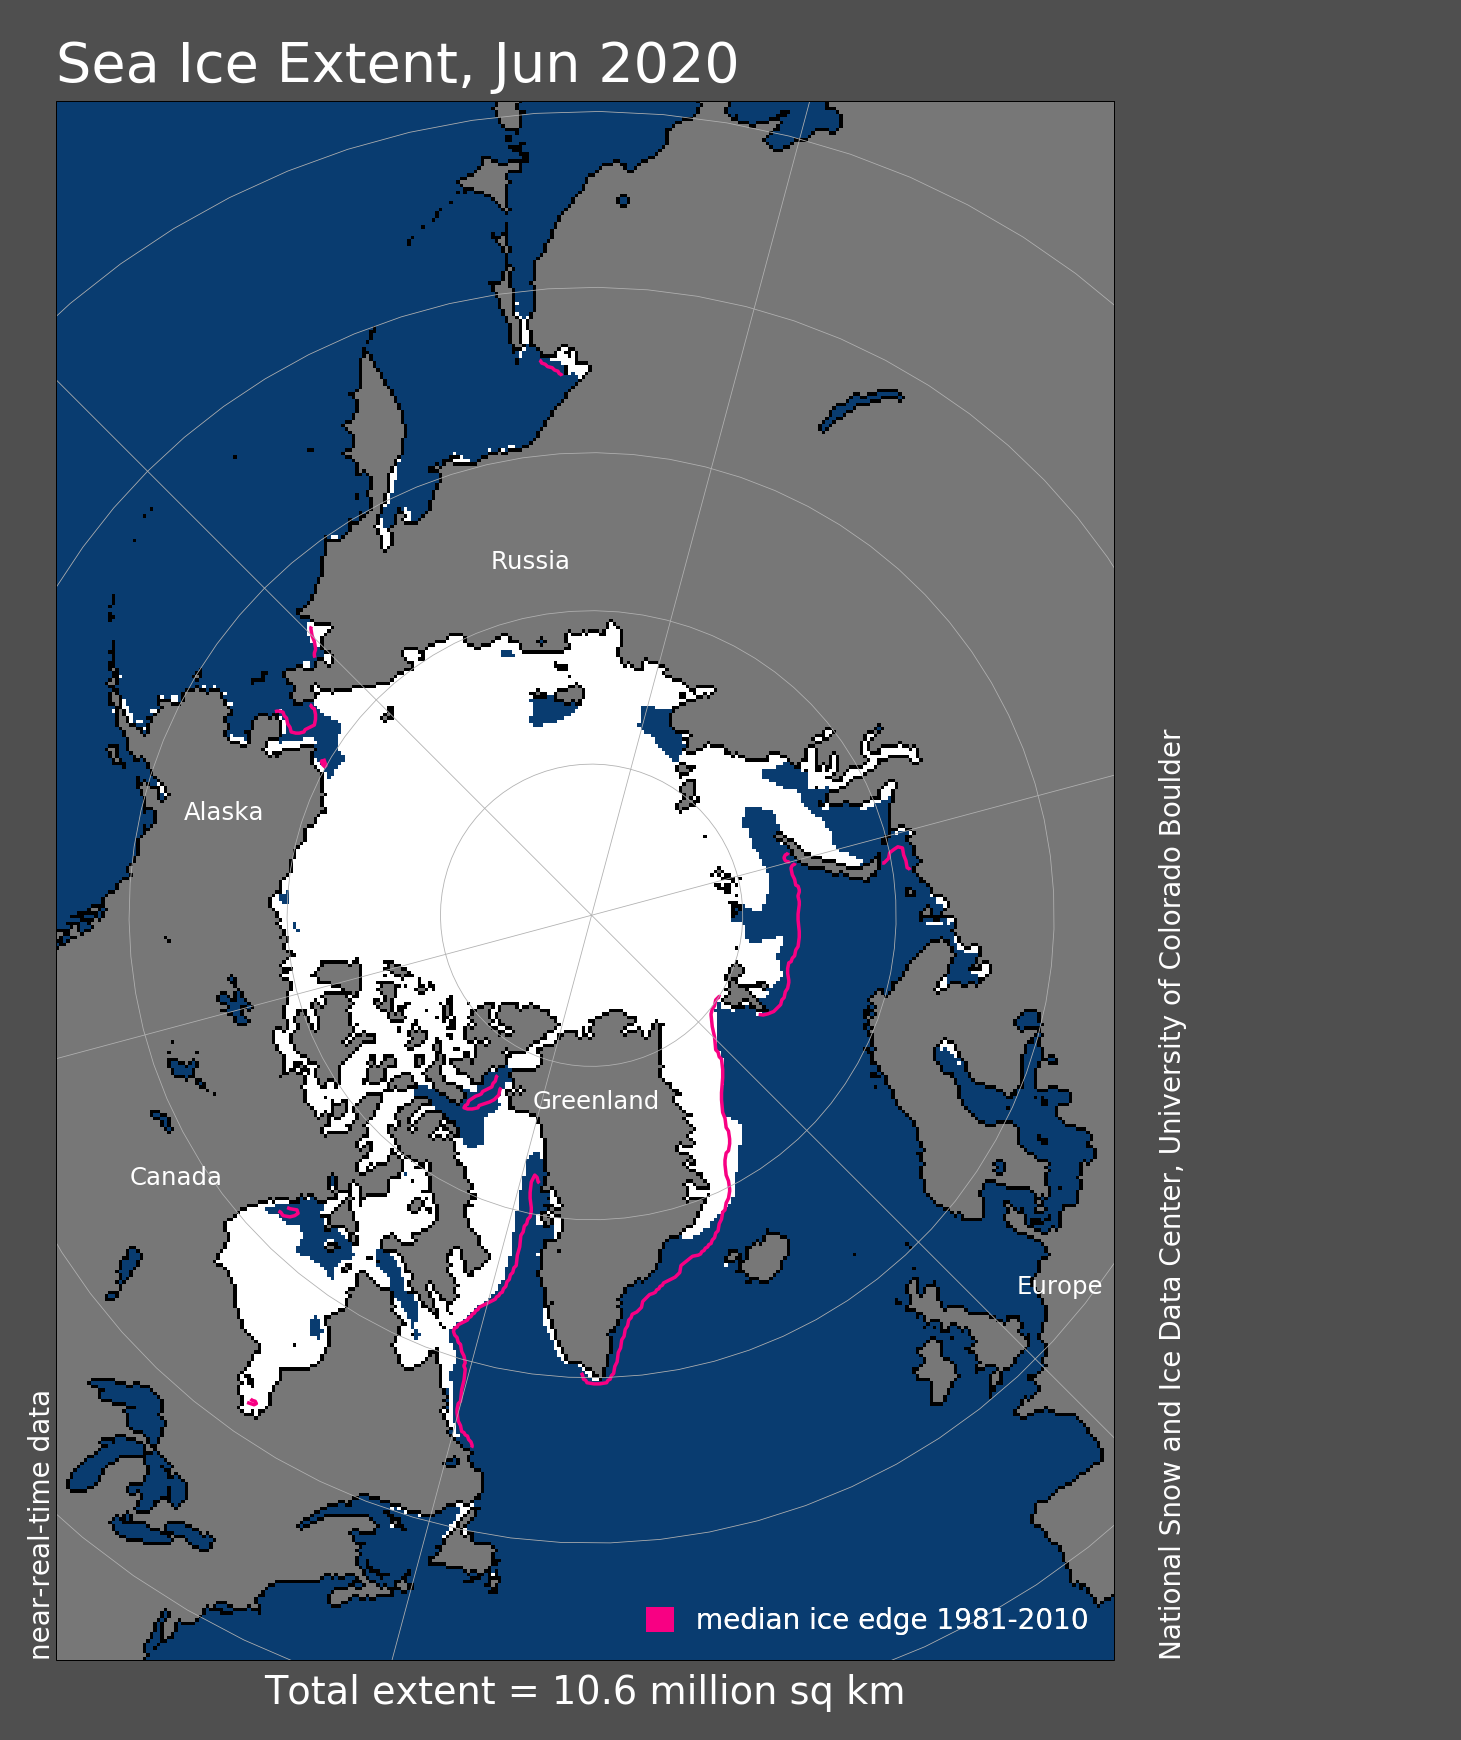
Figure 1. Arctic sea ice extent for July 15, 2020 was 7.51 million square kilometers (2.90 million square miles). The orange line shows the 1981 to 2010 average extent for that day. Sea Ice Index data. About the data
Credit: National Snow and Ice Data Center
High-resolution image
On July 15, Arctic sea ice extent stood at 7.51 million square kilometers (2.90 million square miles), 330,000 square kilometers (127,000 square miles) below the record for July 15, set in 2011. This places extent at the lowest level for this time of year on the satellite record. Low extent for the Arctic as a whole is largely driven by extensive open water in the Laptev and Barents Seas, continuing the pattern that began this spring and was discussed in the previous post. Ice concentrations are low in the East Siberian Sea; remaining ice in this area is likely to melt out soon. By contrast, extent north of Alaska is near the 1981 to 2010 average for this time of year. Such contrasts serve as prominent examples of the larger variations that occur for sea ice extent on the regional scale in comparison to the Arctic Ocean as a whole.
Conditions in context
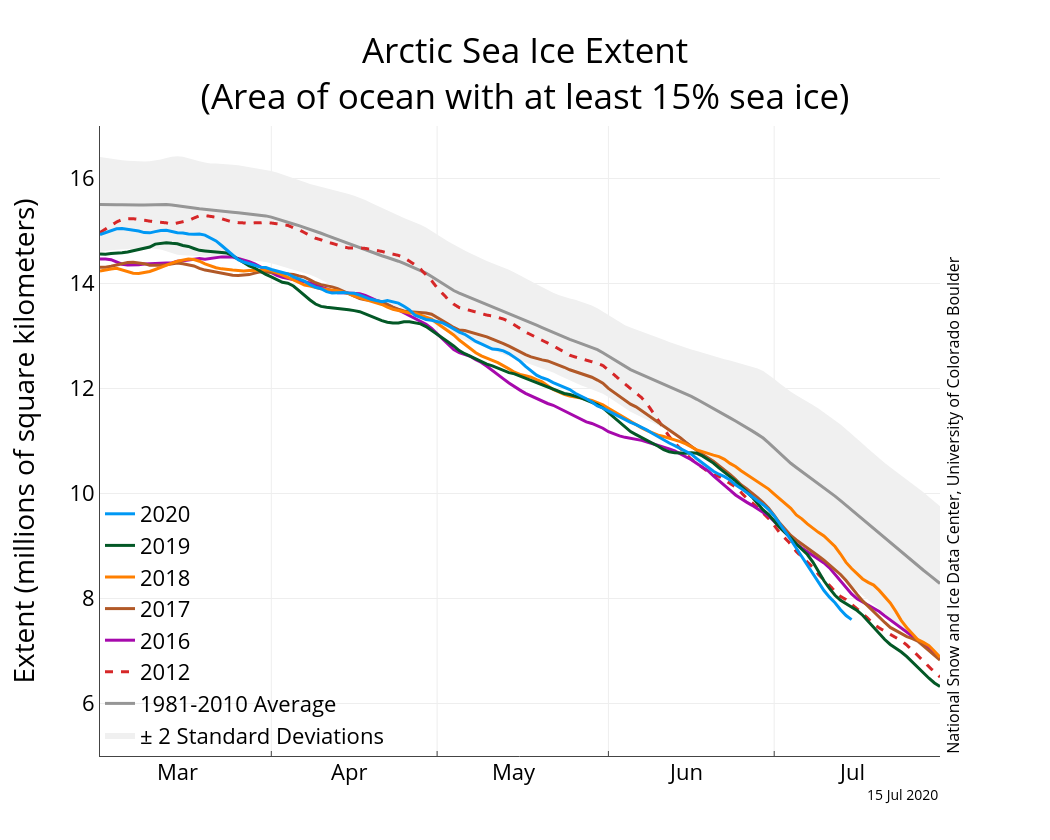
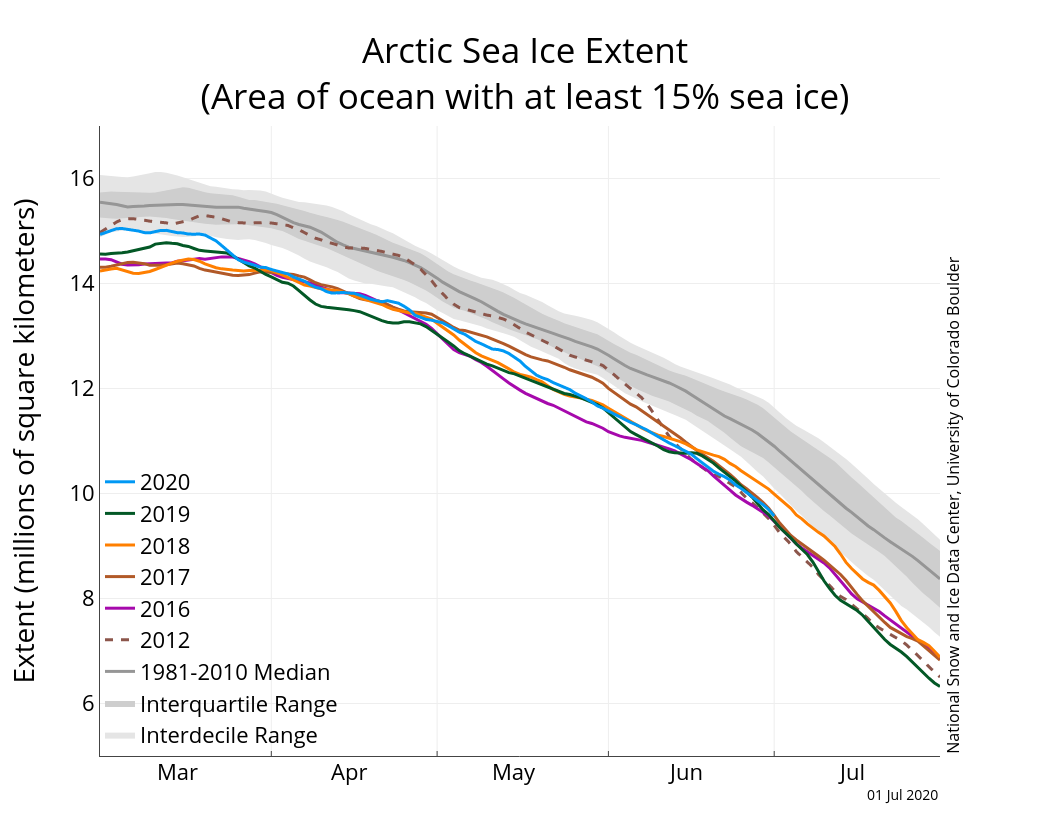
Figure 2a. The graph above shows Arctic sea ice extent as of July 15, 2020, along with daily ice extent data for four previous years and the record low year. 2020 is shown in blue, 2019 in green, 2018 in orange, 2017 in brown, 2016 in purple, and 2012 in dashed red. The 1981 to 2010 median is in dark gray. The gray areas around the median line show the interquartile and interdecile ranges of the data. Sea Ice Index data.
Credit: National Snow and Ice Data Center
High-resolution image

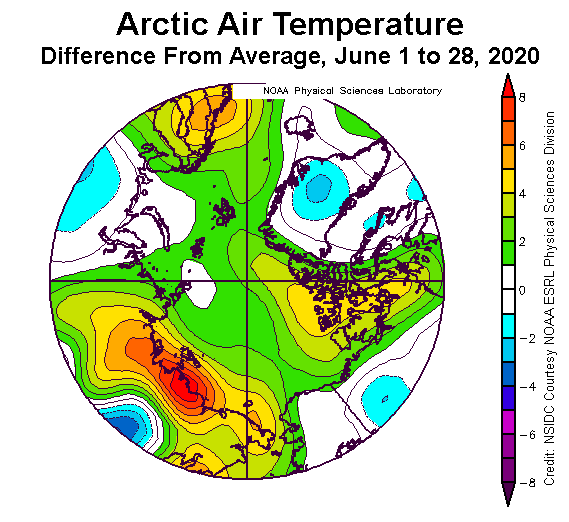
Figure 2b. This plot shows the departure from average air temperature in the Arctic at the 925 hPa level, in degrees Celsius, from July 1 to 13, 2020. Yellows and reds indicate higher than average temperatures; blues and purples indicate lower than average temperatures.
Credit: NSIDC courtesy NOAA Earth System Research Laboratory Physical Sciences Division
High-resolution image
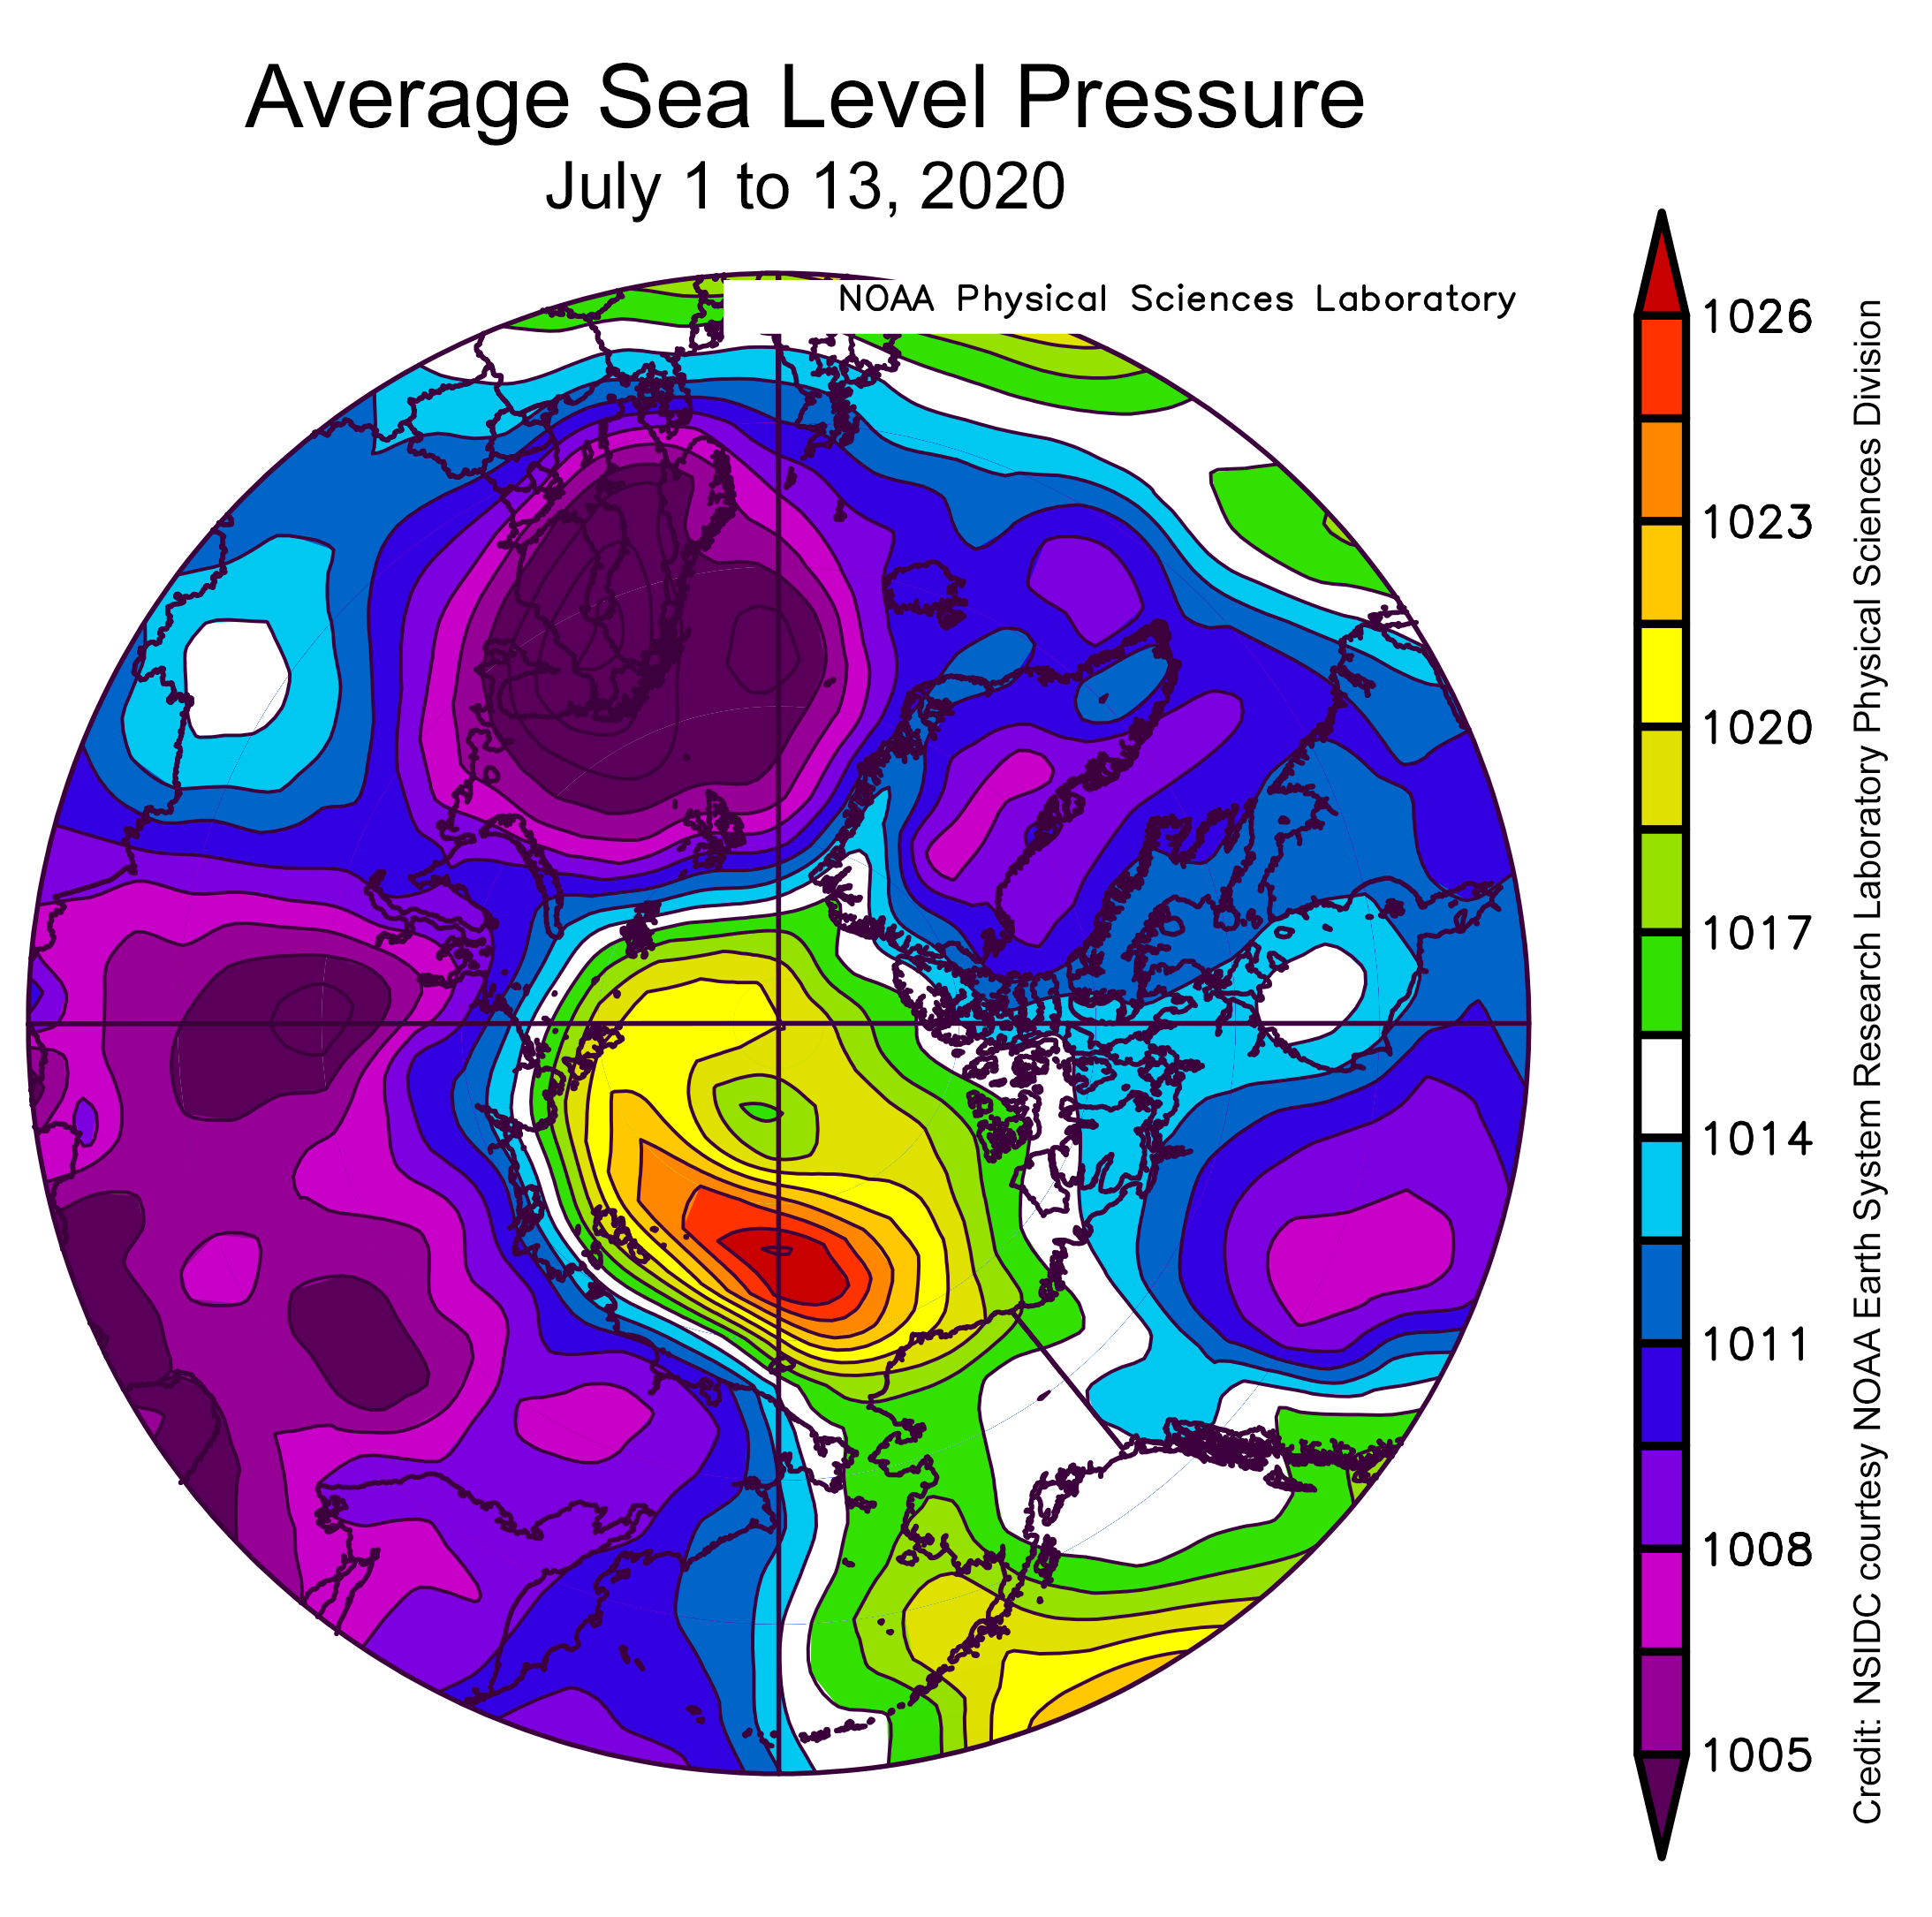
Figure 2c. This plot shows average sea level pressure in the Arctic in millibars (hPa) from July 1 to 13, 2020. Yellows and reds indicate high air pressure; blues and purples indicate low pressure.
Credit: NSIDC courtesy NOAA Earth System Research Laboratory Physical Sciences Division
High-resolution image
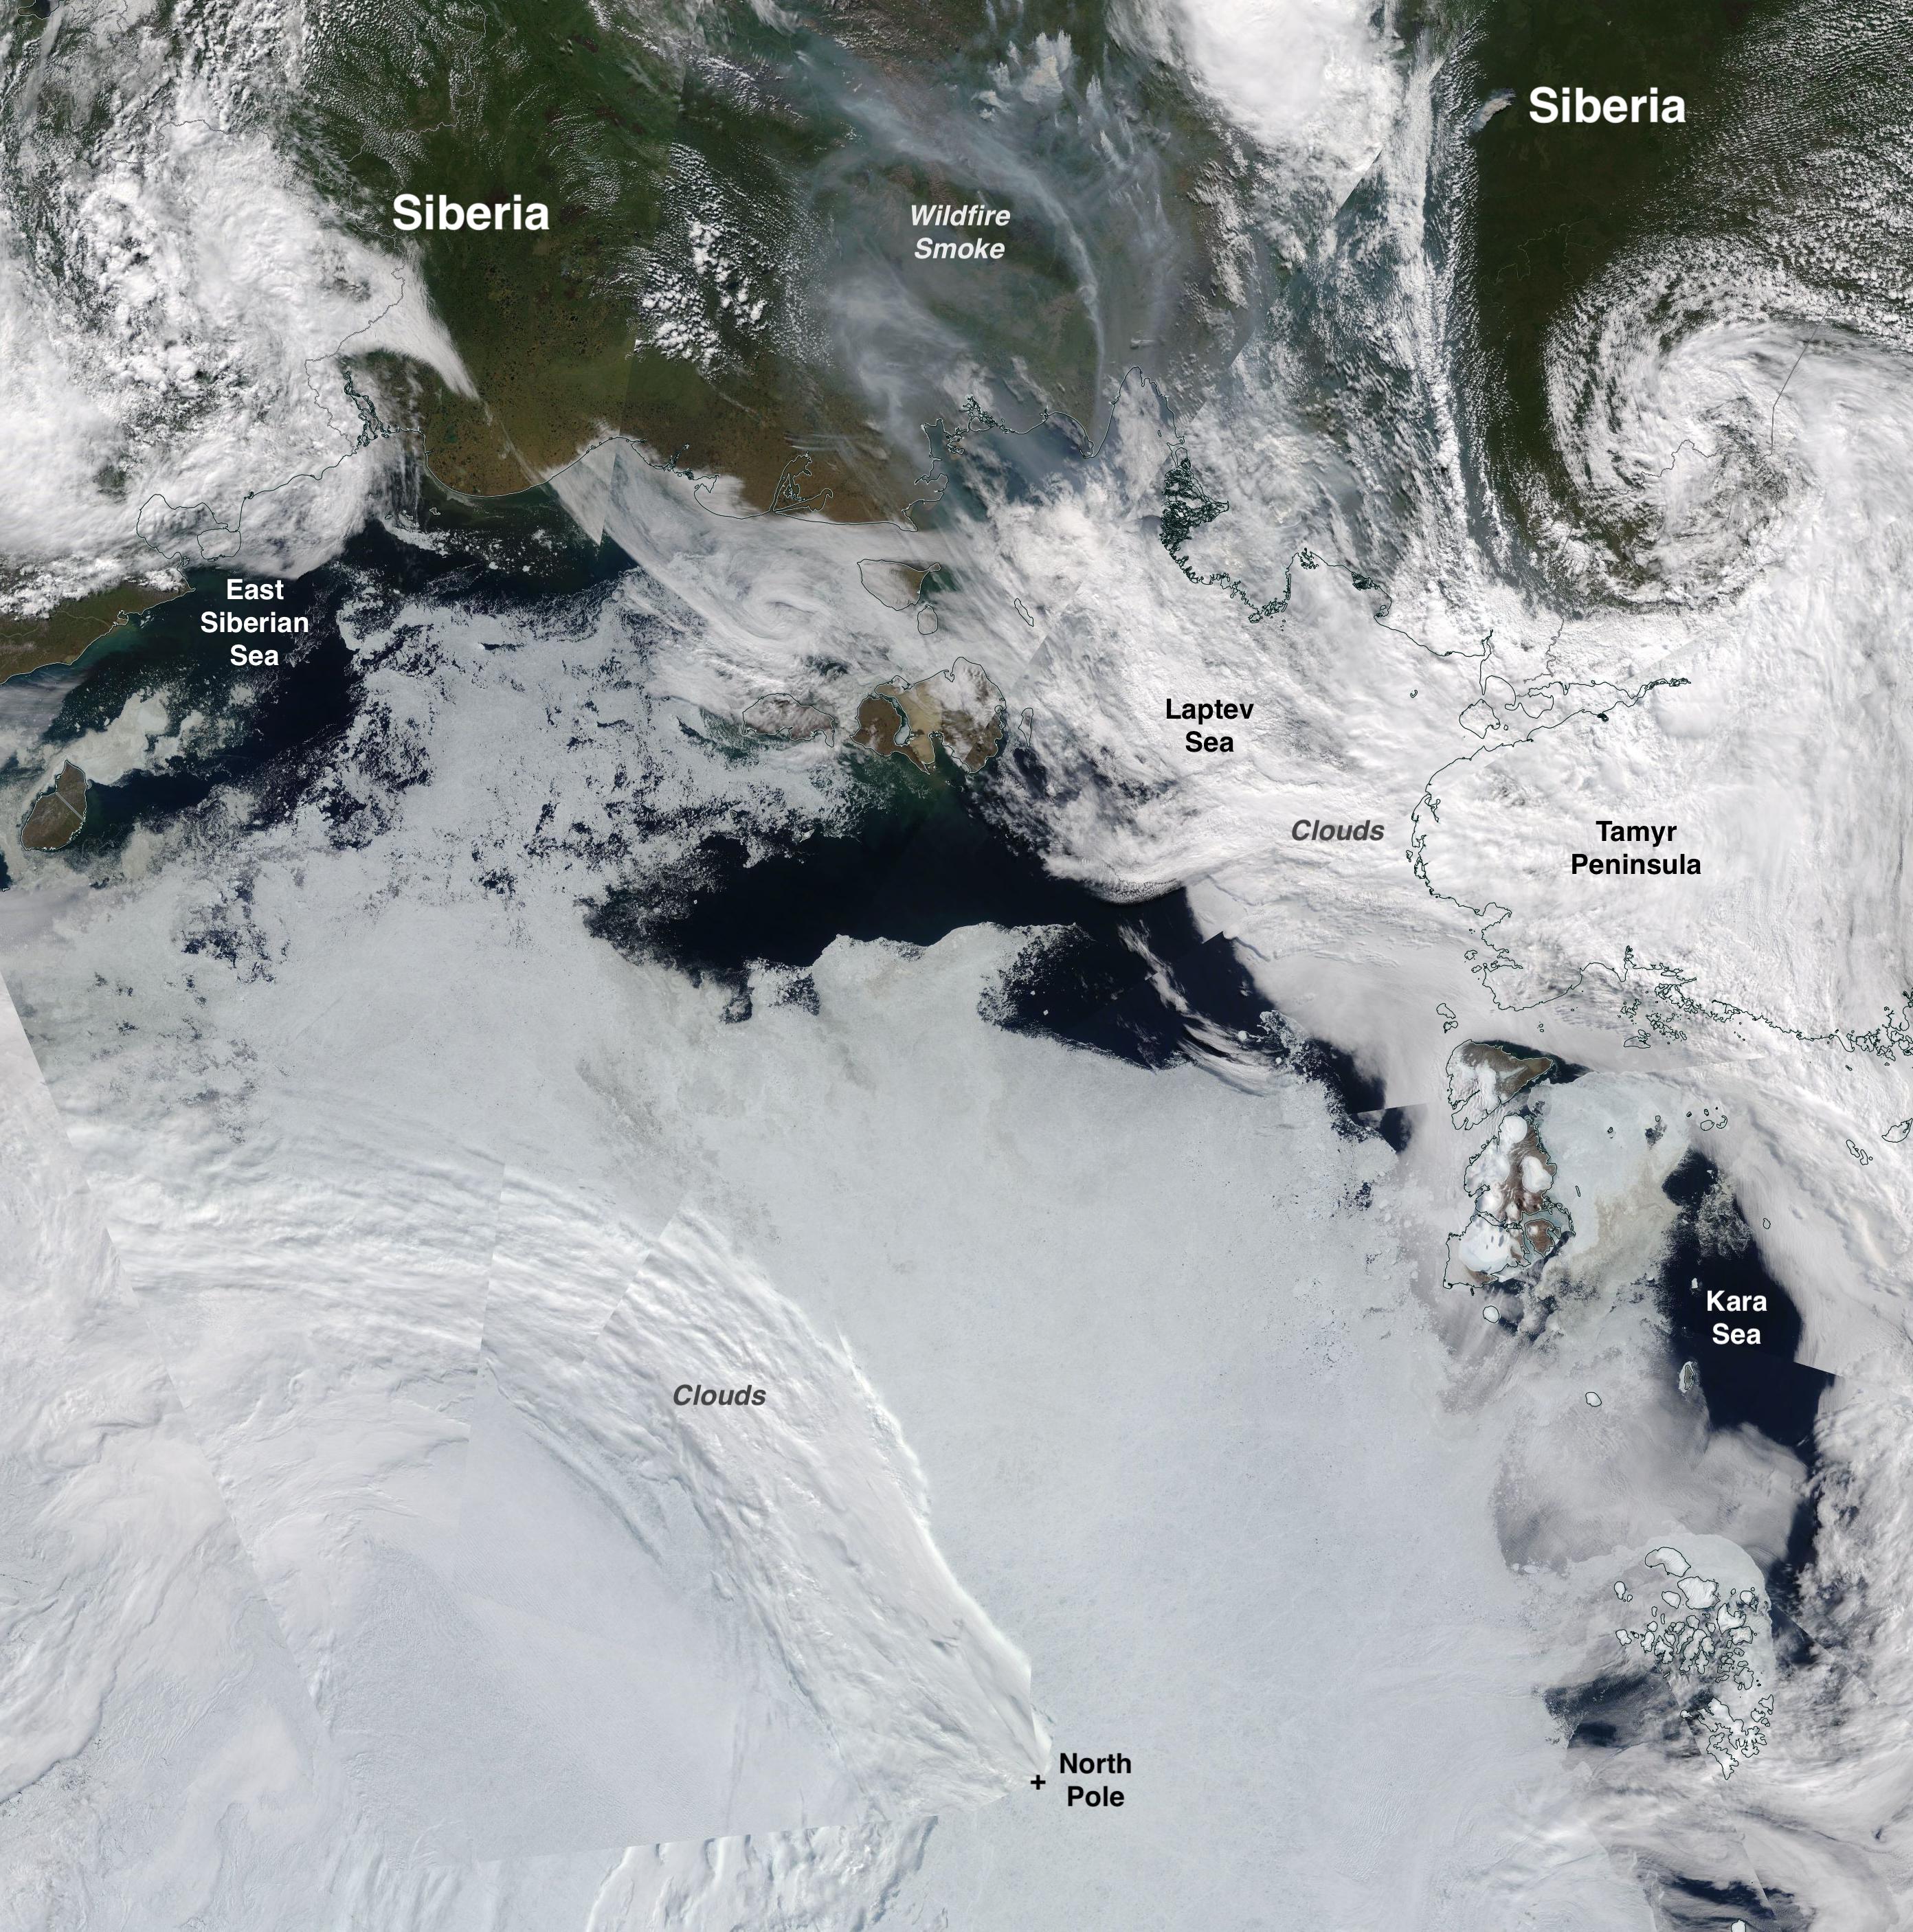
Figure 2d. This true-color composite image shows broken up sea ice on the Siberian coast, taken by the Moderate Resolution Imaging Spectroradiometer (MODIS) sensor on the NASA Terra satellite on July 12, 2020. Also visible is the smoke from wildfires surging in Siberia.
Credit: NASA Worldview
High-resolution image
Through the first half of July 2020, sea ice extent declined by an average of 146,000 square kilometers (56,400 square miles) per day, considerably faster than the 1981 to 2010 average rate of 85,900 square kilometers (33,200 square miles) per day (Figure 2a).
Air temperatures at the 925 mb level (about 2,500 feet above sea level), as averaged over the first half of July, were unusually high over the central Arctic Ocean—up to 10 degrees Celsius (18 degrees Fahrenheit) (Figure 2b). These above average temperatures were associated with high sea level pressure, centered over the East Siberian and Chukchi Seas (Figure 2c). Arctic temperatures along the Russian coast were near to slightly above average. This is a sharp change from June, when, as part of the Siberian heat wave that has garnered much attention in the media, temperatures along the Siberian coast of the eastern Laptev Sea were 8 degrees Celsius (14 degrees Fahrenheit) above average. It is likely these high temperatures, combined with ice motion away from the coast, initiated early ice retreat along the Russian coast, leading to the present low ice extent (Figure 2d). Based on imagery from AMSR-2 processed by colleagues at the University of Bremen, the Northern Sea Route along the Russian coast appears to be largely open.
Greenland melting
For the first half of July, surface melt over the Greenland Ice Sheet has been above the 1981 to 2010 average, with a spike on July 10 when about 34 percent of the ice sheet experienced some melt. However, this spike pales in comparison to July 11, 2012, when nearly the entire ice sheet experienced some melt. Melt spikes are associated with warm air advection and cloud cover associated with the passage of weather systems. To date, the 2020 season has seen above average surface melt area, relative to 1981 to 2010, but somewhat lower melt extent than several recent years. A further analysis of the ongoing Greenland melt season will be forthcoming in early August in our Greenland Today analysis.
Antarctica freezing
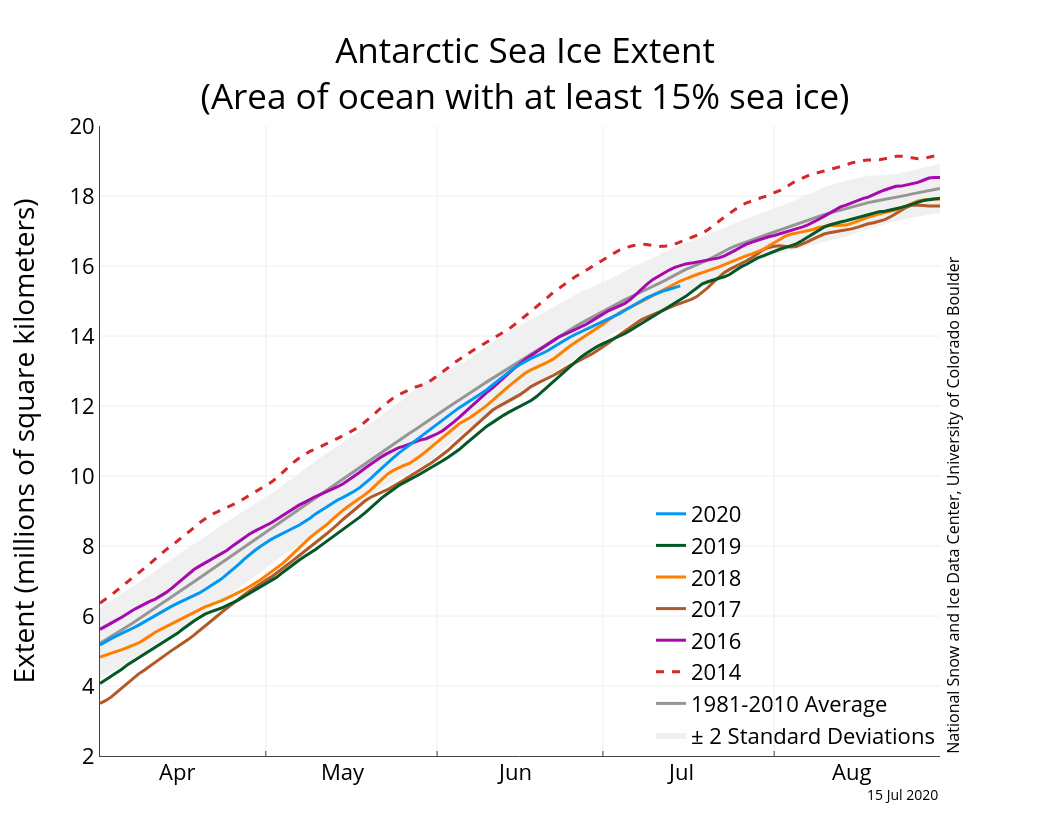
Figure 3. The graph above shows Antarctic sea ice extent as of July 15, 2020, along with daily ice extent data for four previous years and the record high year. 2020 is shown in blue, 2019 in green, 2018 in orange, 2017 in brown, 2016 in purple, and 2014 in dashed red. The 1981 to 2010 median is in dark gray. The gray areas around the median line show the interquartile and interdecile ranges of the data. Sea Ice Index data.
Credit: National Snow and Ice Data Center
High-resolution image
Antarctic sea ice extent as of July 15 was slightly below the 1981 to 2010 average, continuing the trend for nearly every day this year. An effort is underway to use a combination of data from the NASA Ice Cloud and Elevation Satelite-2 (ICESat-2), a laser altimeter, and European Space Agency (ESA) CryoSat-2, a radar altimeter, to provide simultaneous snow surface and underlying sea ice surface heights. Generally, it is assumed that the ICESat-2 laser altimeter estimates the height of the top of the snow, while the radar altimeter on CryoSat-2 penetrates through the snow and obtains a measurement of the top of the ice surface beneath the snow. While there are many uncertainties in these characteristics, subtracting the two values—ICESat-2 height minus CryoSat-2 height—can potentially provide an estimate of snow thickness, a key variable needed to accurately determine sea ice thickness. A study by colleague Ron Kwok demonstrated the efficacy of the approach at cross-over point for the two satellite’s orbit tracks. Plans are now underway to align the satellite orbits such that they fly nearly overlapping profiles over long distances with a very short interval between sensor measurements. This longer comparison area and close time separation will be particularly important for assessing Antarctic sea ice, which has much more variability in ice floe age and origin than Arctic sea ice. It will allow the first careful assessment of Antarctic sea ice mass, and over time, the trend in mass, if any.
Further reading
, , , , and A. A. 2020. Arctic snow depth and sea ice thickness from ICESat‐2 and CryoSat‐2 freeboards: A first examination. Journal of Geophysical Research: Oceans, 125, e2019JC016008. doi:10.1029/2019JC016008.