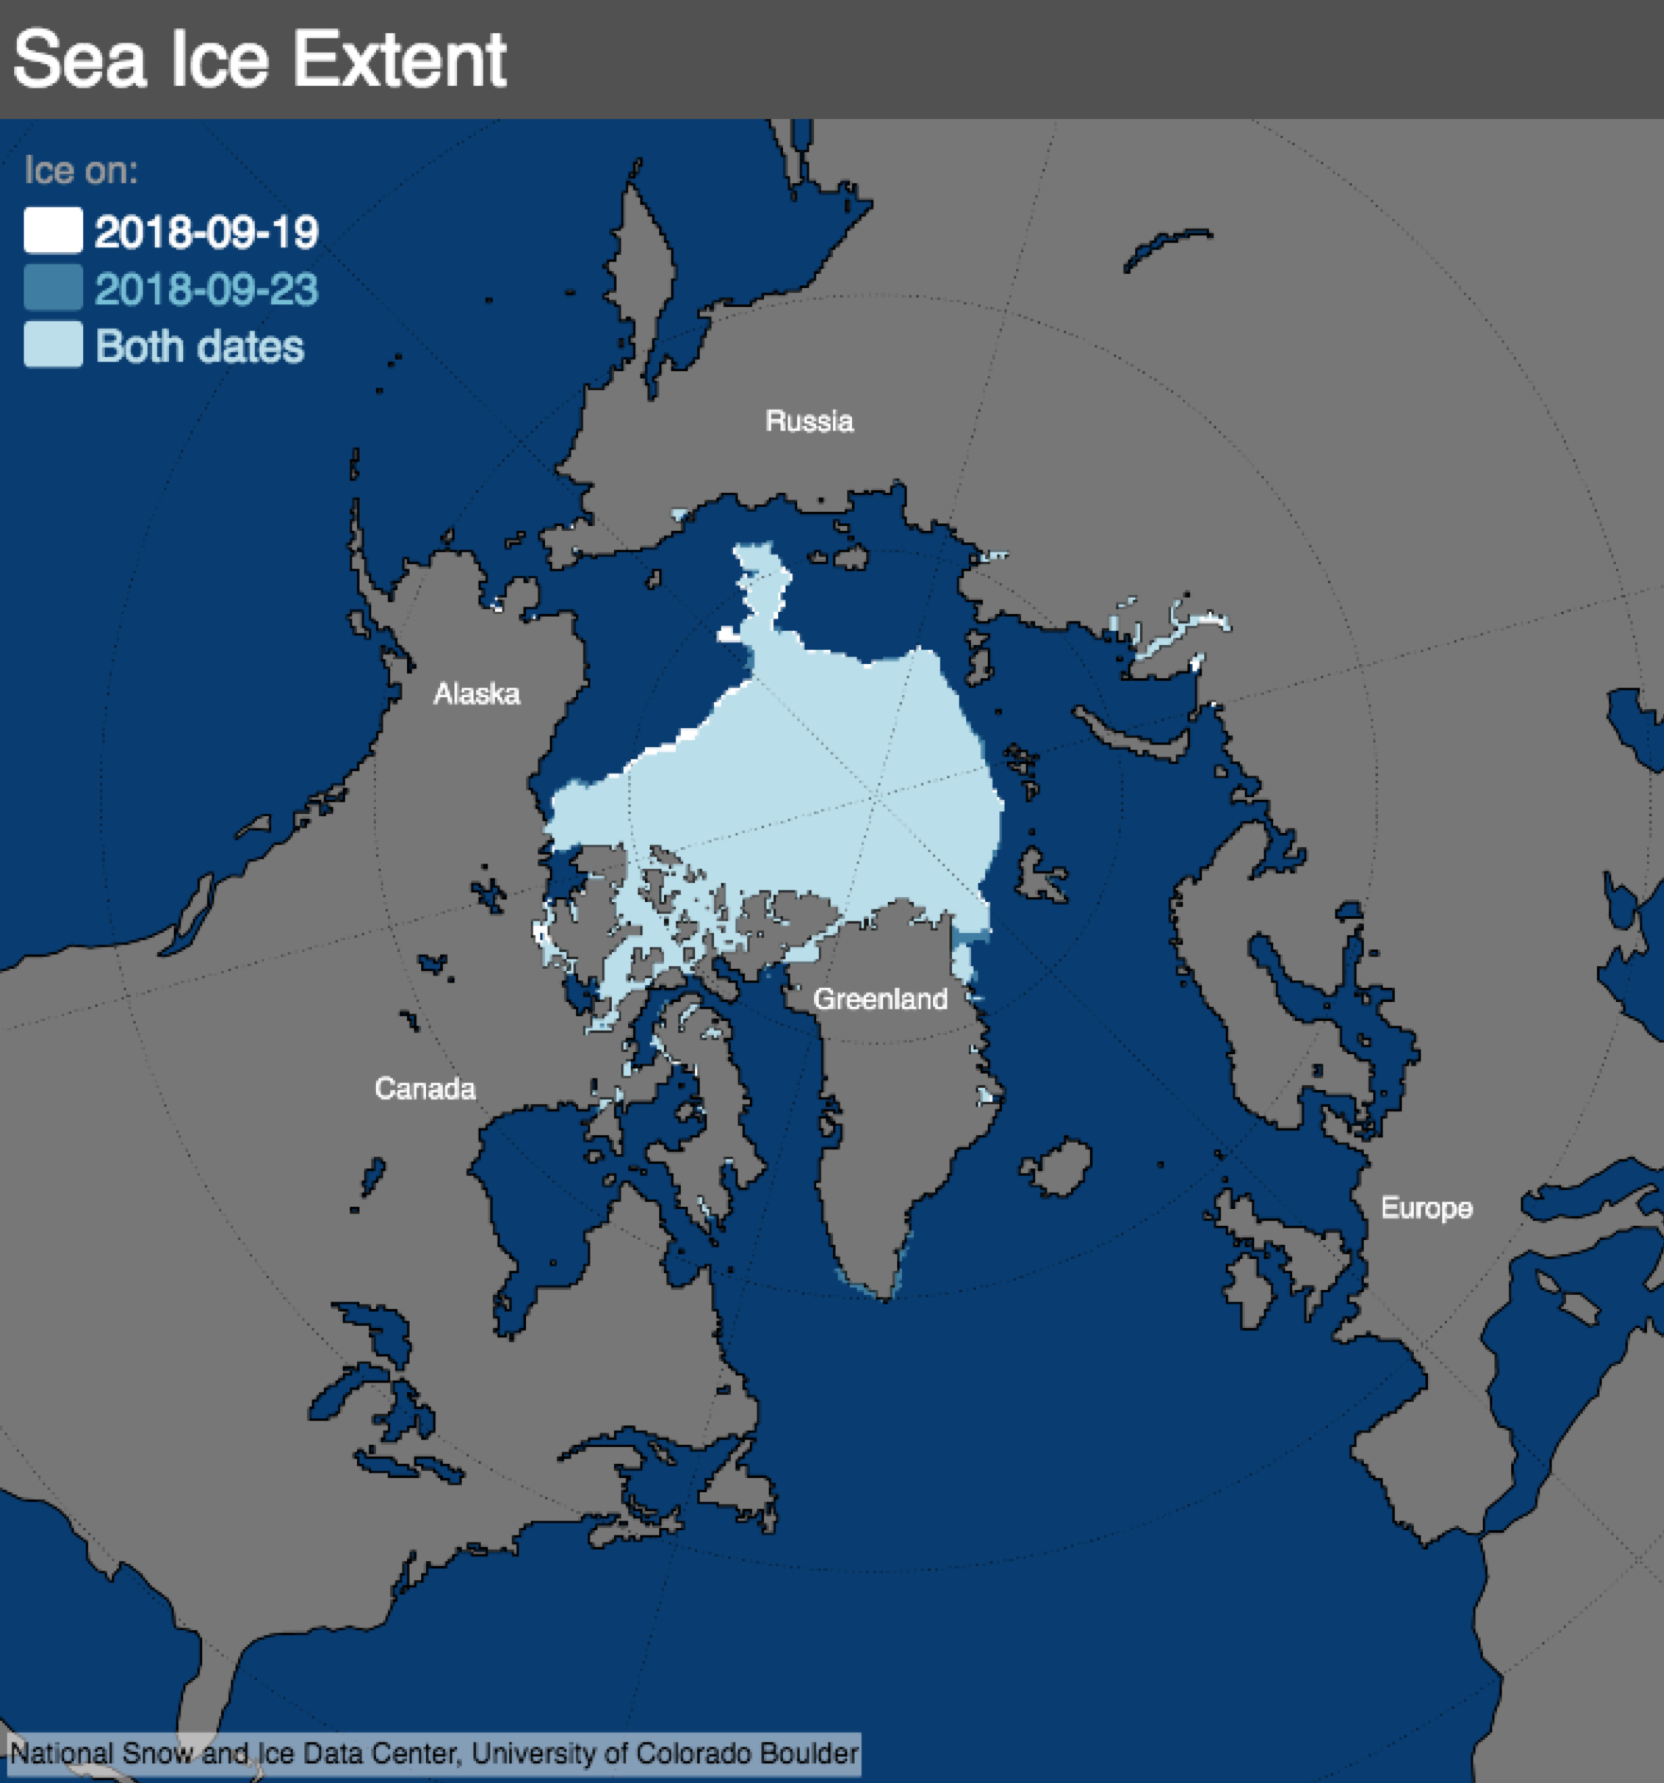
With the waning of Arctic summer, the seasonal decrease in sea ice extent has slowed. At this time of the year, the extent is the highest it has been since 2014. Nevertheless, sea ice extent remains well below the interdecile range (lowest 10 percent for ice extent years). The minimum is expected to be one of the ten lowest in the satellite record.
Overview of conditions
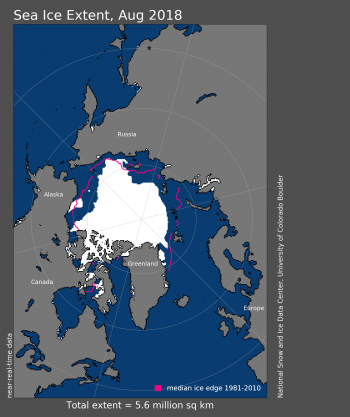
Figure 1. Arctic sea ice extent for August 2018 was 5.61 million square kilometers (2.17 million square miles). The magenta line shows the 1981 to 2010 average extent for that month. Sea Ice Index data. About the data
Credit: National Snow and Ice Data Center
High-resolution image
Arctic sea ice extent for August 2018 averaged 5.61 million square kilometers (2.17 million square miles). This was 1.59 million square kilometers (614,000 square miles) below the 1981 to 2010 long-term average sea ice extent, and 890,000 square kilometers (344,000 square miles) above the record low for the month set in August 2012. August 2018 was the seventh lowest August extent in the satellite record, but the highest August extent since 2014.
At the end of the month, sea ice extent stood at 4.97 million square kilometers (1.92 million square miles). Sea ice extent remained low along the coastal seas of the Arctic Ocean with the exception of the East Siberian Sea. The Northern Sea Route nevertheless appears to be navigable. Low sea ice concentrations persist in the northern Beaufort and Laptev Seas; these areas may still retreat further north before the melt season ends. The Northwest Passage is still choked with ice and is likely to remain so.
Conditions in context
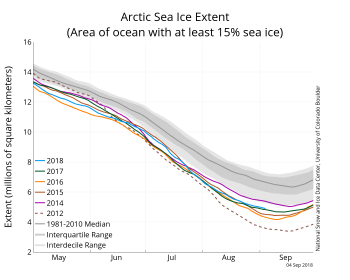
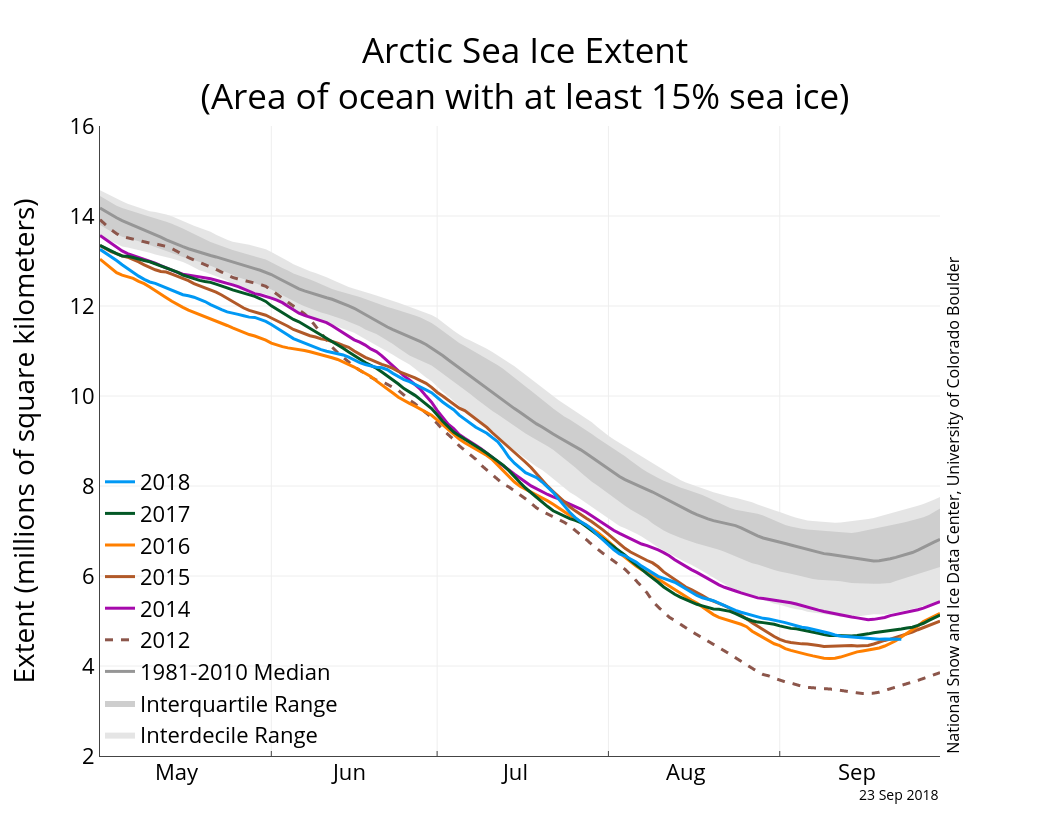
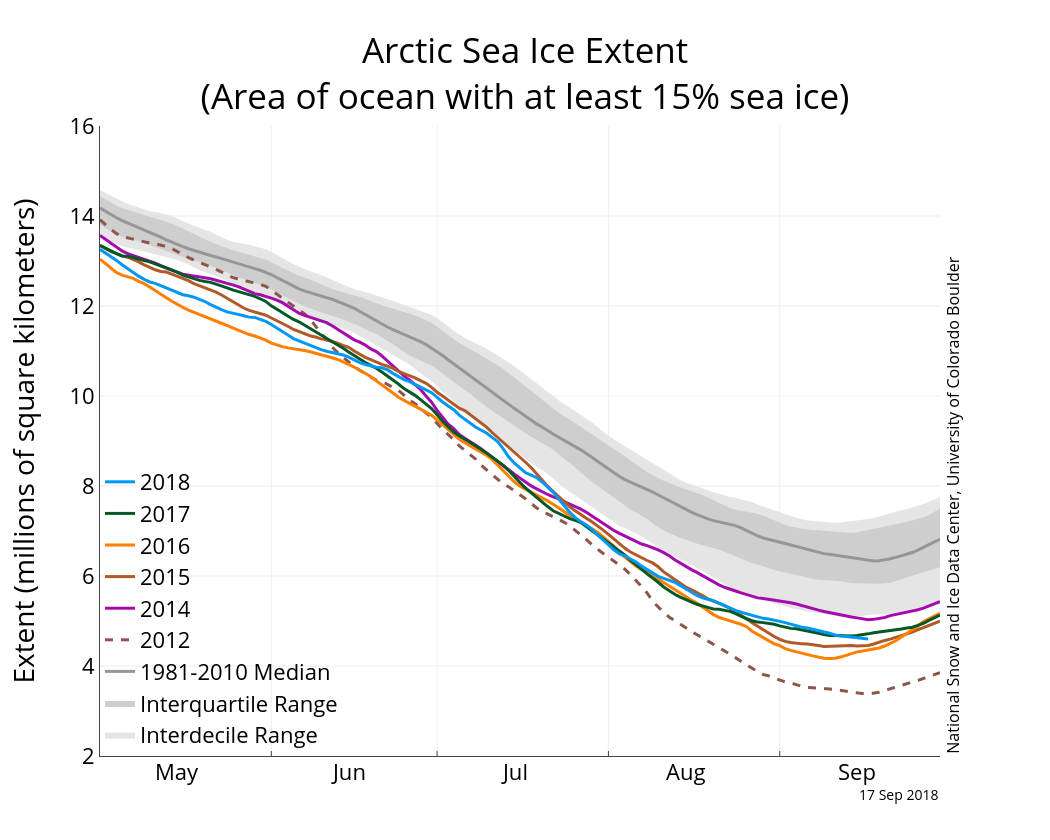
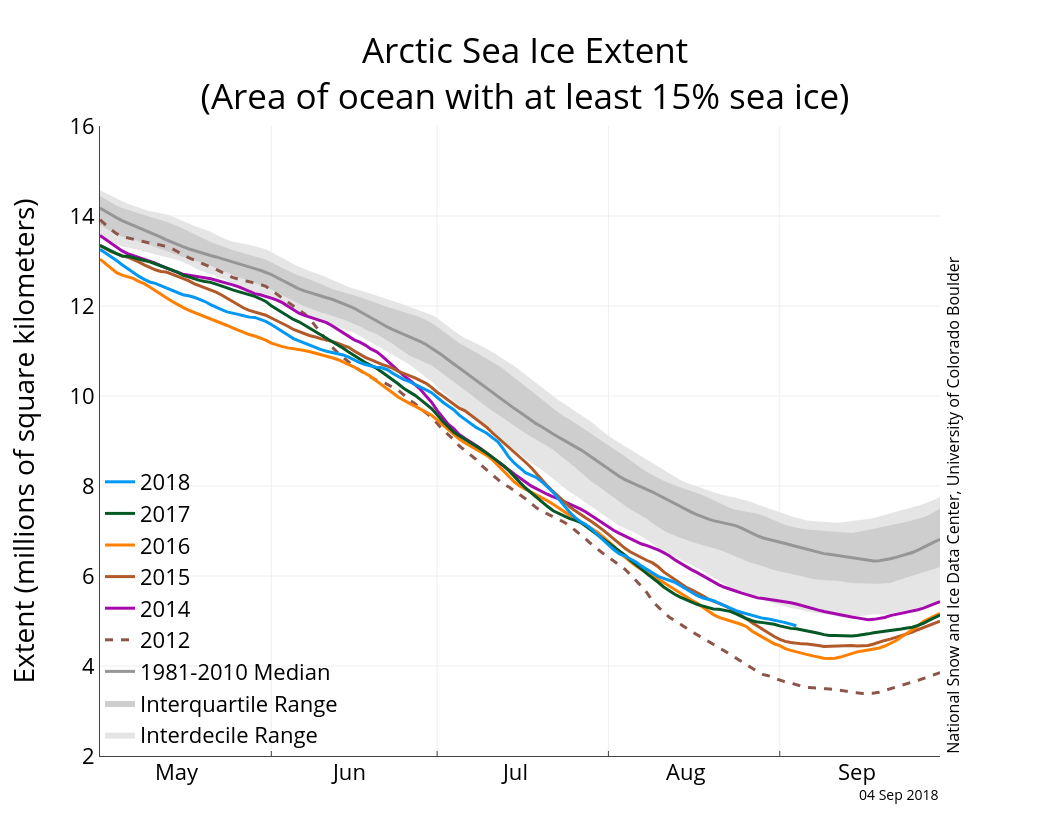
Figure 2a. The graph above shows Arctic sea ice extent as of September, 4, 2018, along with daily ice extent data for four previous years and 2012, the year with record low minimum extent. 2018 is shown in blue, 2017 in green, 2016 in orange, 2015 in brown, 2014 in purple, and 2012 in dotted brown. The 1981 to 2010 median is in dark gray. The gray areas around the median line show the interquartile and interdecile ranges of the data. Sea Ice Index data.
Credit: National Snow and Ice Data Center
High-resolution image
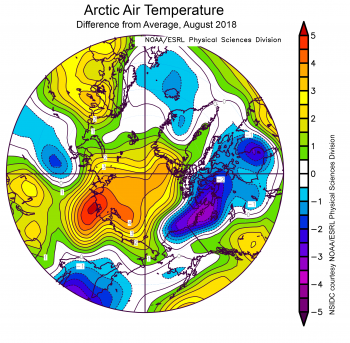
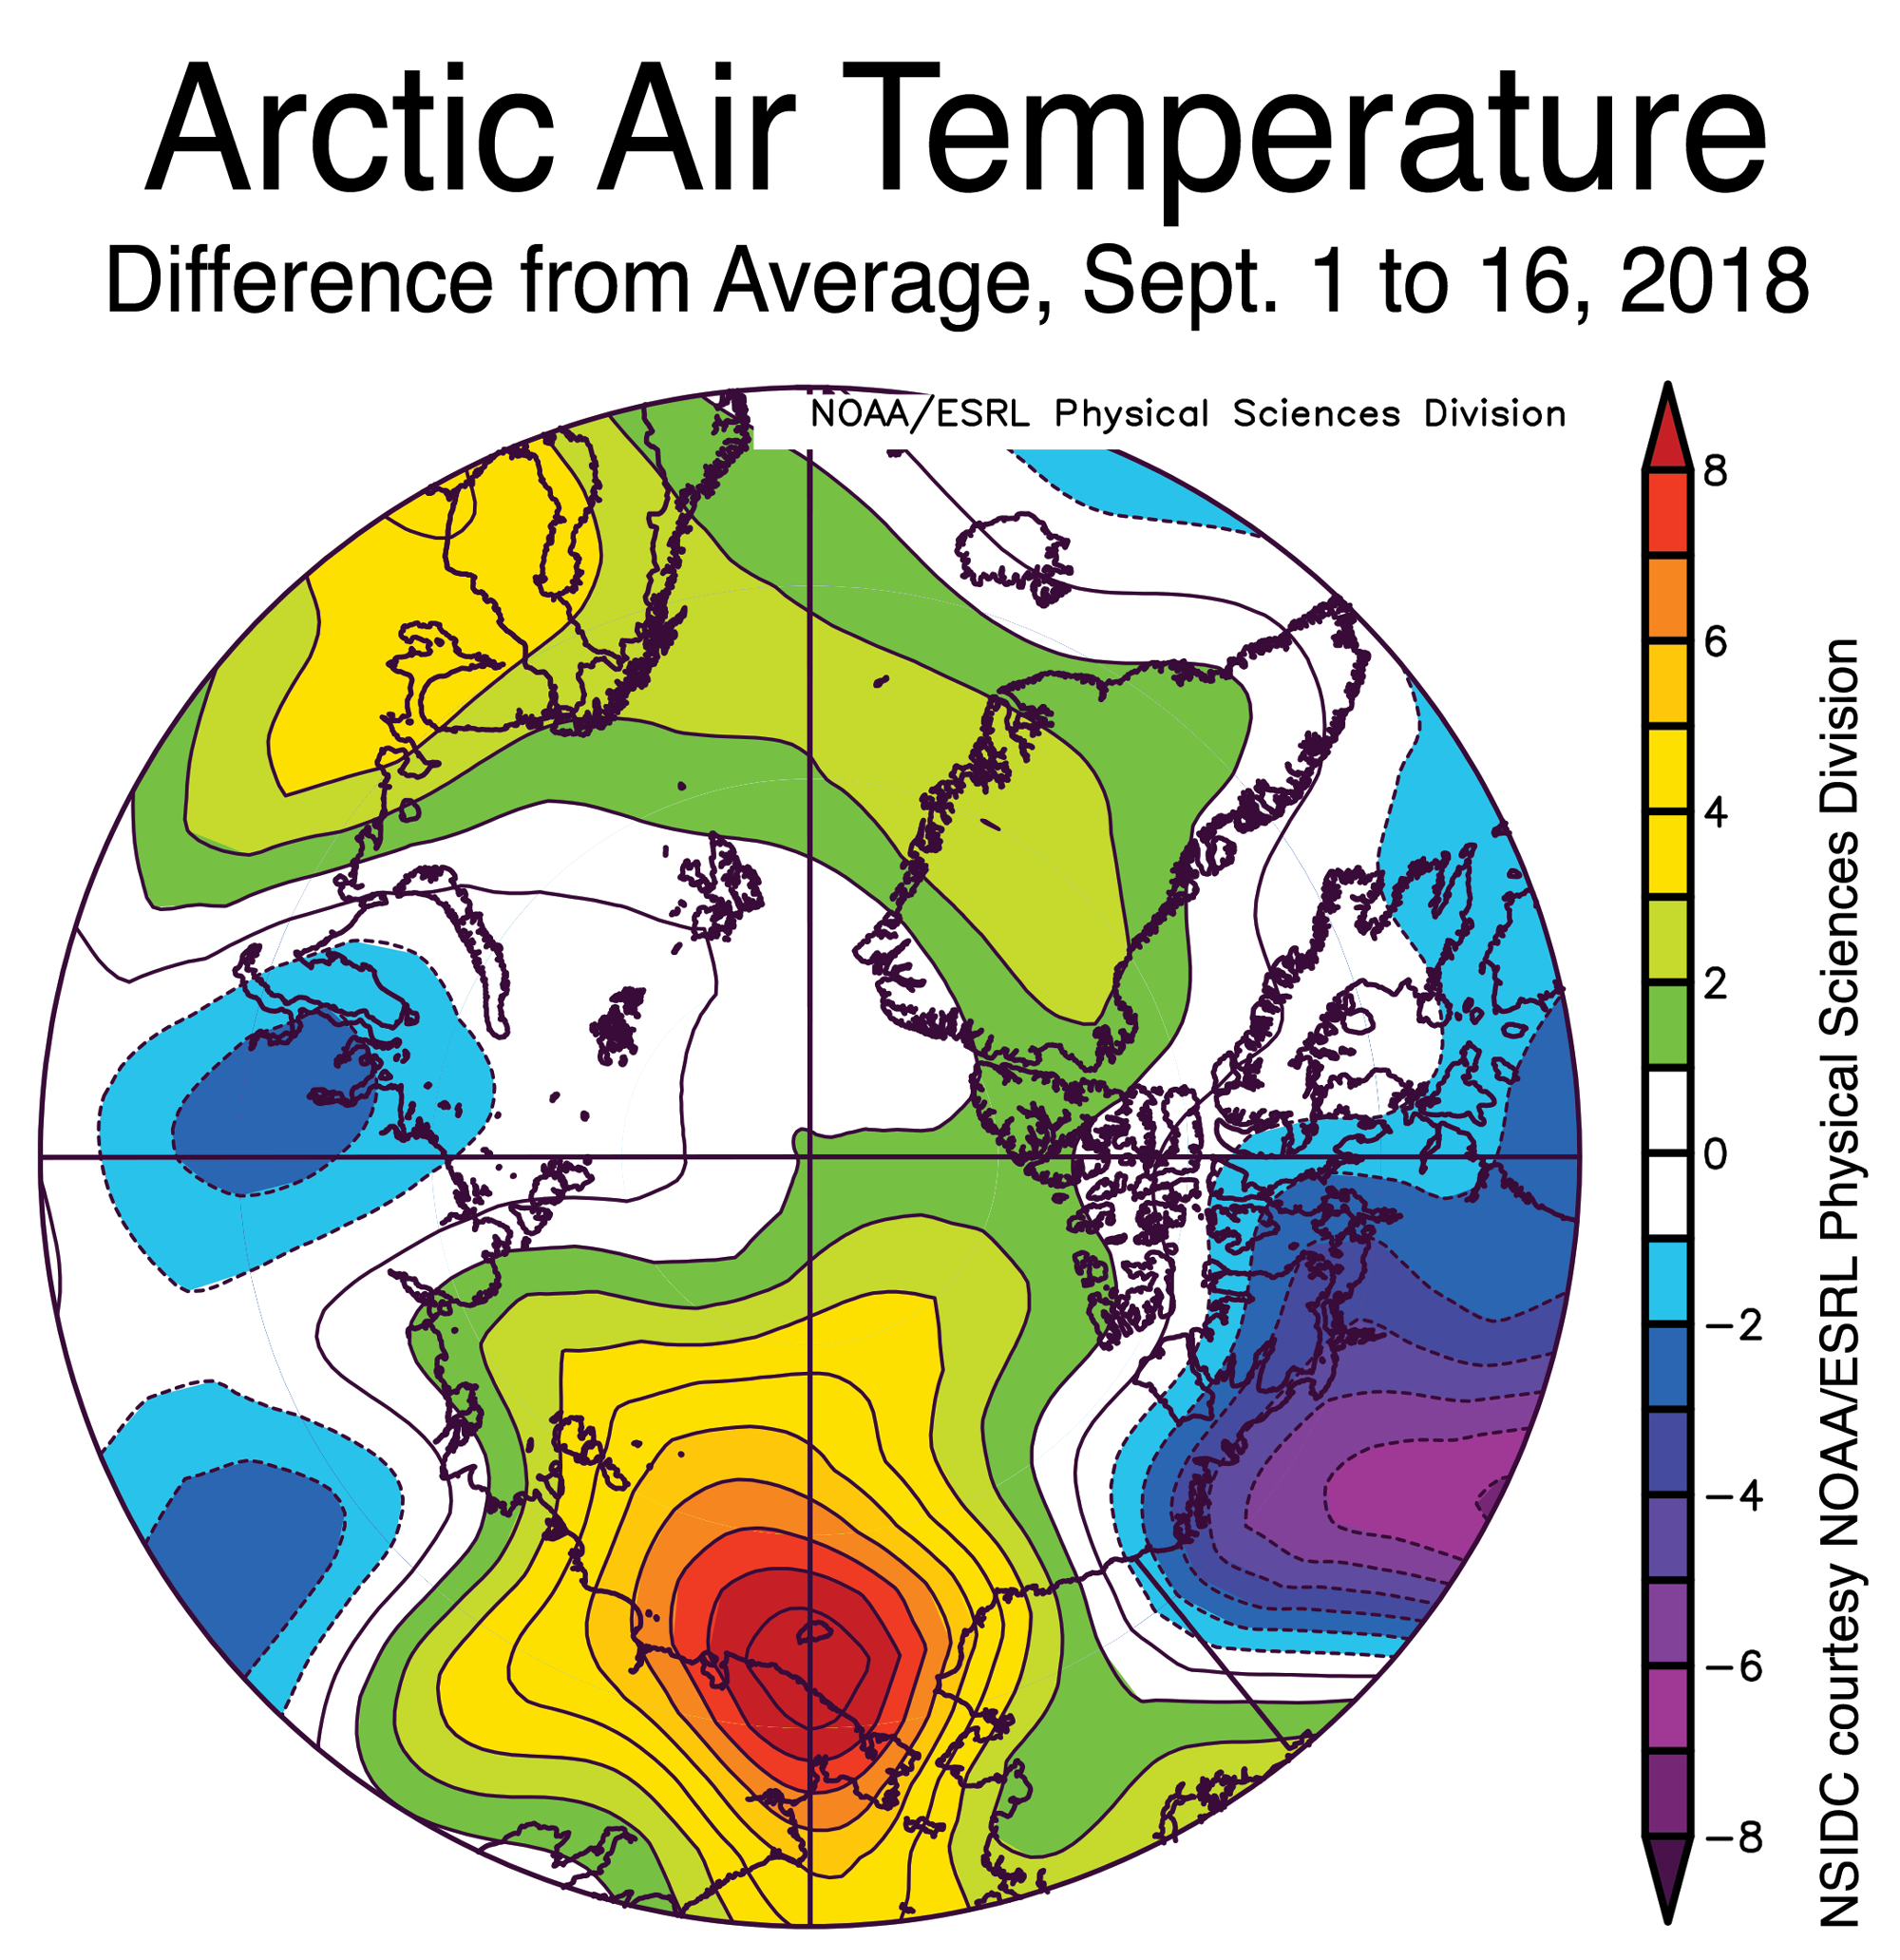
Figure 2b. This plot shows departure from average air temperature in the Arctic at the 925 hPa level, in degrees Celsius, for August 2018. Yellows and reds indicate higher than average temperature; blues and purples indicate lower than average temperature.
Credit: NSIDC courtesy NOAA Earth System Research Laboratory Physical Sciences Division
High-resolution image
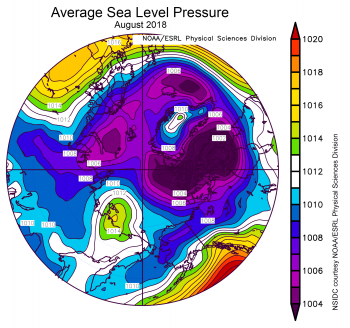
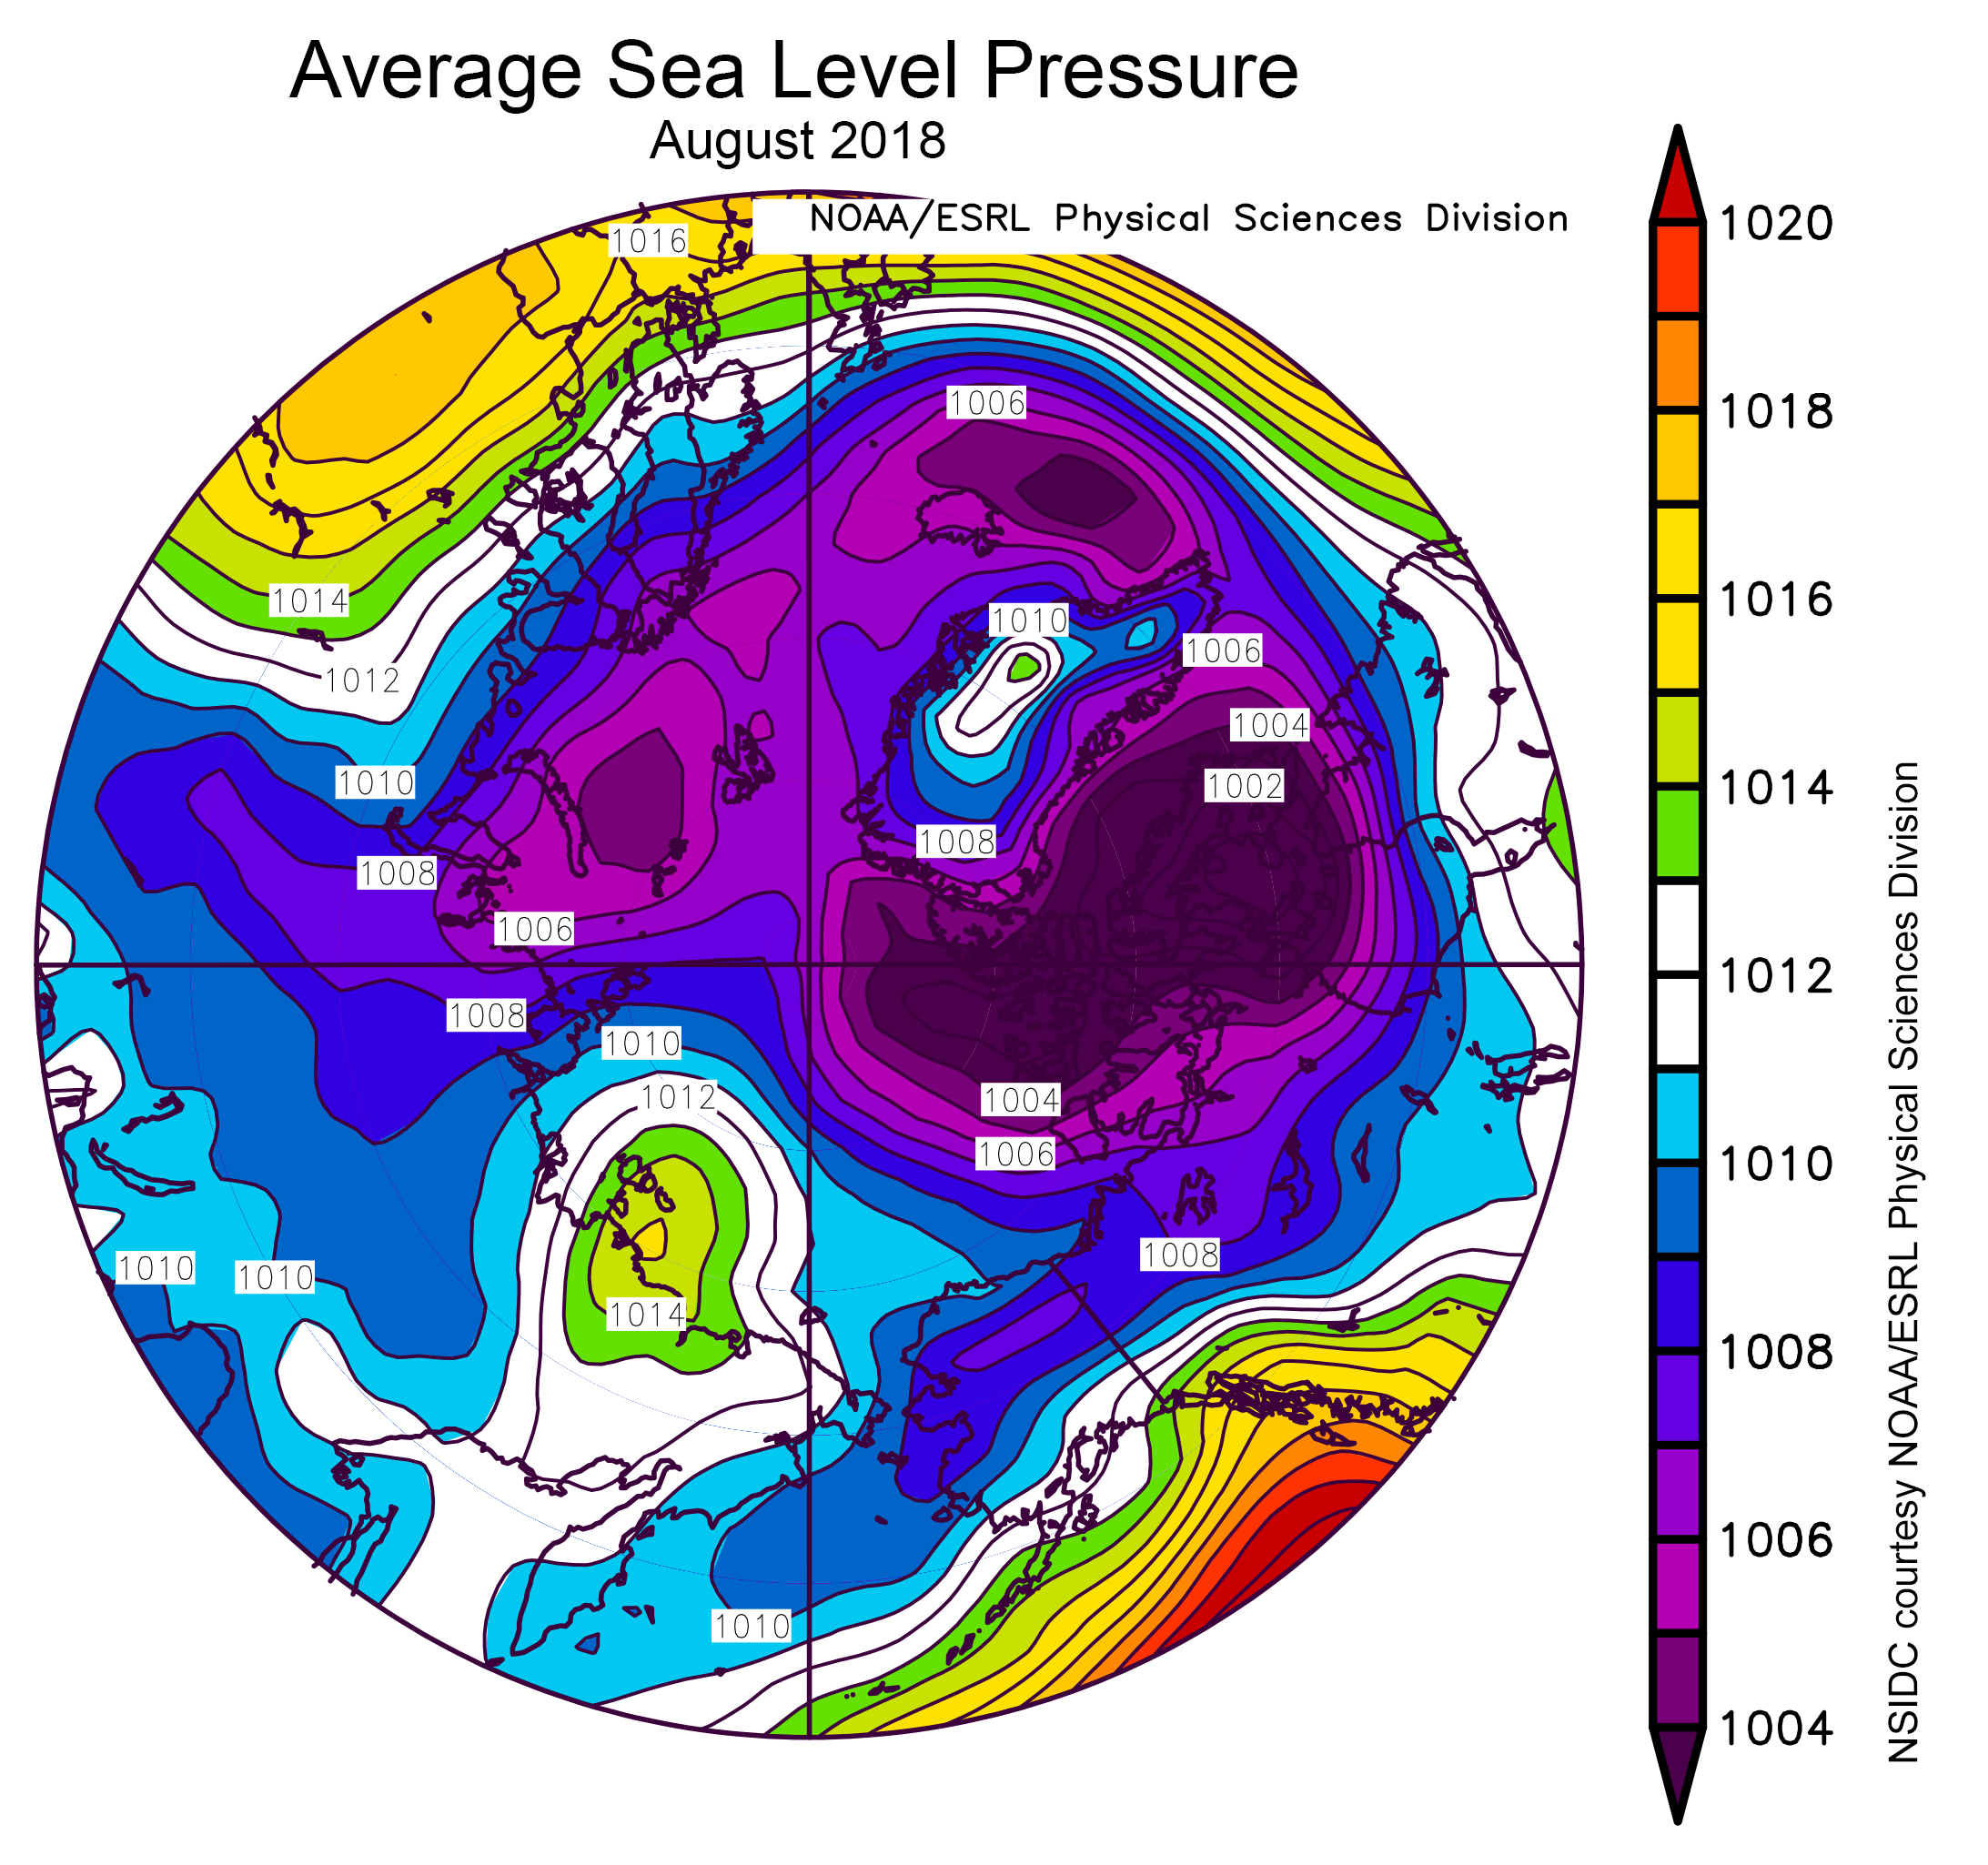
Figure 2c. This plot shows average sea level pressure in the Arctic, in millibars, for August 2018. Yellows and reds indicate high sea level pressure; blues and purples indicate low sea level pressure.
Credit: NSIDC courtesy NOAA Earth System Research Laboratory Physical Sciences Division
High-resolution image
The average ice loss rate for August was 57,500 square kilometers (22,200 square miles) per day. This was slightly faster than the 1981 to 2010 average, but substantially slower than August loss rates in recent years, particularly 2008, 2012, 2015, and 2016.
Air temperatures at the 925 hPa level (about 2,500 feet above sea level) were up to 4 degrees Celsius (7 degrees Fahrenheit) above average over much of the Arctic Ocean and the Laptev Sea, but up to 4 degrees Celsius (7 degrees Fahrenheit) below average over the Canadian Archipelago (Figure 2b). Higher temperatures over the ocean were related to high sea level pressure east of the Laptev Sea and low pressure over the Barents and Kara Seas, funneling in warm air from Eurasia (Figure 2c).
August 2018 compared to previous years
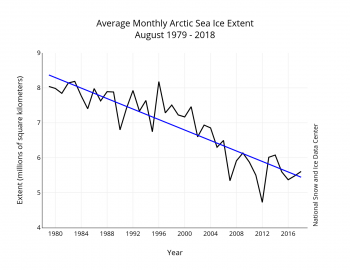
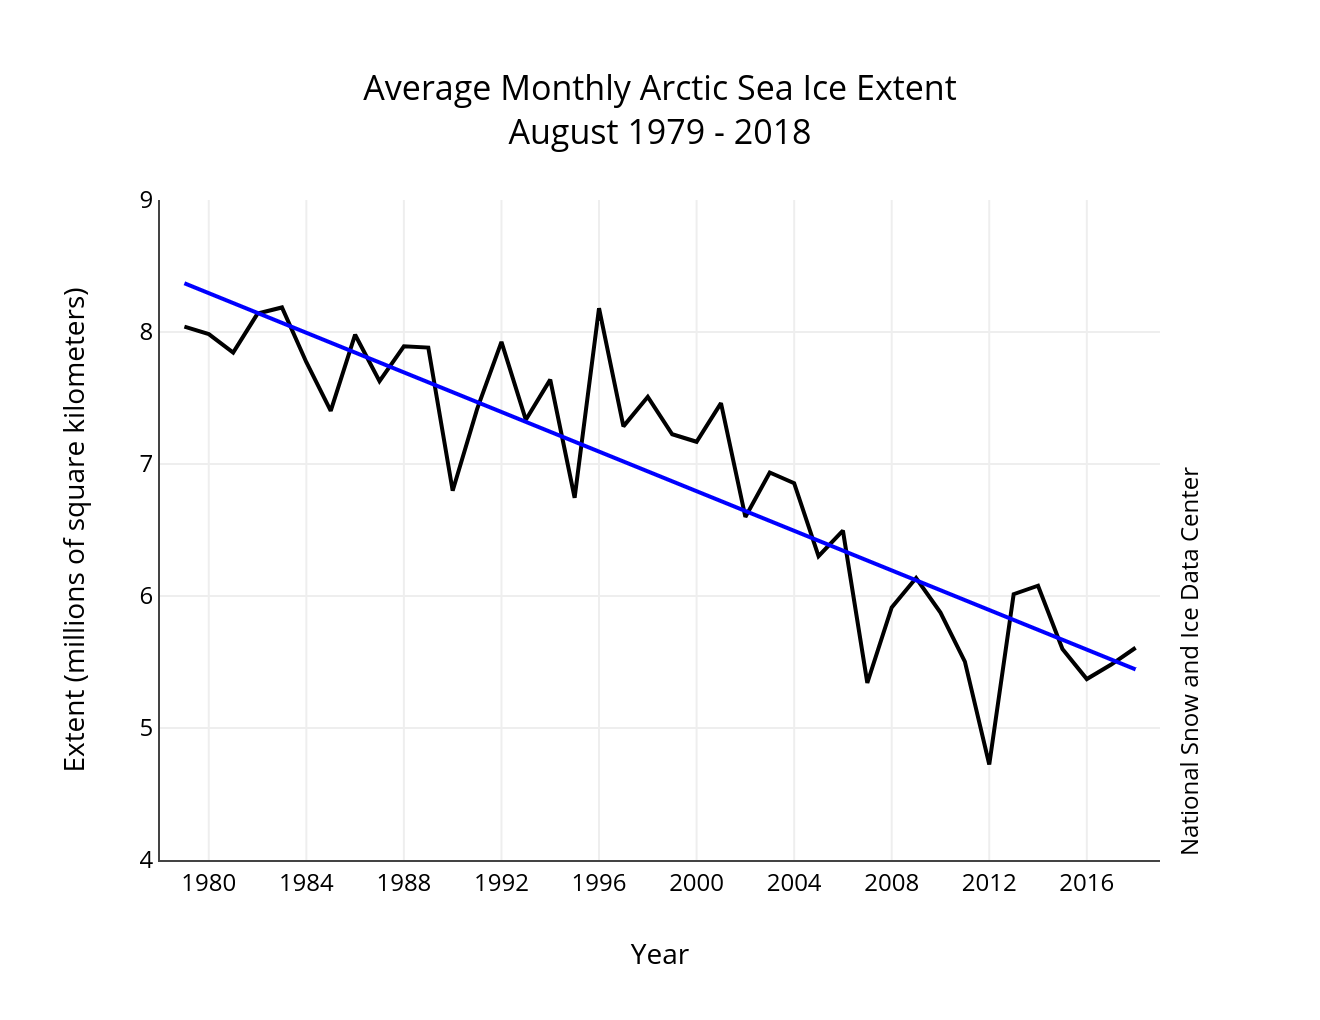
Figure 3. Monthly August ice extent for 1979 to 2018 shows a decline of 10.4 percent per decade.
Credit: National Snow and Ice Data Center
High-resolution image
The linear rate of decline for August sea ice extent is 75,000 square kilometers (29,000 square miles) per year, or 10.4 percent per decade relative to the 1981 to 2010 average. Ice loss during the month was 1.78 million square kilometers (687,000 square miles), which is nearly the same as the 1981 to 2010 average August decrease.
Sea ice off the Alaskan coast
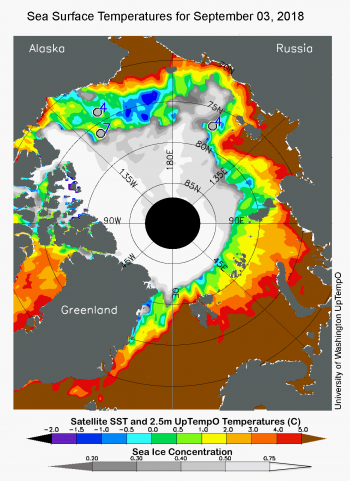
Figure 4. This map of the Arctic Ocean shows sea surface temperatures (SST) from the University of Washington Polar Science Center UpTempO project. The image shows SSTs from the National Oceanic and Atmospheric Administration (NOAA) and sea ice concentrations from the National Snow and Ice Data Center (NSIDC). The numbered circles denote the location of UpTempO buoys, which are measuring the temperature in the near-surface ocean layer. Data from the buoys is available from the UpTempO website.
Credit: University of Washington
High-resolution image
Ice that has persisted along the Alaskan coast is starting to rapidly disintegrate. However, some remnants consist of thick floes. Sea surface temperatures obtained from the University of Washington’s UpTempO website indicate that waters in the area are near the freezing point. As such, some ice in this region may survive the melt season. These temperatures are consistent with those collected during the cruise of the South Korean icebreaker Aaron (see From the field, a wrap up below). Sea surface temperatures ranged between -1 and +1 degrees Celsius (30 and 34 degrees Fahrenheit) when the ship was traveling through the ice, and more than 4 degrees Celsius (39 degrees Fahrenheit) within the open waters of the Chukchi and Bering Seas.
Opening north of Greenland, closed Northwest Passage
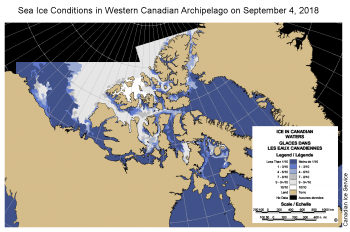
Figure 5a. This map shows sea ice conditions in the western part of the Canadian Archipelago. The colors in the color bar correspond to sea ice concentration in tenths. Dark blue is low concentration (less than 10 percent), white is high concentration (100 percent).
Credit: Canadian Ice Service
High-resolution image
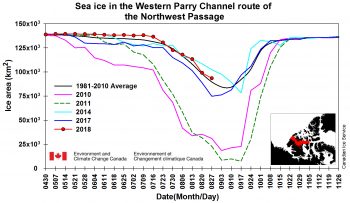
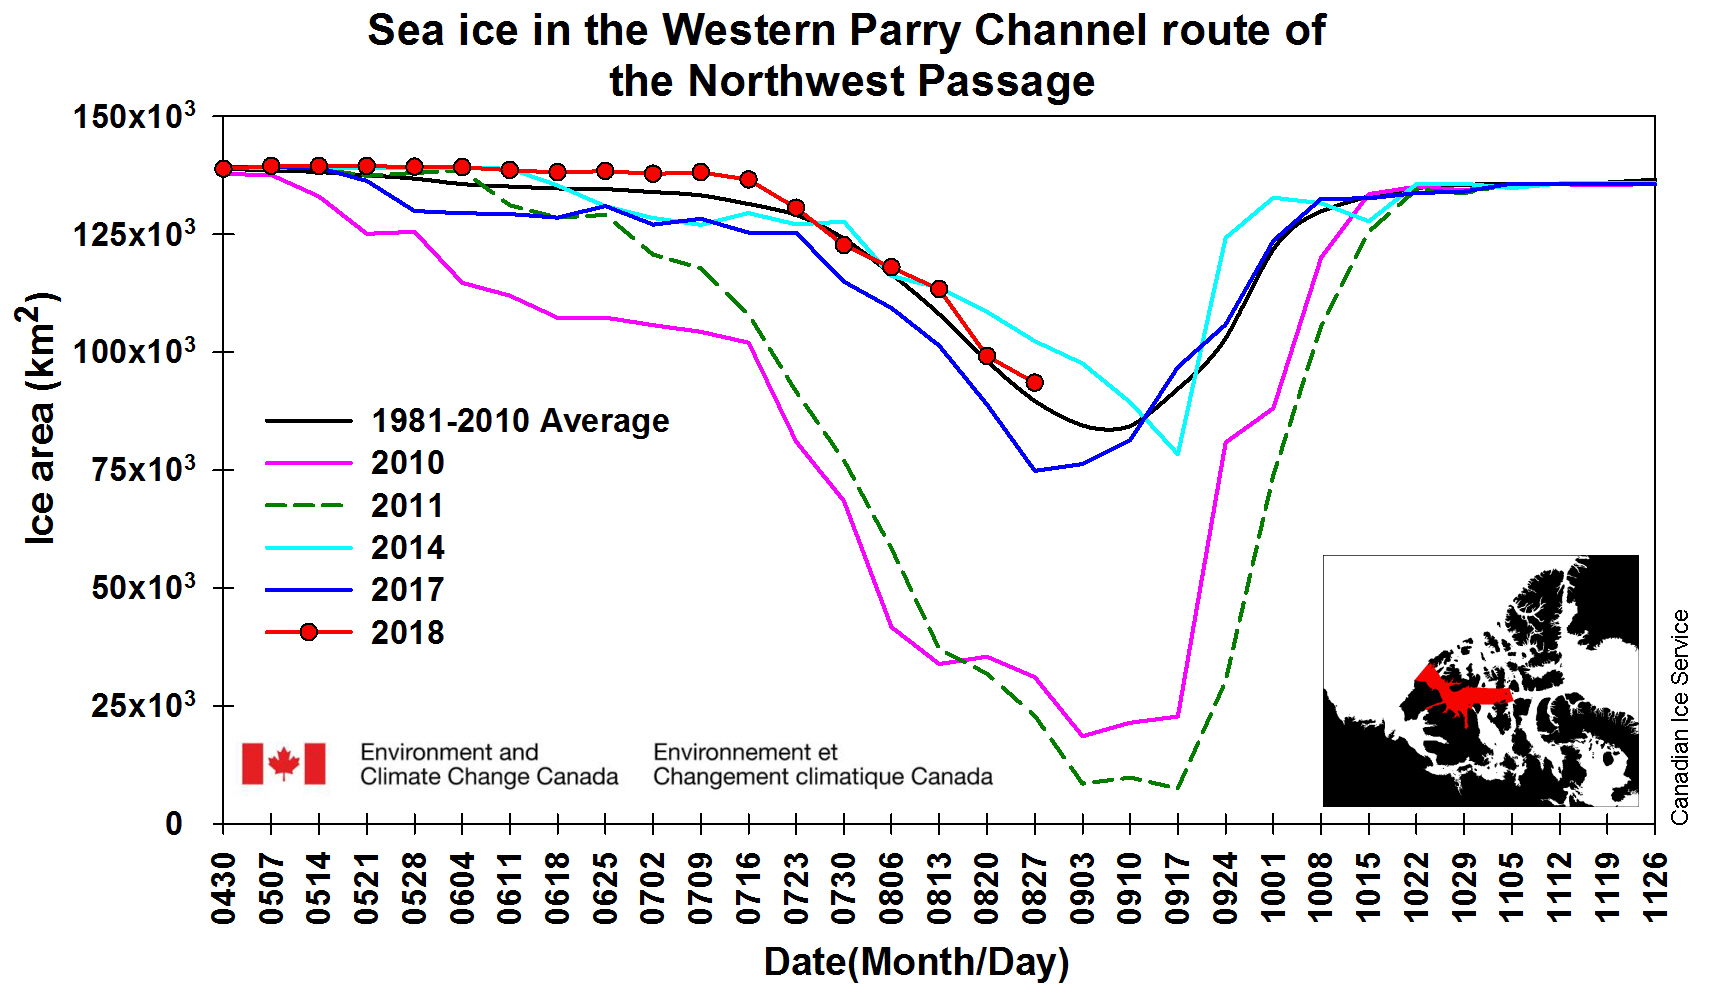
Figure 5b. This chart shows total sea ice area for selected years and the 1981 to 2010 average within the northern route of the Northwest Passage. The dotted red line shows 2018 and the other colors show ice conditions in different years.
Credit: Canadian Ice Service
High-resolution image
As noted in our previous post, an unusual area of open water formed off the northern coast of Greenland. It reached a maximum size of about 23,000 square kilometers (about 8,900 square miles) in mid-August—about the size of the state of New Jersey or the country of Wales. The opening has closed somewhat since then, but an ice-free region remains east of Cape Morris Jesup.
In contrast to northern Greenland, substantial amounts of ice remain in the channels of the Canadian Archipelago, thus the Northwest Passage is not open (Figure 5a). As of the end of August, sea ice area in the northern route of the Northwest Passage is currently tracking just above the 1981 to 2010 average (Figure 5b). The region is far from being free of sea ice; high ice concentrations are still present, about half of which is multiyear ice. Below average air temperature over the western Canadian Arctic Archipelago has limited ice melt. Low sea level pressures over the Beaufort Sea and Canadian Basin have packed ice against the western entrance of the Northwest Passage. The southern route of the Northwest Passage also contains relatively high ice concentrations, although mainly first-year ice. In the unlikely event that the southern route does open in the coming weeks it will be short-lived since multi-year ice from the northern regions would quickly move southward to fill the open water gaps.
From the field, a wrap up
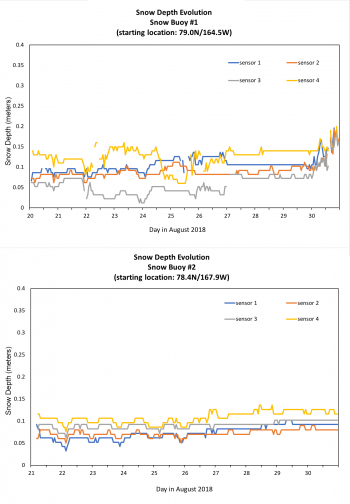
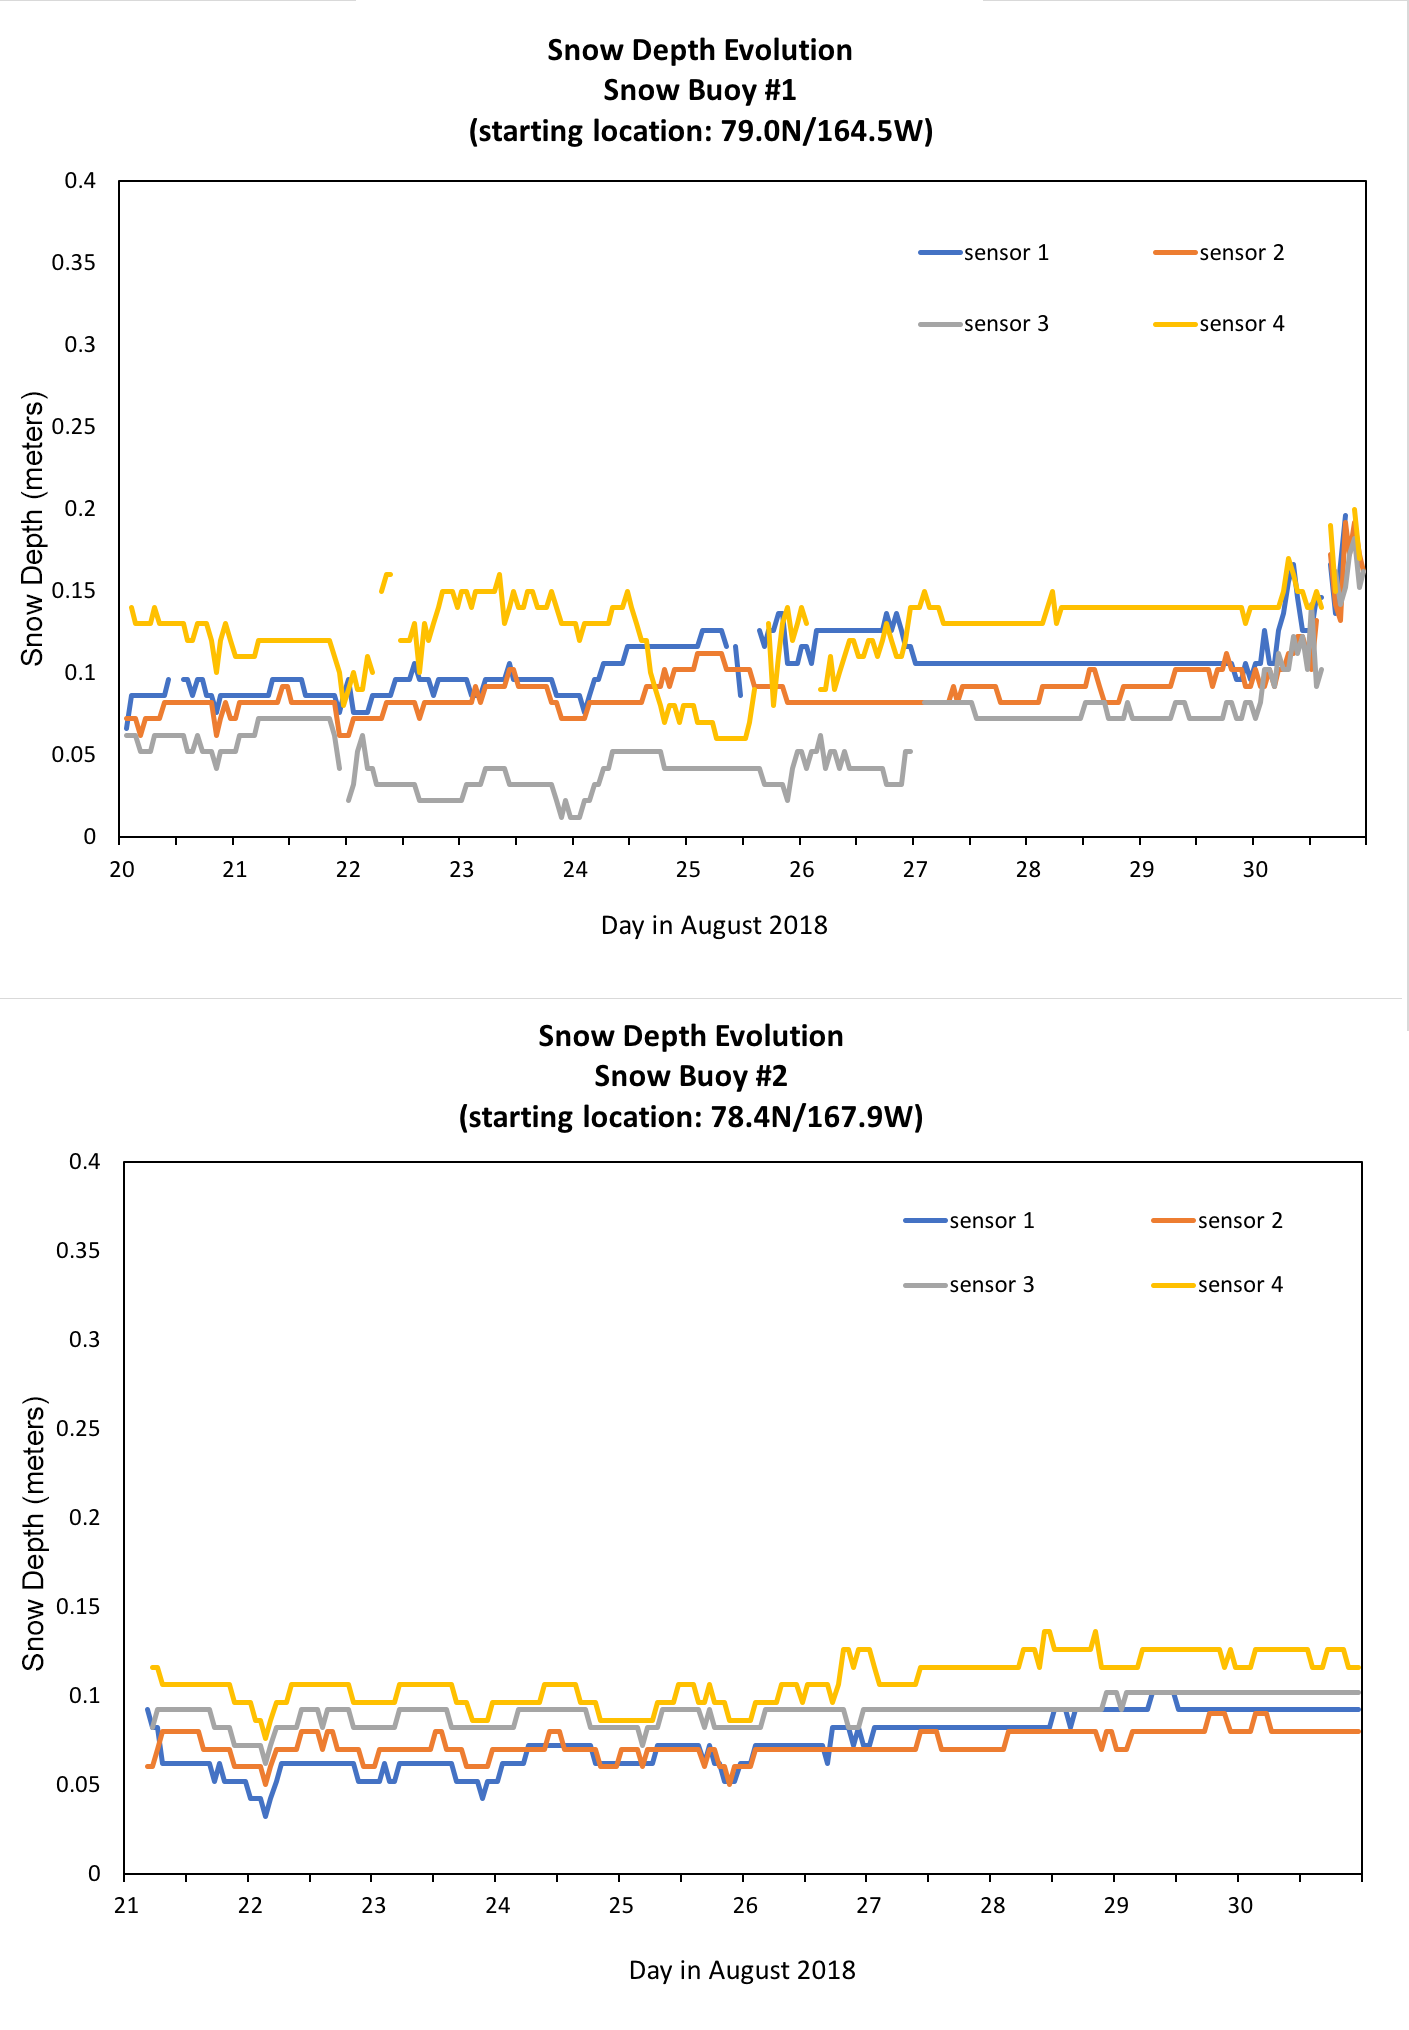
Figure 6a. These graphs show the evolution of snow depth, in meters, from August 20 to August 30, 2018 as recorded by two MetOcean snow buoys, which NSIDC scientist Julienne Stroeve deployed.
Credit: J. Stroeve, NSIDC
High-resolution image

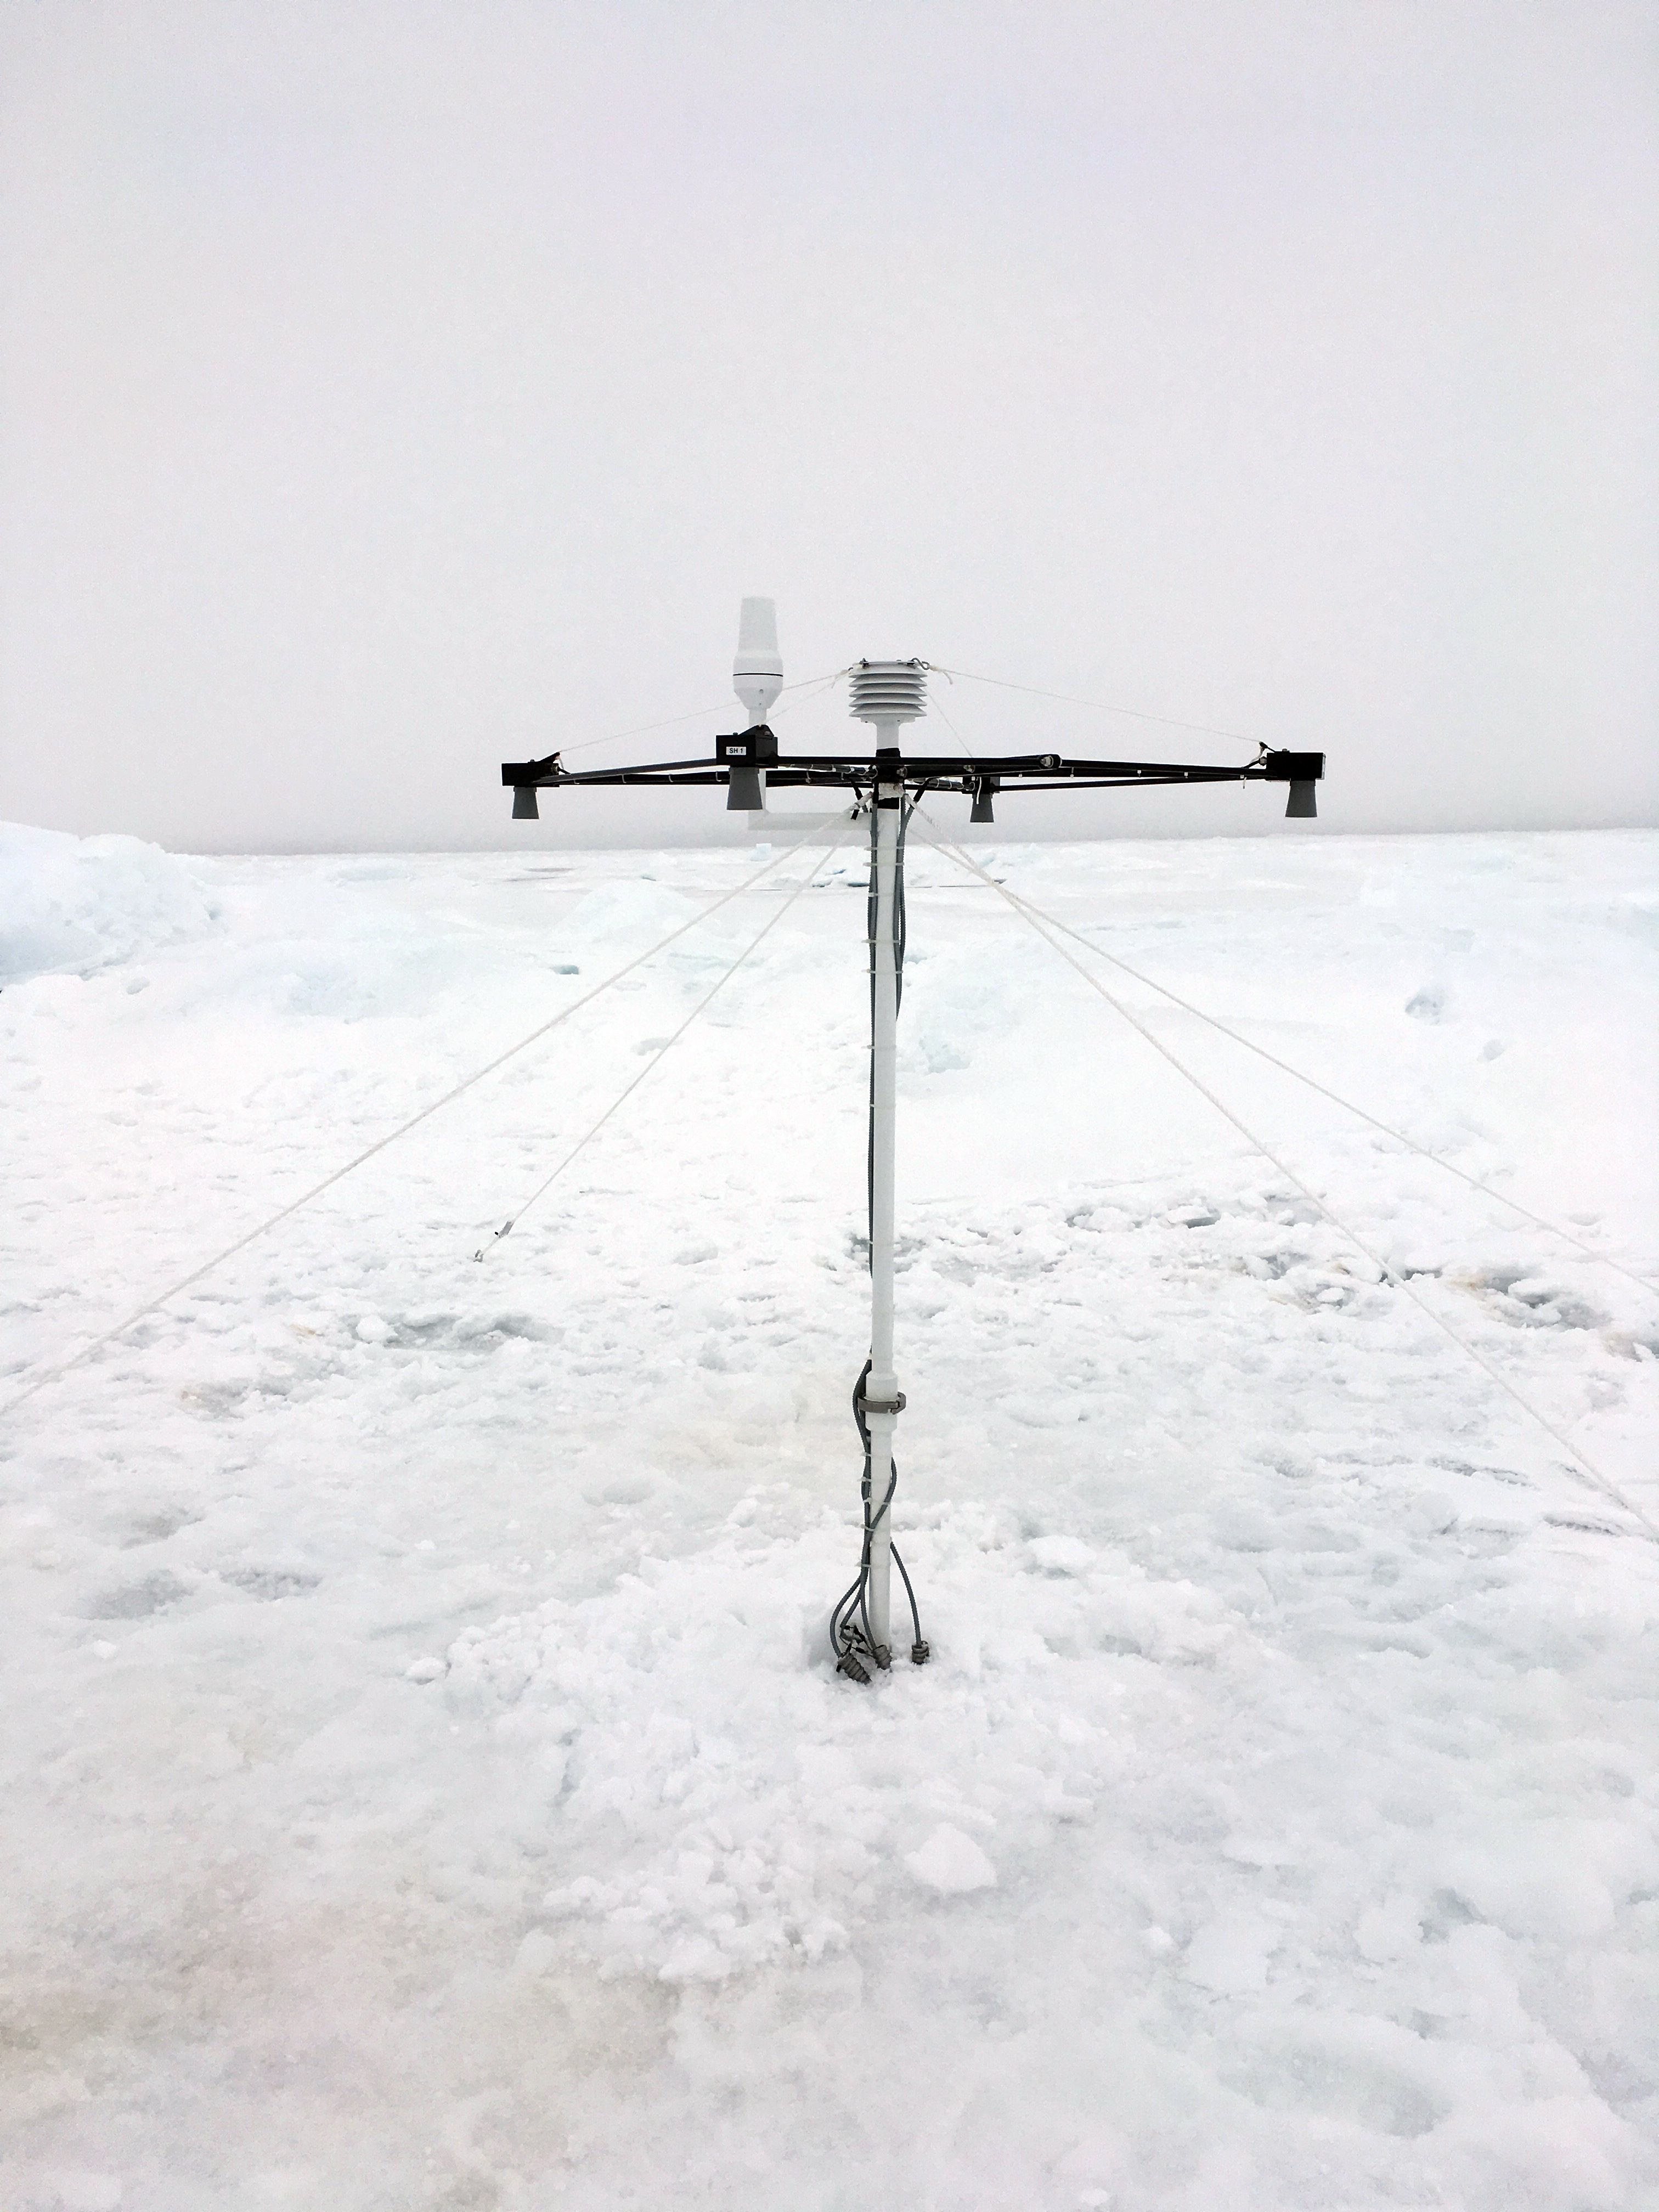
Figure 6b. This photograph shows the MetOcean Snow Buoy set up on sea ice in the Chukchi Sea.
Credit: J. Stroeve, NSIDC
High-resolution image

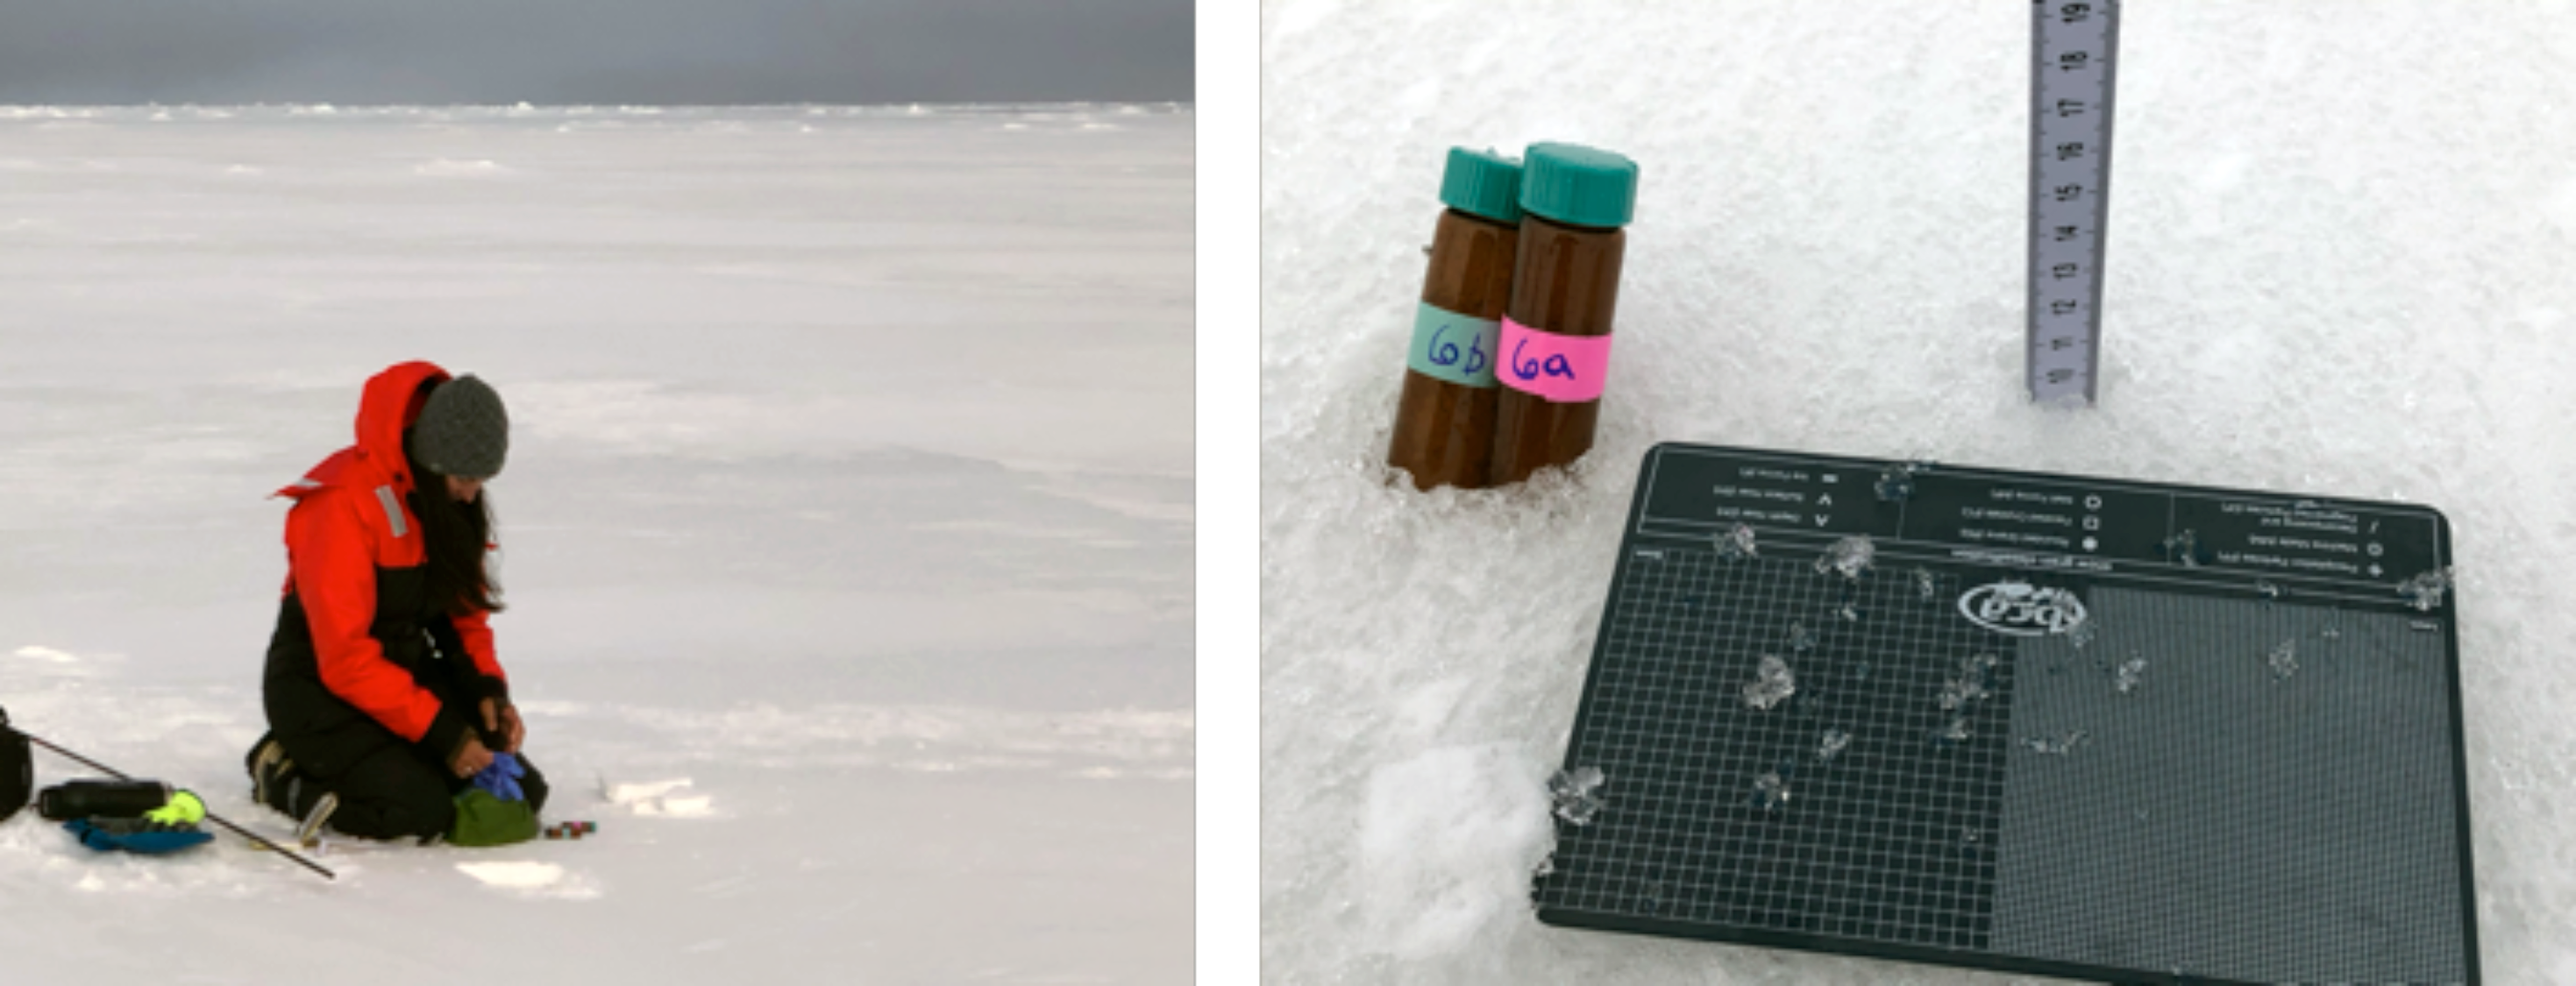
Figure 6c. NSIDC scientist Alia Khan collects snow samples for black carbon analysis, and measures snow grain size, snow depth, and spectral albedo.
Credit: A. Khan, NSIDC
High-resolution image
NSIDC scientists Julienne Stroeve and Alia Khan have returned from their Arctic expedition on the South Korean icebreaker Aaron. Both successfully deployed their instruments and collected scientific measurements. Now the work of data analysis begins. Since the buoy deployment by Stroeve and others, two of the melt pond buoy systems have already shown 20 centimeters (7.9 inches) of ice melt. Both snow buoys deployed by Stroeve (Figure 6b) are sending back good data (Figure 6a), with a mean snow depth for the last ten days in August of around 9.5±3.3 centimeters (3.74±1.3 inches for buoy #1 and 8.6±1.8 centimeters (3.4±0.7 inches) for buoy #2. While snow depth at the second buoy remained relatively constant, buoy #1 shows the effect of a snowfall event that likely occurred on August 30. Both buoys have drifted considerably eastwards since deployment, with buoy #1 drifting 104 kilometers (65 miles) in ten days (from 79.0 degrees N, longitude 164.5 degrees W to 79.0 degrees N, longitude 159.6 degrees W), and buoy #2 drifting 132 kilometers (82 miles) in nine days (from 78.4 degrees N, longitude 167.9 degrees W to 78.5 degrees N, longitude 162.0 degrees W).
Khan collected snow and ice samples (Figure 6c) for the analysis of black carbon (BC), which comes from the incomplete combustion of biomass and fossil fuels. When the dark particles are deposited on snow and ice surfaces, they absorb more solar radiation than the surrounding surface, reducing the albedo and enhancing melt. Over the course of the five-day ice camp, her team collected 133 snow samples. The team is interested in exploring local BC signals from shipping traffic, transport and deposition from regional Arctic wildfires, and background concentrations of long-range atmospheric transport of BC. They will compare BC concentrations in snow and sea ice with spectral albedo measurements, as well as results from a global aerosol atmospheric transport model to look at potential source regions of the aerosols.
Antarctic Report

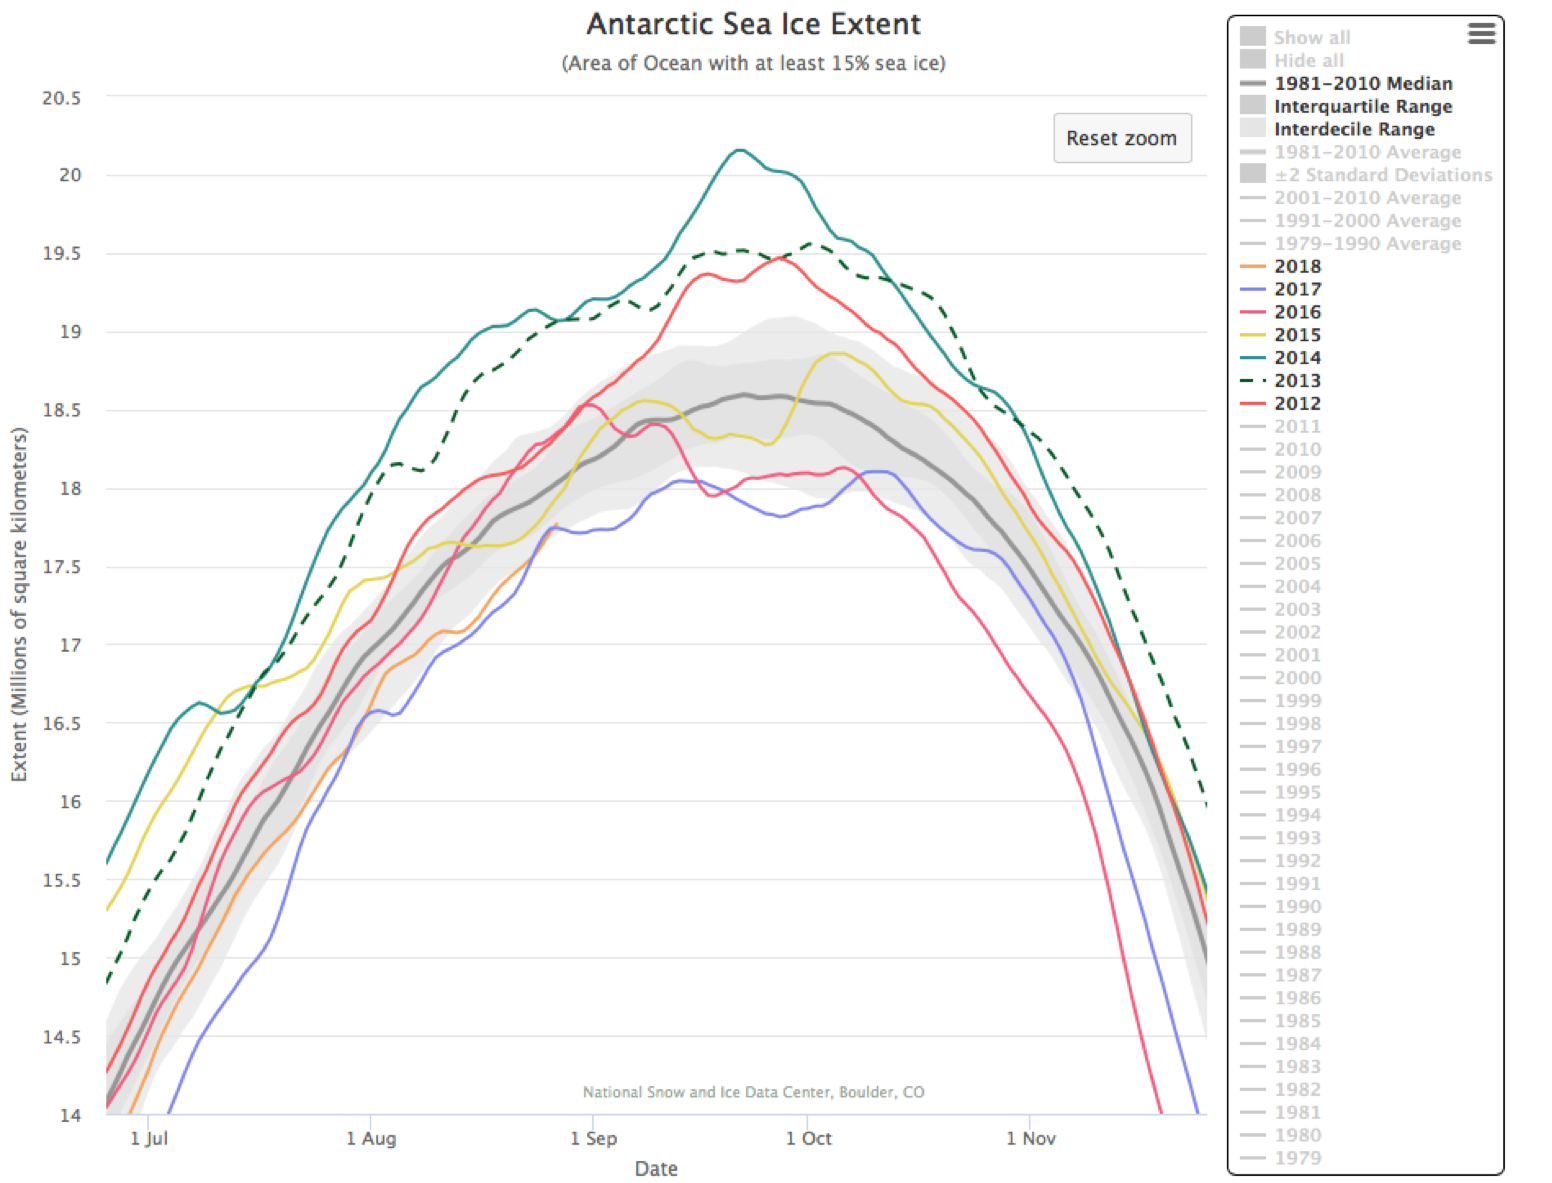
Figure 7. This graph shows daily Antarctic sea ice extent for the austral winter season from the past seven years, 2012 to 2018. 2012 is shown in red, 2013 in a dashed green line, 2014 in solid green, 2015 in yellow, 2016 in magenta, 2017 in purple, and 2018 in orange. The 1981 to 2010 median is in dark gray. The gray areas around the median line show the interquartile and interdecile ranges of the data.
Credit: NSIDC
High-resolution image
Antarctic sea ice has increased at a faster-than-average pace in the later part of August. The sea ice maximum is typically reached in late September. Overall sea ice extent is still in the bottom quartile (the lowest 25 percent of years) of the satellite record (Figure 7). Ice extent is below the median of the past 40 years in several regions, including the northern Weddell, far northeastern Weddell, and southern Indian Ocean.
The past seven austral winter seasons for Antarctic sea ice extent have been remarkably variable. In 2012, 2013, and 2014, Antarctic sea ice extent set consecutive satellite-era record highs for the annual maximum. However, 2015 had a near-average seasonally maximum ice extent, while 2016 saw ice extent plunge in late August to reach unprecedented low levels by austral spring in November. Since 2016, ice has remained below the 1981 to 2010 average extent, setting the second-lowest winter maximum extent in October 2017.