Sea ice in the Arctic and the Antarctic set record low extents every day in December, continuing the pattern that began in November. Warm atmospheric conditions persisted over the Arctic Ocean, notably in the far northern Atlantic and the northern Bering Sea. Air temperatures near the Antarctic sea ice edge were near average. For the year 2016, sea ice extent in both polar regions was at levels well below what is typical of the past several decades.
Overview of conditions
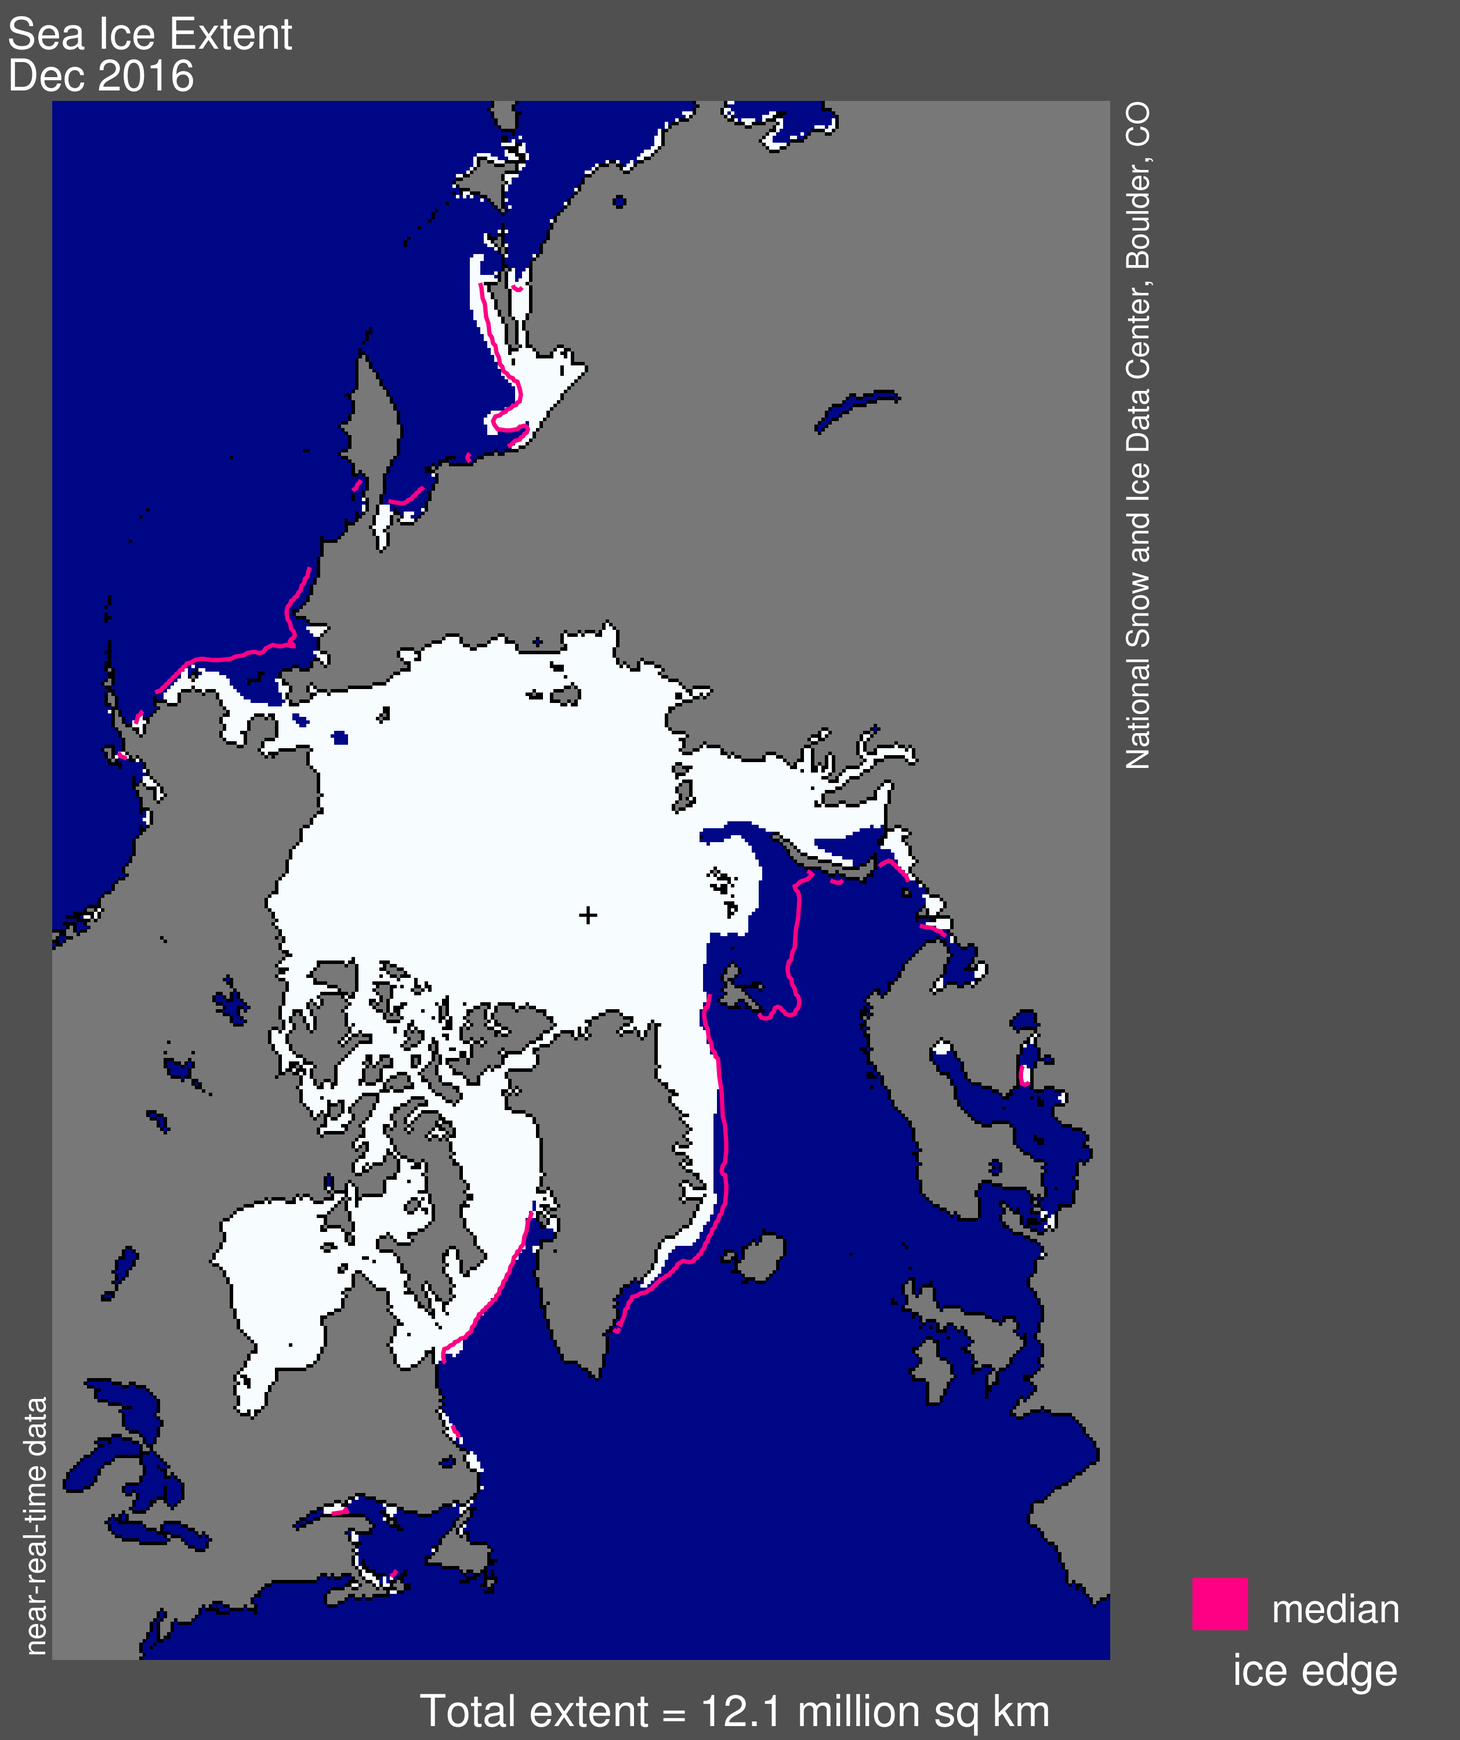
Figure 1. Arctic sea ice extent for December 2016 was 12.10 million square kilometers (4.67 million square miles). The magenta line shows the 1981 to 2010 median extent for that month. The black cross indicates the geographic North Pole. Sea Ice Index data. About the data
Credit: National Snow and Ice Data Center
High-resolution image
Arctic sea ice extent for December 2016 averaged 12.10 million square kilometers (4.67 million square miles), the second lowest December extent in the satellite record. This is 20,000 square kilometers (7,700 square miles) above December 2010, the lowest December extent, and 1.03 million square kilometers (397,700 square miles) below the December 1981 to 2010 long-term average.
The rate of ice growth for December was 90,000 square kilometers (34,700 square miles) per day. This is faster than the long-term average of 64,100 square kilometers (24,700 square miles) per day. As a result, extent for December was not as far below average as was the case in November. Ice growth for December occurred primarily within the Chukchi Sea, Kara Sea, and Hudson Bay—areas that experienced a late seasonal freeze-up. Compared to the record low for the month set in 2010, sea ice for December 2016 was less extensive in the Kara, Barents, and East Greenland Seas, and more extensive in Baffin and Hudson Bays.
Conditions in context
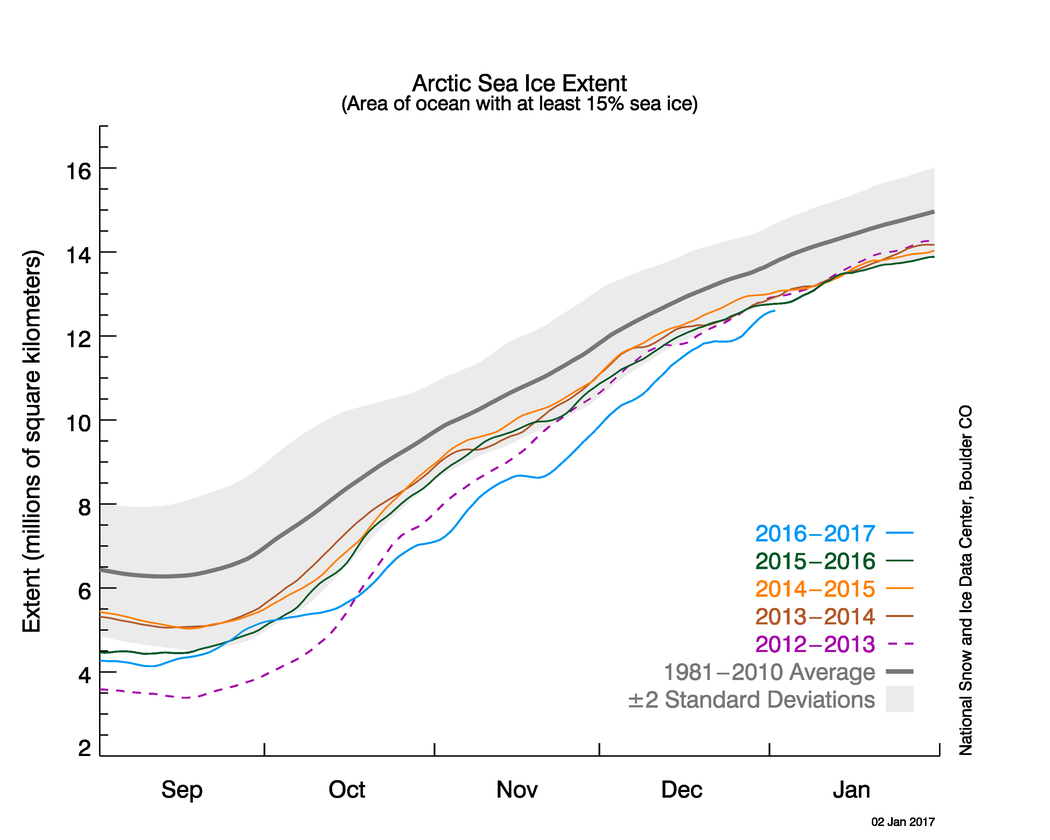
Figure 2a. The graph above shows Arctic sea ice extent as of January 2, 2017, along with daily ice extent data for four previous years. 2016 to 2017 is shown in blue, 2015 to 2016 in green, 2014 to 2015 in orange, 2013 to 2014 in brown, and 2012 to 2013 in purple. The 1981 to 2010 average is in dark gray. The gray area around the average line shows the two standard deviation range of the data. Sea Ice Index data.
Credit: National Snow and Ice Data Center
High-resolution image
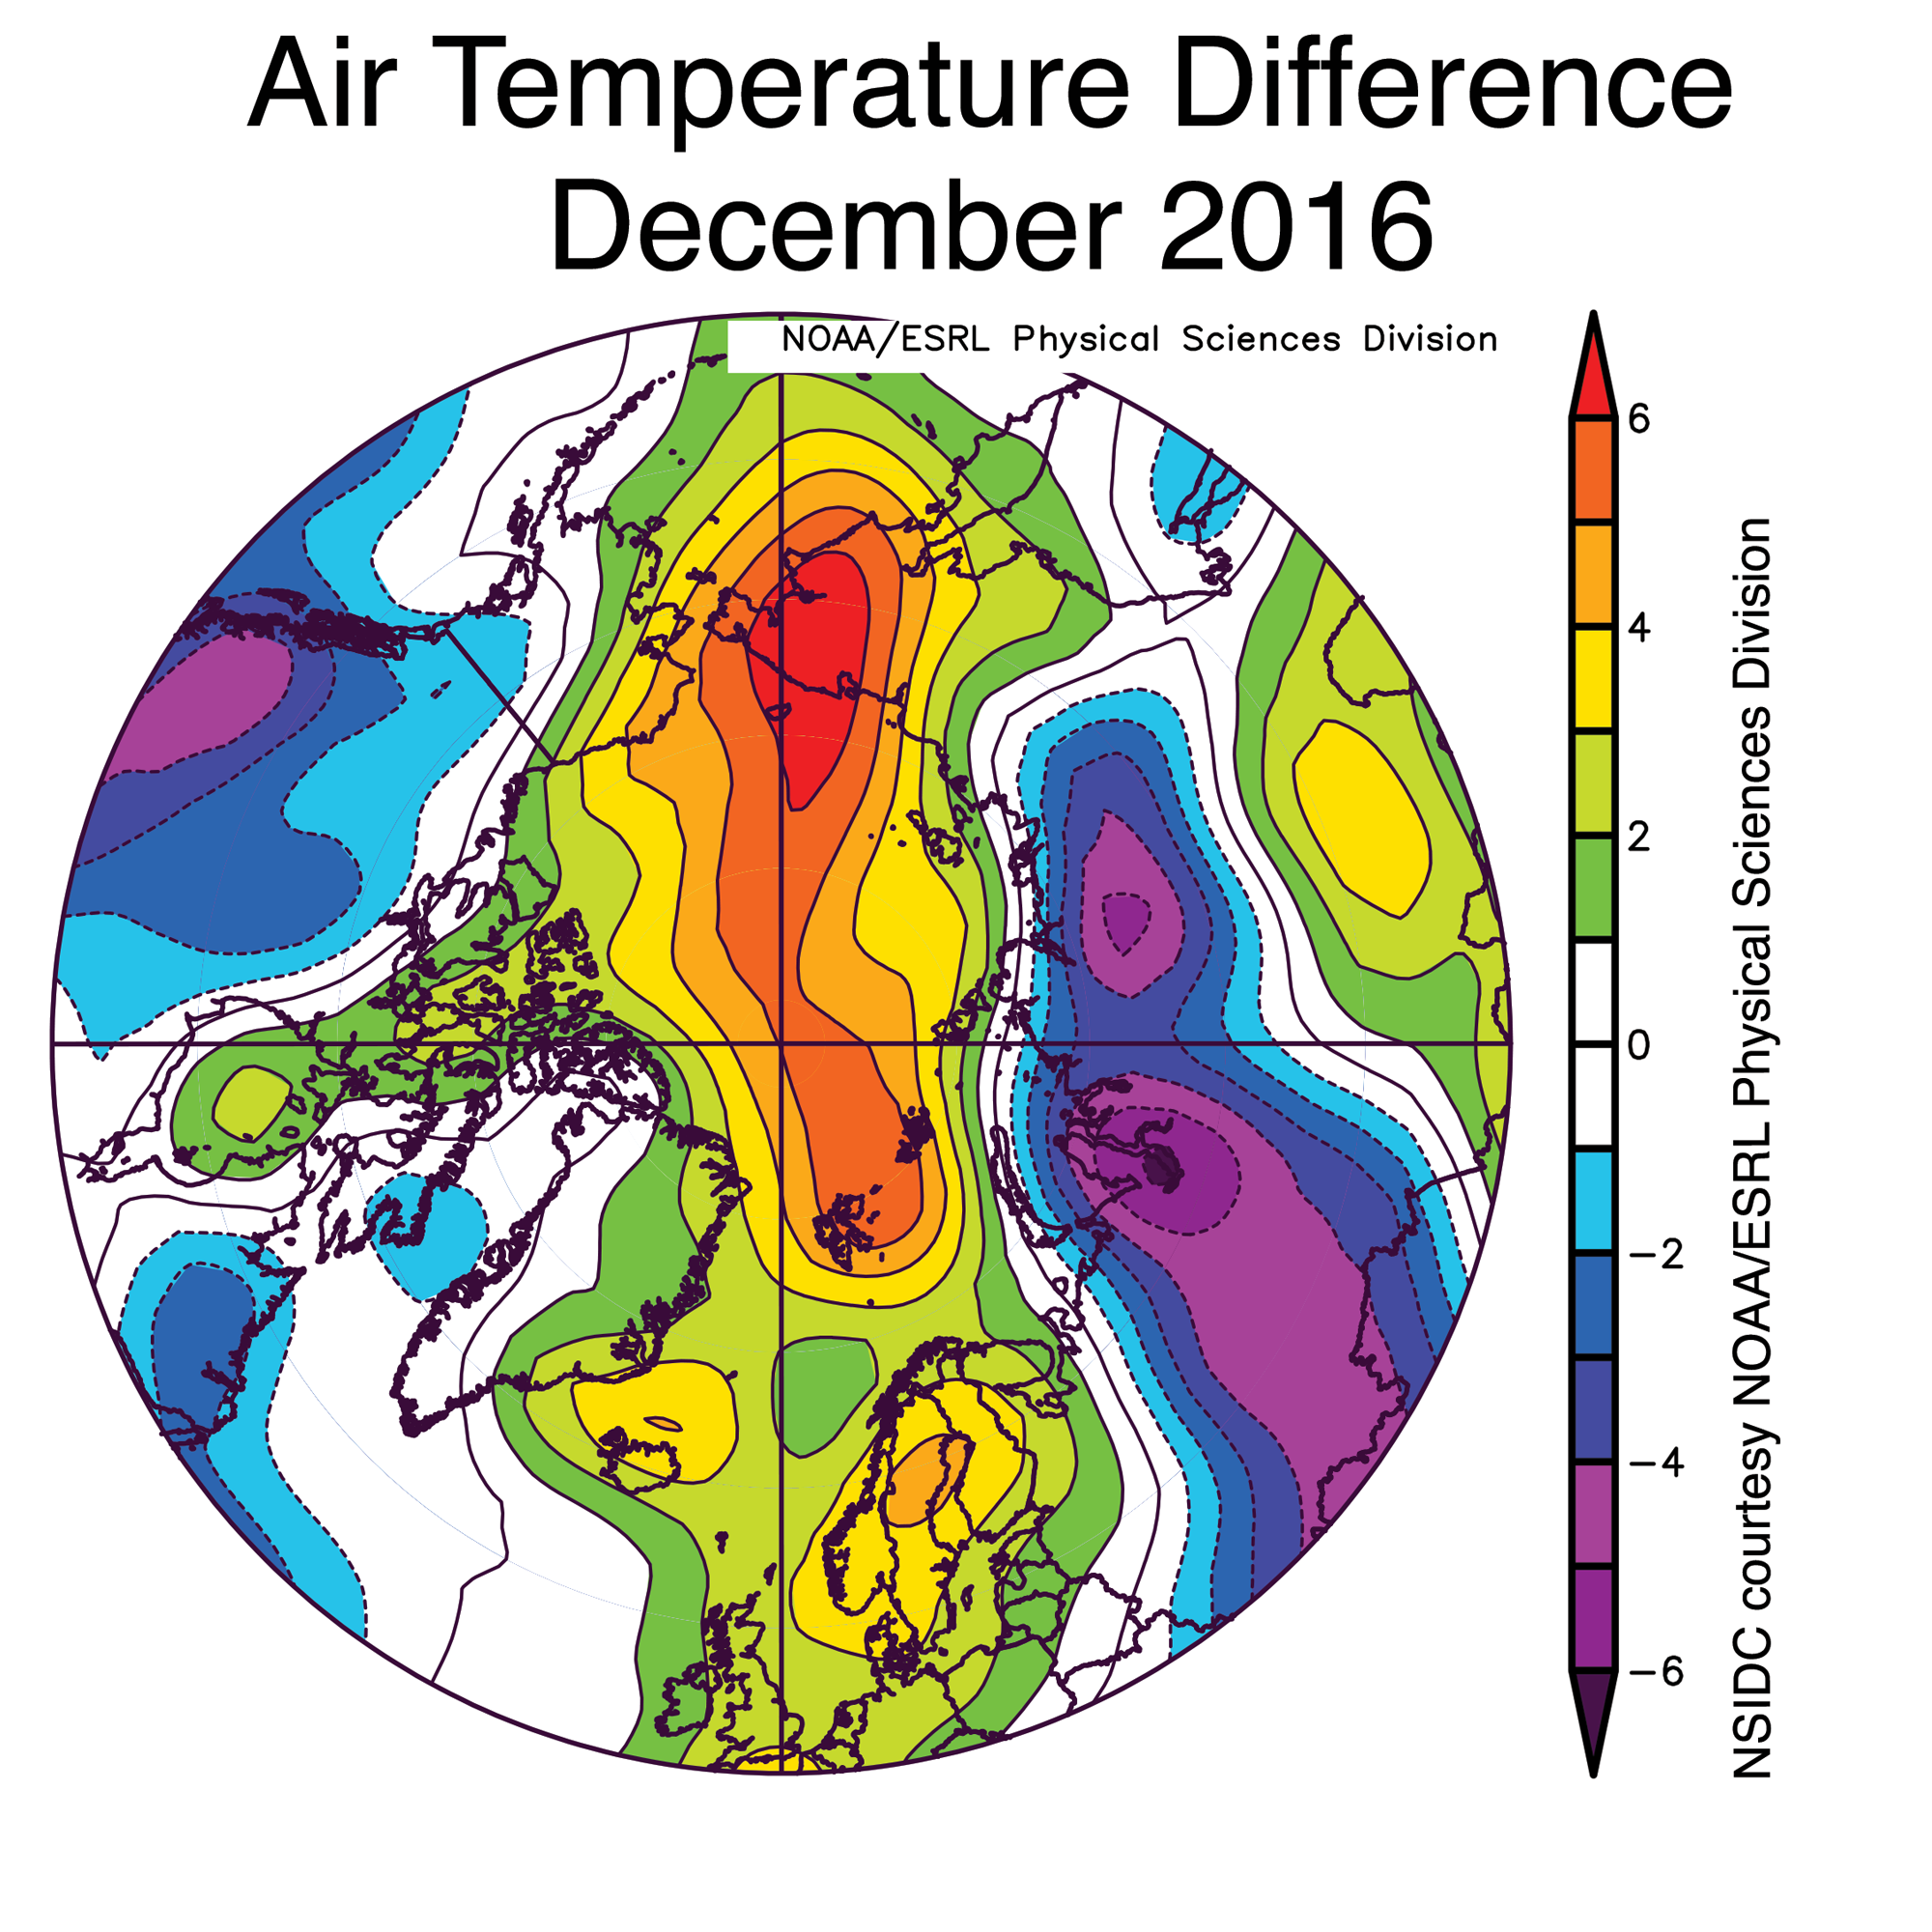
Figure 2b. This plot shows air temperature difference from average for December 2016. Air temperatures at the 925 hPa level (approximately 2,500 feet above sea level) were more than 3 degrees Celsius (5 degrees Fahrenheit) above the 1981 to 2010 average over the central Arctic Ocean and northern Barents Sea, and as much as 5 degrees Celsius (9 degrees Fahrenheit) above average over the Chukchi Sea.
Credit: NSIDC courtesy NOAA/ESRL Physical Sciences Division
High-resolution image
Air temperatures at the 925 hPa level (approximately 2,500 feet above sea level) were more than 3 degrees Celsius (5 degrees Fahrenheit) above the 1981 to 2010 average over the central Arctic Ocean and northern Barents Sea, and as much as 5 degrees Celsius (9 degrees Fahrenheit) above average over the Chukchi Sea. Repeated warm air intrusions occurred over the Chukchi and Barents Seas, continuing the pattern seen in November.
In contrast, central Russia and northern British Columbia experienced temperatures 3 to 5 degrees Celsius (5 to 9 degrees Fahrenheit) below average (Figure 2b). Atmospheric circulation over the Arctic in December was characterized by a broad area of lower-than-average pressure over Greenland and the North Pole, extending across the Arctic Ocean to eastern Siberia, and another region of low pressure over the Ural Mountains. Higher-than-average pressure dominated Europe and the Gulf of Alaska. This set up the very warm southerly winds from both the northern North Atlantic and the Bering Strait areas, pushing Arctic air temperatures to unusually high levels for brief periods in early December and near Christmas.
December 2016 compared to previous years
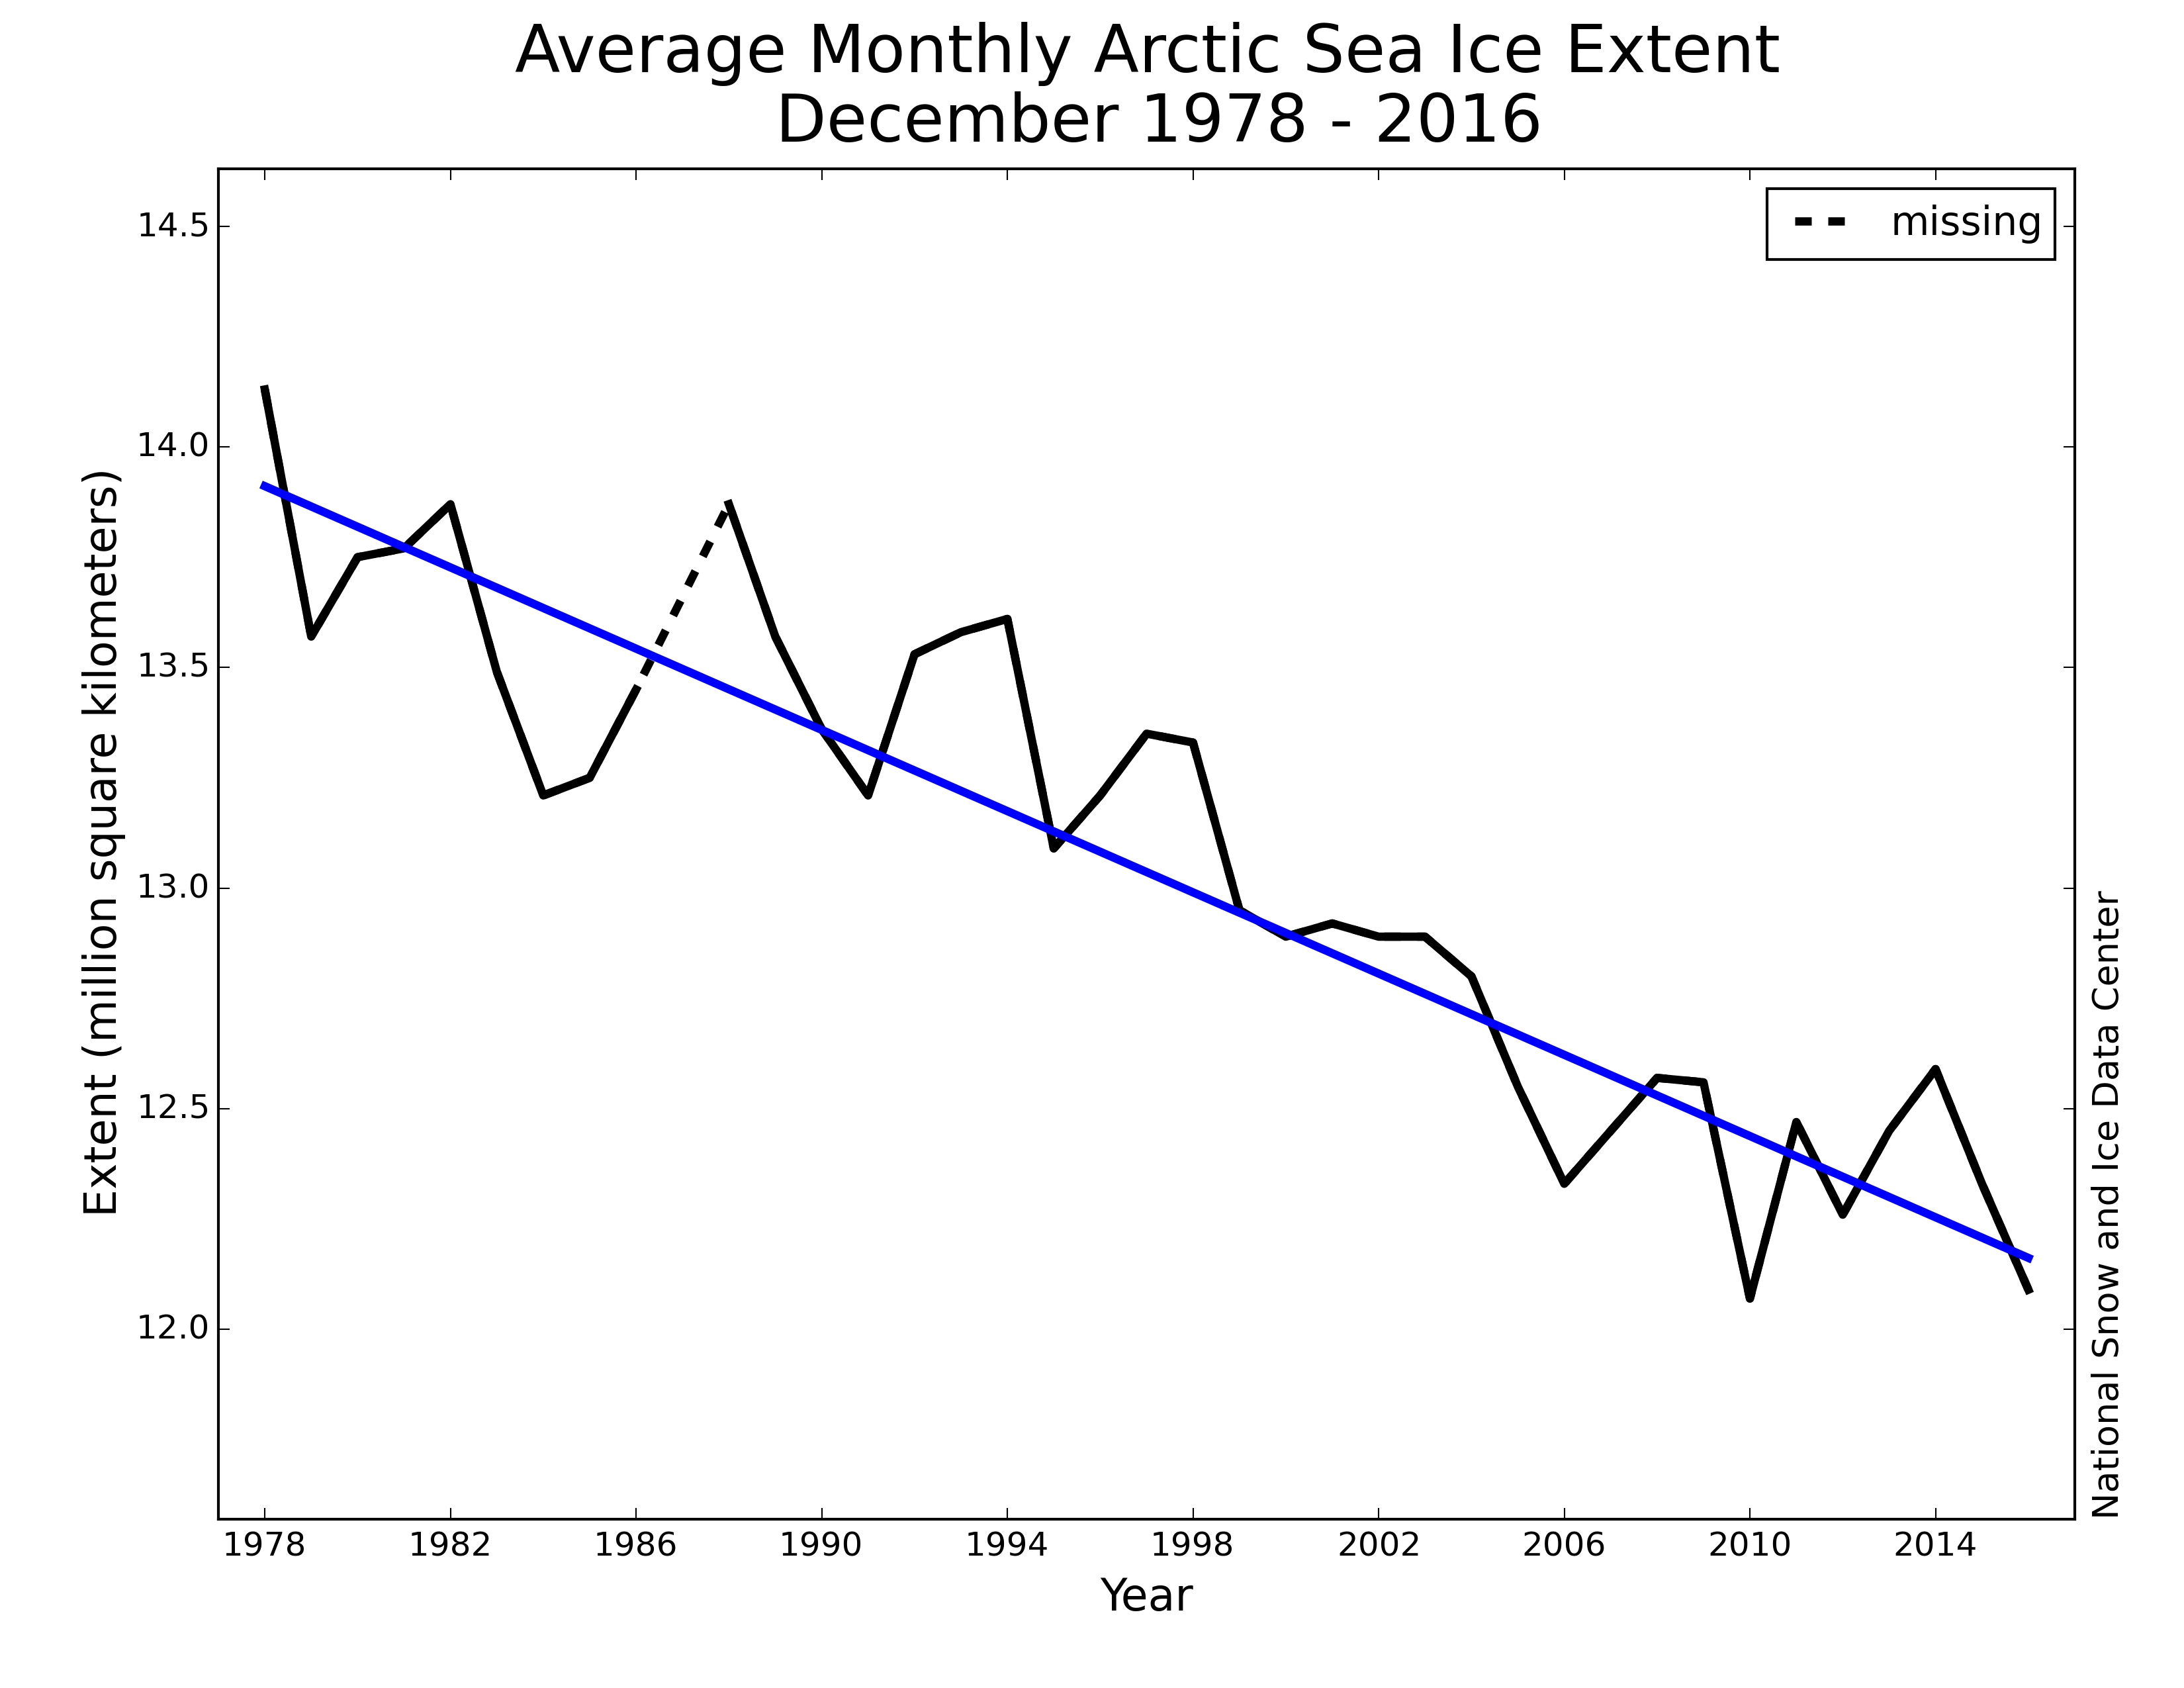
Figure 3. Monthly December ice extent for 1979 to 2016 shows a decline of 3.4 percent per decade.
Credit: National Snow and Ice Data Center
High-resolution image
Through 2016, the linear rate of decline for December is 44,500 square kilometers (17,200 square miles) per year, or 3.4 percent per decade.
While daily extents for December 2016 were at record lows, based on the method employed by NSIDC, the monthly average extent for December 2016 was slightly higher than that recorded for December 2010, the record low December in the satellite record. The monthly average extent for the month of December is higher than the month’s average of daily extents because of the way in which the Sea Ice Index algorithm calculates the monthly extent. The algorithm calculates the monthly average total extent from the monthly average gridded concentration field. Thus, when sea ice is retreating or advancing at a high rate over the course of the month, as was the case for December 2016, the Sea Ice Index monthly average can yield a larger extent than from simply averaging daily extent values. See the Sea Ice Index documentation for further information.
2016 year in review
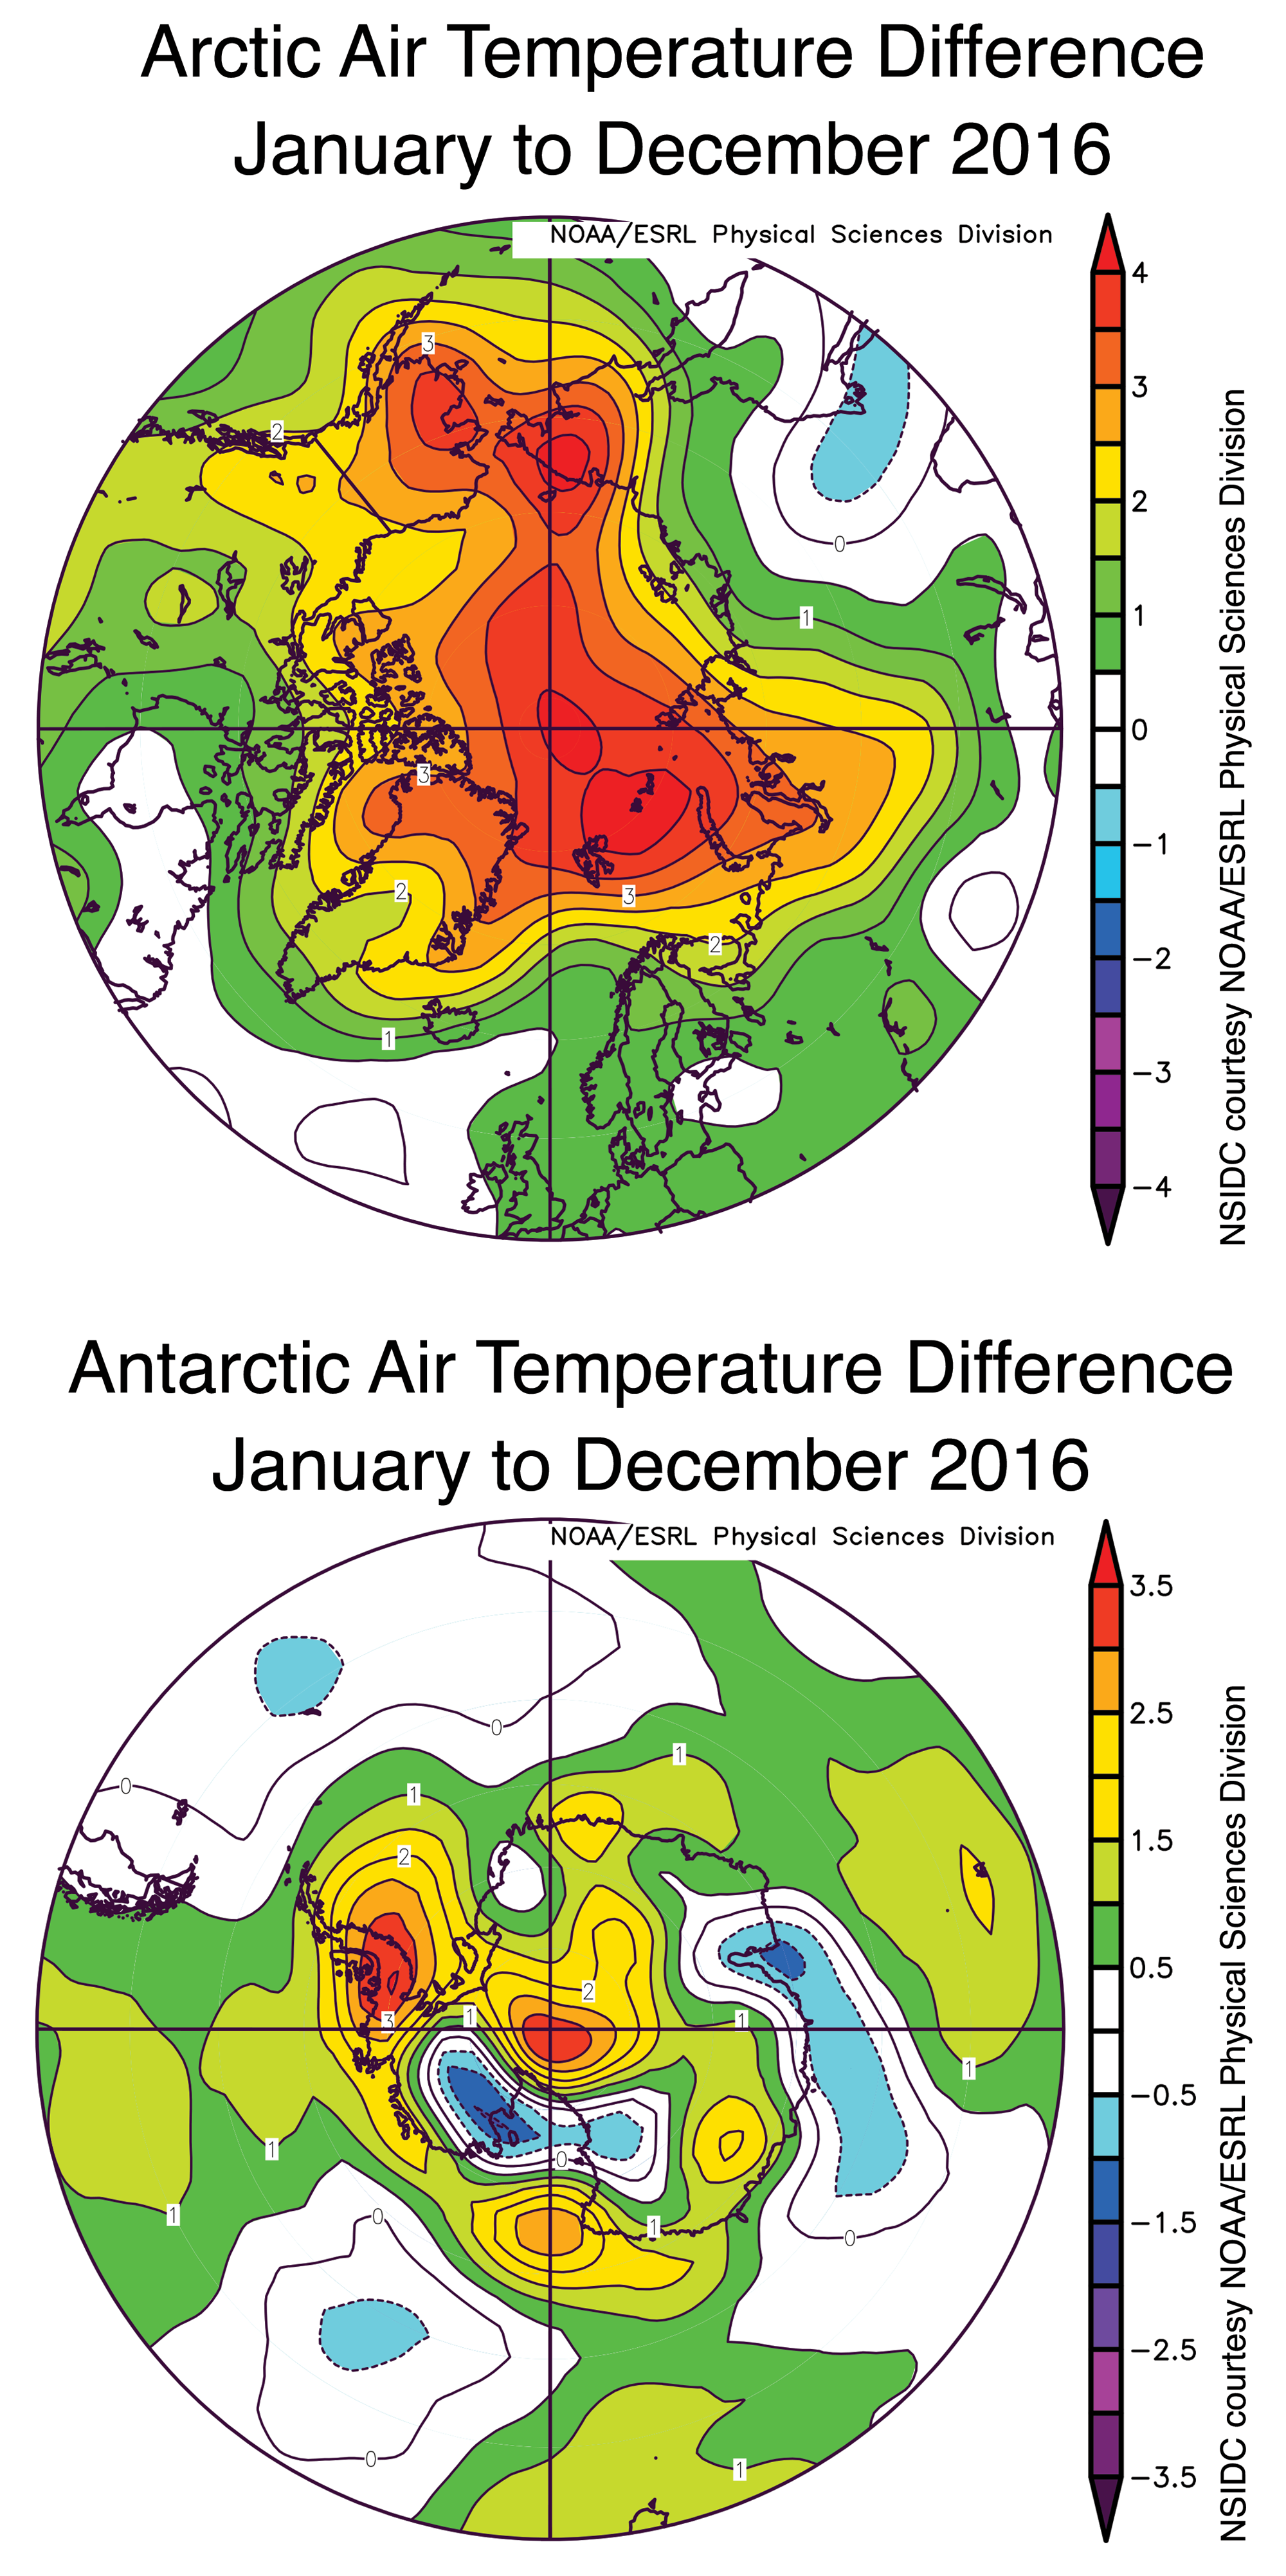
Figure 4. Arctic temperatures at the 925 hPa level (about 2,500 feet above sea level) over the period January to December of 2016 were above average over nearly the entire Arctic region and especially over the Arctic Ocean. By contrast, air temperatures over the Antarctic region for the same period were above average in some areas, such as the Antarctic Peninsula and near the pole, but below average in others.
Credit: NSIDC courtesy NOAA/ESRL Physical Sciences Division
High-resolution image
Average annual sea ice extent in both polar regions was low in 2016. Throughout the year, a wave of new record lows were set for both daily and monthly extent. Record low monthly extents were set in the Arctic in January, February, April, May, June, October, and November; and in the Antarctic in November and December.
For the Arctic, the year opened with daily sea ice extent at near record low levels. Sea ice extent in March tied with 2015 for the lowest maximum in the 37-year satellite period. Ice extent was as much as 500,000 square kilometers (193,000 square miles) below any previous year in the record through most of mid-May to early June. However, the pace of decline returned to near-average rates by July, and the end-of-summer minimum sea ice extent, recorded on September 10, eventually tied for second lowest with 2007 (2012 remains the lowest in the satellite time series by more than 600,000 square kilometers or 232,000 square miles).
That September 2016 did not see a new record low is likely due to the unusually stormy atmospheric pattern that set up over the Arctic Ocean in the summer. Storm after storm moved into the central Arctic Ocean, including a pair of very deep low pressure systems in late August. While a stormy pattern will tend to chew up the ice cover, it also spreads the ice out to cover a larger area and typically brings cloudy and, in summer, relatively cool conditions, inhibiting melt. Sometimes these deep lows act to reduce extent by mixing warm ocean waters upwards, but at present there is no compelling evidence that this occurred in 2016.
In October, a pattern of warm air intrusions from the North Atlantic began. This pattern combined with unusually high sea surface temperatures over the Barents and Kara Seas and helped to keep Arctic sea ice extent at low levels for November and December. In the middle of November there was even a several-day period when Arctic sea ice extent decreased. Unusually warm conditions and record low daily sea ice extent levels continued through the end of the year. The unusually high sea ice surface temperatures reflect a shift in ocean circulation, enhancing the import of warm, Atlantic-derived waters into the Arctic Ocean.
In the Southern Hemisphere, overall sea ice extent shifted from near-average over the first half of the year to sharply below average in mid-August. This initiated a period of near-record, and then extreme record low extents that persisted until late in the year. While the Antarctic seasonal sea ice minimum was unremarkable (slightly earlier, and slightly lower, than the 37-year average), the sea ice maximum occurred early (August 31), followed by a period of rapid ice extent decline. By November, extent was more than 2 million square kilometers (772,000 square miles) below the 1981 to 2010 average extent. In combination with the low Arctic sea ice extent for November, this produced a remarkably low global sea ice total.
The cause of the rapid drop in Antarctic sea ice in the second half of 2016 remains elusive. Significant changes in Southern Ocean wind patterns were observed in August, September, and November, but air temperatures and ocean conditions were not highly unusual.
Sea ice cover in Chukchi Sea depends on Bering Strait inflow

Figure 5. This figure shows time series of the Julian dates of seasonal retreat and advance of sea ice in the Chukchi Sea. The trends in retreat and advance (show by the thin solid lines) are related to climate warming. The variations about the trends line are strongly related to variability in the Bering Strait heat inflow.
Credit: Serreze, M. C., et al. 2016. Journal of Geophysical Research
High-resolution image
A recent study by NSIDC scientists Mark Serreze, Julienne Stroeve, and Alexander Crawford, along with University of Washington scientist Rebecca Woodgate, demonstrates strong links between seasonal sea ice retreat and advance in the Chukchi Sea and the inflow of ocean heat into the region through the Bering Strait. The Chukchi Sea region is important as a focus for resource exploration, and vessels transiting the Arctic Ocean must inevitably pass through it. The Chukchi Sea is also part of the seasonal migration route for Bowhead whales that supports subsistence hunting by local indigenous communities.
Serreze and colleagues looked at time series of the date of retreat and advance in which linear trends related to general warming were removed. They found that 68 percent of the variance in the date that ice retreats from the continental shelf break in the Chukchi Sea in spring can be explained by fluctuations in the April through June Bering Strait oceanic heat inflow. The Bering Strait heat inflow data comes from a mooring located within the strait maintained by the University of Washington. They also found that 67 percent of the variance for the date at which ice advances back to the shelf break in autumn and winter can be related to the combined effects of the July through September Bering Strait inflow and the date of ice retreat. When seasonal ice retreat occurs early, low-albedo open water areas are exposed early, which gain a lot of energy from the sun. With more heat in the upper ocean, autumn ice growth is delayed. These relationships with the Bering Strait inflow and ocean heat uptake are superimposed upon the overall trends due to a warming climate. While these relationships lay a path forward to improving seasonal predictions of ice conditions in the region, developing an operational prediction scheme would require more timely acquisition of Bering Strait heat inflow data than is presently possible.
Global sea ice tracking far below average
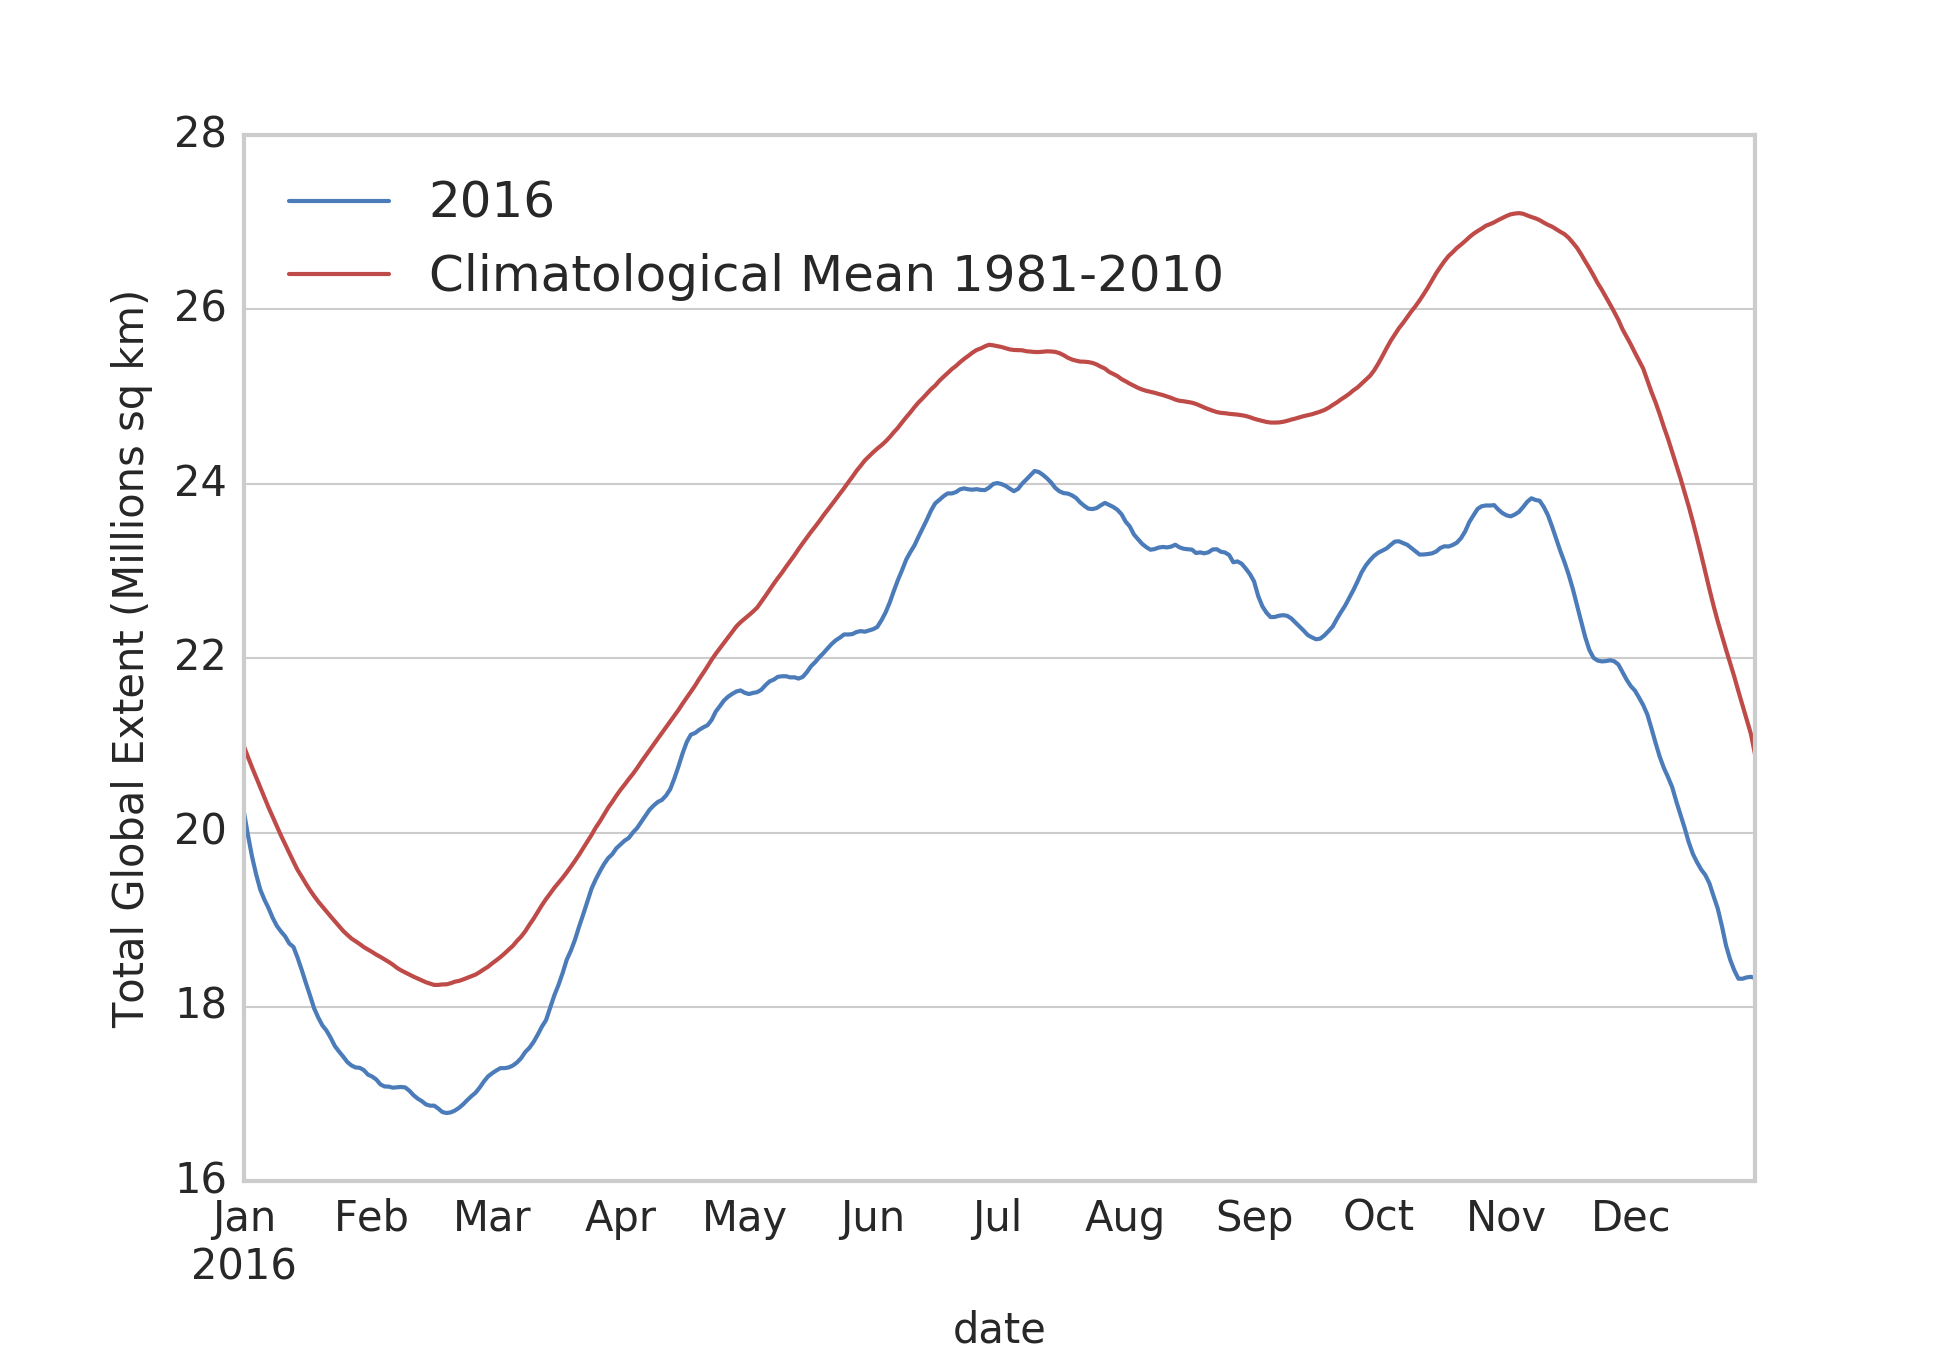
Figure 6a. This time series of daily global sea ice extent (Arctic plus Antarctic) shows global extent tracking below the 1981 to 2010 average. The X axis shows the month of the year, aligned with the first day of the month. Sea Ice Index data.
Credit: NSIDC
High-resolution image
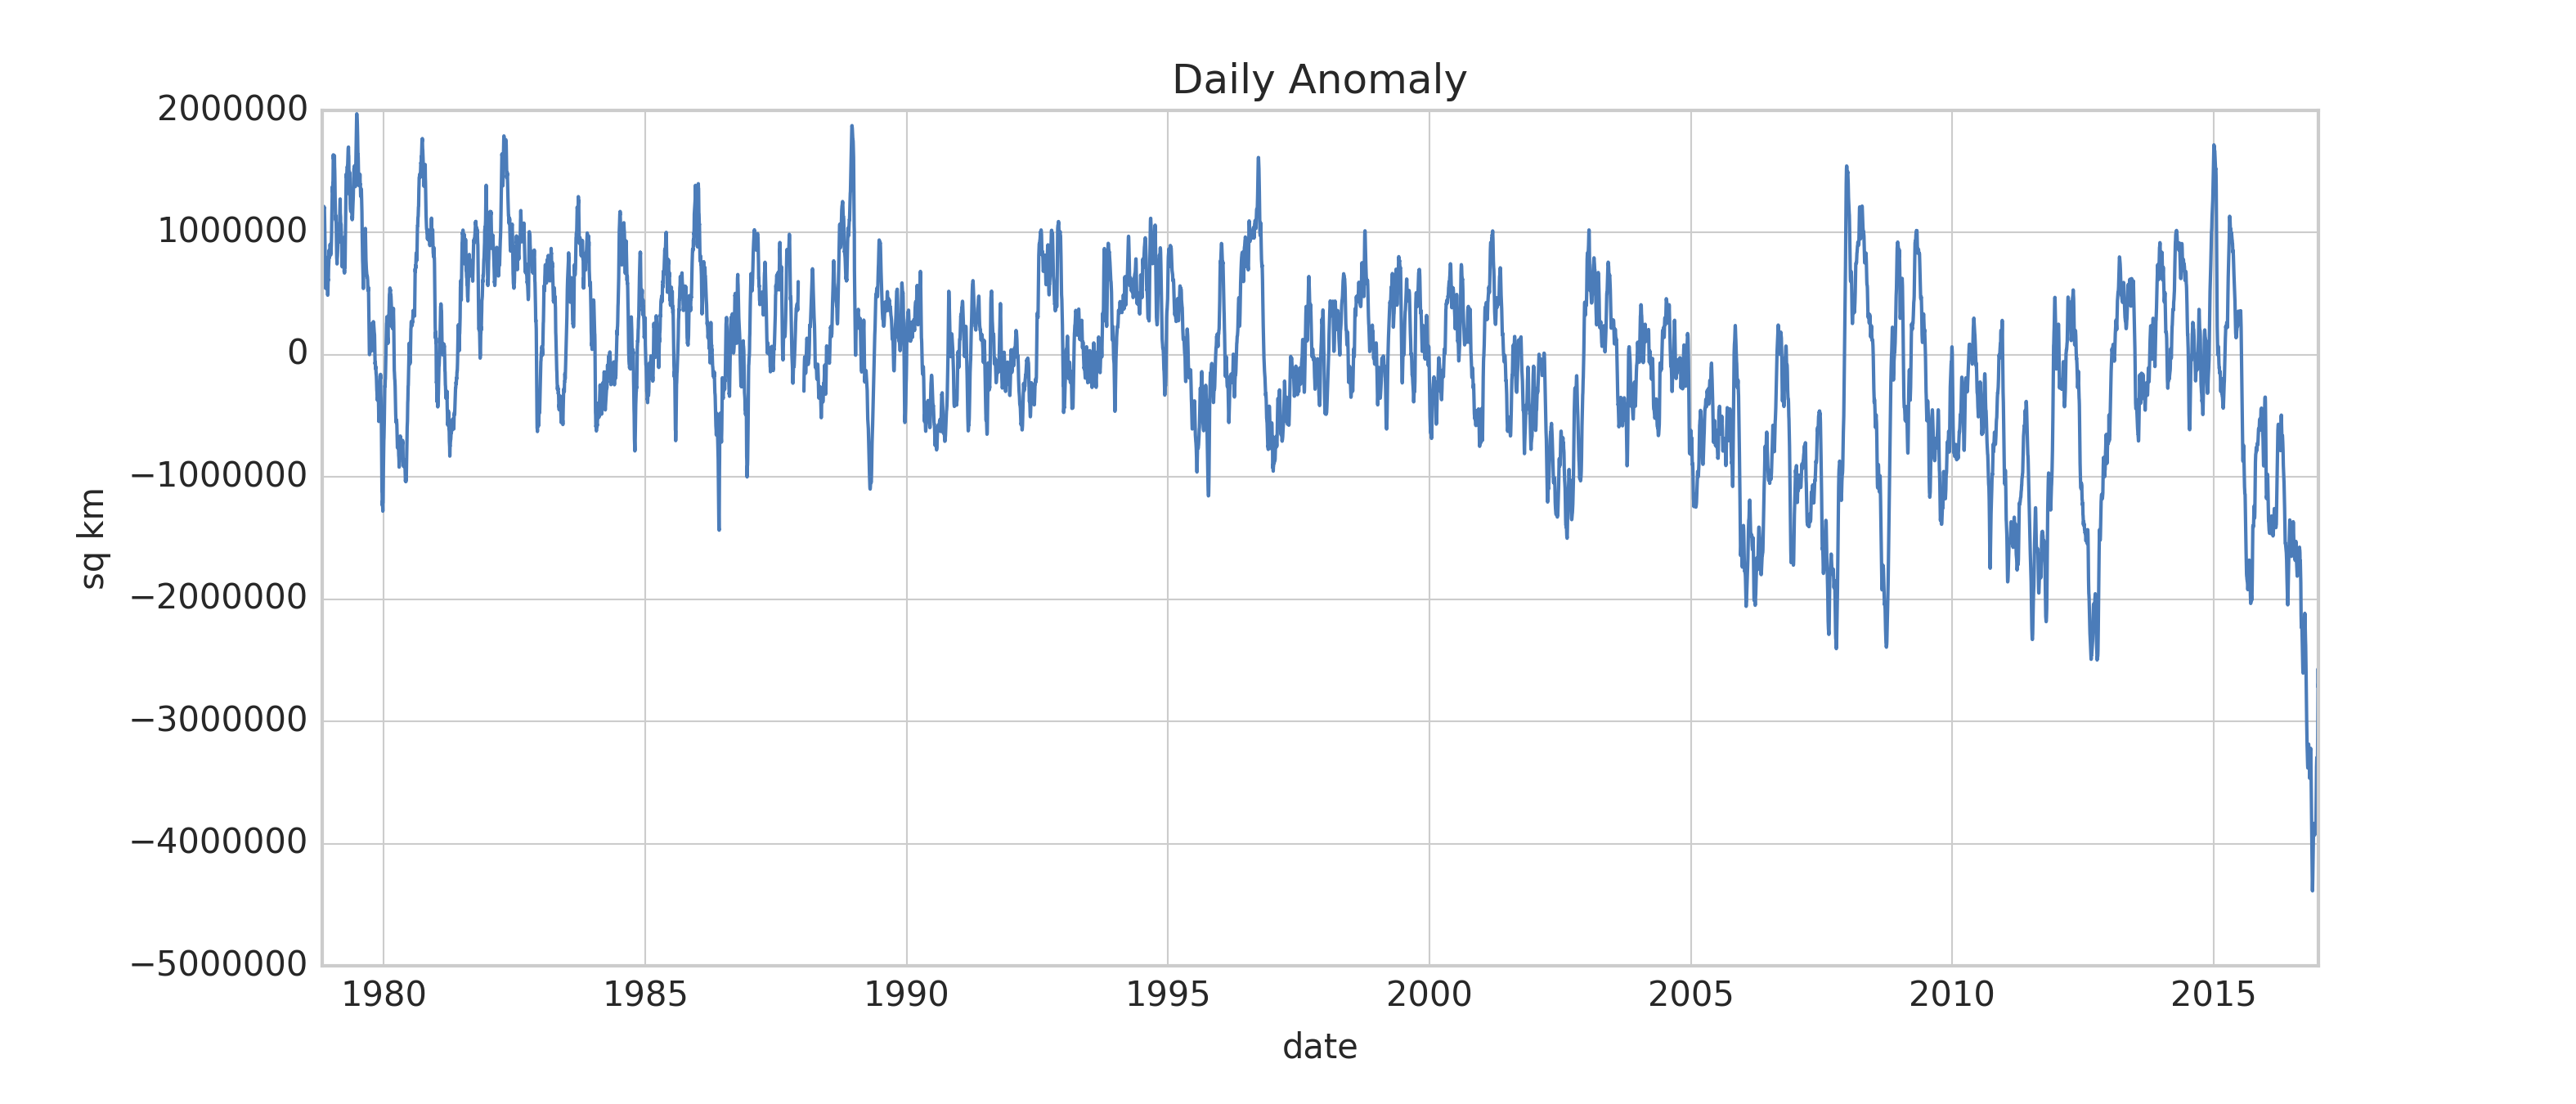
Figure 6b. This graph shows daily global sea ice difference from average, relative to the 1981 to 2010 reference period in square kilometers for the satellite record from 1979 through 2016
Credit: National Snow and Ice Data Center
High-resolution image

Figure 6c. This graph shows daily sea ice difference from average in units of the standard deviation (based on 1981-2010 variation from the average) for this period.
Credit: National Snow and Ice Data Center
High-resolution image
Global sea ice (Arctic plus Antarctic) continues to track at record low levels in the satellite record, but the deviation from average has moderated compared to what was observed in November. This reflects a December pattern of faster-than-average growth in the Arctic, and slightly slower-than average sea ice extent decline in the Southern Ocean. The gap between the 1981 to 2010 average and the 2016 combined ice extent for December now stands at about 3.0 million square kilometers (1.16 million square miles), down from a peak difference of just over 4 million square kilometers (1.50 million square miles) in mid-November. This globally combined low ice extent is a result of largely separate processes in the two hemispheres.
Changes to our graphics for 2017
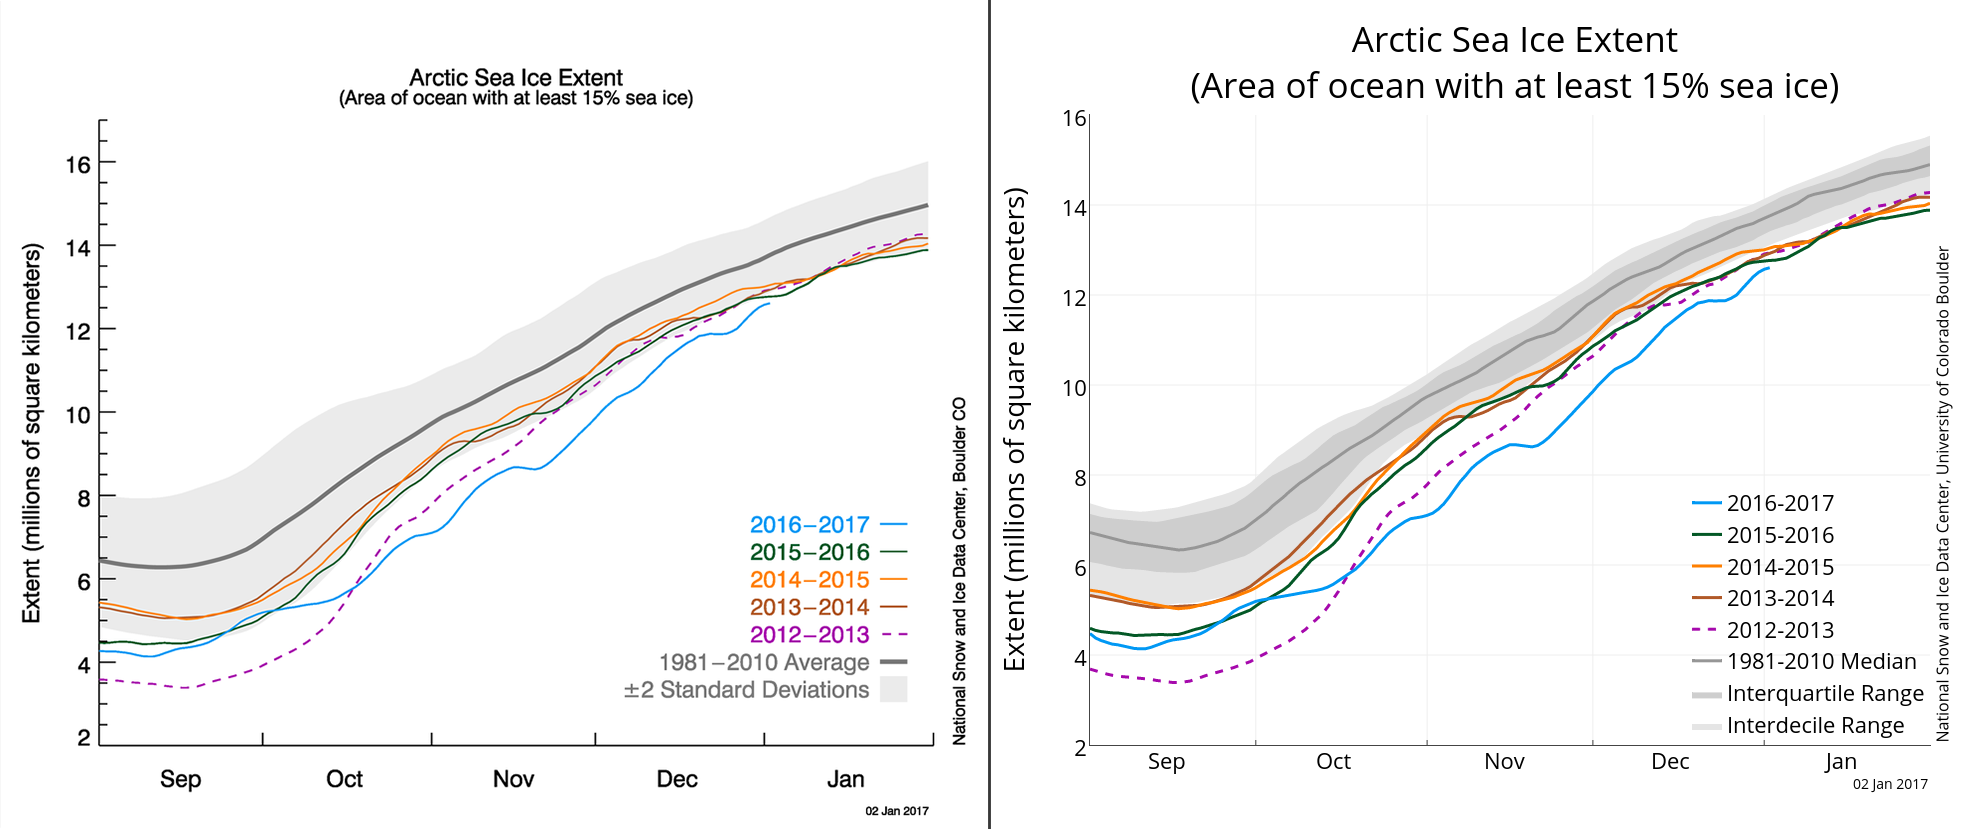
Figure 7. This comparison shows the changes that will be made to NSIDC time series graphs.
Credit: NSIDC
High-resolution image
NSIDC is transitioning the sea ice extent time series graphs to show interquartile and interdecile ranges, with the median extent value, in place of standard deviations and the average values. Standard deviations are most useful with data that are clustered towards the average, or “normally distributed” like a bell curve, with few outliers. Sea ice extent data, however, has become skewed due to the strong downward trend in ice extent, with a wider spread of values and more values falling at the low end of the range. Interquartile and interdecile ranges, along with the median value, are better for presenting data with these characteristics. The interquartile and interdecile ranges more clearly show how the data are distributed and can better distinguish outliers, and so provide a better view of the variability of the data.
Further reading
Serreze, M. C., A. Crawford, J. C. Stroeve, A. P. Barrett, and R. A. Woodgate. 2016. Variability, trends and predictability of seasonal sea ice retreat and advance in the Chukchi Sea. Journal of Geophysical Research, 121, doi:10.1002/2016JC011977.

