Arctic sea ice extent remained lower than average in January, and just within two standard deviations of the long-term average. Arctic temperatures remained above average, even as cold winter air embraced North America. The retention of more sea ice in September 2013 has increased the overall thickness and volume of the ice pack compared to recent years. Antarctic sea ice remains significantly more extensive than average.
Overview of conditions

Figure 1. Arctic sea ice extent for January 2014 was 13.73 million square kilometers (5.30 million square miles). The magenta line shows the 1981 to 2010 median extent for that month. The black cross indicates the geographic North Pole. Sea Ice Index data. About the data
Credit: National Snow and Ice Data Center
High-resolution image
Arctic sea ice extent continued to track below average during January, remaining just within two standard deviations of the long-term average. The average extent for January was 13.73 million square kilometers (5.30 million square miles). This is 800,000 square kilometers (309,000 square miles) less than the 1981 to 2010 average, and 160,000 square kilometers (61,800 square miles) above the previous record low for the month of January set in 2011. Sea ice extent remains below average in the Barents Sea, the Sea of Okhotsk, and the Bering Sea. While recent winters have seen more extensive sea ice in the Bering Sea, this is the first January since 2005 for which below average conditions have been observed there. Extent is close to average in Baffin Bay, the Labrador Sea, and the Gulf of St. Lawrence.
Conditions in context
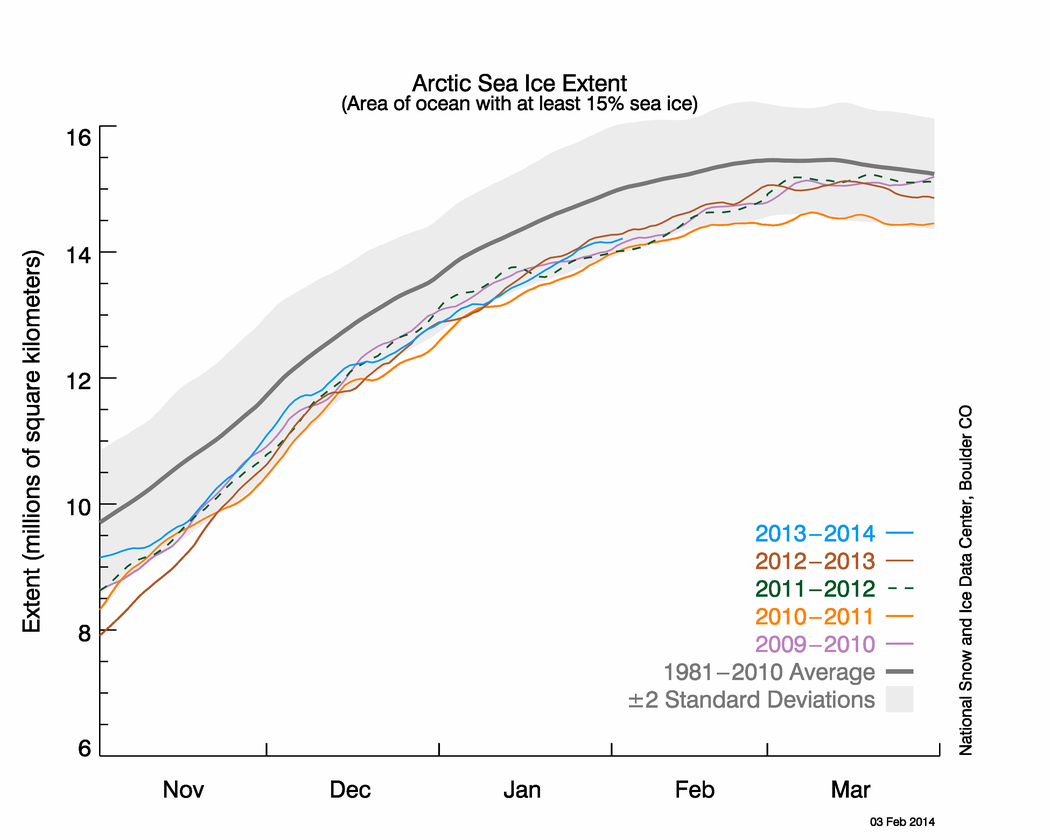
Figure 2. The graph above shows Arctic sea ice extent as of February 3, 2014, along with daily ice extent data for the previous four years. 2013-2014 is shown in blue, 2012-2013 in brown, and 2011-2012 in green, 2010-2011 in orange, and 2009-2010 in light purple. The gray area around the average line shows the two standard deviation range of the data. Sea Ice Index data.
Credit: National Snow and Ice Data Center
High-resolution image
Air temperatures for January were higher than average over most of the Arctic Ocean, helping to keep daily ice growth rates at near average values. Air temperatures at the 925 hPa level were 2 to 4 degrees Celsius (4 to 7 degrees Fahrenheit) above average over the central Arctic Ocean and 7 to 8 degrees Celsius (13 to 14 degrees Fahrenheit) higher than average over the North Atlantic region, Greenland, Baffin Bay, and Alaska. Cooler than average conditions prevailed over Siberia (−4 to −8 degrees Celsius, or −7 to −14 degrees Fahrenheit) and the southern Beaufort Sea (−2 to −4 degrees Celsius, or −4 to −7 degrees Fahrenheit). This temperature pattern is consistent with a negative Arctic Oscillation pattern, which dominated the month of January. This is in contrast to the positive Arctic Oscillation pattern, which dominated December 2013, leading to anomalously warm conditions over Siberia and Eurasia and colder than average conditions over Greenland, Alaska, and Canada.
January 2014 compared to previous years
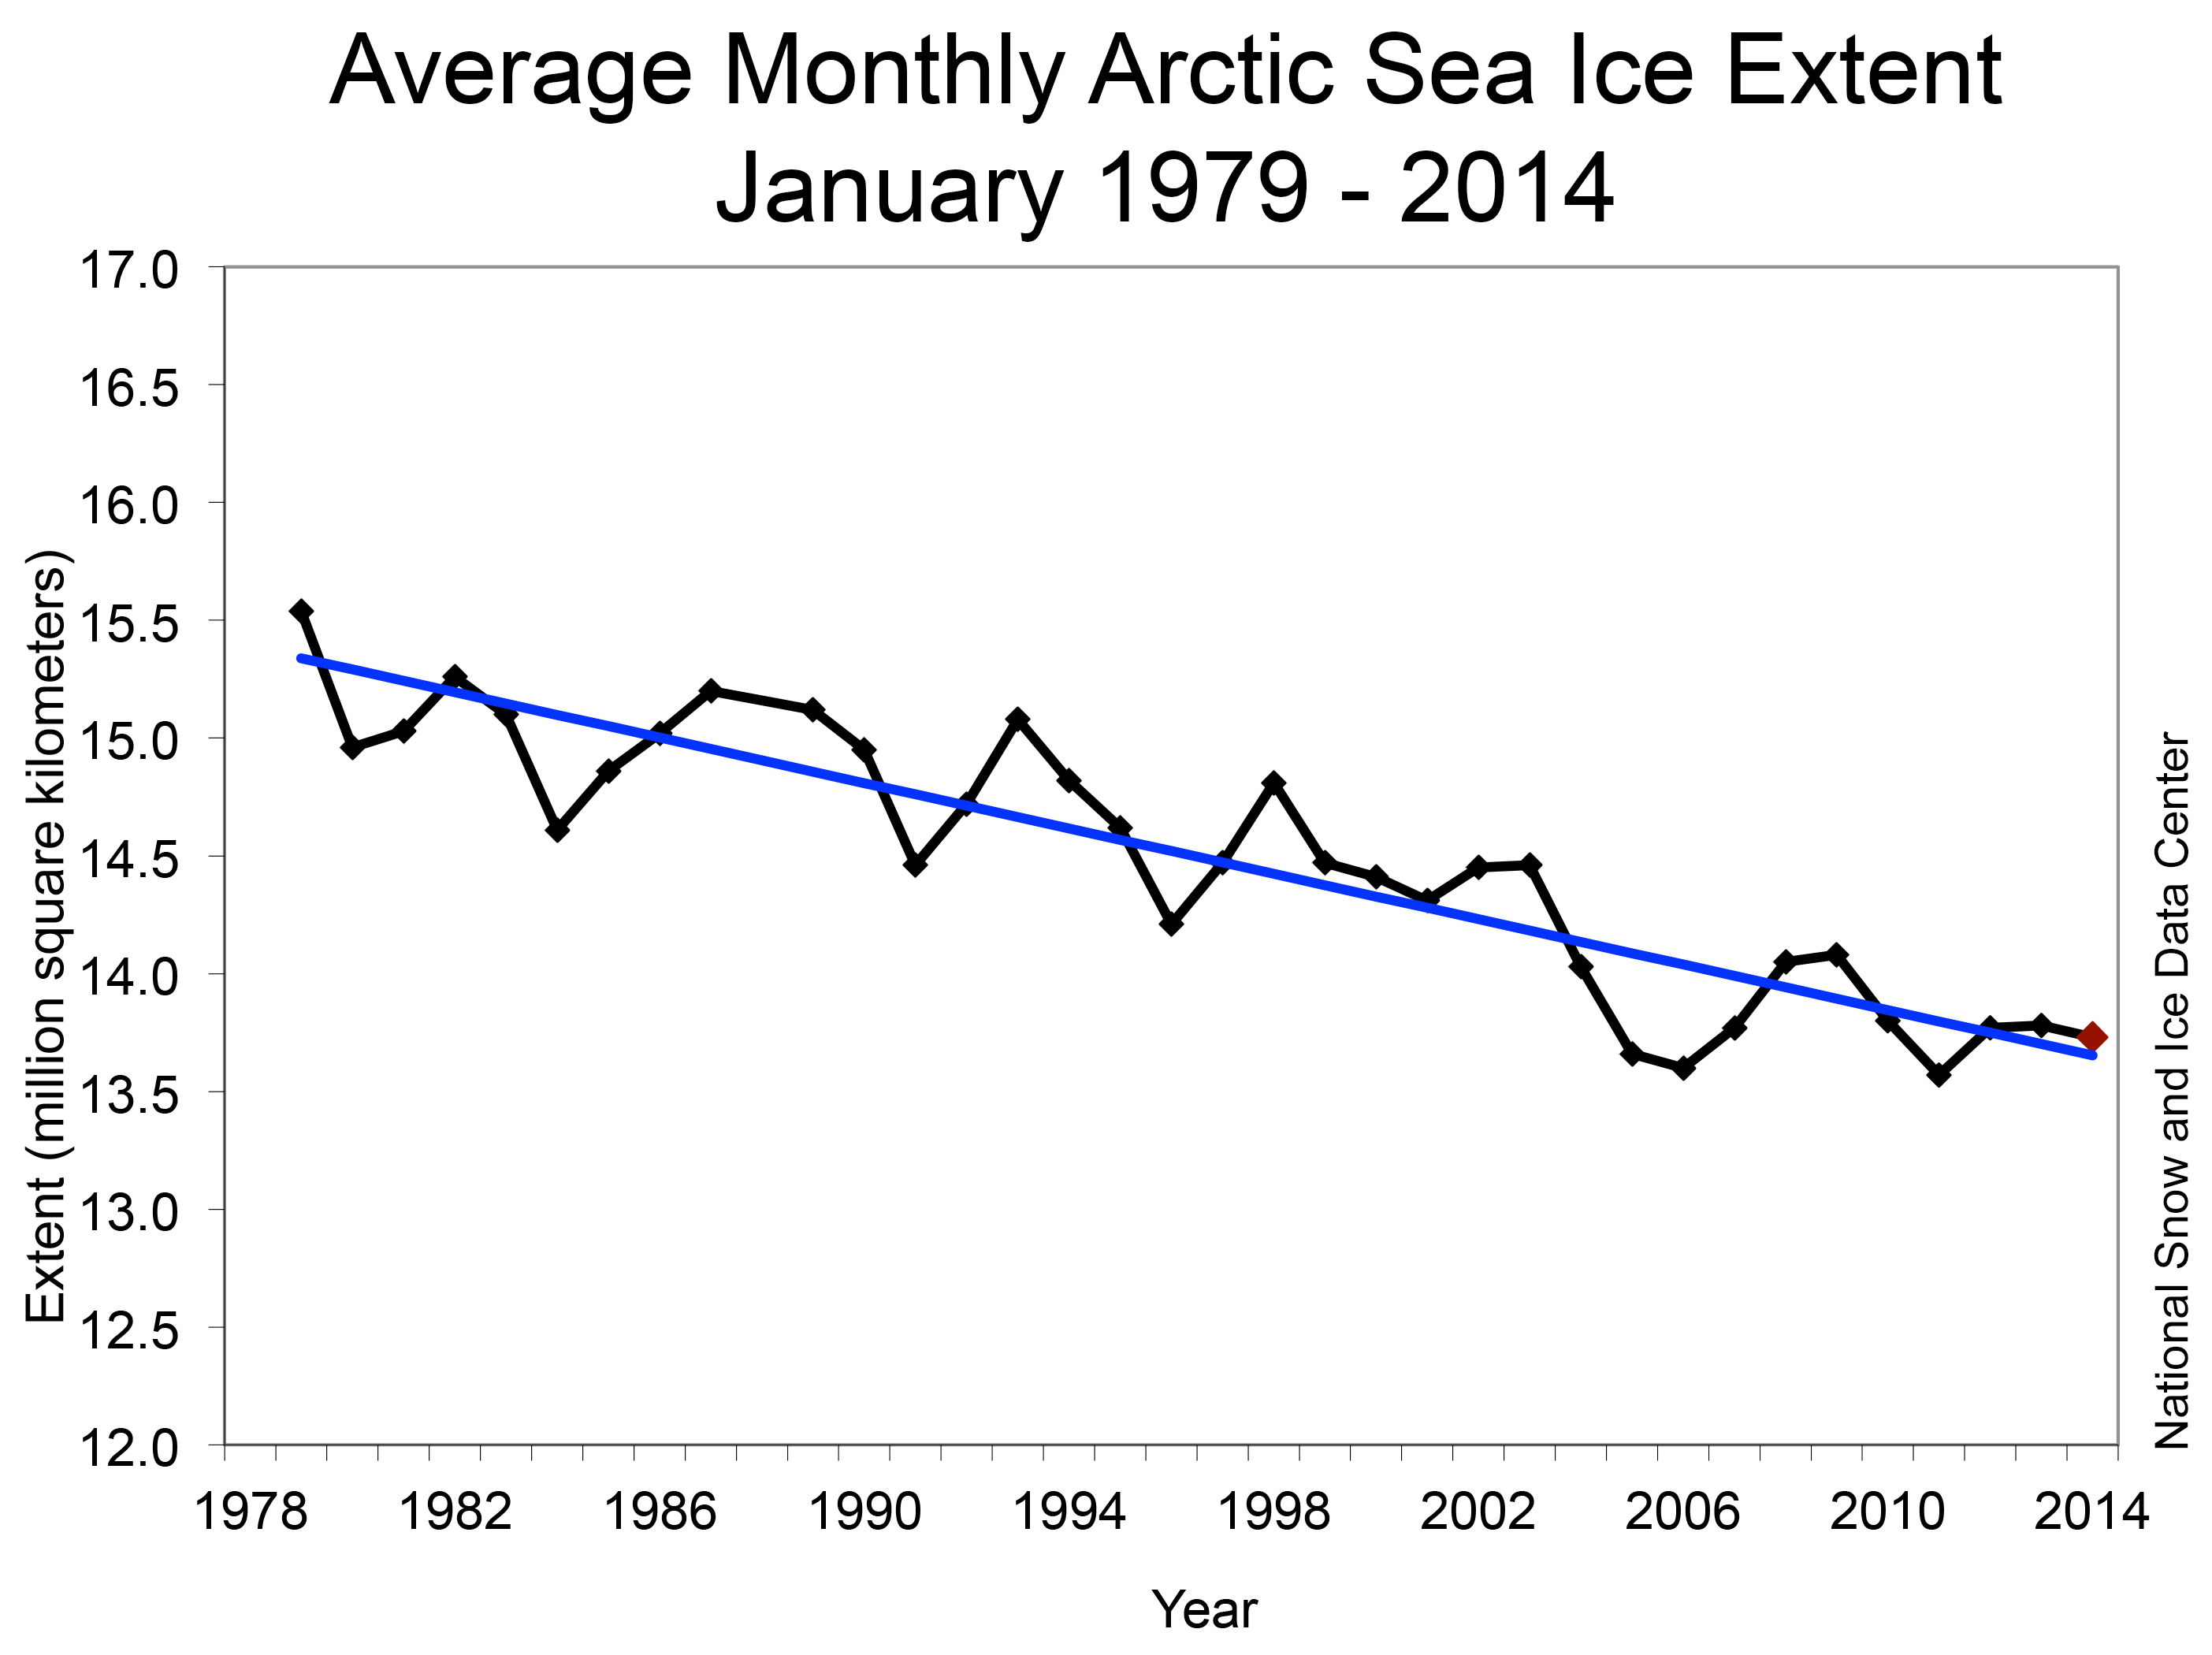
Figure 3. Monthly January ice extent for 1979 to 2014 shows a decline of 3.2% per decade.
Credit: National Snow and Ice Data Center
High-resolution image
Including 2014, sea ice extent for January is declining at a rate of 3.2% per decade relative to the 1981 to 2012 average, or at a rate of 47,800 square kilometers (18,500 square miles) per year. January 2014 is the fourth lowest extent in the satellite record, behind 2005, 2006, and the record low January 2011.
CryoSat suggests thicker ice than in recent years

Figure 4. This series of images from the European Space Agency CryoSat satellite compares Arctic sea ice thickness for the last four Octobers. Thinner ice is indicated in blues and greens; thicker ice is show in yellows and reds.
Credit: National Snow and Ice Data Center/CryoSat, courtesy Rachel Tilling/University College London.
High-resolution image
While satellite observations have shown a decline in Arctic Ocean sea ice extent since the late 1970s, sea ice is highly mobile, and a decrease in extent does not necessarily imply a corresponding decrease in ice volume. Observations of thickness (which allows calculation of volume) have been limited, making it difficult to estimate sea ice volume trends. The European Space Agency (ESA) CryoSat satellite was launched in October 2010 and has enabled estimates of sea ice thickness and volume for the last three years.
Preliminary measurements from CryoSat show that the volume of Arctic sea ice in autumn 2013 was about 50% higher than in the autumn of 2012. In October 2013, CryoSat measured approximately 9,000 cubic kilometers (approximately 2,200 cubic miles) of sea ice compared to 6,000 cubic kilometers (approximately 1,400 cubic miles) in October 2012. About 90% of the increase in volume between the two years is due to the retention of thick, multiyear ice around Northern Greenland and the Canadian Archipelago. However, this apparent recovery in ice volume should be considered in a long-term context. It is estimated that in the early 1980s, October ice volume was around 20,000 cubic kilometers (approximately 4,800 cubic miles), meaning that ice volume in October 2013 still ranks among the lowest of the past 30 years. CryoSat will continue to monitor sea ice through the current growth season, and the data will reveal the effect of this past autumn’s increase on ice volume at the end of winter.
New insight on the expanding Antarctic sea ice extent

Figure 5b. This image of Antarctic sea ice concentration anomaly trends for January 2014 suggests increases in sea ice in the western Ross and Weddell Seas (oranges and reds), and declines in the Amundsen and Bellingshausen Seas (blues). Sea Ice Index data. About the data
Credit: National Snow and Ice Data Center
High-resolution image

Figure 5a. The graph above shows Antarctic sea ice extent as of February 3, 2014, along with daily ice extent data for the previous four years. 2013-2014 is shown in light blue, 2012-2013 in brown, and 2011-2012 in green, 2010-2011 in orange, and 2009-2010 in light purple. The gray area around the average line shows the two standard deviation range of the data. Sea Ice Index data.
Credit: National Snow and Ice Data Center
High-resolution image
Antarctic sea ice extent continues to track very high in January, reaching the second-highest monthly extent in the 36-year satellite monitoring record. New monthly extent records were set for each month between August and November, and December was tied for the record (within the limits of the precision). Trend maps of sea ice concentration (Figure 5b), however, reveal that the increase is not uniform around the Antarctic continent, nor is the strength of the monthly trends (in percent increase per decade) as great as those for the Arctic, in either winter or summer. While sea ice has increased in the western Ross Sea and the Weddell Sea, it has declined in the Amundsen and Bellingshausen seas.
Most efforts to explain these regional patterns of sea ice variability and trends have focused on variations in patterns of atmospheric circulation around the Antarctic continent, and how these patterns are driven by variations in sea surface temperature in the tropical Pacific Ocean (such as those associated with El Niño and La Niña). While these patterns show large variations seasonally and year-to-year, the longer-term trend in Pacific sea surface temperature is small, and does not appear to explain the long-term overall sea ice increases that have been observed. A new study published in Nature by Li and colleagues may provide the missing link. They argue that changes in the north Atlantic and tropical Atlantic sea surface temperatures may be driving long-term, subtle trends in Southern Ocean winds that would explain the regional trends in sea ice cover. Their results link higher Atlantic sea surface temperatures since 1979 to reduced sea level pressure in the Amundsen Sea, contributing to the resulting dipole-like sea ice pattern between the northern Ross Sea (where sea ice is increasing) and the northern Bellingshausen Seas (where it is decreasing).
Further reading
Laxon, S. and others, 2013. CryoSat-2 estimates of Arctic sea ice thickness and volume, Geophys. Res. Lett., doi:10.1002/grl.50193.
Li, X., D.M. Holland, E.P. Gerber and C. Yoo, 2014. Impacts of the north and tropical Atlantic Ocean on the Antarctic Peninsula and sea ice, Nature, 505, doi:10.1038/nature12945.

