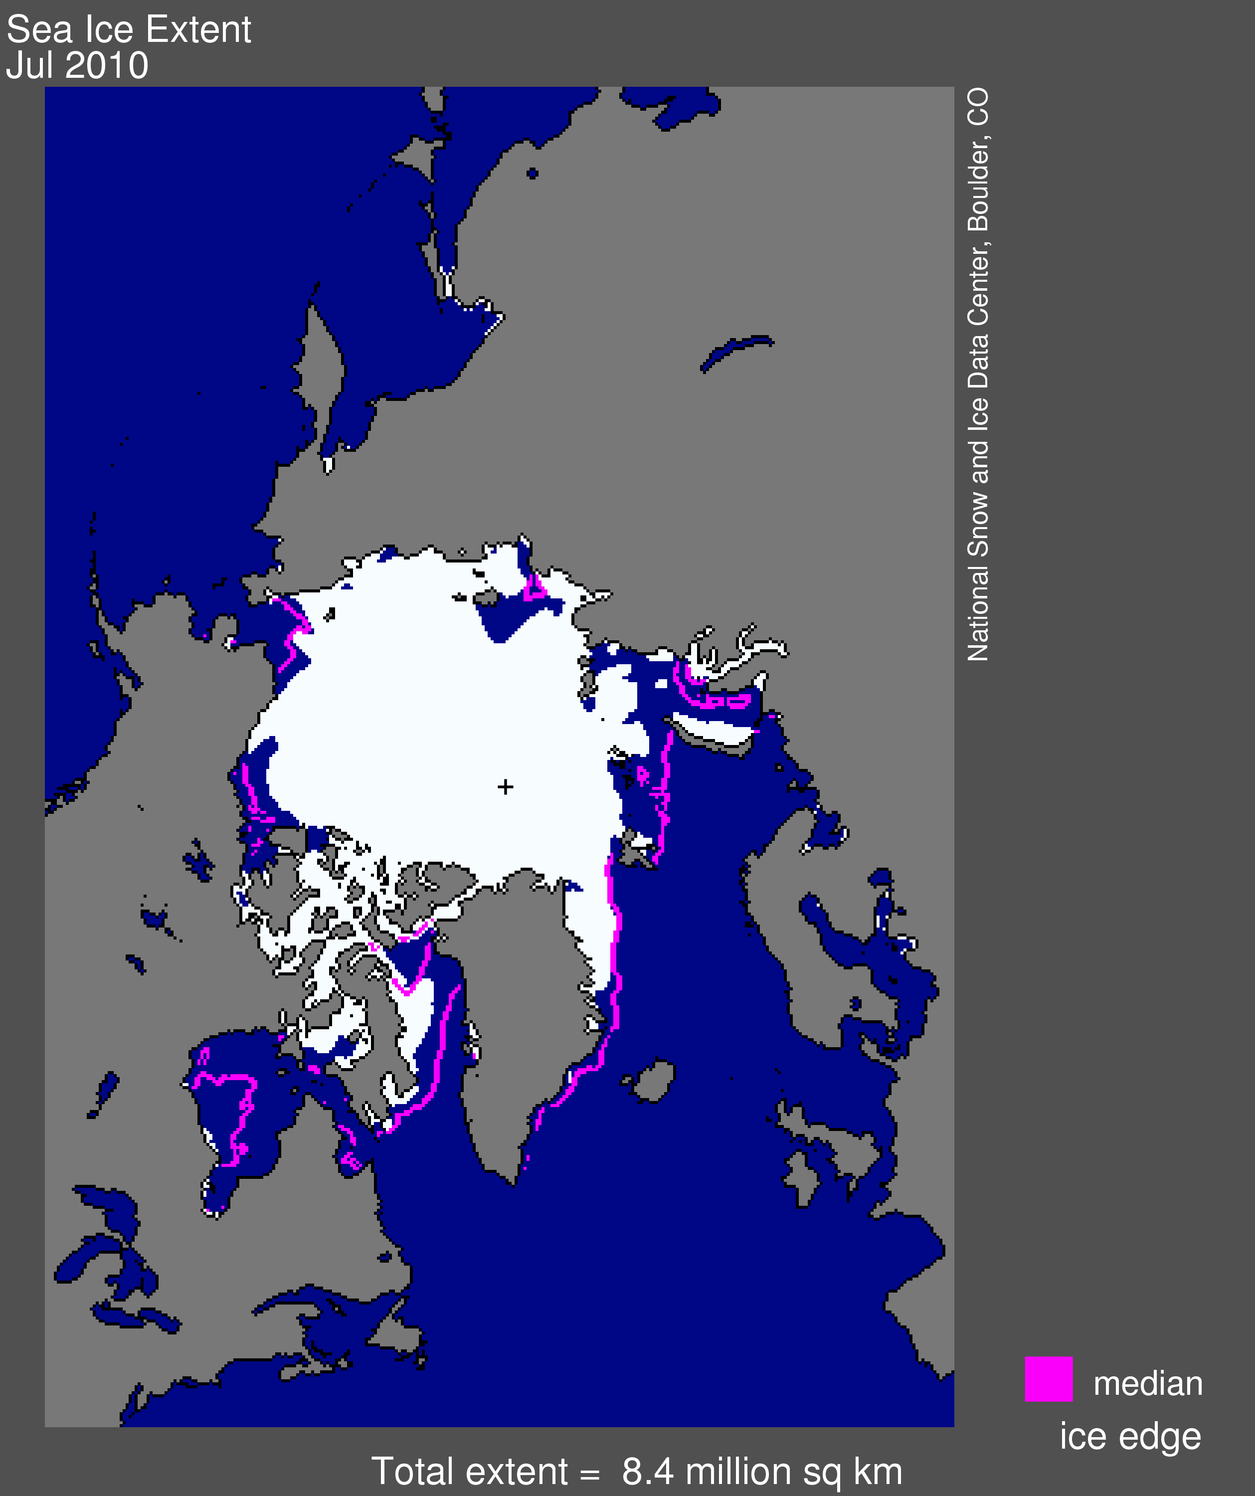
 Figure 1. Arctic sea ice extent for July 2010 was 8.39 million square kilometers (3.24 million square miles). The magenta line shows the 1979 to 2000 median extent for that month. The black cross indicates the geographic North Pole. Sea Ice Index data. About the data. —Credit: National Snow and Ice Data Center
High-resolution image
Overview of conditions
Average ice extent for July was 8.39 million square kilometers (3.24 million square miles), 1.71 million square kilometers (660,000 square miles) below the 1979 to 2000 mean, but 260,000 square kilometers (100,000 square miles) above the average for July 2007, the lowest July in the thirty-two-year satellite record.
Stormy, cloudy, and relatively cool weather persisted through the month, which helped slow the rate of ice loss. The daily rate of decline for July was 77,000 square kilometers (29,700 square miles) per day, close to the 1979 to 2000 average of 84,400 square kilometers (32,600 square miles).
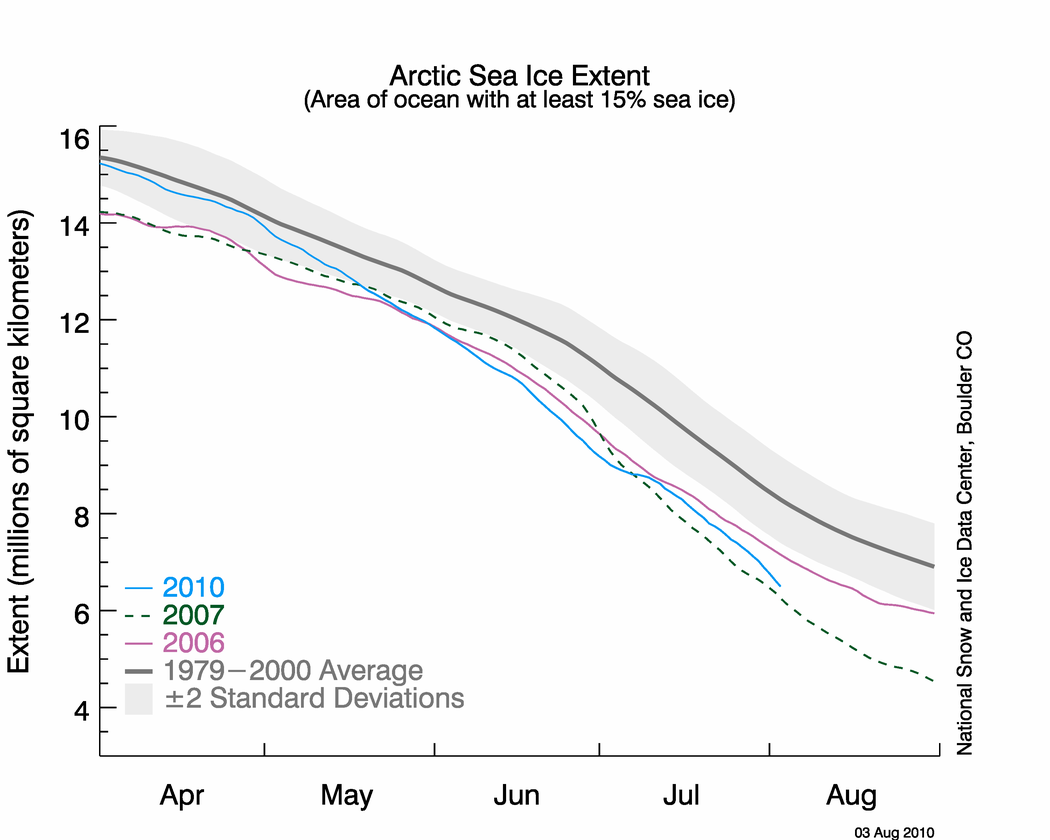 Figure 2. The graph above shows daily Arctic sea ice extent as of August 3, 2010. The solid light blue line indicates 2010; dashed green shows 2007; solid pink shows 2006, and solid gray indicates average extent from 1979 to 2000. The gray area around the average line shows the two standard deviation range of the data. Sea Ice Index data.—Credit: National Snow and Ice Data Center
High-resolution image
Conditions in context
Cool, stormy weather this July has made it less likely that the upcoming 2010 sea ice minimum will set a new record. It would take a very unusual set of conditions in August to create a new record low.
If the daily rate of decline this August follows the average August rate of decline for 1979 to 2000, the daily sea ice minimum in September would be 5.00 million square kilometers (1.93 million square miles), considerably higher than the record minimum of 4.13 million square kilometers (1.59 million square miles) observed for September 16, 2007. A daily rate of decline identical to 2007 would yield a September minimum of 4.43 million square kilometers (1.71 million square miles); while daily decline rates similar to 2008 (the largest ever observed for August), would yield a September minimum of 4.08 million square kilometers (1.58 million square miles). If the daily rate of decline is similar to 2006, the slowest in recent years, the minimum would be 5.27 million square kilometers (2.03 million square miles).
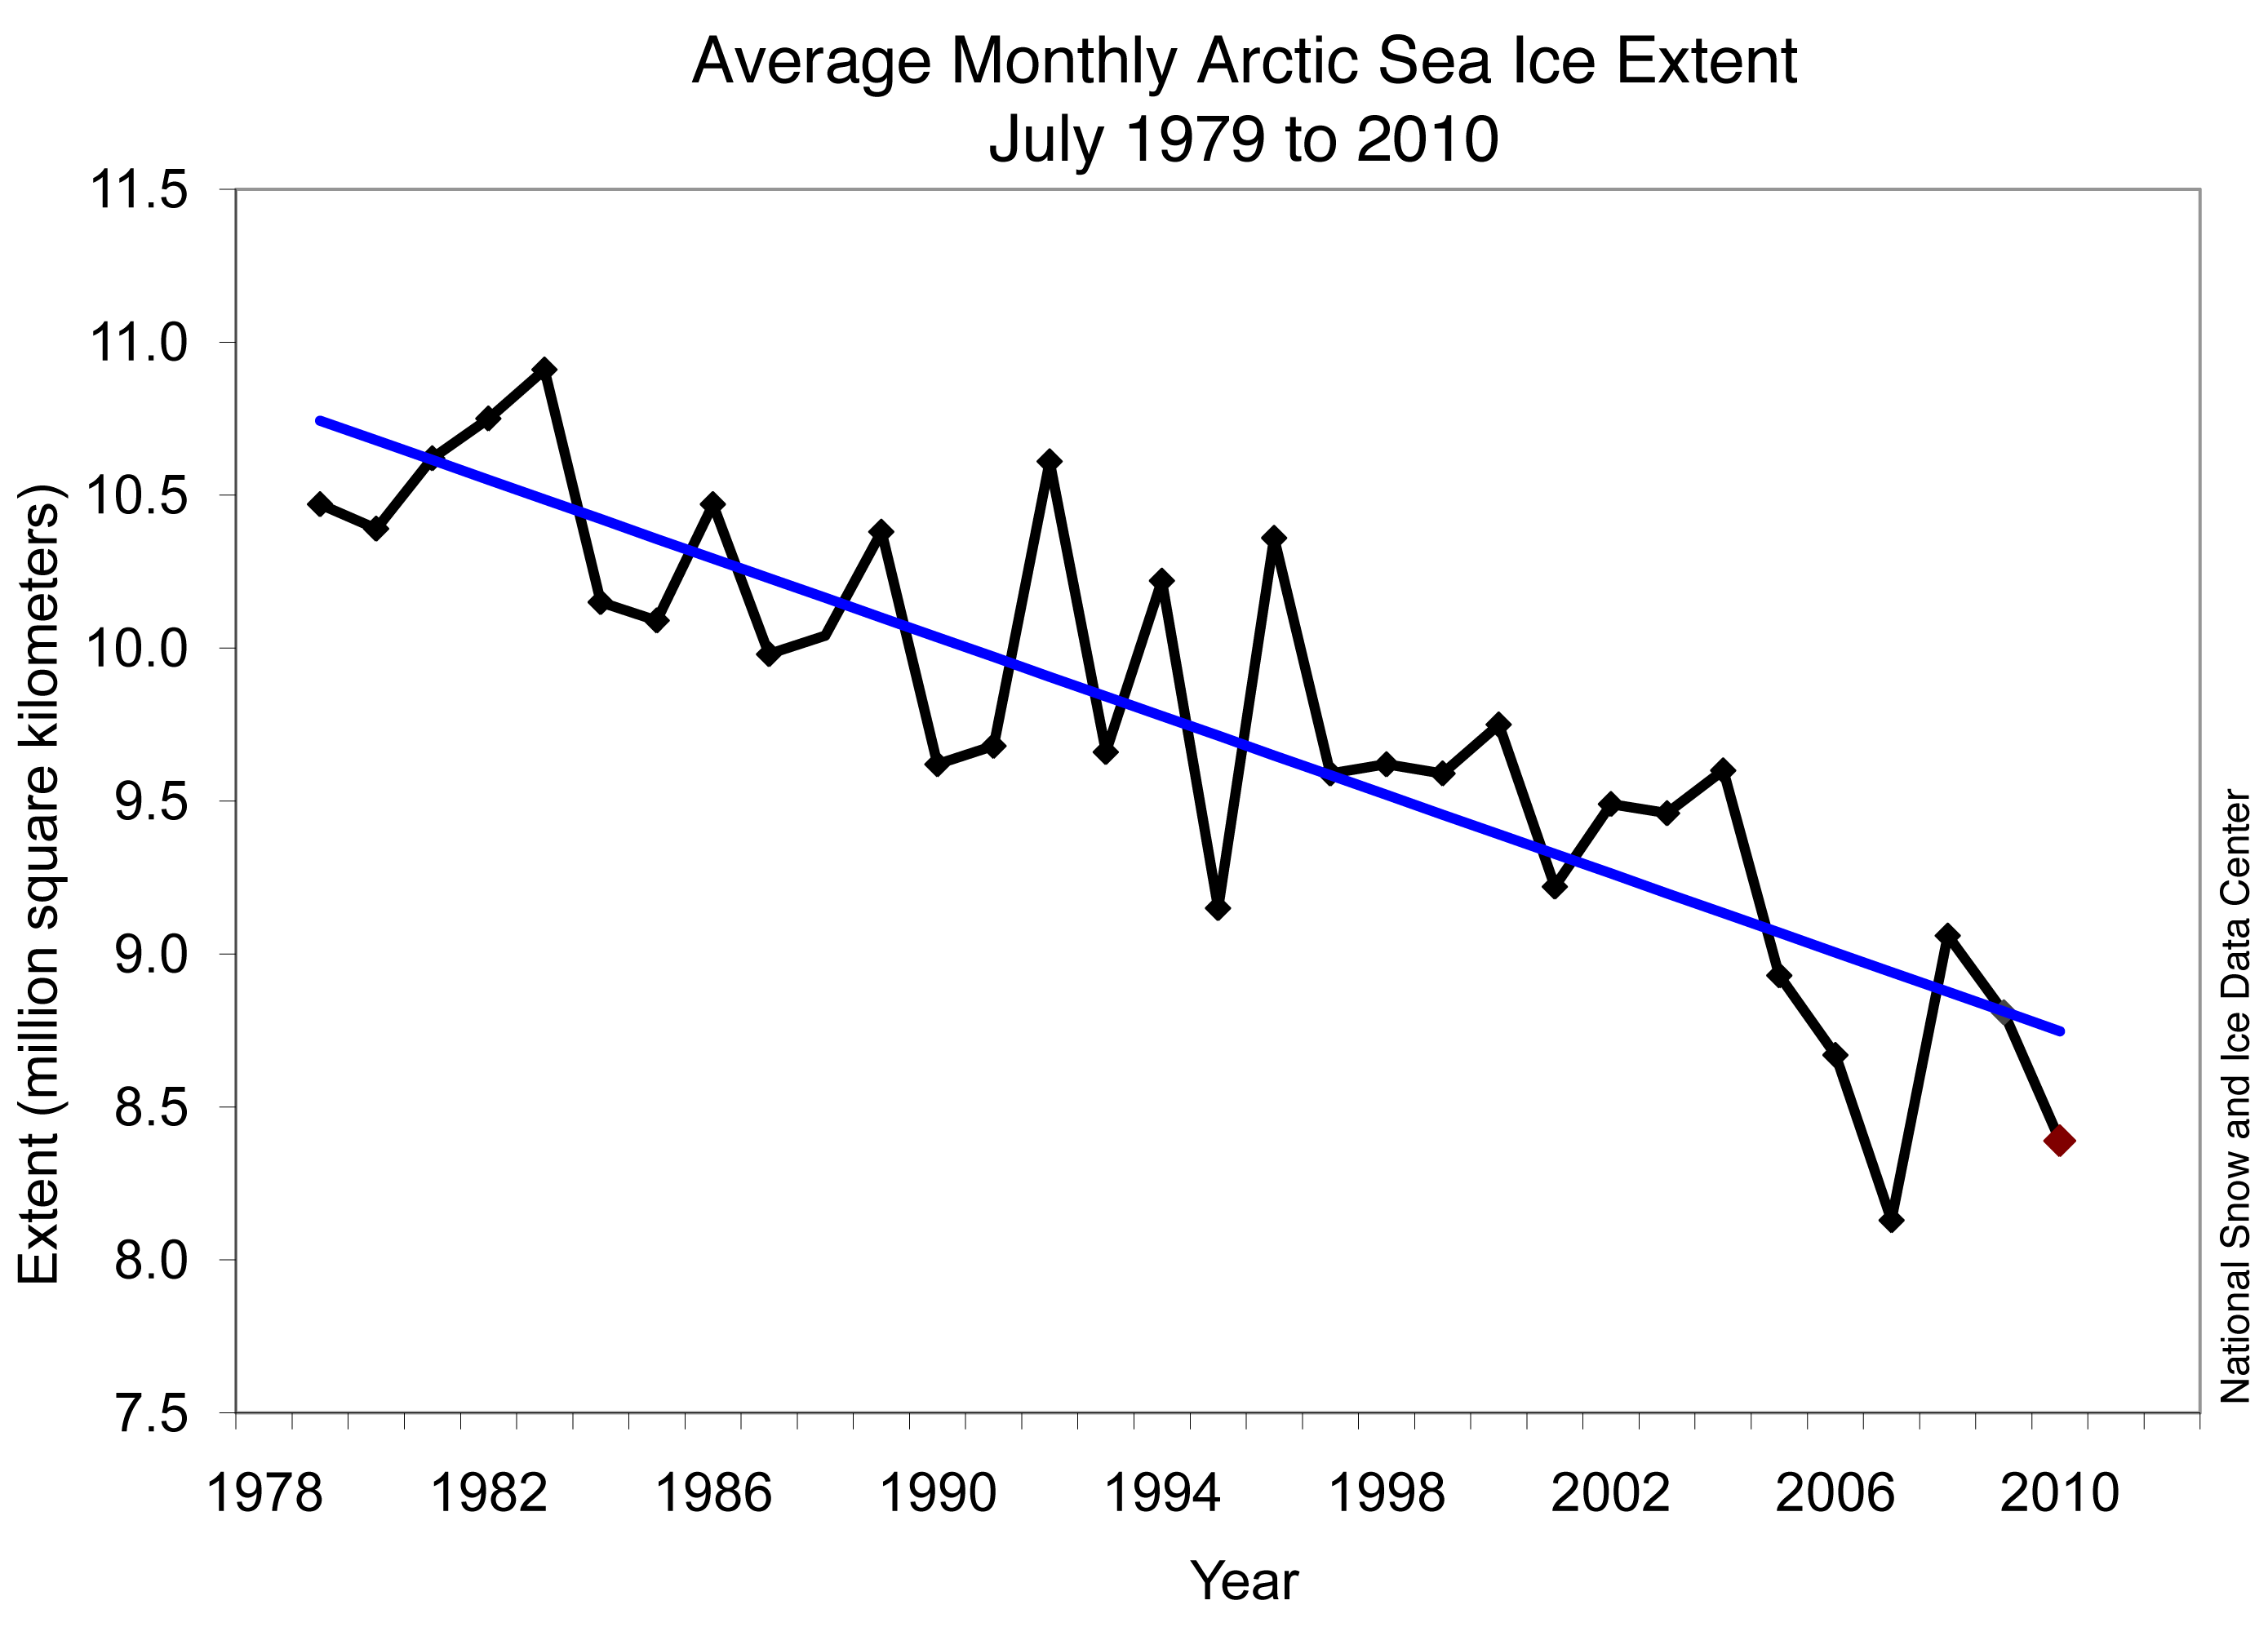
Figure 3. Monthly July ice extent for 1979 to 2010 shows a decline of 6.4% per decade. —Credit: National Snow and Ice Data Center
High-resolution image
July 2010 compared to past years
Ice extent for July 2010 was the second lowest in the satellite record for the month. The linear rate of decline of July ice extent over the period 1979 to 2010 is now 6.4% per decade.

Figure 4. This map of ice age for the end of July, 2010, shows a region of open water north of Alaska, where old, thick ice has melted out. —Credit: NSIDC courtesy J. Maslanik and C. Fowler, CU Boulder
High-resolution image
Older, thicker ice melting in the southern Beaufort Sea
This past winter’s negative phase of the Arctic Oscillation transported old ice (four, five, and more years old) from an area north of the Canadian Archipelago. The ice was flushed southwards and westward into the Beaufort and Chukchi seas, as noted in our April post. Ice age data show that back in the 1970s and 1980s, old ice drifting into the Beaufort Sea would generally survive the summer melt season. However, the old, thick ice that moved into this region is now beginning to melt out, which could further deplete the Arctic’s remaining store of old, thick ice. The loss of thick ice has been implicated as a major cause of the very low September sea ice minima observed in recent years.
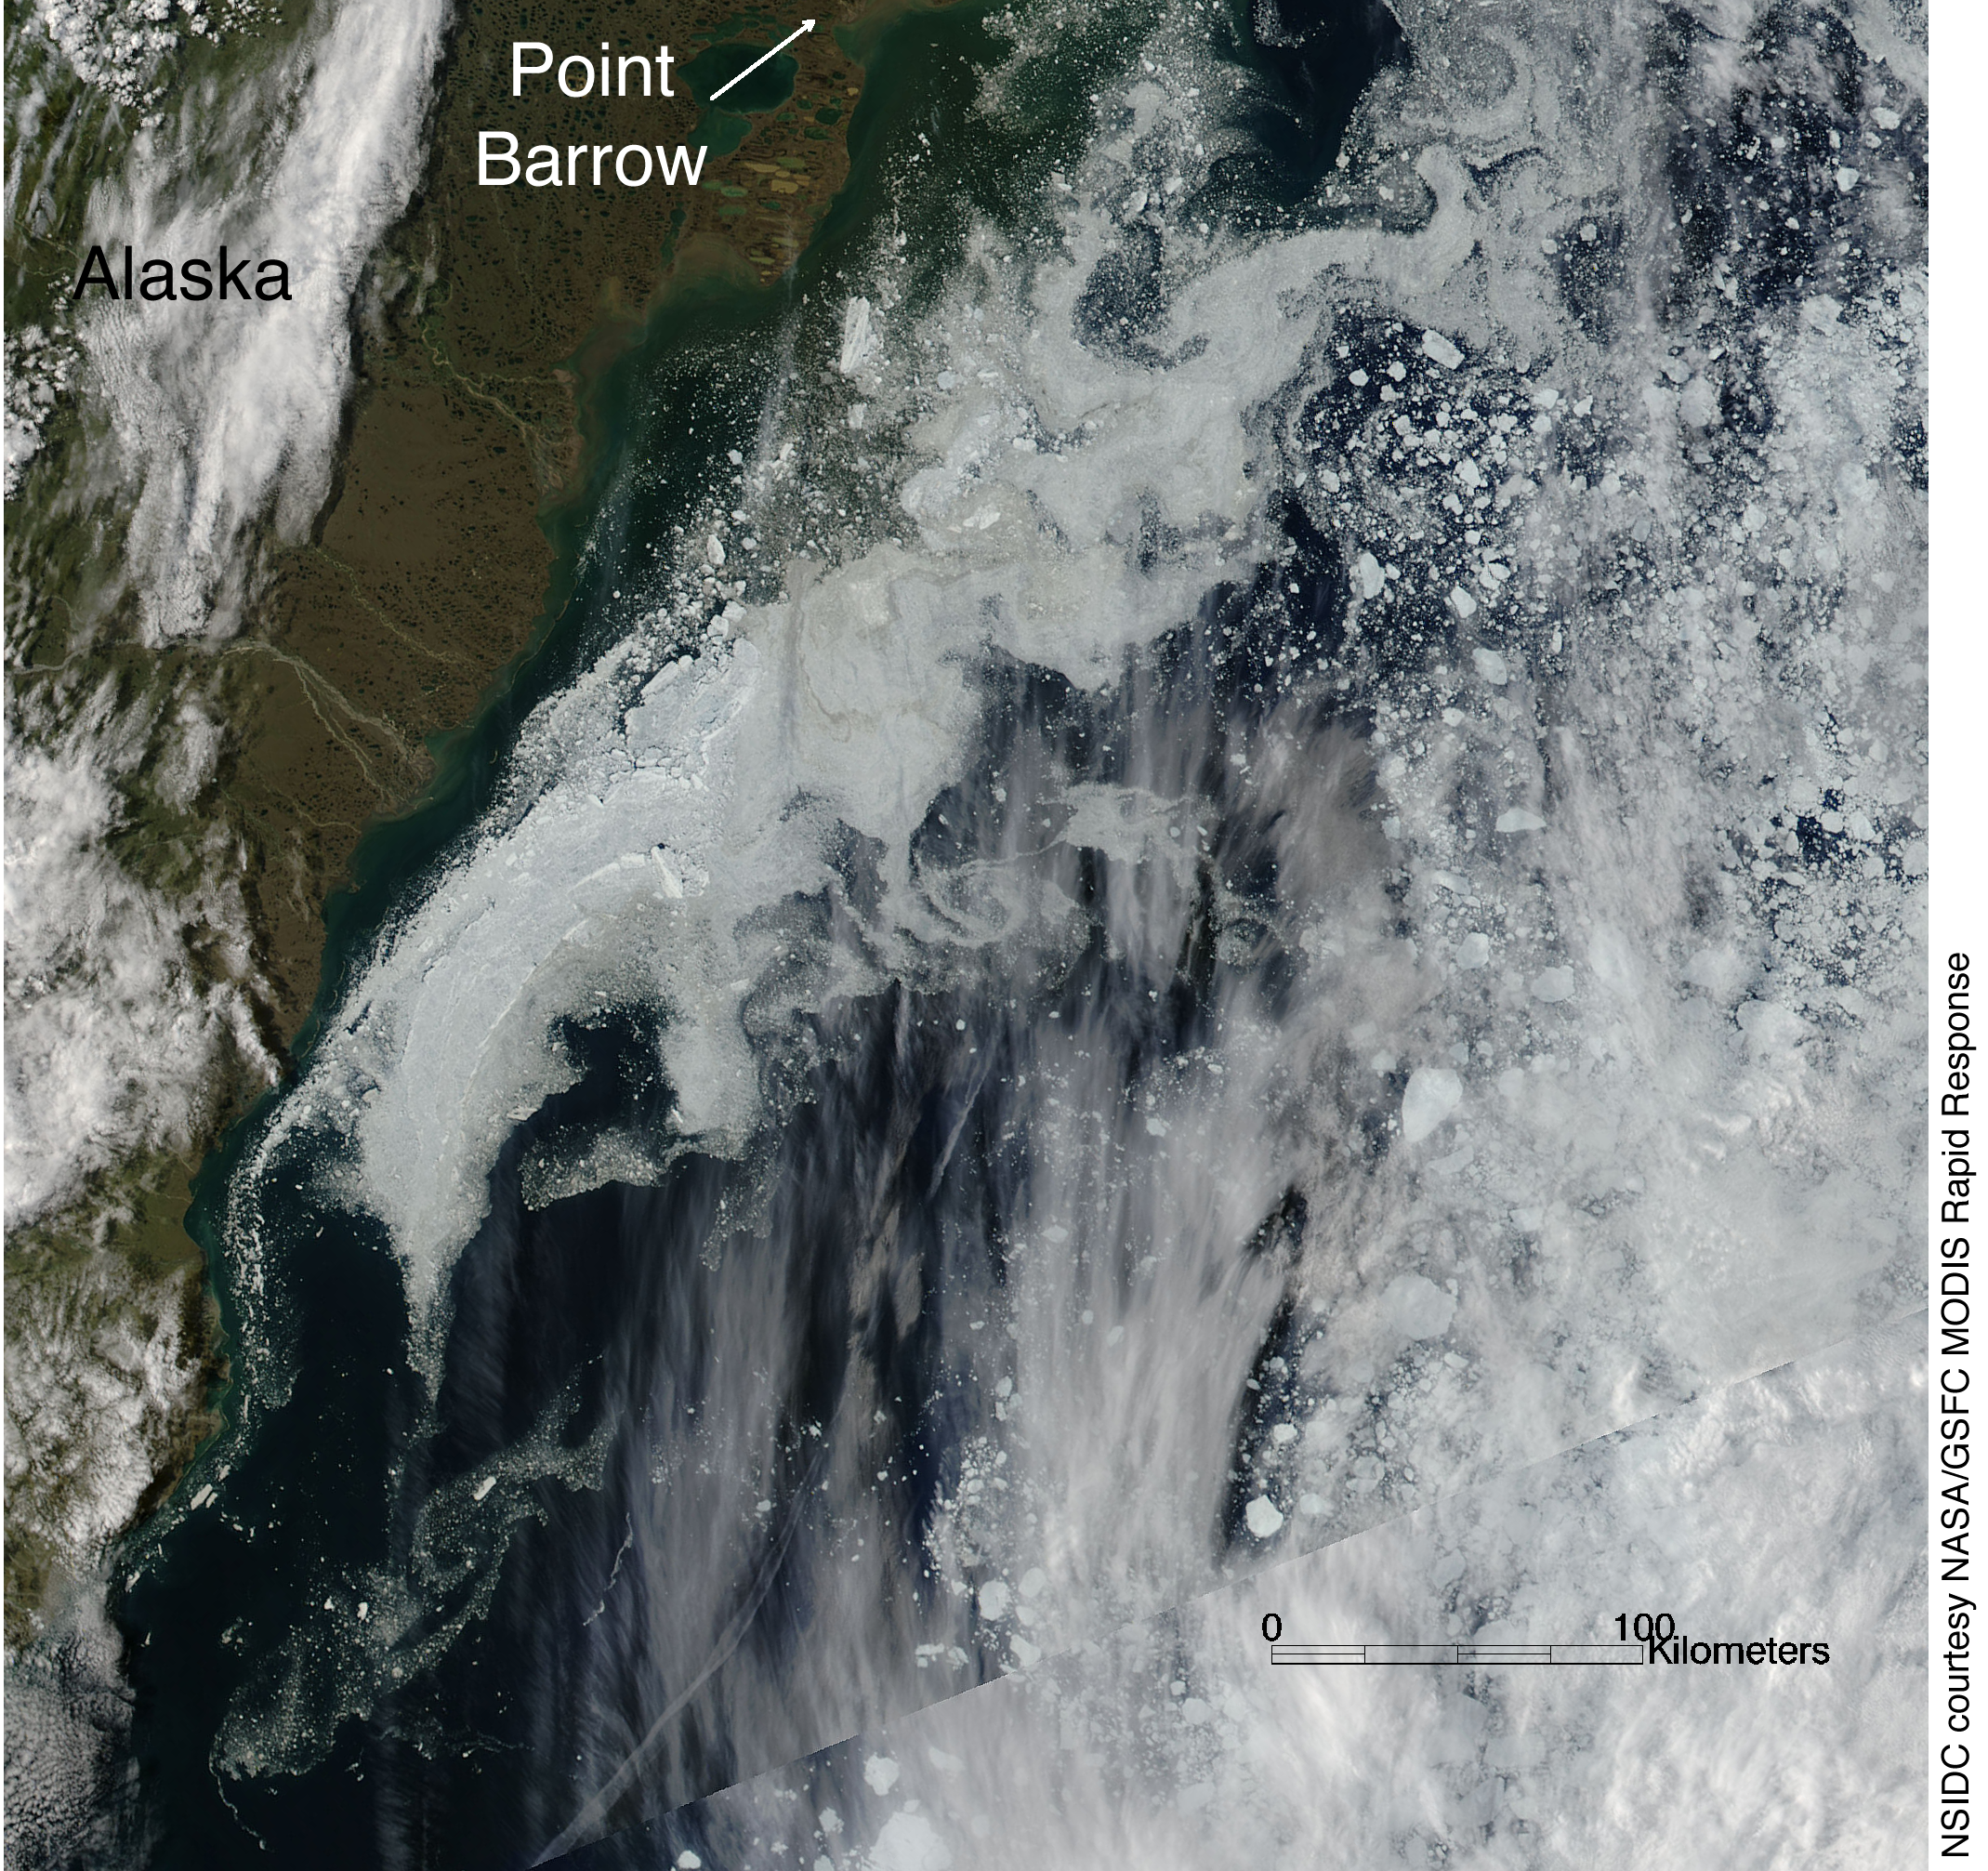
Figure 5. This image from NASA’s MODIS sensor on the Aqua satellite on July 25, 2010 shows an individual floe of old ice, which broke away from the main ice pack and is melting away.—Credit: National Snow and Ice Data Center courtesy NASA/GSFC MODIS Rapid Response
High-resolution image
High-resolution images from MODIS
High-resolution (250-meter) visible imagery from the NASA Moderate Resolution Imaging Spectroradiometer (MODIS) sensor vividly shows the loss of the old, thick ice. A region of mostly old ice has become separated from the main pack along the north coast of Alaska, east of Point Barrow, where it has begun to melt in the warm shallow shelf waters. While cloud cover obscures some areas, it is clear that the old ice floe has broken up into many smaller floes. Whether this old ice will completely melt out by the end of summer will depend to some extent on weather conditions. However, smaller floes melt more easily than consolidated ice. This behavior is becoming more typical of the ice pack as the ice thins.
Further Reading
The Study of Environmental Change has released their September Sea Ice Outlook: July Report.
For previous analyses, please see the drop-down menu under Archives in the right navigation at the top of this page.

