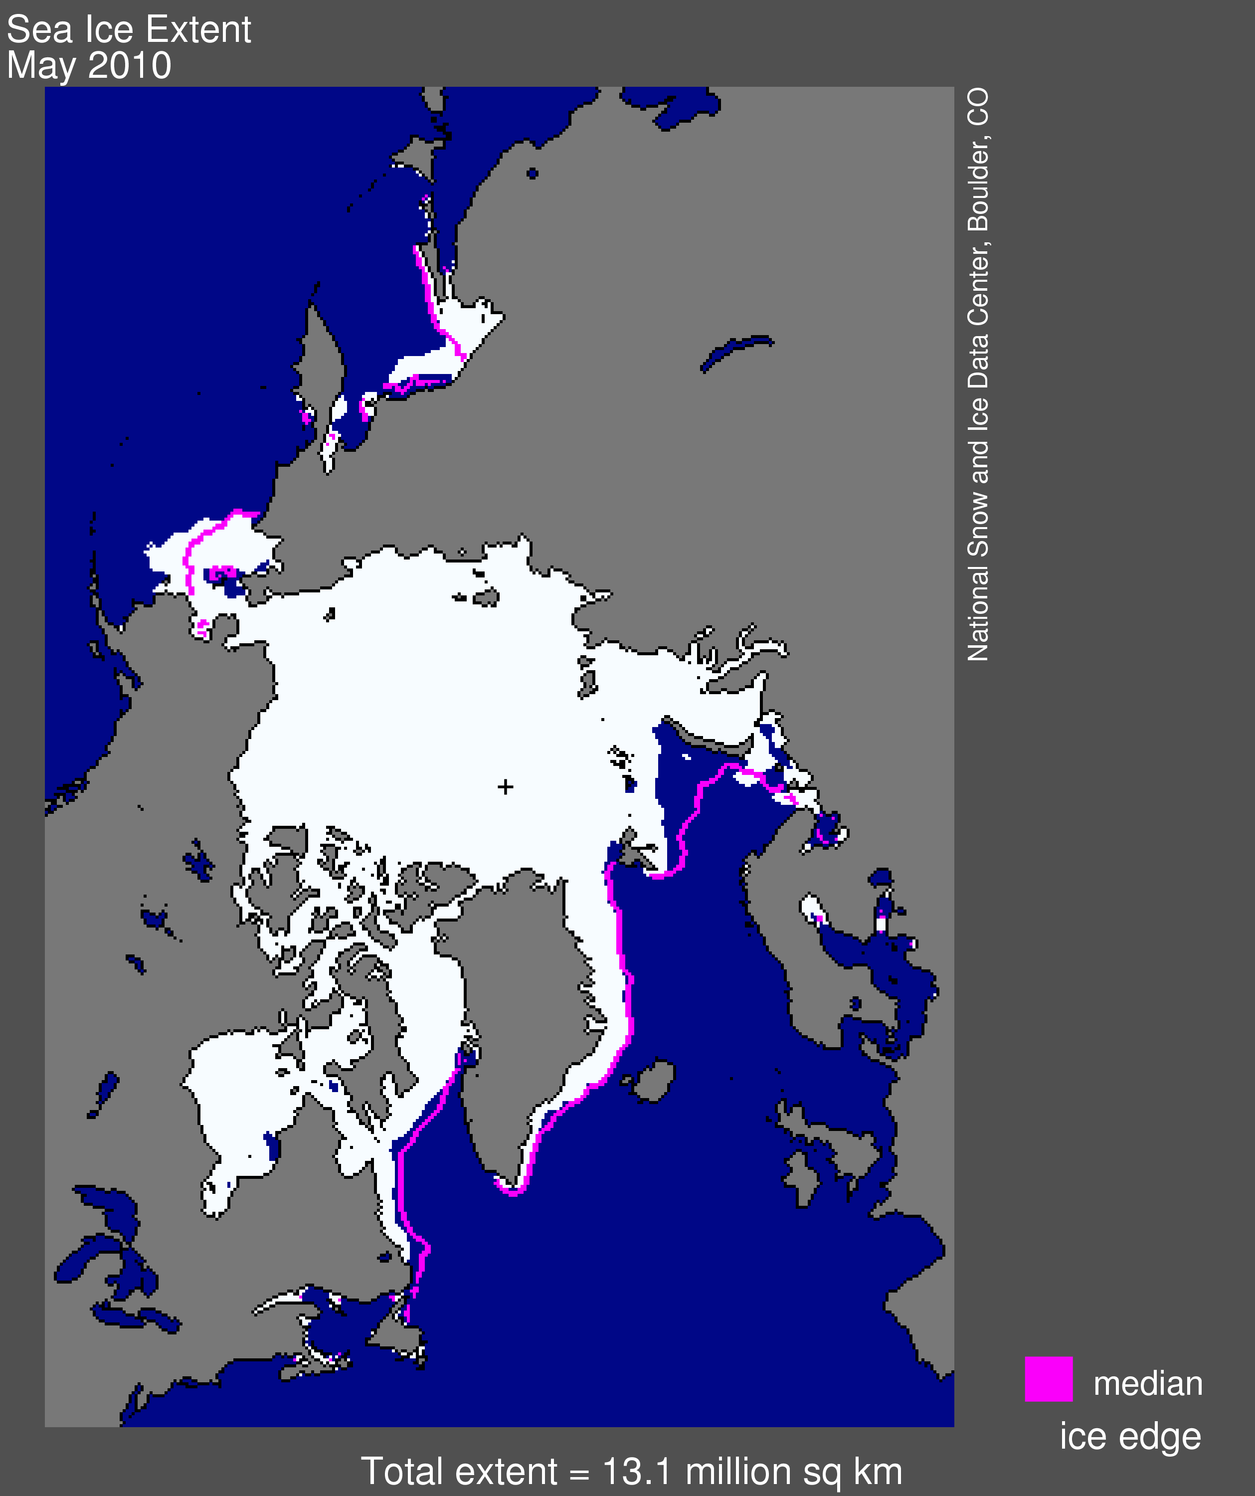
 Figure 1. Arctic sea ice extent for May 2010 was 13.10 million square kilometers (5.06 million square miles). The magenta line shows the 1979 to 2000 median extent for that month. The black cross indicates the geographic North Pole. Sea Ice Index data. About the data. —Credit: National Snow and Ice Data Center
High-resolution image
Overview of conditions
Arctic sea ice extent averaged 13.10 million square kilometers (5.06 million square miles) for the month of May, 500,000 square kilometers (193,000 square miles) below the 1979 to 2000 average. The rate of ice extent decline for the month was -68,000 kilometers (-26,000 square miles) per day, almost 50% more than the average rate of -46,000 kilometers (18,000 square miles) per day. This rate of loss is the highest for the month of May during the satellite record.
Ice extent remained slightly above average in the Bering Sea, and below average in the Barents Sea north of Scandinavia, and in Baffin Bay.
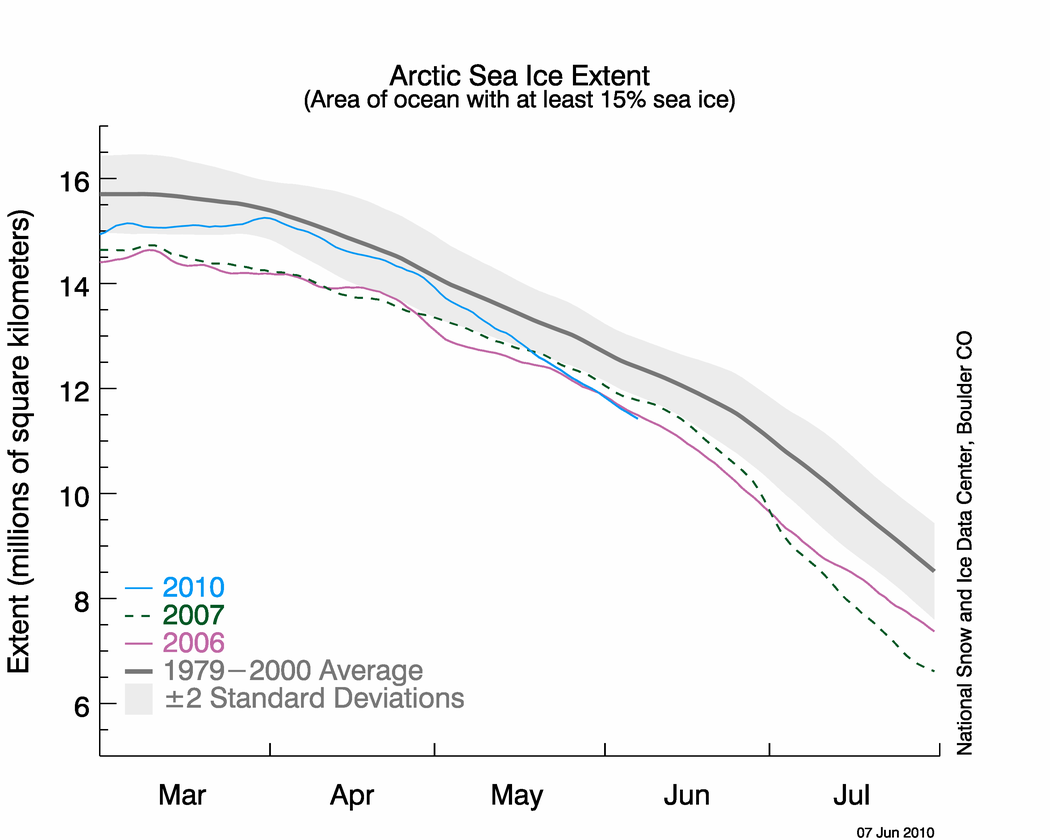 Figure 2. The graph above shows daily sea ice extent as of June 7, 2010. The solid light blue line indicates 2010; dashed green shows 2007; solid pink shows 2006, and solid gray indicates average extent from 1979 to 2000. The gray area around the average line shows the two standard deviation range of the data. Sea Ice Index data.—Credit: National Snow and Ice Data Center
High-resolution image
Conditions in context
As we noted in our May post, several regions of the Arctic experienced a late-season spurt in ice growth. As a result, ice extent reached its seasonal maximum much later than average, and in turn the melt season began almost a month later than average. As ice began to decline in April, the rate was close to the average for that time of year.
In sharp contrast, ice extent declined rapidly during the month of May. Much of the ice loss occurred in the Bering Sea and the Sea of Okhotsk, indicating that the ice in these areas was thin and susceptible to melt. Many polynyas, areas of open water in the ice pack, opened up in the regions north of Alaska, in the Canadian Arctic Islands, and in the Kara and Barents and Laptev seas.
The polynyas are clearly visible in high-resolution passive microwave images from the Advanced Microwave Sounding Radiometer (AMSR-E) aboard NASA’s Aqua satellite. What do current ice conditions mean for the minimum ice extent this fall? It is still too soon to say: although ice extent at present is relatively low, the amount of ice that survives the summer melt season will be largely determined by the wind and weather conditions over the next few months.
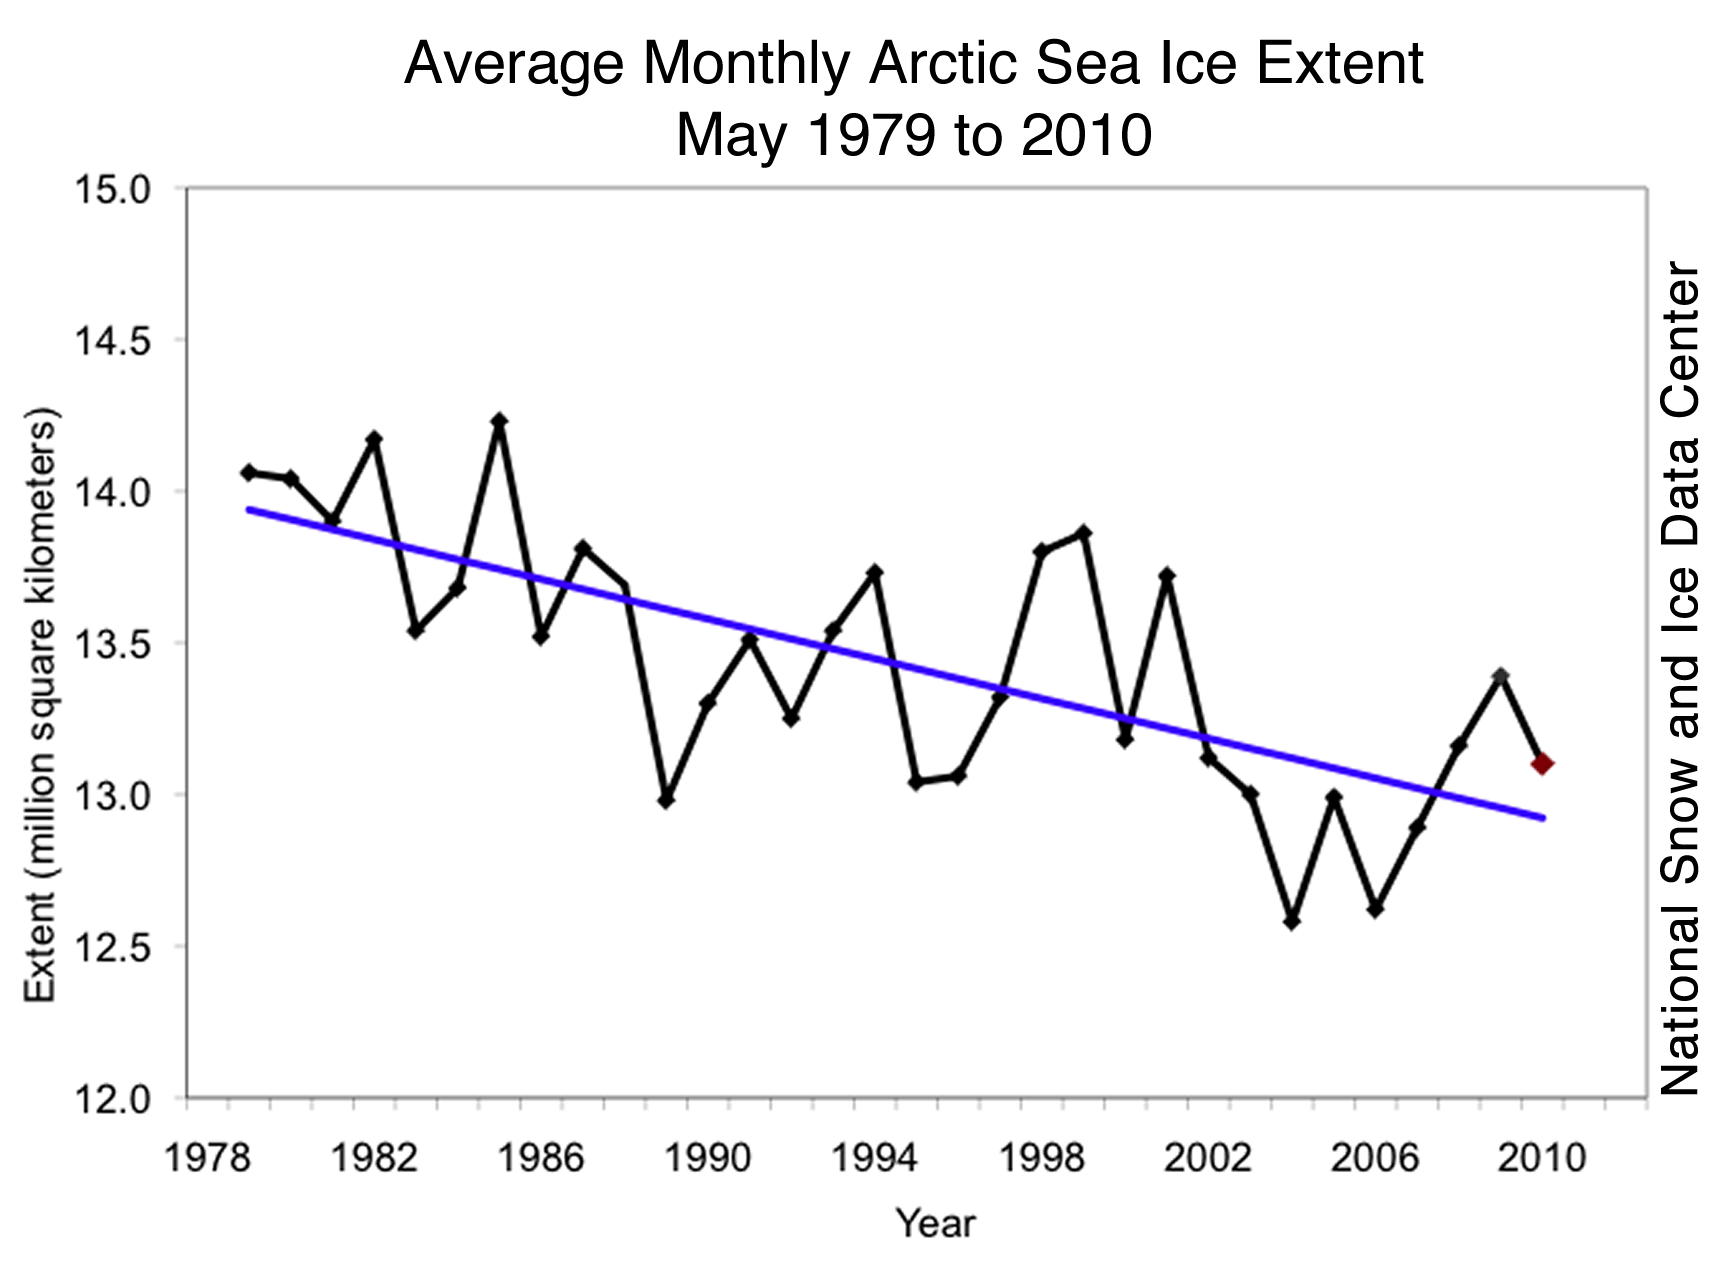
Figure 3. Monthly May ice extent for 1979 to 2010 shows a decline of 2.4% per decade. —Credit: National Snow and Ice Data Center
High-resolution image
May 2010 compared to past years
Average ice extent for May 2010 was 480,000 square kilometers (185,000 square miles) greater than the record low for May, observed in 2006, and 500,000 square kilometers (193,000 square miles) below the average extent for the month. The linear rate of decline for May over the 1979 to 2010 period is now -2.41% per decade.
The rate of decline through the month of May was the fastest in the satellite record; the previous year with the fastest daily rate of decline in May was 1980. By the end of the month, extent fell near the level recorded in 2006, the lowest in the satellite record for the end of May. Despite the rapid decline through May, average ice extent for the month was only the ninth lowest in the satellite record.
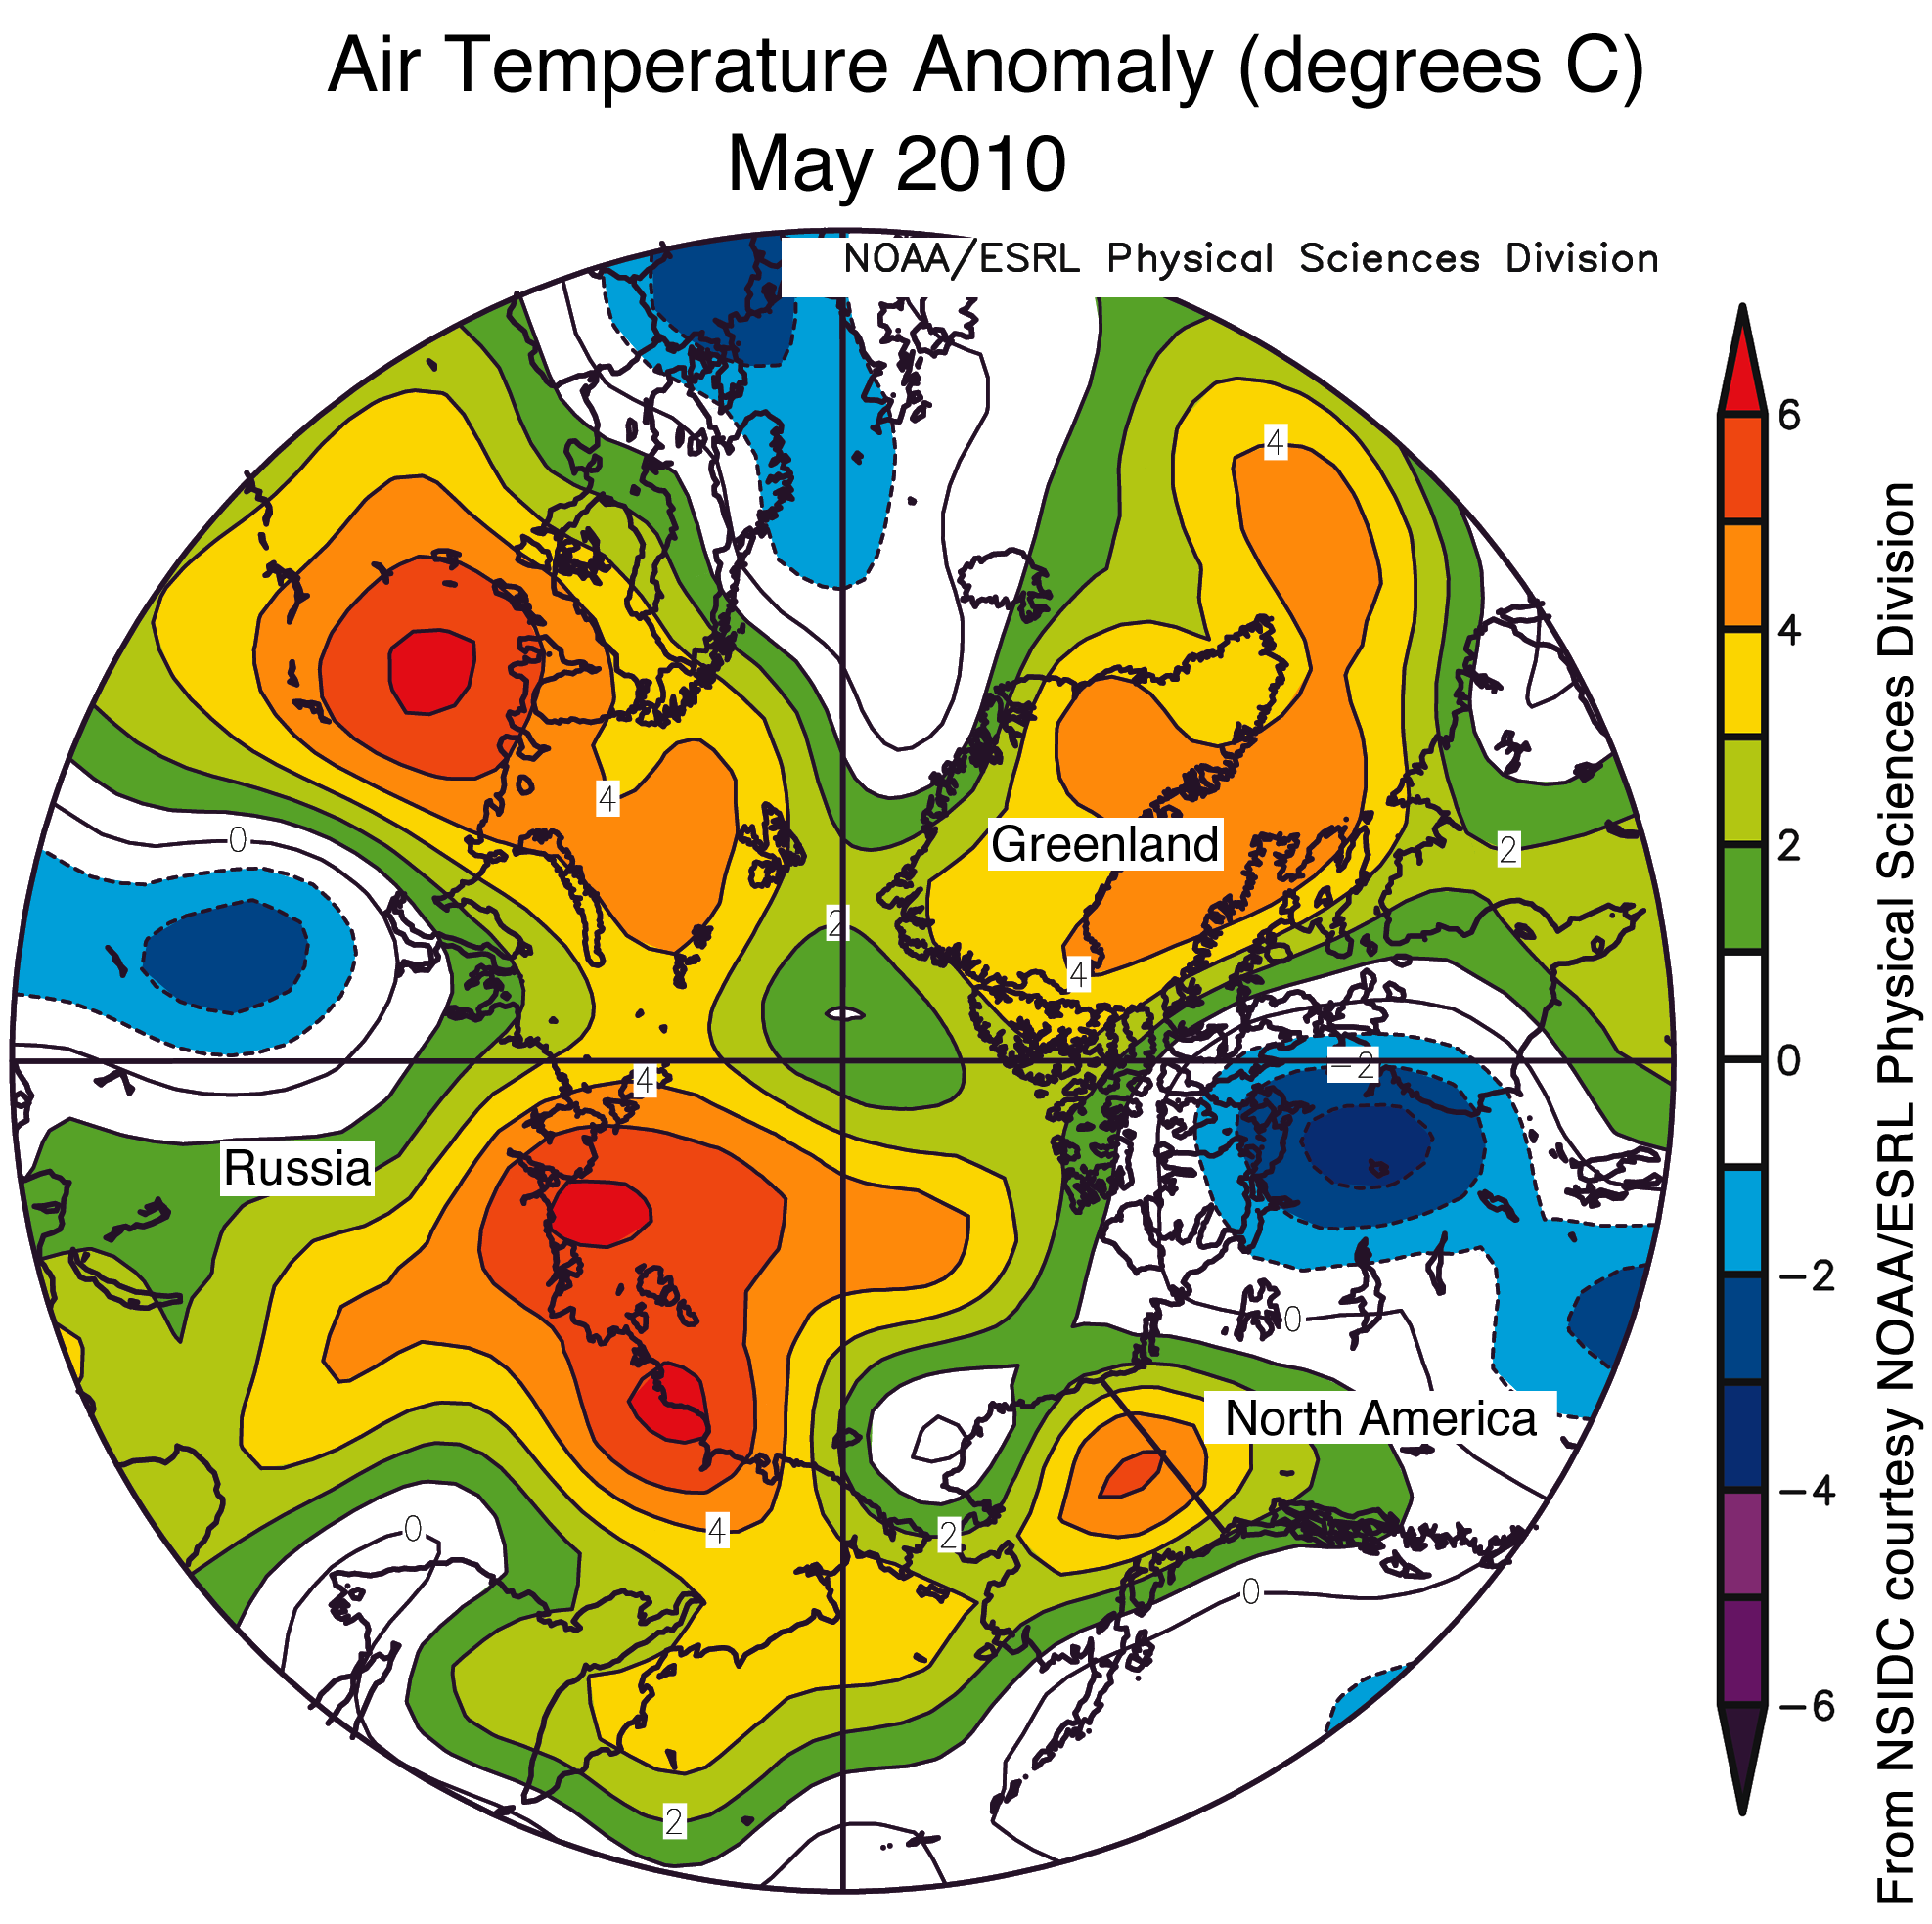
Figure 4. This map of air temperature anomalies for May 2010, at the 925 millibar level (roughly 1,000 meters or 3,000 feet above the surface), shows warmer-than-usual conditions over much of the Arctic Ocean, especially along coastal Siberia. Areas in orange and red correspond to positive (warm) anomalies. Areas in blue and purple correspond to negative (cool) anomalies. —Credit: National Snow and Ice Data Center courtesy NOAA/ESRL Physical Sciences Division
High-resolution image
Persistent warmth in the Arctic
Arctic air temperatures averaged for May were above normal, continuing the temperature trend that has persisted since last winter. Temperatures were 2 to 5 degrees Celsius (4 to 9 degrees Fahrenheit) above average across much of the Arctic Ocean. A strong anticyclone centered over the Beaufort Sea produced southerly winds along the shores of Siberia (in the Laptev and East Siberian seas), resulting in warmer-than-average temperatures in this area. The Canadian Arctic Islands were an exception to the general trend, with temperatures slightly cooler than average over much of the region.
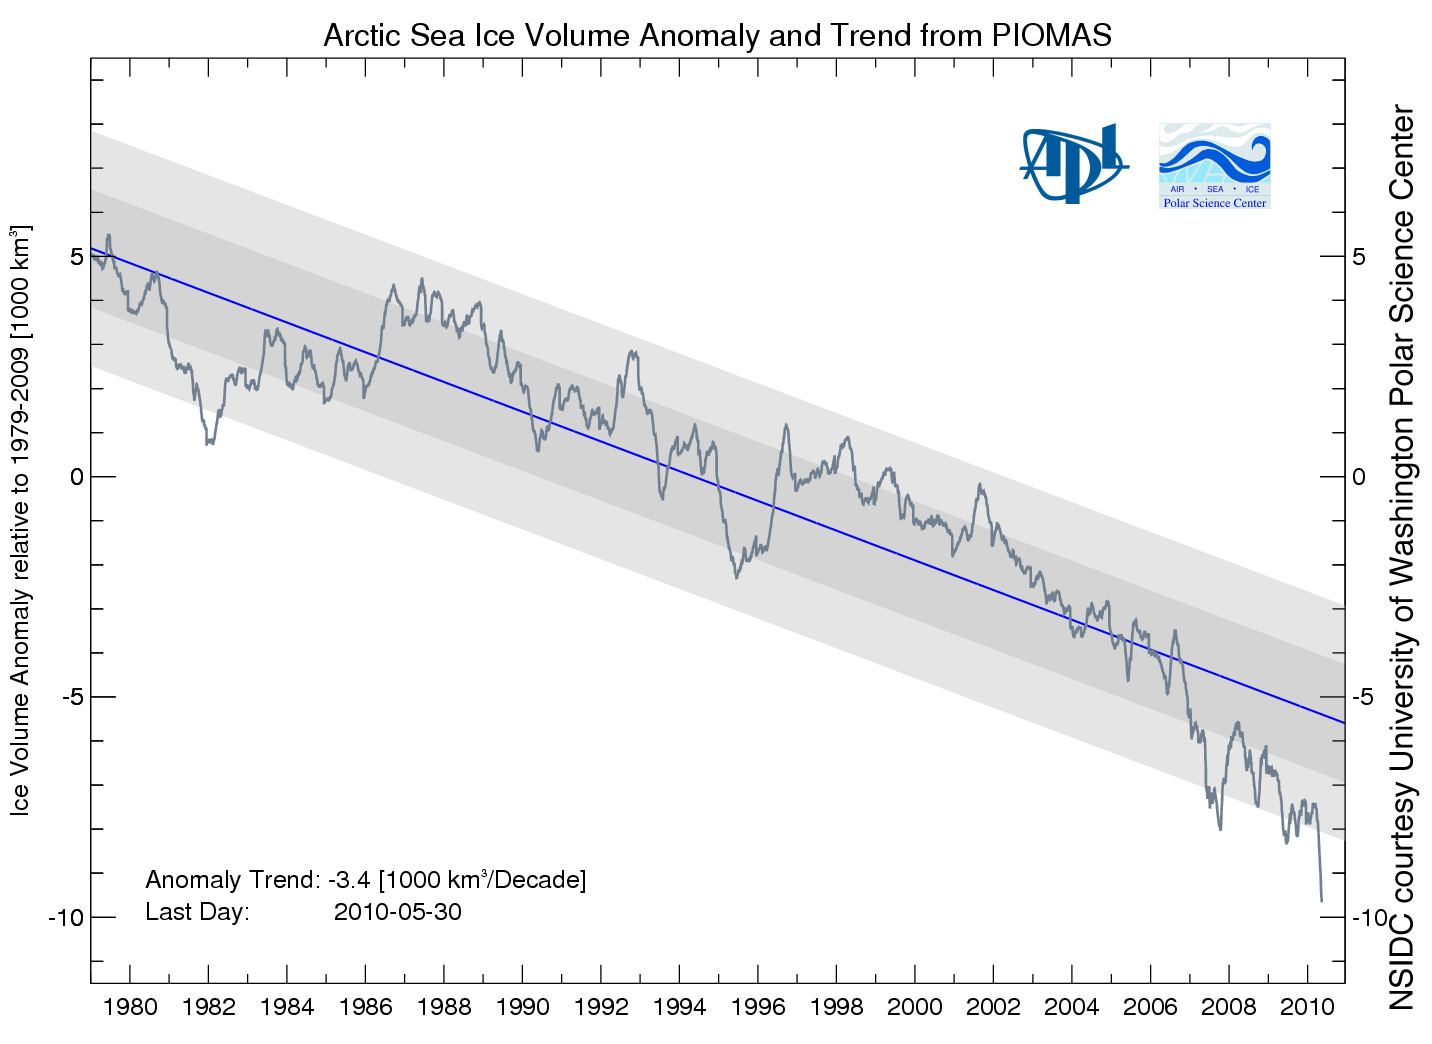
Figure 5. The chart above, from the University of Washington Pan-Arctic Ice Ocean Modeling and Assimilation System, shows anomalies in ice volume by month. Ice volume is expressed in units of 1000 cubic kilometers (240 cubic miles), and is computed relative to averages for the period 1979 to 2009. —Credit: National Snow and Ice Data Center courtesy University of Washington
High-resolution image
Models indicate low ice volume
Ice extent measurements provide a long-term view of the state of Arctic sea ice, but they only show the ice surface. Total ice volume is critical to the complete picture of sea ice decline. Numerous studies indicate that sea ice thickness and volume have declined along with ice extent; unfortunately, there are no continuous, Arctic-wide measurements of sea ice volume. To fill that gap, scientists at the University of Washington have developed regularly updated estimates of ice volume, using a model called the Pan Arctic Ice Ocean Modeling and Assimilation System (PIOMAS).
PIOMAS uses observations and numerical models to make ongoing estimates of changes in sea ice volume. According to PIOMAS, the average Arctic sea ice volume for May 2010 was 19,000 cubic kilometers (4,600 cubic miles), the lowest May volume over the 1979 to 2010 period. May 2010 volume was 42% below the 1979 maximum, and 32% below the 1979 to 2009 May average. The May 2010 ice volume is also 2.5 standard deviations below the 1979 to 2010 linear trend for May (–3,400 cubic kilometers, or -816 cubic miles, per decade).
PIOMAS blends satellite-observed sea ice concentrations into model calculations to estimate sea ice thickness and volume. Comparison with submarine, mooring, and satellite observations help increase the confidence of the model results. More information on the validation methods and results is available on the PIOMAS ice volume Web site.
Further Reading
The SEARCH Sea Ice Outlook, an international, community-wide discussion of the upcoming September Arctic sea ice minimum, is slated to be published in June 2010.
Gridded ICESat data are now available from the NASA Jet Propulsion Laboratory. This data provide an estimate of sea ice thickness based on elevation measurements, from 2004 to 2008.
References
Schweiger, Axel , Jinlun Zhang, Mike Steele, et al. Pan Arctic Ice Ocean Modeling and Assimilation System (PIOMAS). http://psc.apl.washington.edu/ArcticSeaiceVolume/IceVolume.php
For previous analyses, please see the drop-down menu under Archives in the right navigation at the top of this page.

