Sign up for the  Arctic Sea Ice News RSS feed for automatic notification of analysis updates. Updates are also available via Twitter.
During the first half of July, Arctic sea ice extent declined more quickly than in 2008, but not as fast as in 2007. As in recent years, melt onset was earlier than the 1979 to 2000 average. International sea ice researchers expect another low September minimum ice extent, but they do not yet know if it will fall below the 2007 record.
Note: This mid-monthly analysis update shows a single-day extent value for Figure 1, rather than the usual monthly average. While monthly average extent images are more accurate in understanding long-term changes, the daily images are helpful in monitoring sea ice conditions in near-real time.
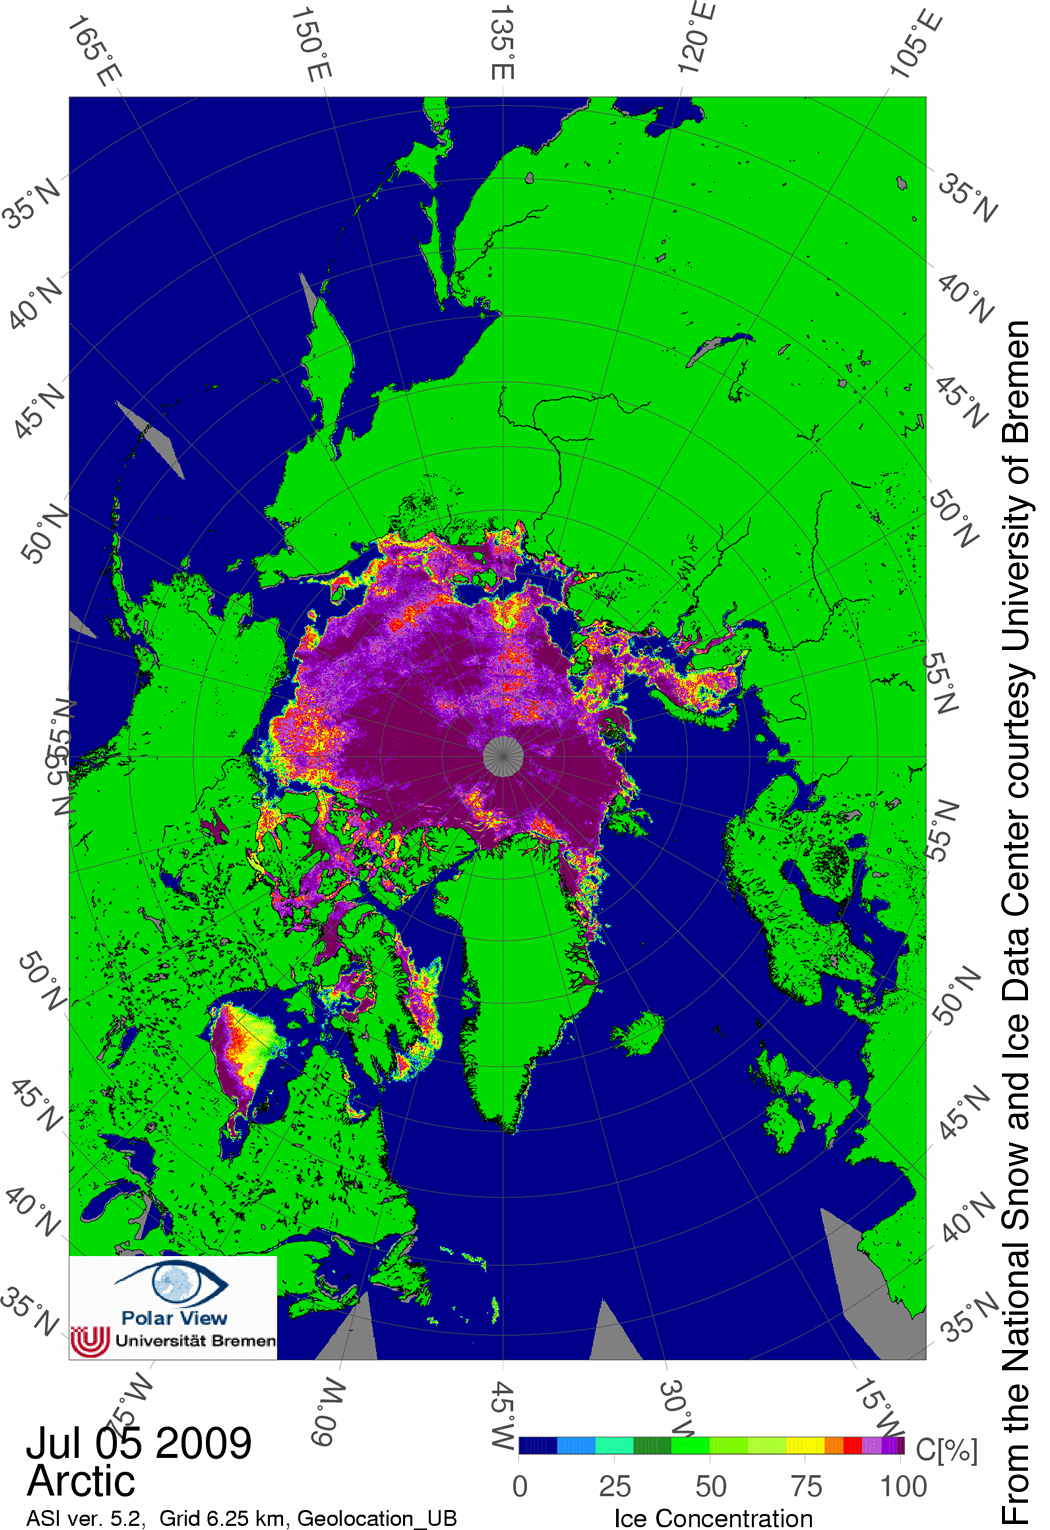
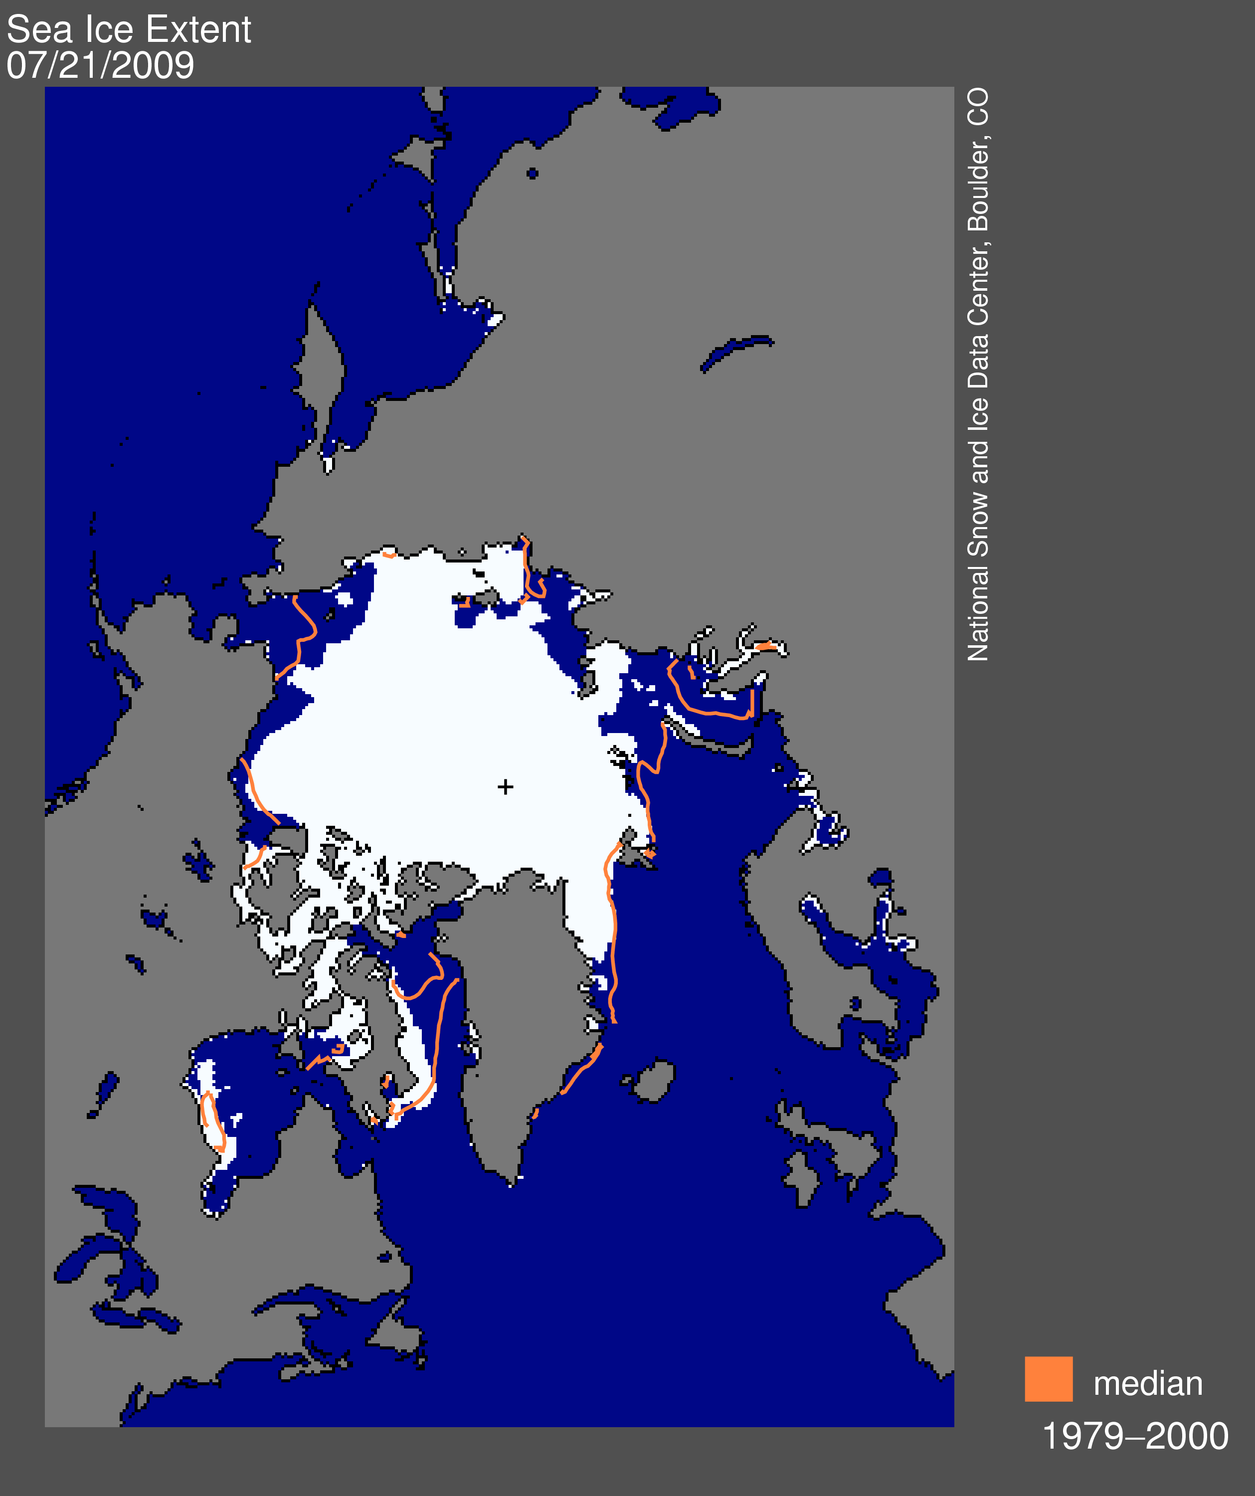 Figure 1. Daily Arctic sea ice extent on July 21 was 8.28 million square kilometers (3.20 million square miles). The orange line shows the 1979 to 2000 median extent for that day. The black cross indicates the geographic North Pole. Sea Ice Index data. About the data. —Credit: National Snow and Ice Data Center
High-resolution image
Overview of conditions
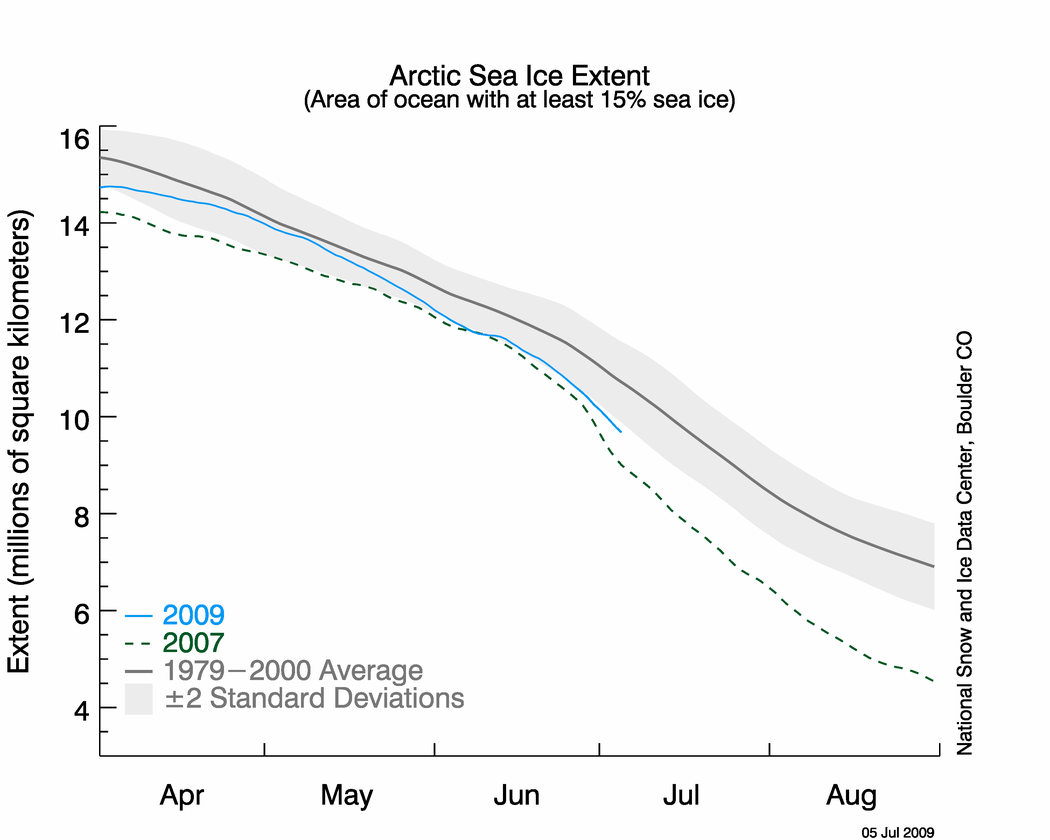
On July 21, Arctic sea ice extent was 8.28 million square kilometers (3.20 million square miles). This is 617,000 square kilometers (238,000 square miles) more ice than for the same day in 2007 and 1.36 million square kilometers (523,000 square miles) below the 1979 to 2000 average. Ice extent on July 21, 2009 remained 8.06% higher than the same day in 2007, yet was 2.44% below the same day in 2008 and 14.06% below the 1979-2000 average for that day.
 Figure 2. The graph above shows daily sea ice extent as of July 21, 2009. The solid blue line indicates 2009; the dashed green line shows 2007; the purple line shows 2008; and the solid gray line indicates average extent from 1979 to 2000. Sea Ice Index data.—Credit: National Snow and Ice Data Center
High-resolution image
Conditions in context
During the first two weeks of July (July 1 to 16), Arctic sea ice extent declined at an average rate of 97,000 square kilometers (37,000 square miles) per day. This decline was faster than in 2008, when it was 87,000 square kilometers (34,000 square miles) per day, but slower than in 2007, when ice extent declined at a rate of 111,000 square kilometers (43,000 square miles) per day .
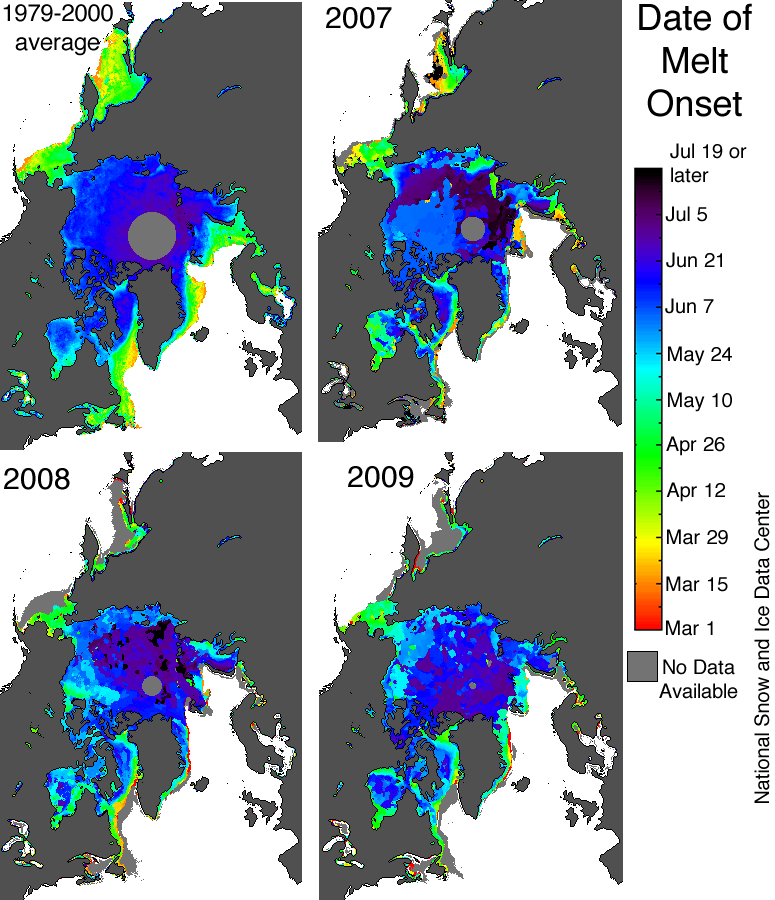
Figure 3. In recent years, sea ice melt in the Arctic Ocean has begun earlier than in the past. Colors in the map above indicate the date of melt onset; gray regions indicate areas where data is not available or not retrievable. Variations in ice type may result in some errors. Data are from the Defense Meteorological Satellite Program (DMSP) F-series satellite SSM/I and SSMIS sensors. —Credit: National Snow and Ice Data Center: Algorithm provided by Thorsten Markus, Goddard Space Flight Center
High-resolution image
Early melt onset
Early or extended melt in response to rising atmospheric temperatures appears to be one of the factors contributing to the sharp decline of summer Arctic sea ice extent. When ice melts earlier, it leads to a lower albedo surface that absorbs more of the sun’s energy and promotes further melt.
The same satellite instruments that are used to measure ice extent also provide information on when ice begins to melt each year. In recent years, Arctic sea ice melt onset has begun earlier than in the past, and 2009 continues this pattern. Compared to average conditions over the period 1979 to 2000, melt this year started a week early in the Beaufort, Chukchi and Kara seas. In some regions such as the East Greenland and the Barents seas, melt began more than two weeks earlier than usual.
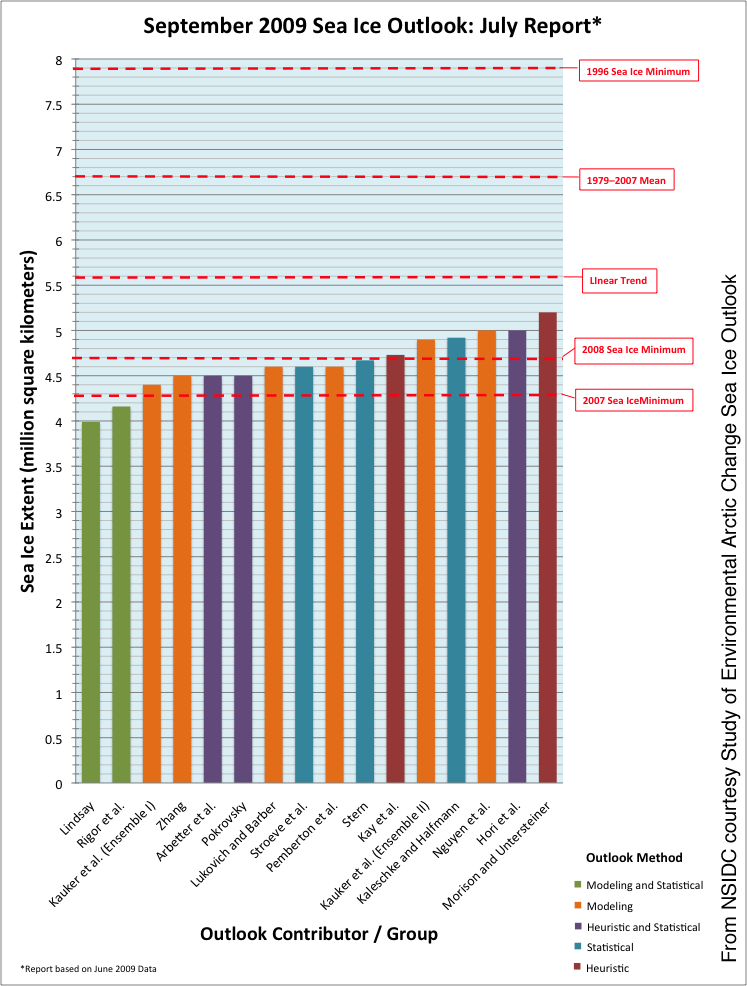
Figure 4. Scientists who contributed to the July Sea Ice Outlook report expect another low Arctic sea ice extent in September. Most of their projections fall near or between the 2007 record low and the second-lowest extent, which occurred in 2008.—Credit: From National Snow and Ice Data Center, courtesy SEARCH Sea Ice Outlook.
High-resolution image
Outlook for September
As interest in Arctic sea ice builds, national and international scientific organizations are working together to make projections of the September 2009 sea ice minimum. Their assessments are summarized in the Study of Environmental Arctic Change Sea Ice Outlook.
The researchers make projections using a variety of techniques, ranging from sophisticated sea ice models to simpler statistical analyses. Their most recent report points to another extreme September sea ice minimum in 2009, with projections for the September monthly average ranging from 4.0 to 5.2 million square kilometers (1.5 to 2.0 million square miles). However, sea ice forecasting efforts are still in their infancy, and the resulting projections should not be taken as a true forecast, but rather as a way to gain insights into the changing Arctic climate. Whether or not 2009 will break the 2007 record still depends largely on atmospheric conditions during the rest of the summer.
Smith, D. M., Observation of perennial Arctic sea ice melt and freeze-up using passive microwave data. J. Geophys. Res., 103, 27,753-27,769, 1998.
Stroeve, J. C., T. Markus and W. N. Meier (2006), Recent changes in the Arctic melt season, Annals of Glaciology, 44, 367-374
For previous analysis, please see the drop-down menu under Archives in the right navigation at the top of this page.