February ice extent low in the Barents Sea, high in the Bering Sea

As in January, sea ice extent in February was low on the Atlantic side of the Arctic, but unusually high on the Pacific side of the Arctic, remaining lower than average overall. At the end of the month, ice extent rose sharply, as winds changed and started spreading out the ice cover.

Sea ice extent in late winter can go up and down very quickly, getting pushed together or dispersed by strong winds. Ice extent usually reaches its annual maximum sometime in late February or March, but the exact date varies widely from year to year.

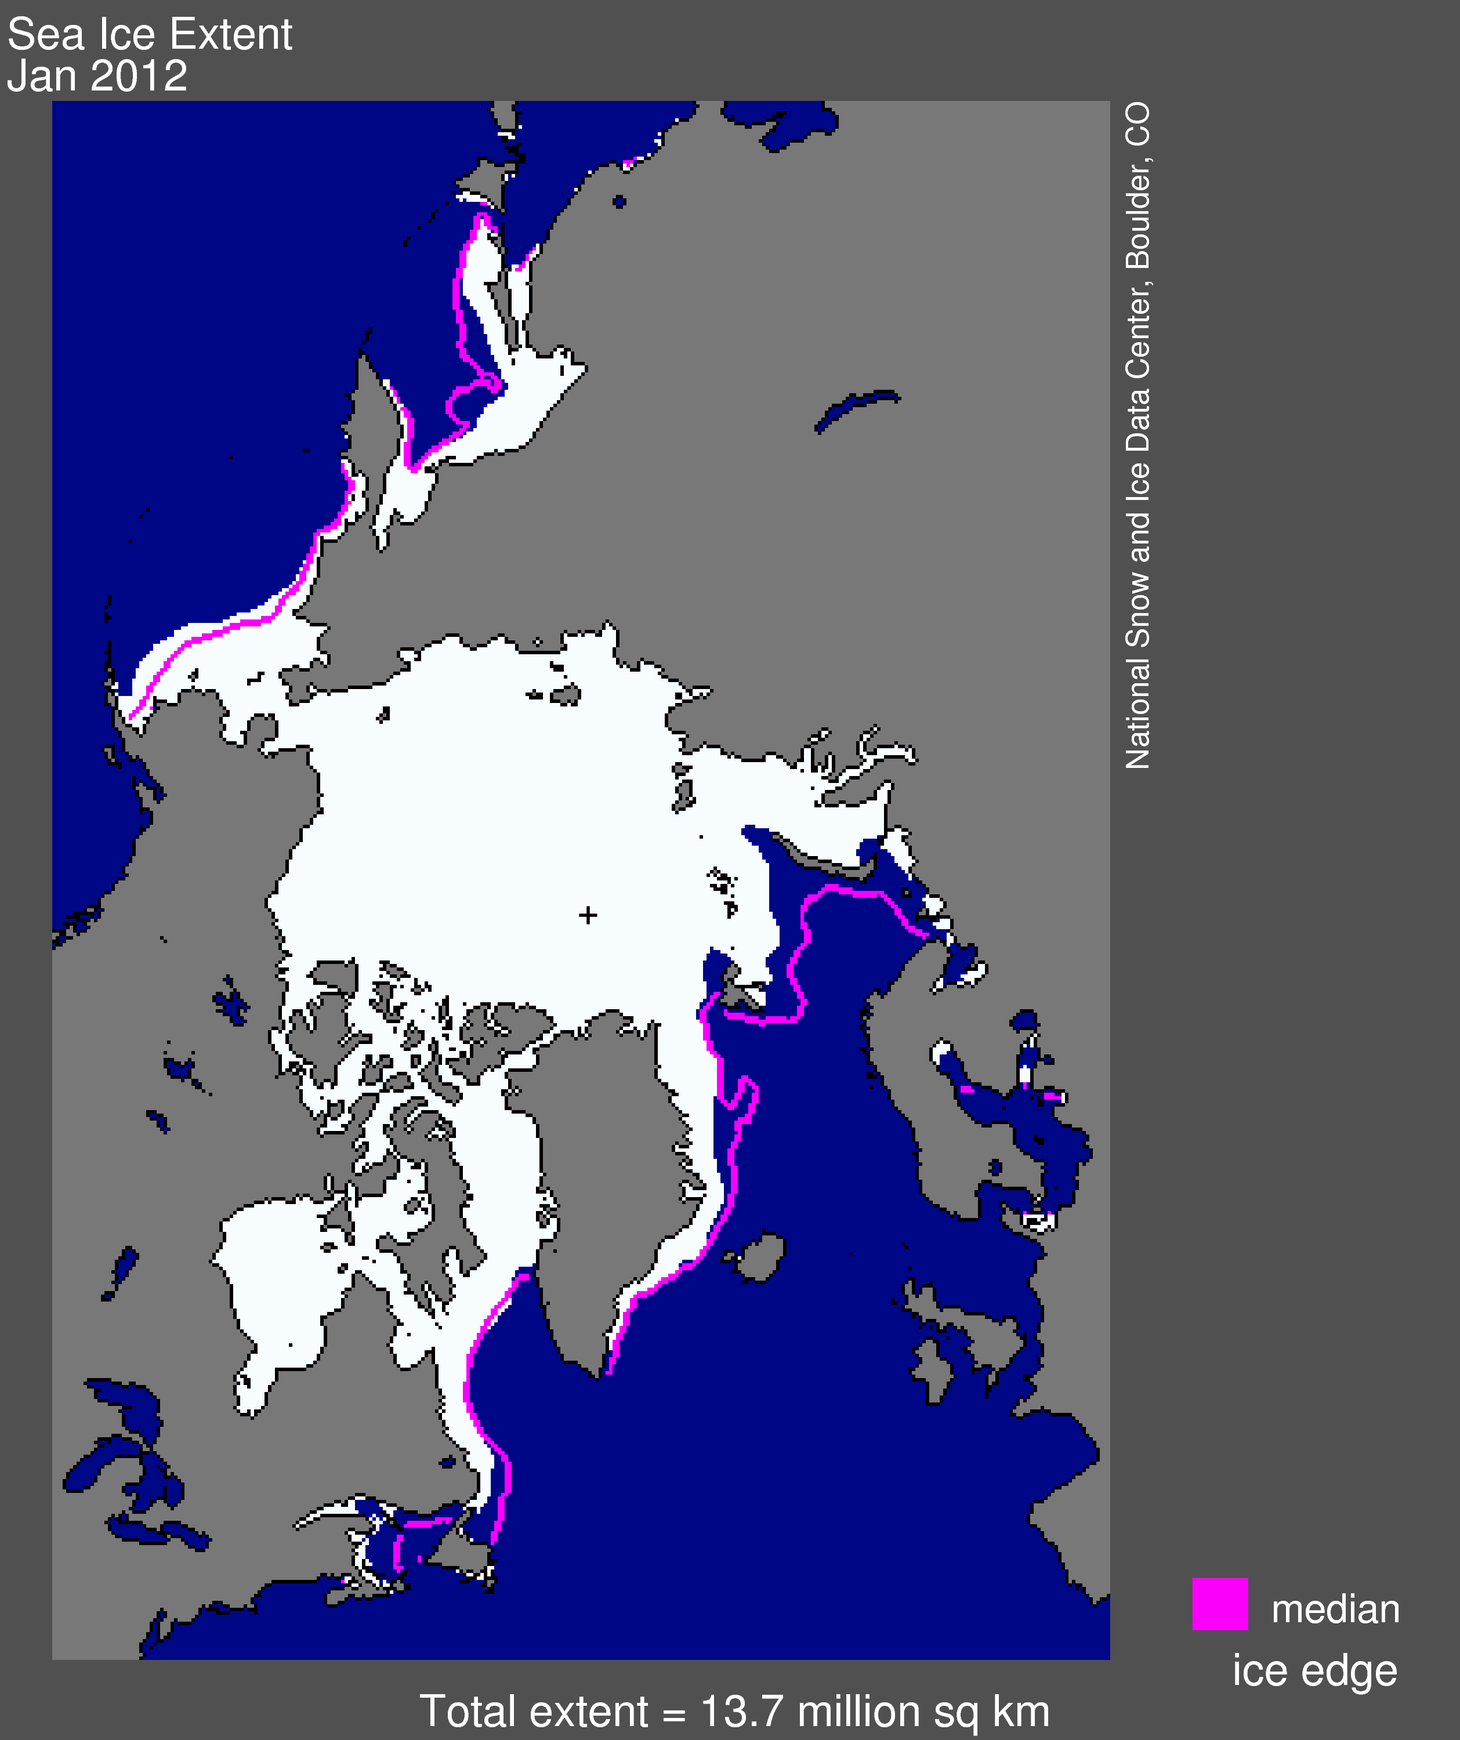
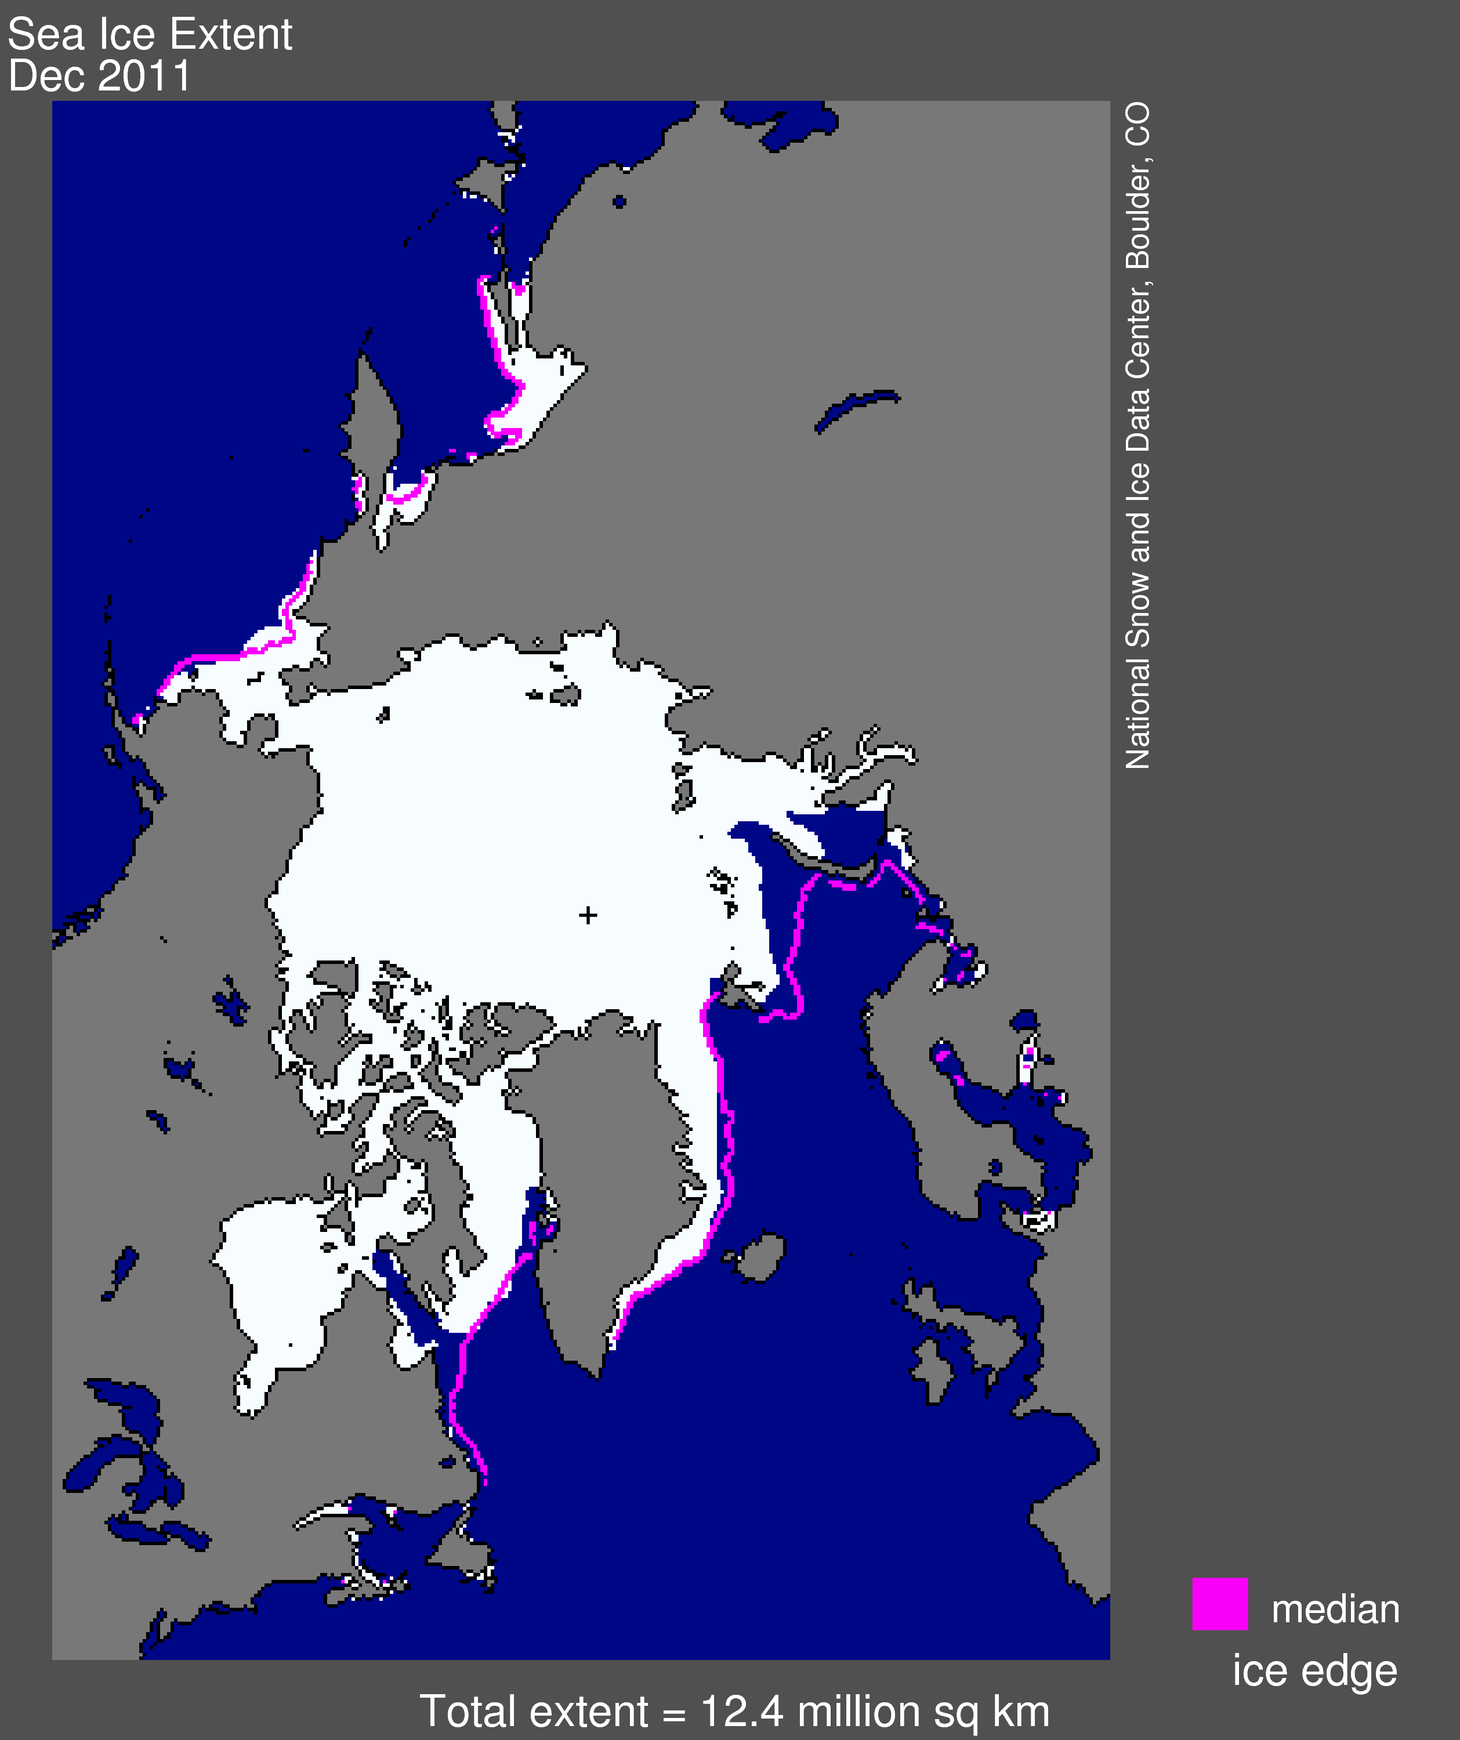
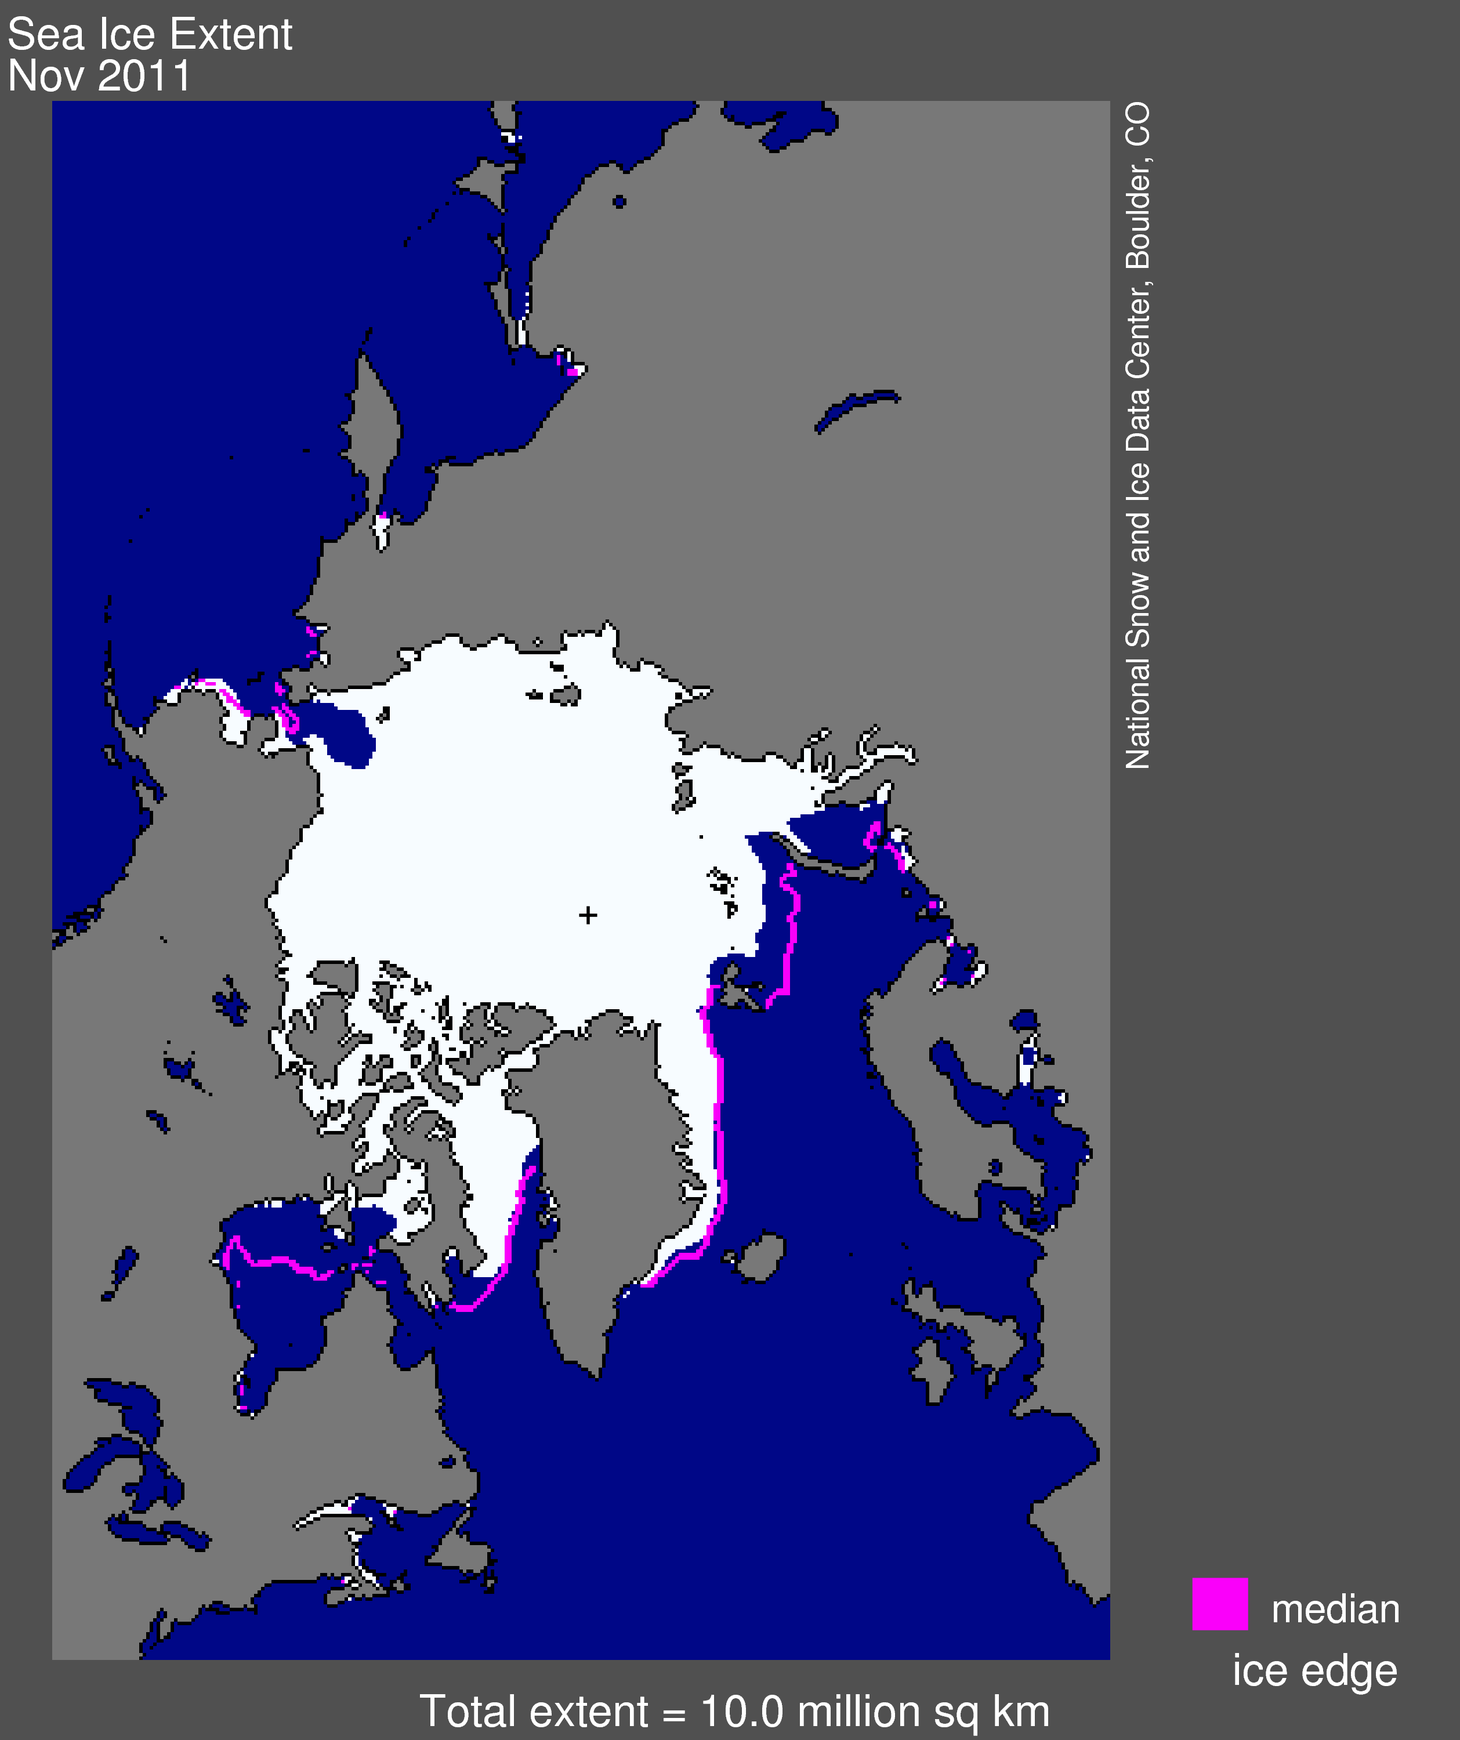
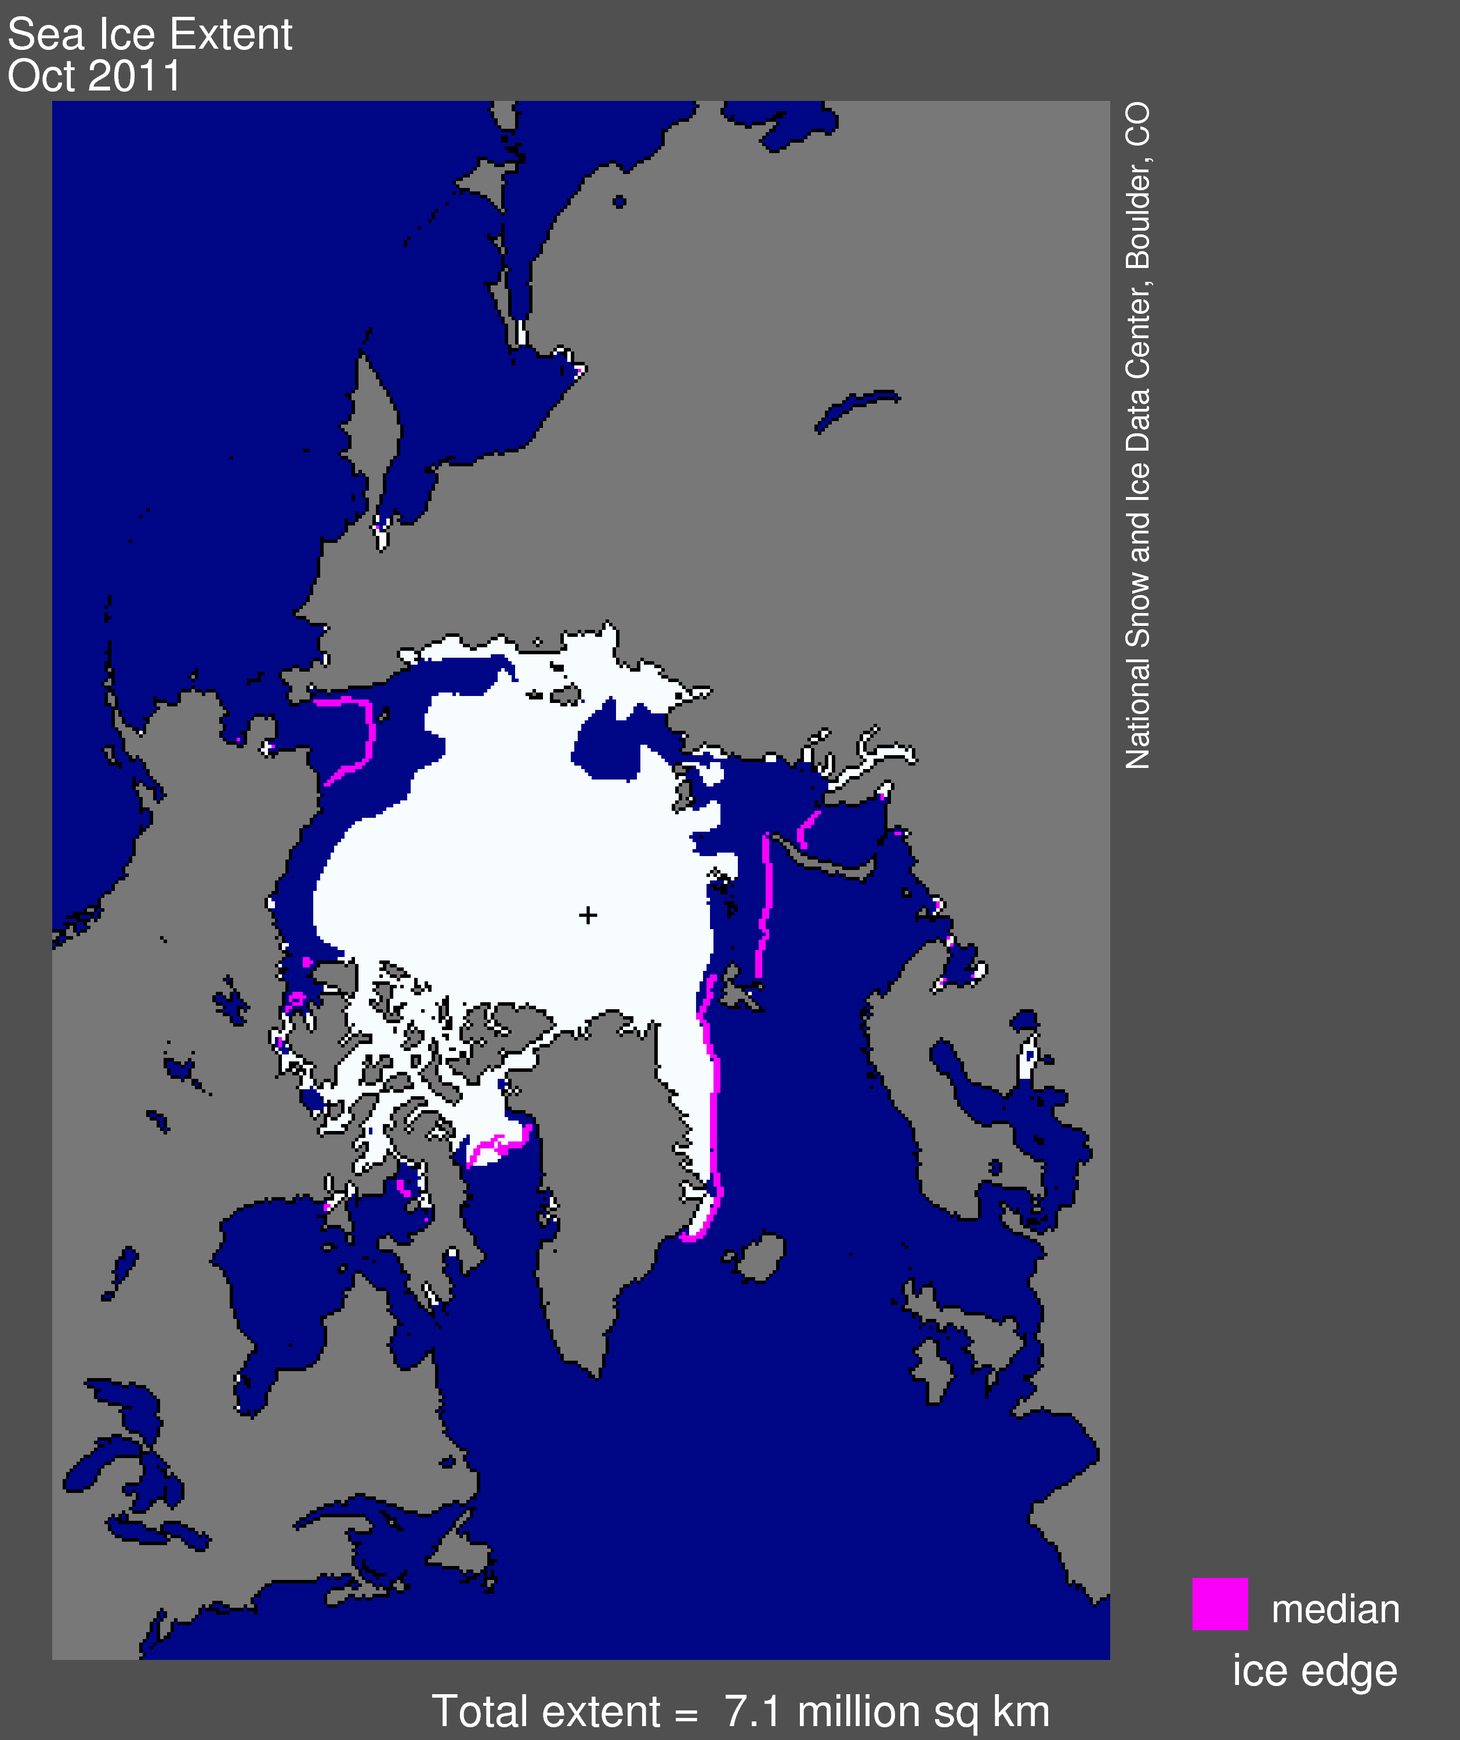
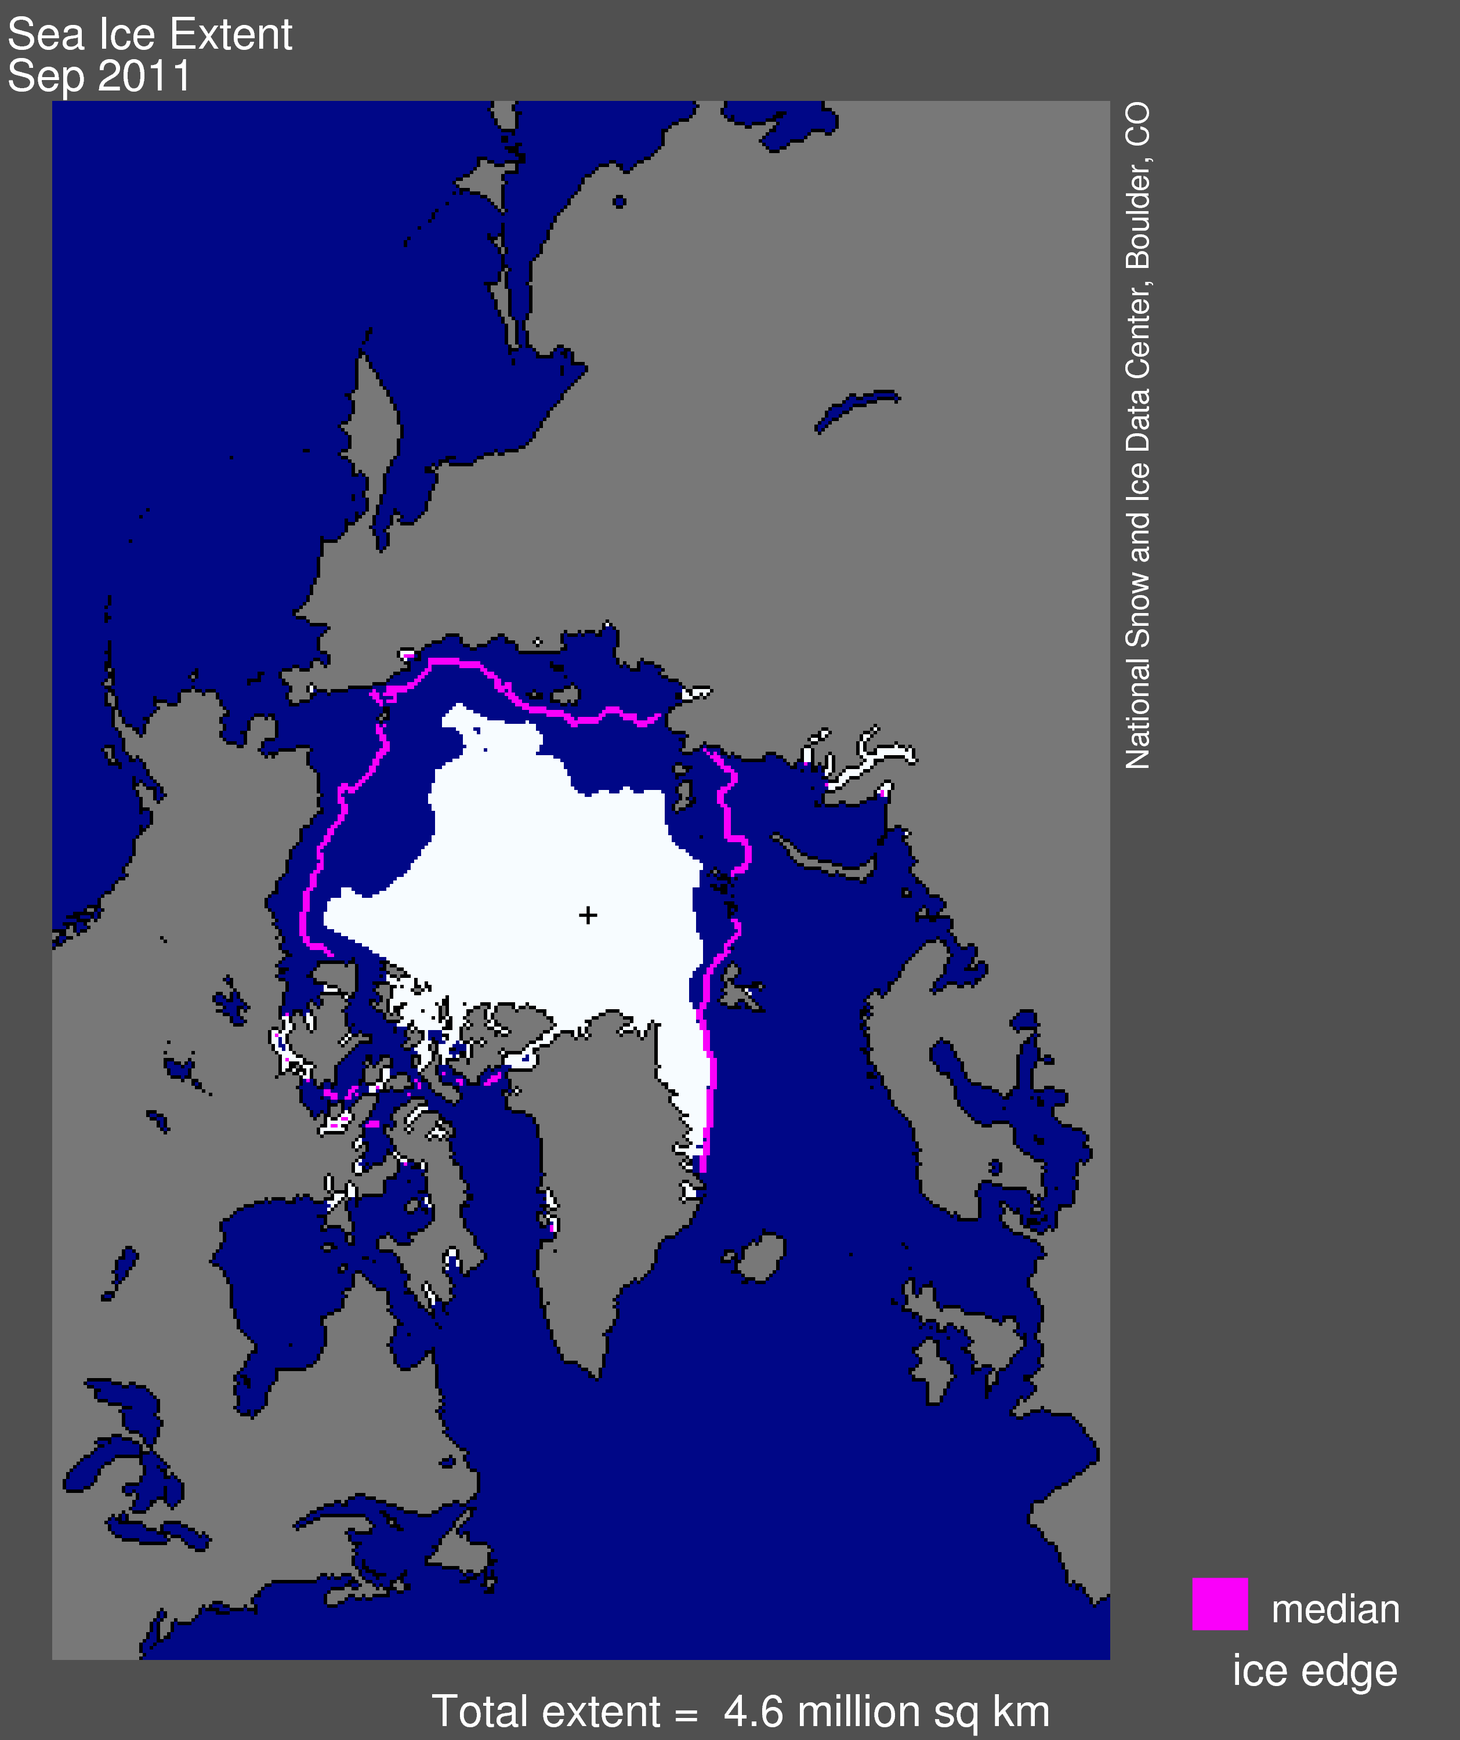
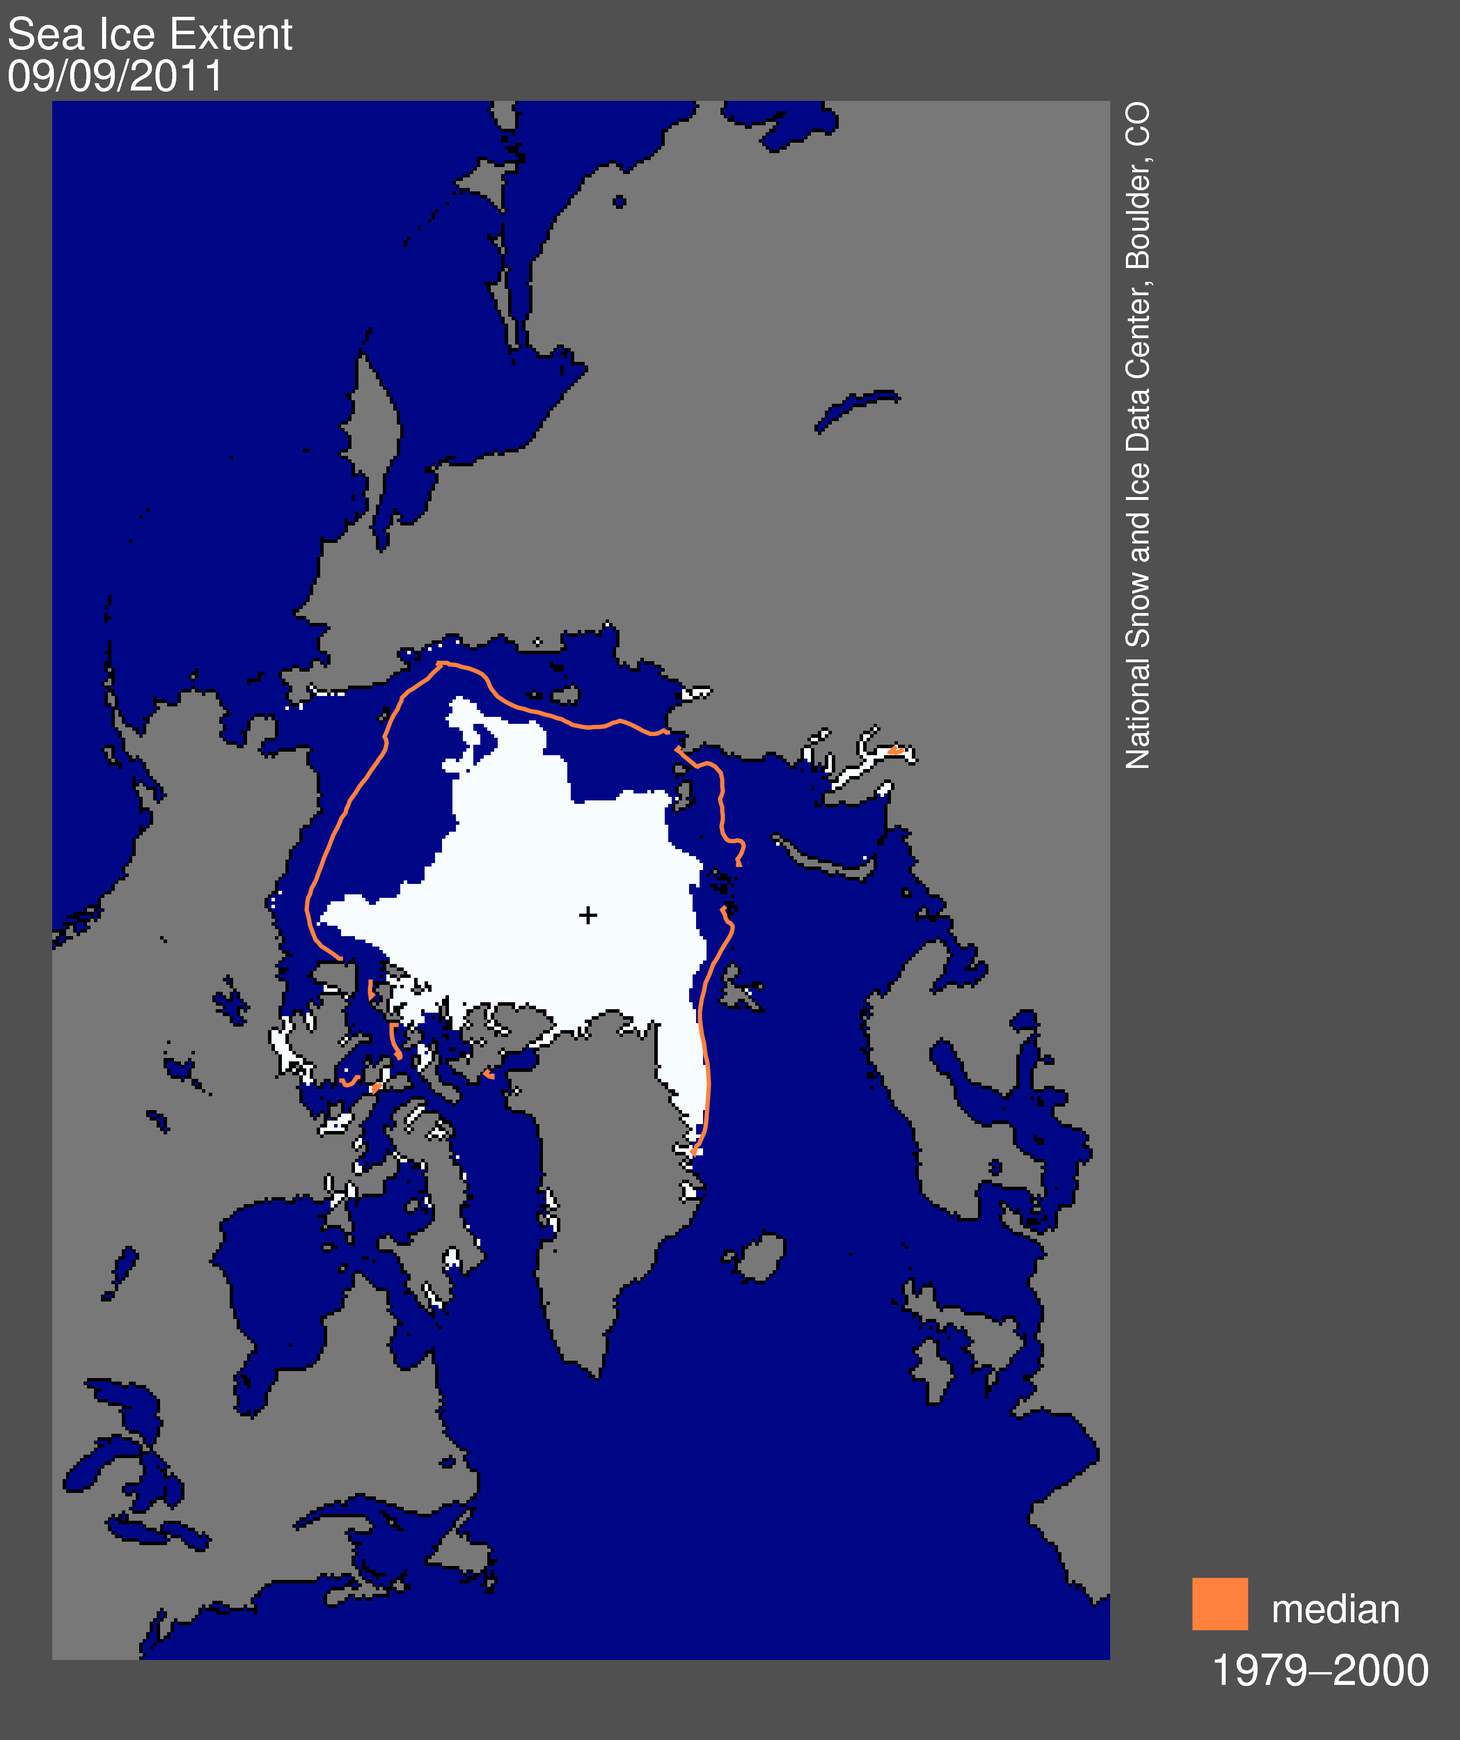
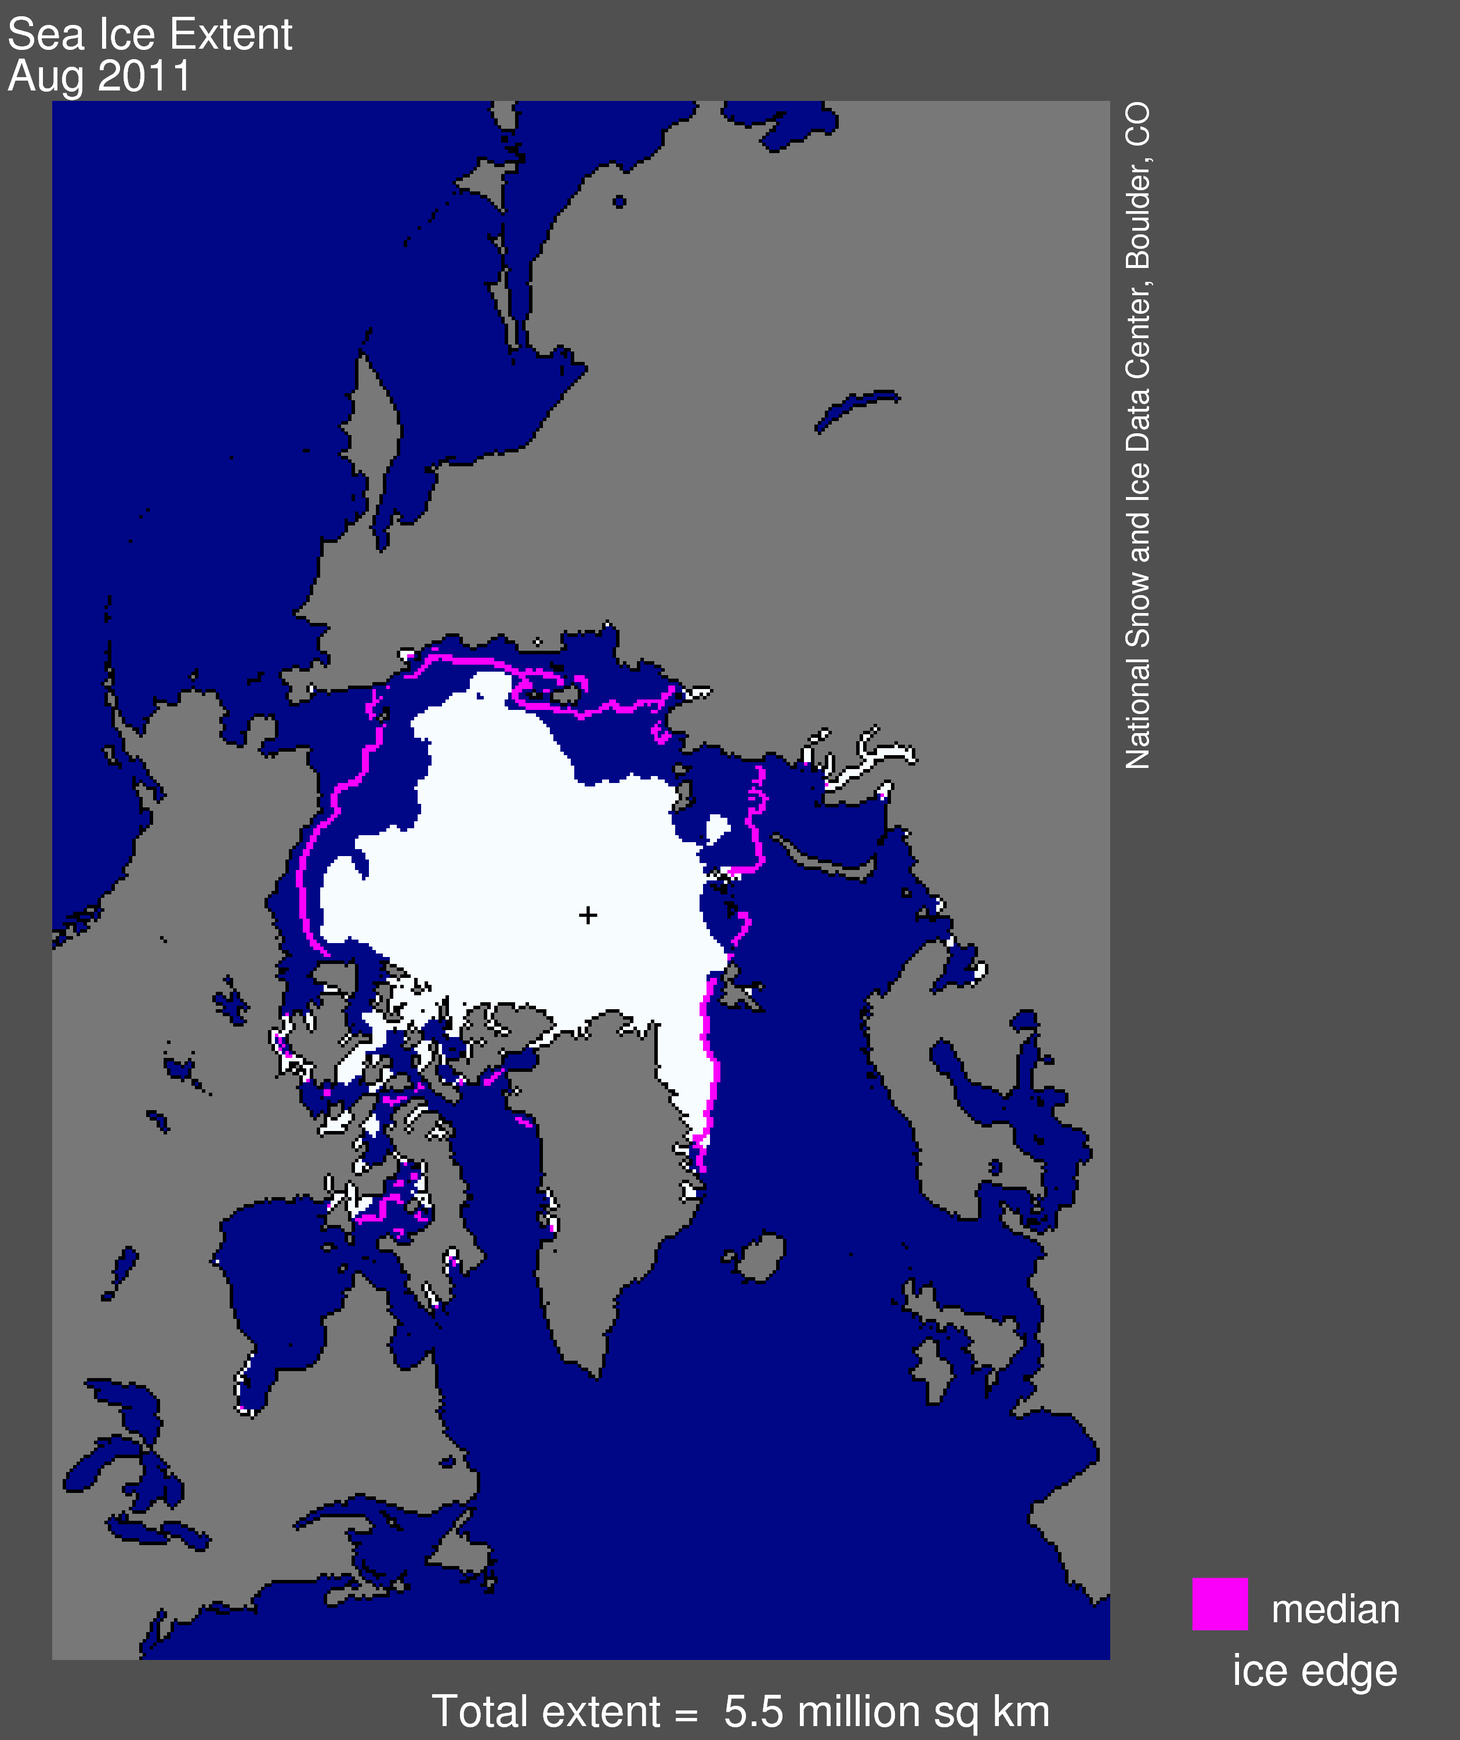
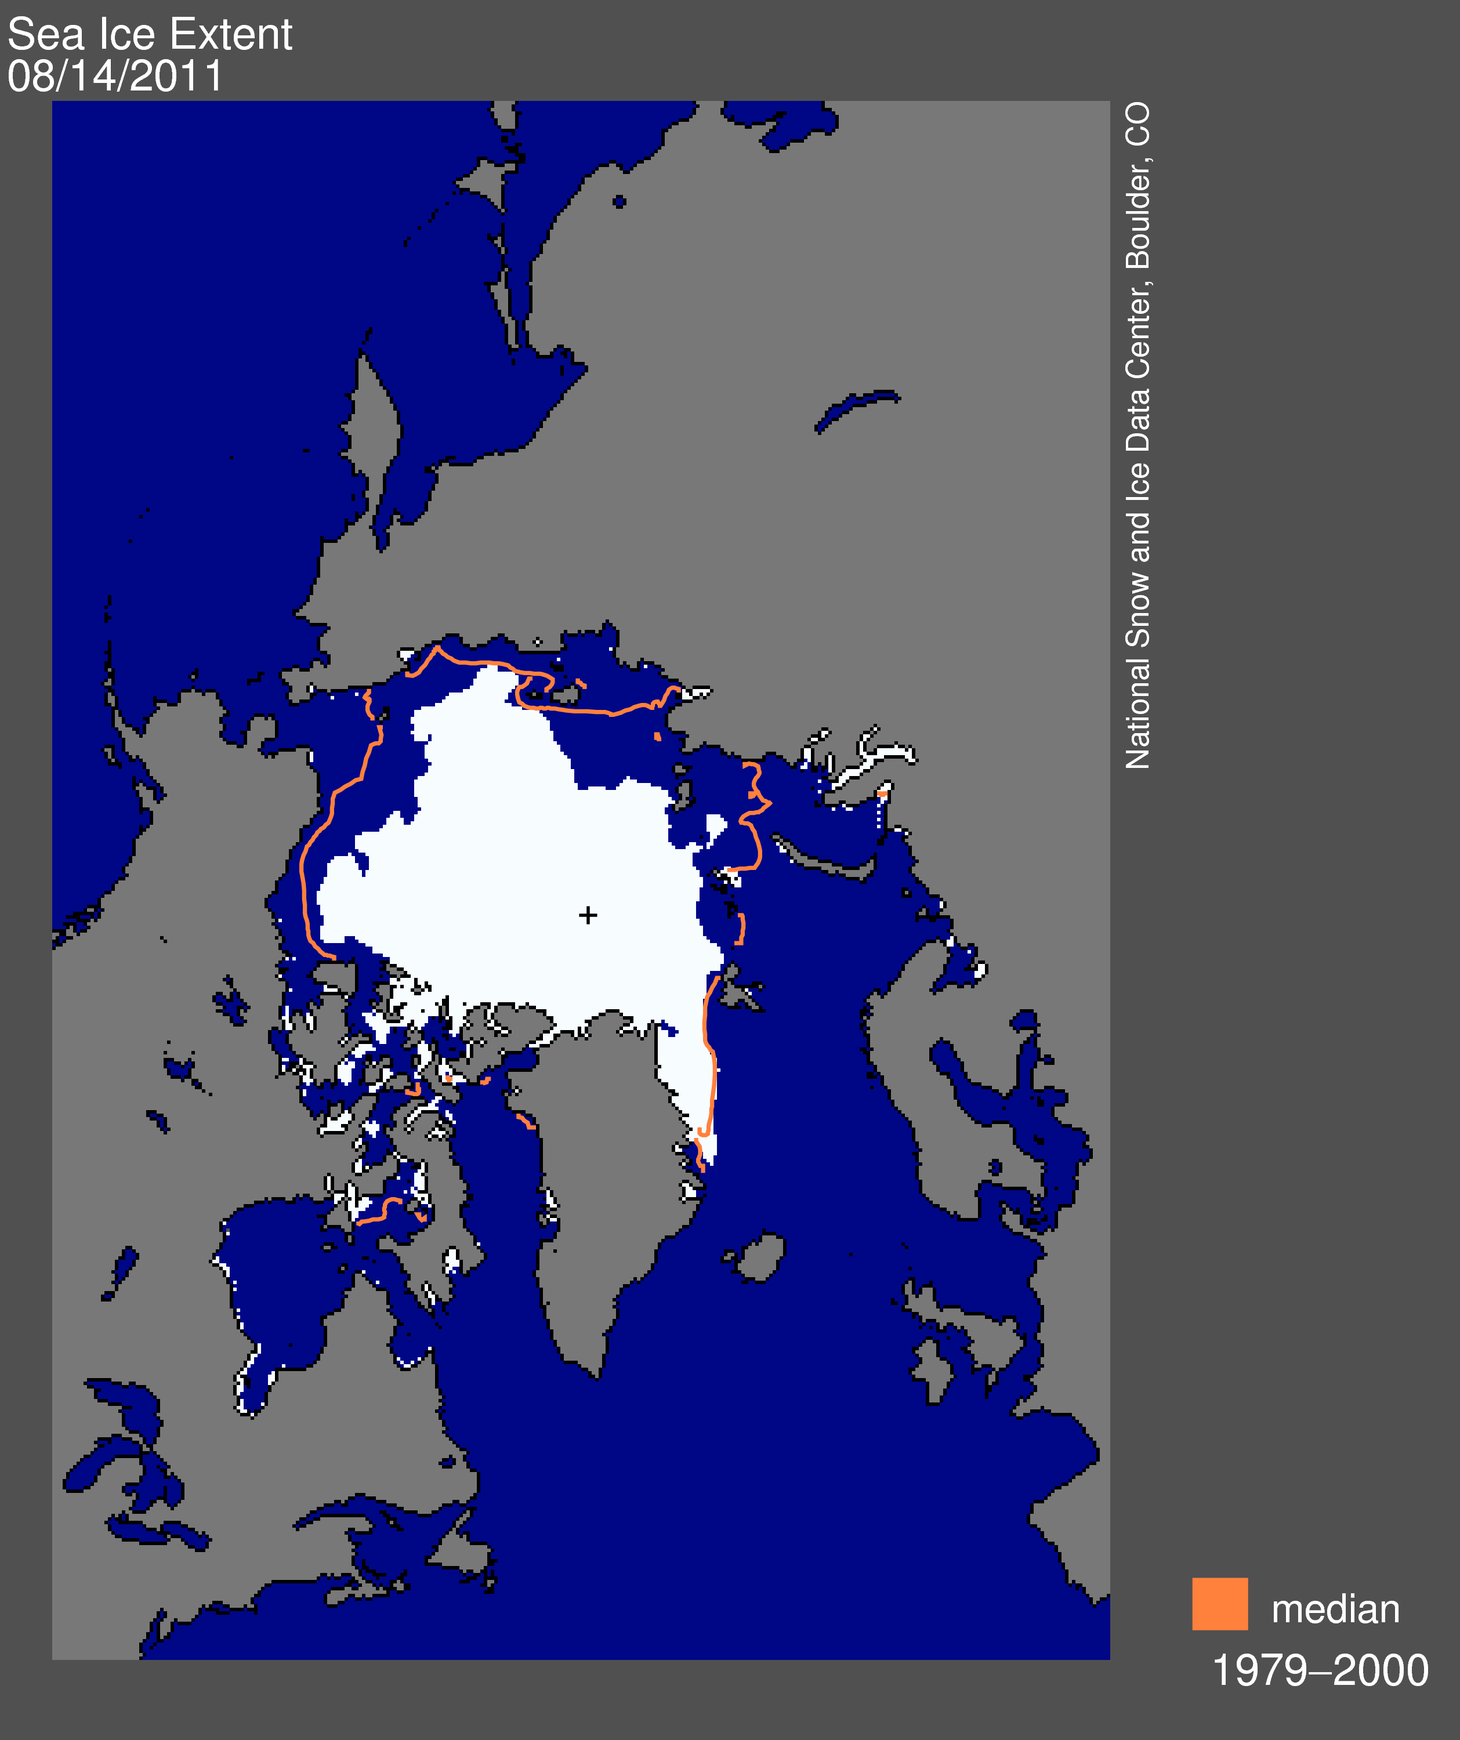
Arctic sea ice extent for February 2012 was 14.56 million square kilometers (5.62 million square miles). The magenta line shows the 1979 to 2000 median extent for that month. The black cross indicates the geographic North Pole. Sea Ice Index data.

Credit: National Snow and Ice Data Center
High-resolution image

Overview of conditions
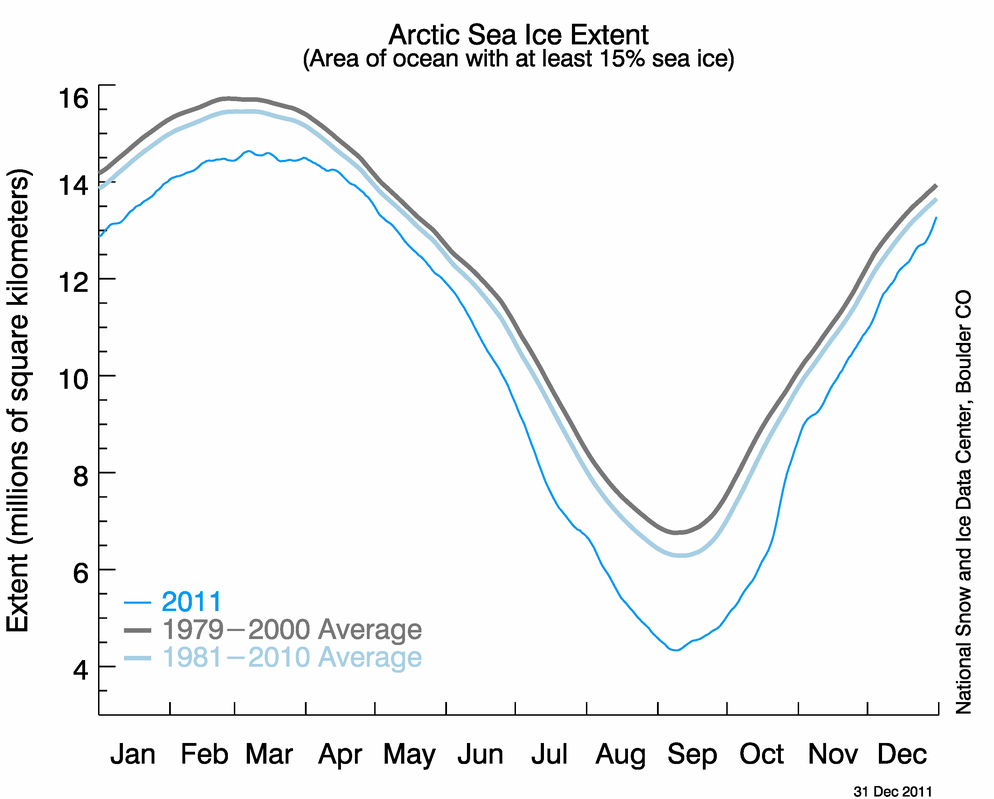
Arctic sea ice extent in February 2012 averaged 14.56 million square kilometers (5.62 million square miles). This is the fifth-lowest February ice extent in the 1979 to 2012 satellite data record, 1.06 million square kilometers (409,000 square miles) below the 1979 to 2000 average extent.

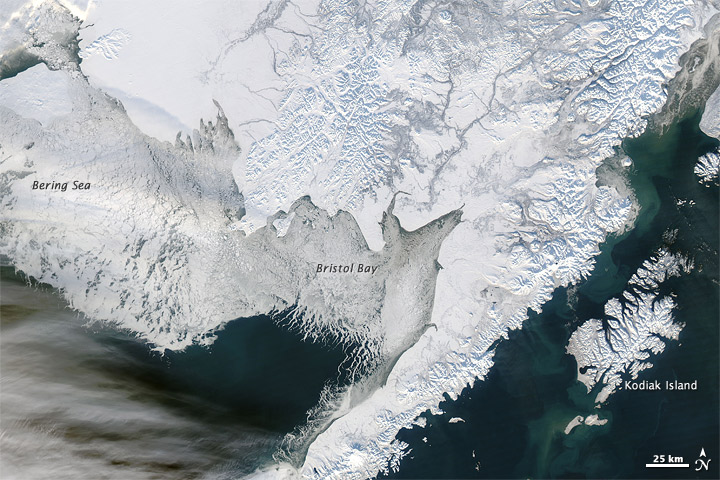
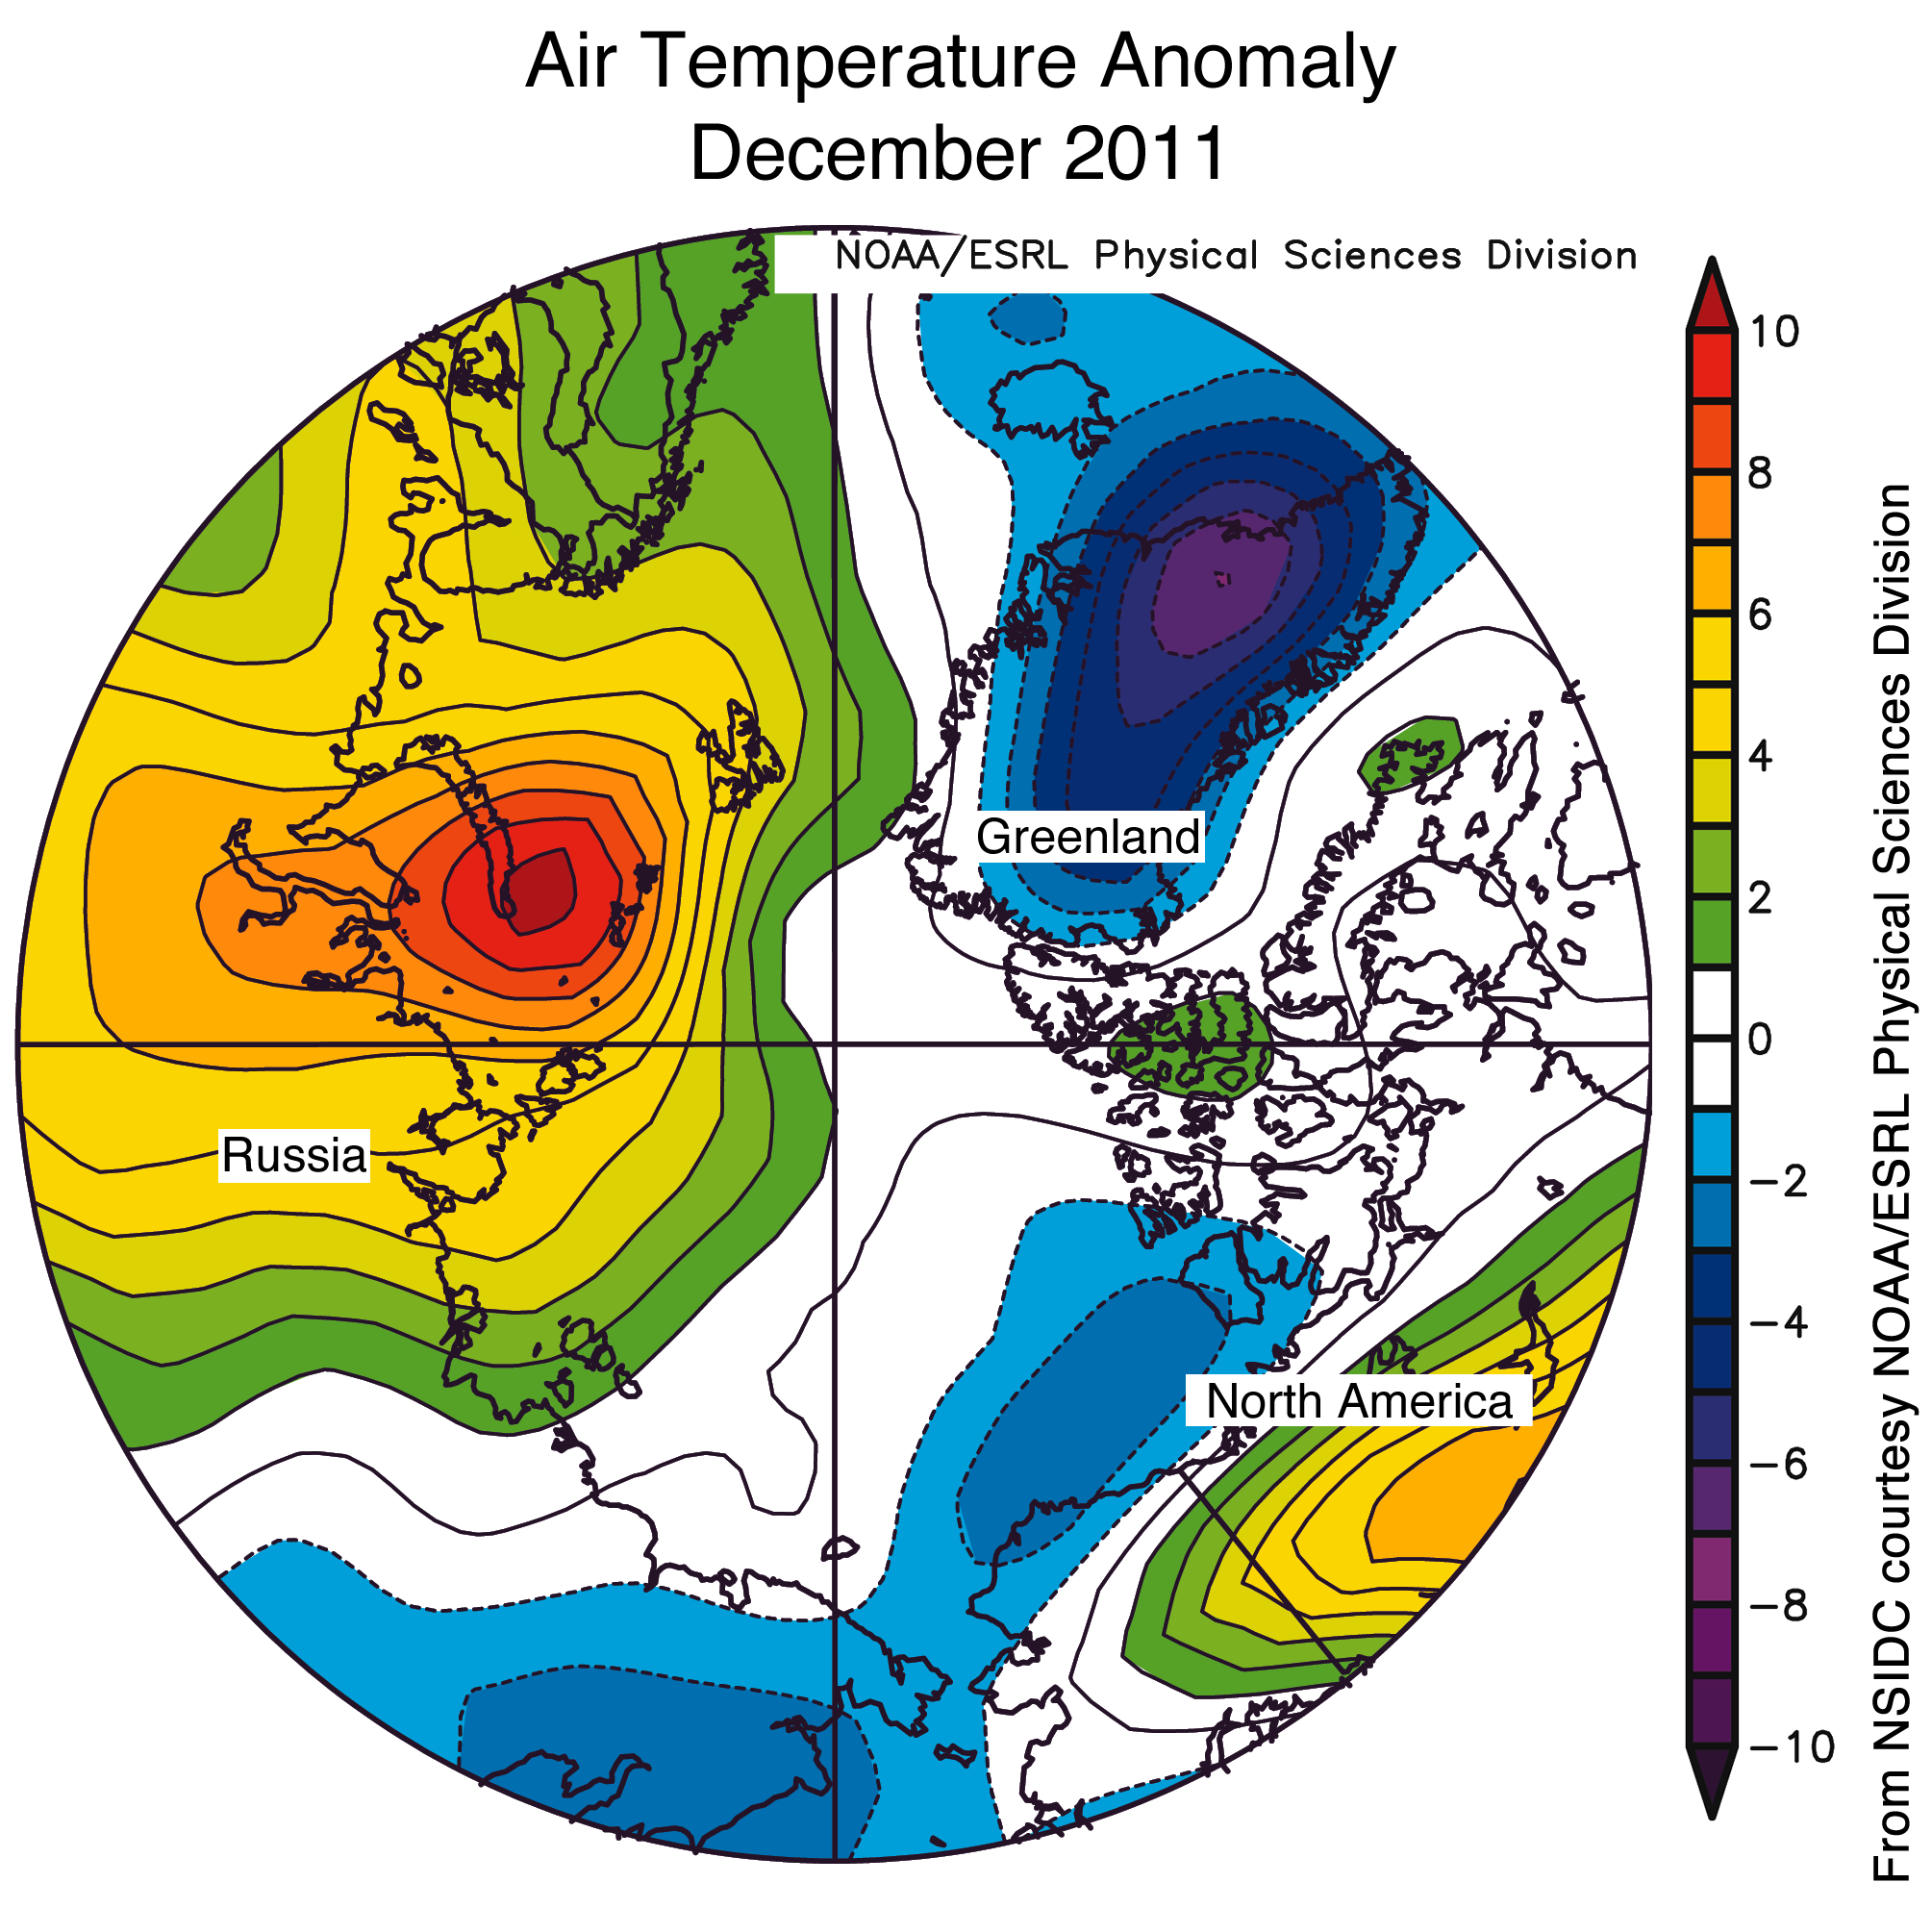
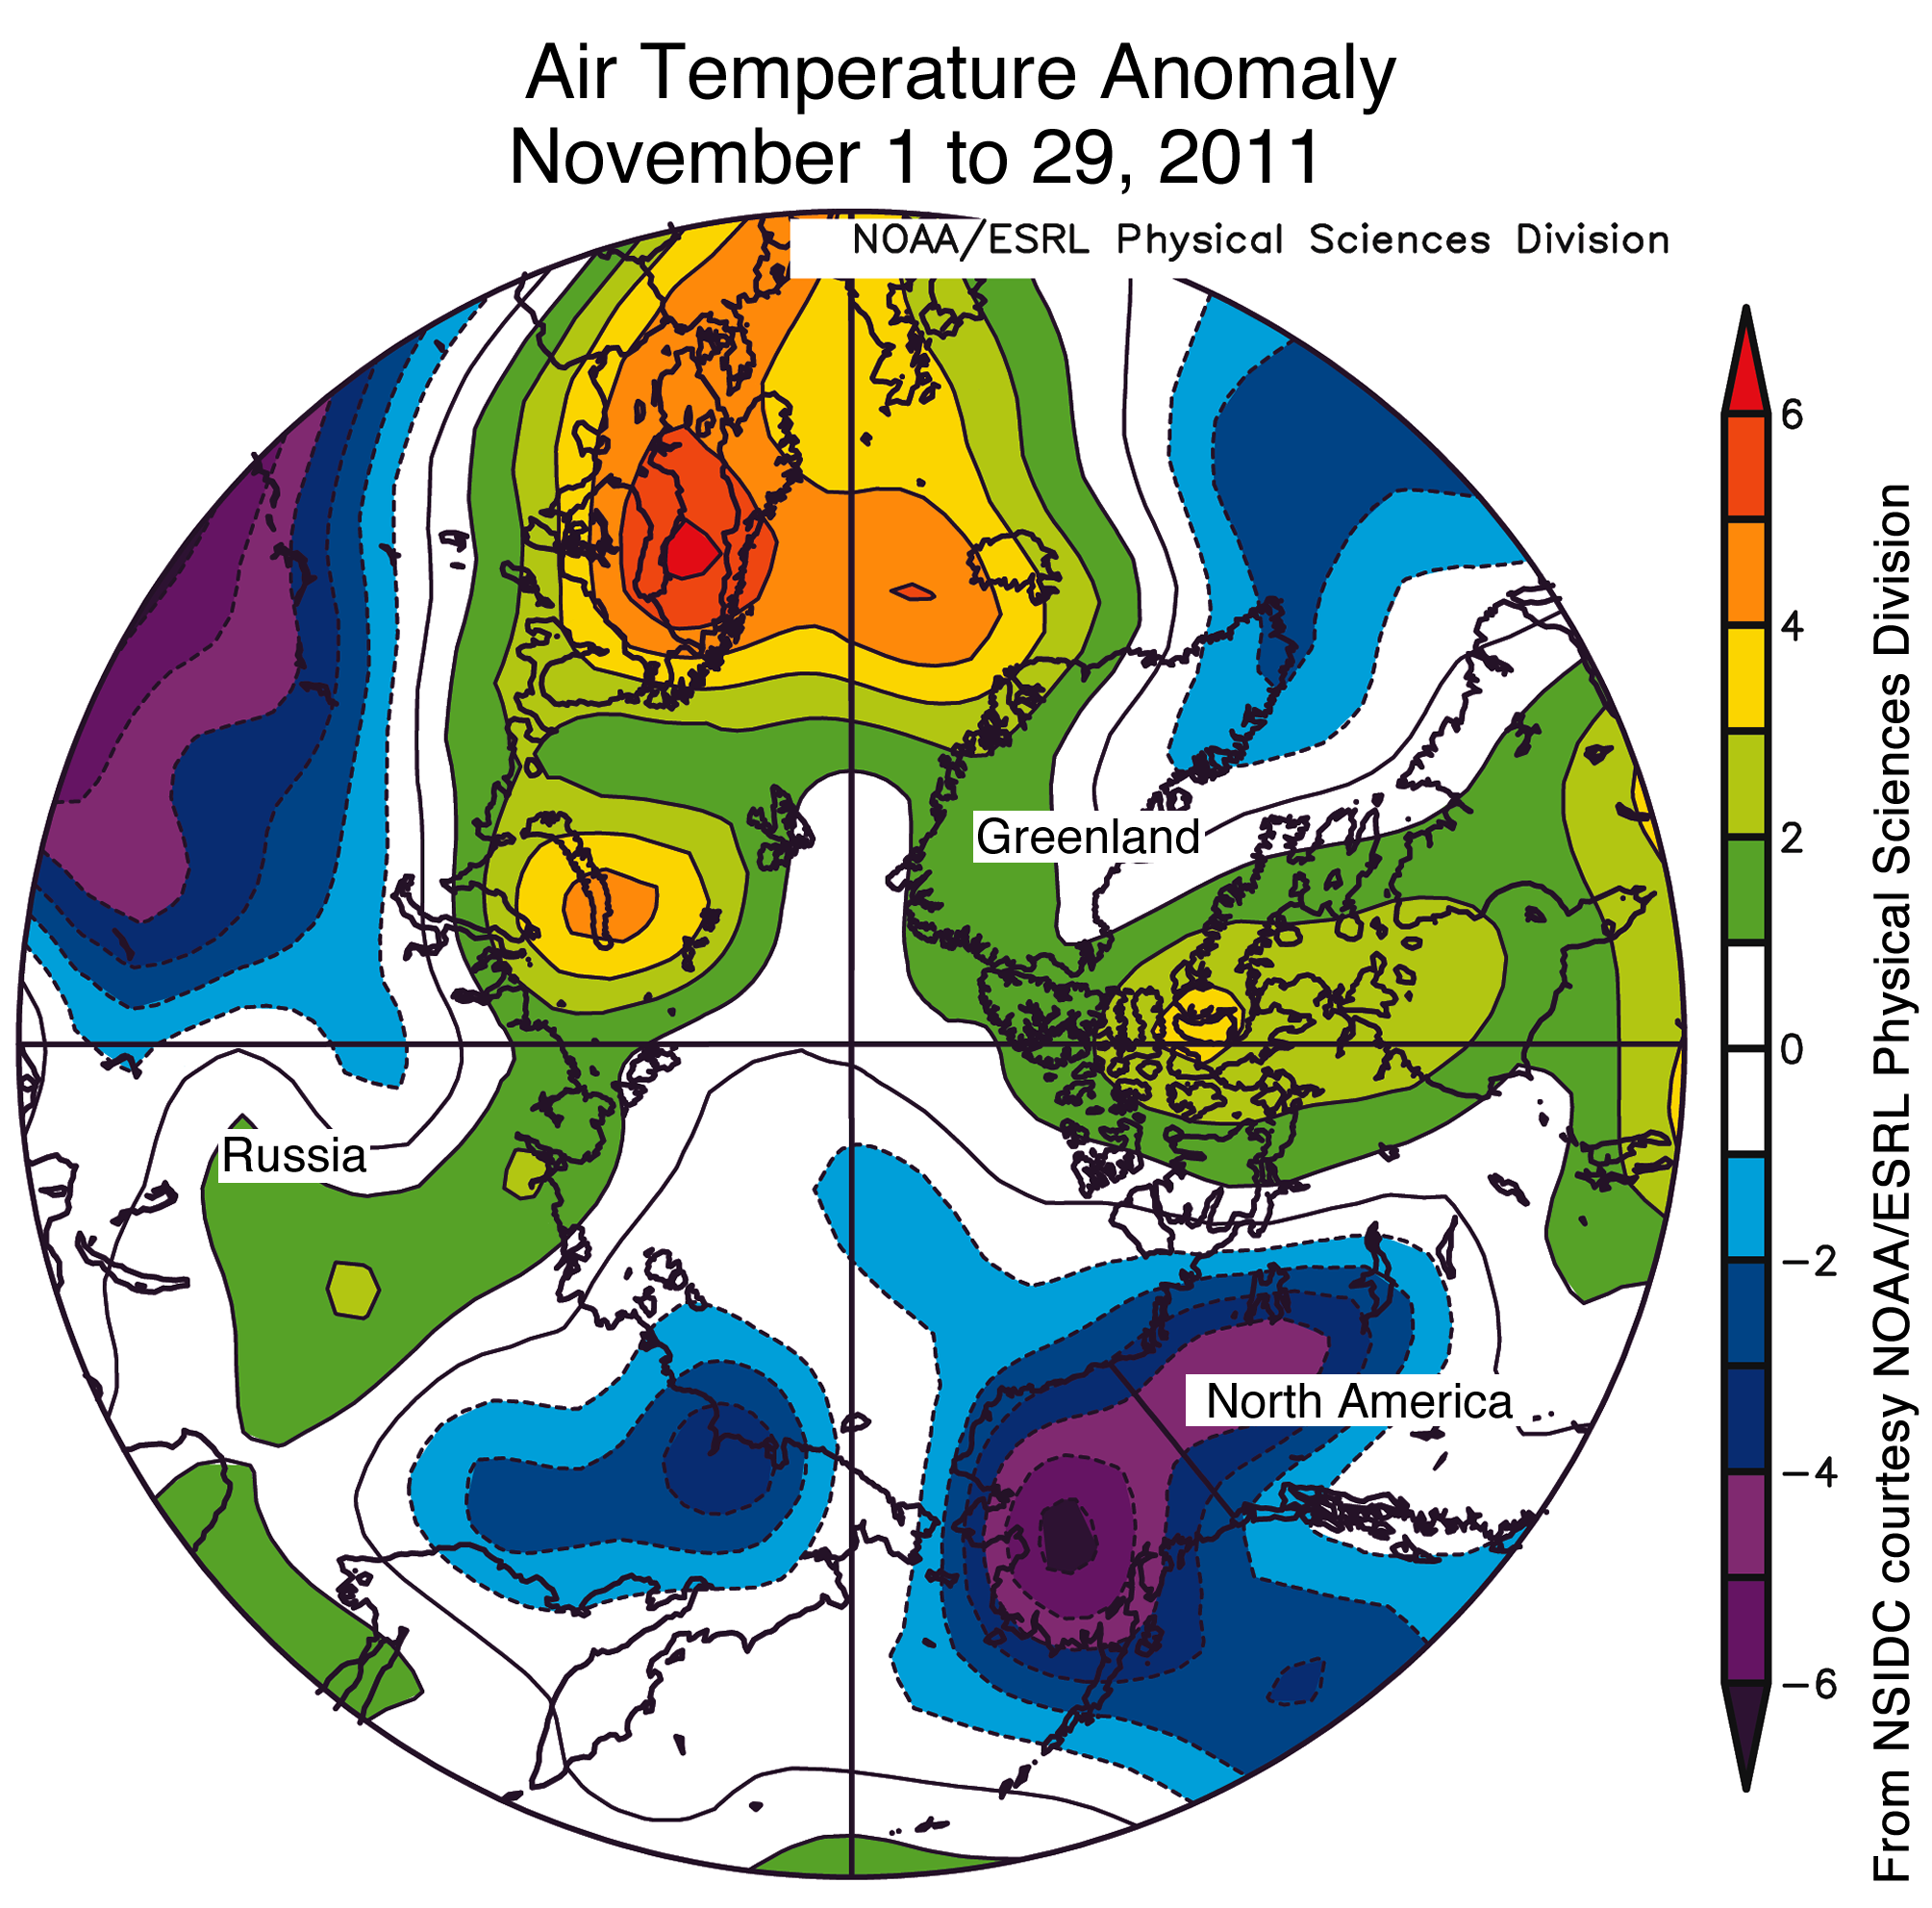
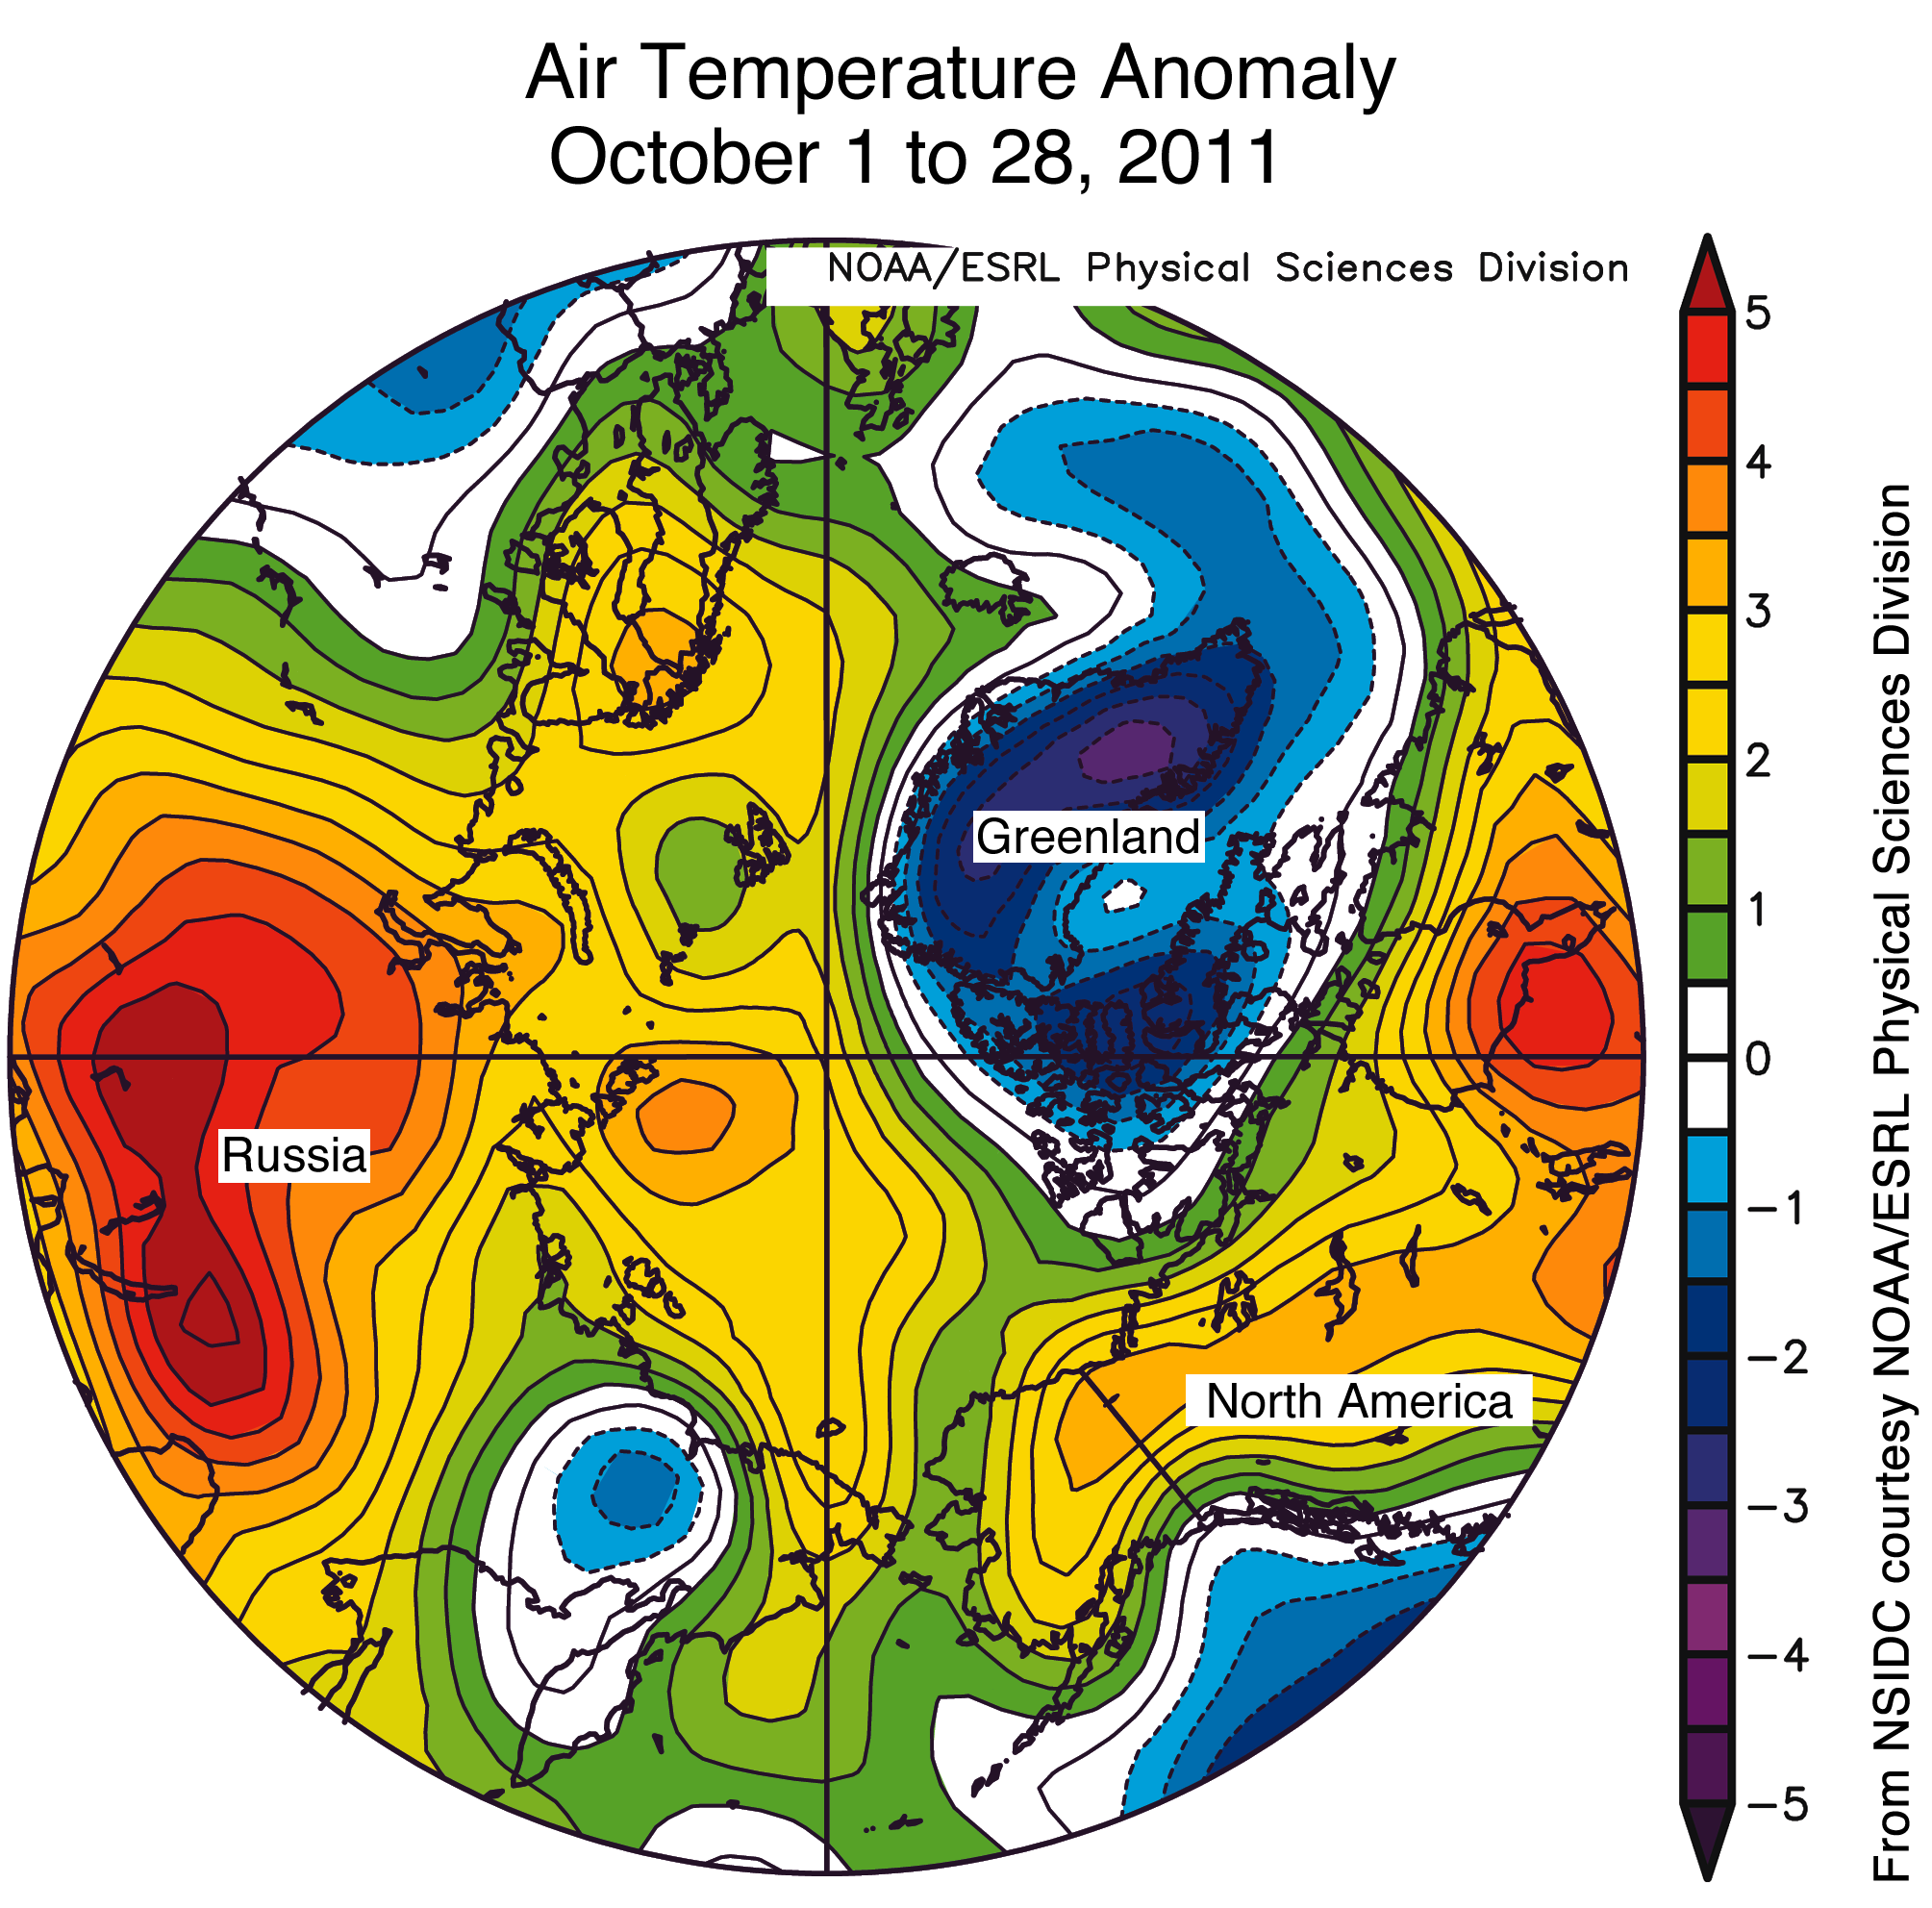
Continuing the pattern established in January, conditions differed greatly between the Atlantic and Pacific sides of the Arctic. On the Atlantic side, especially in the Barents Sea, air temperatures were higher than average and ice extent was unusually low. February ice extent for the Barents Sea was the lowest in the satellite record.  Air temperatures over the Laptev, Kara and Barents seas ranged from 4 to 8 degrees Celsius (7 to 14 degrees Fahrenheit) above average at the 925 hectopascal (hPa ) level (about 3000 feet above sea level).  In contrast, on the Pacific side, February ice extent in the Bering Sea was the second highest in the satellite record, paired with air temperatures that were 3 to 5 degrees Celsius (5 to 9 degrees Fahrenheit) below average at the 925 hPa level.

graph showing years and ice extent

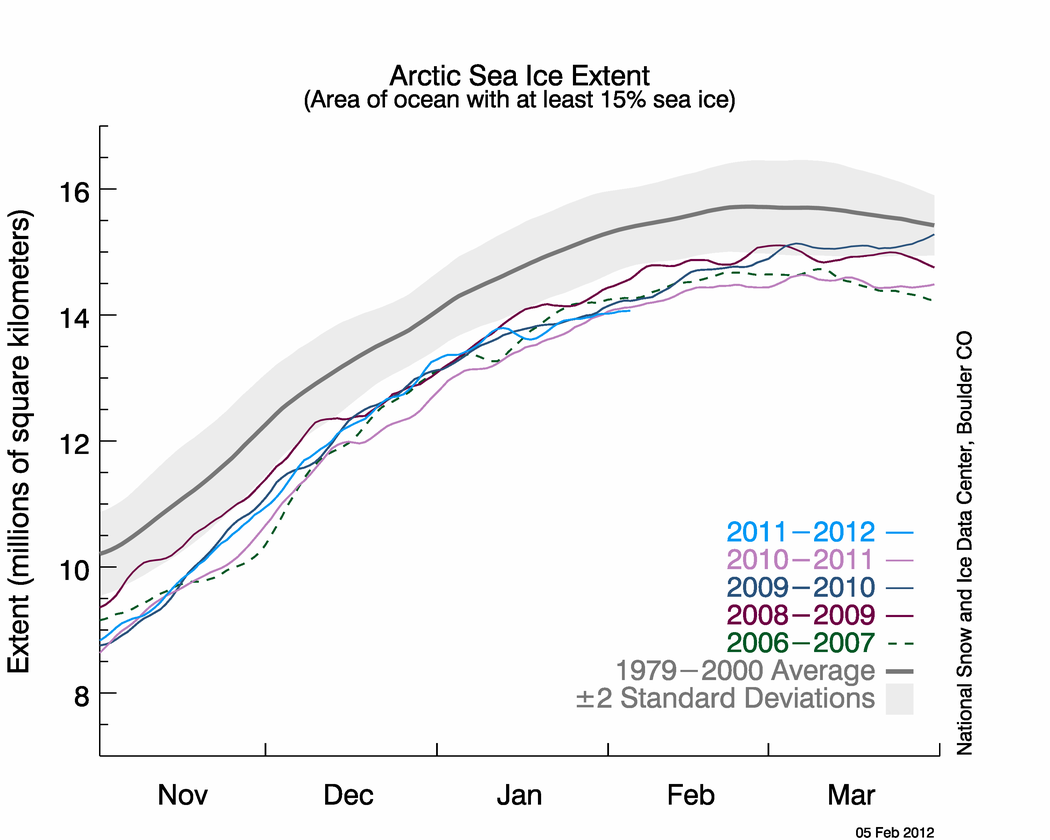
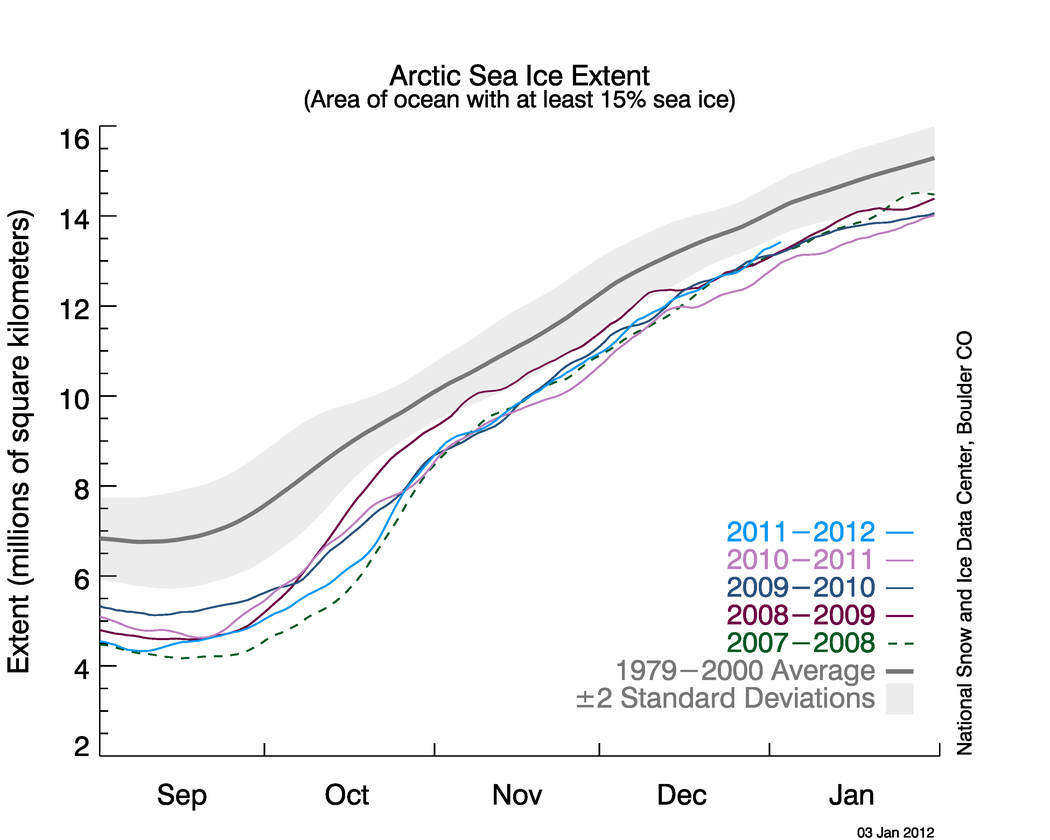
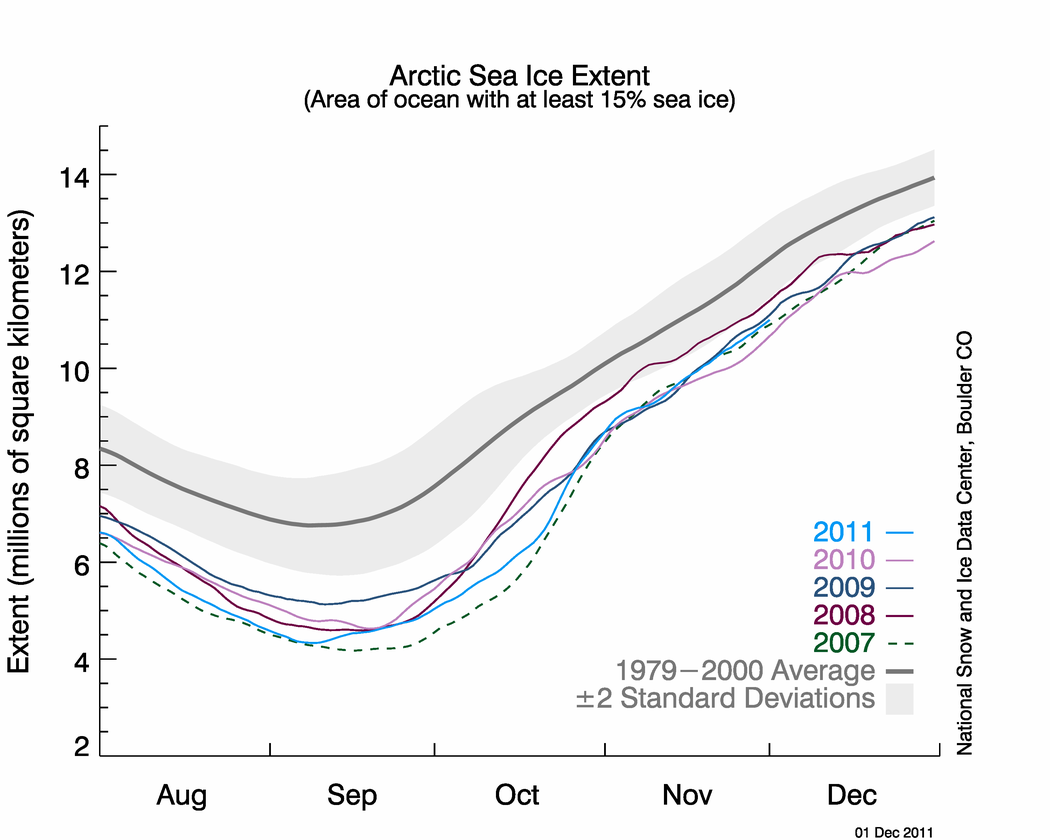
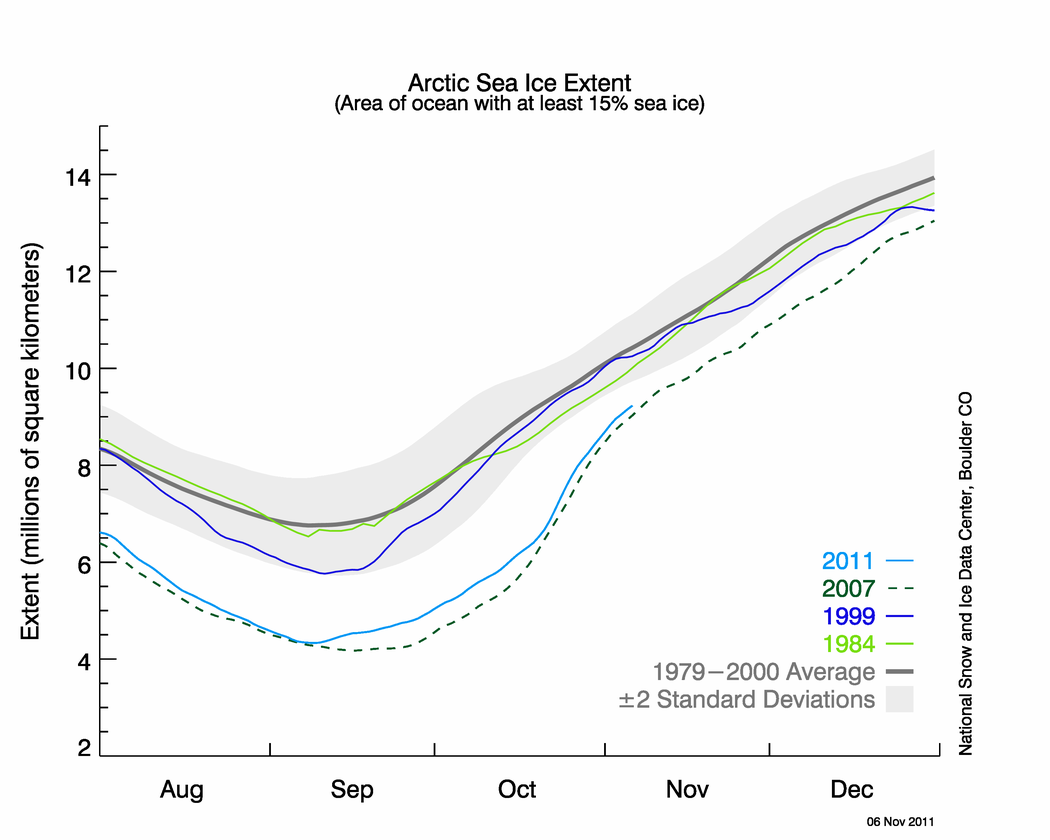
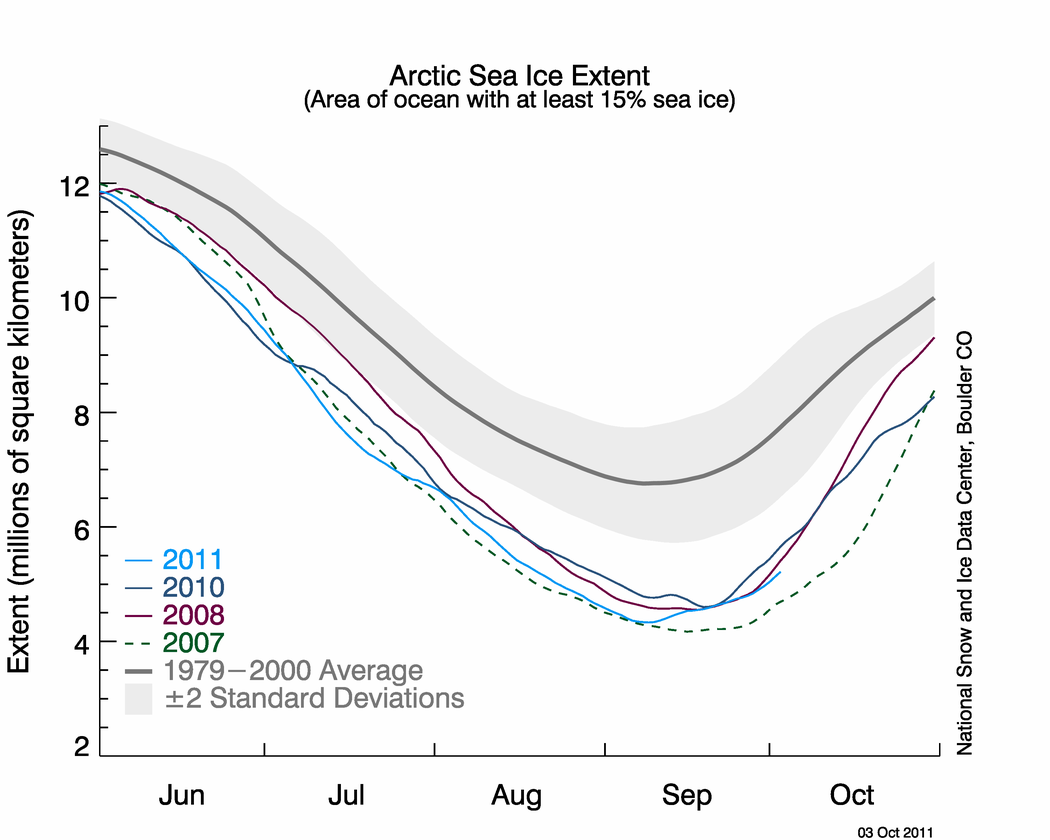
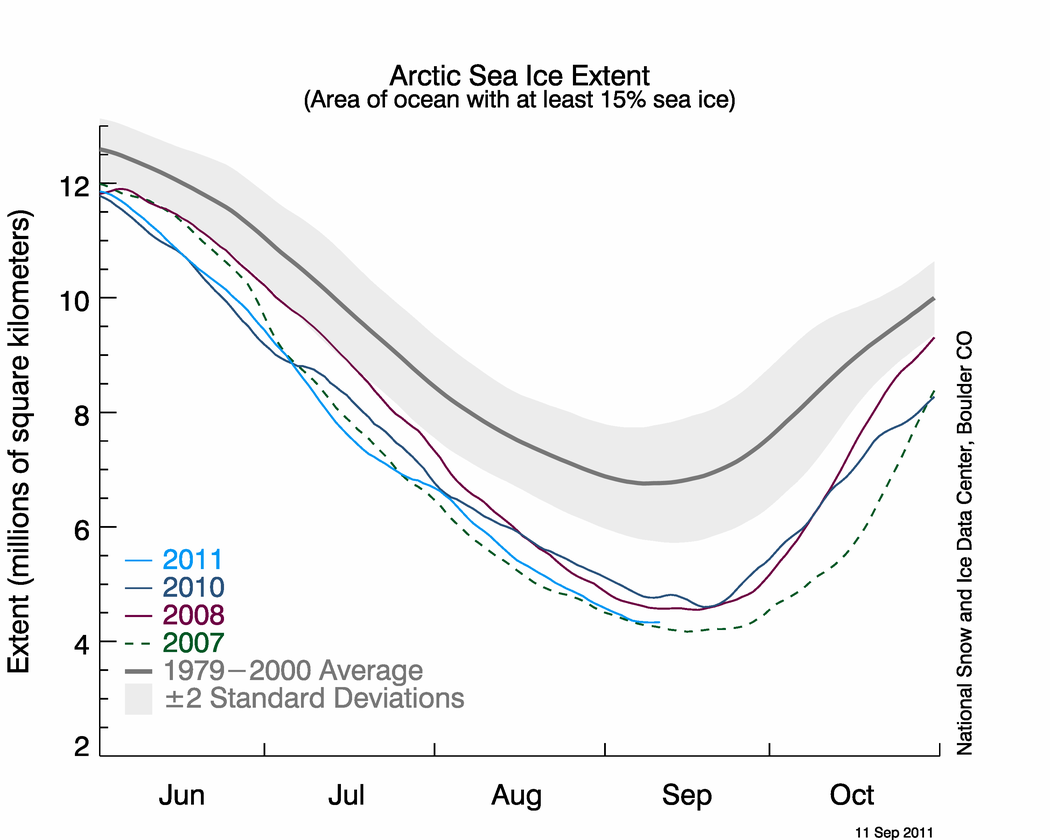
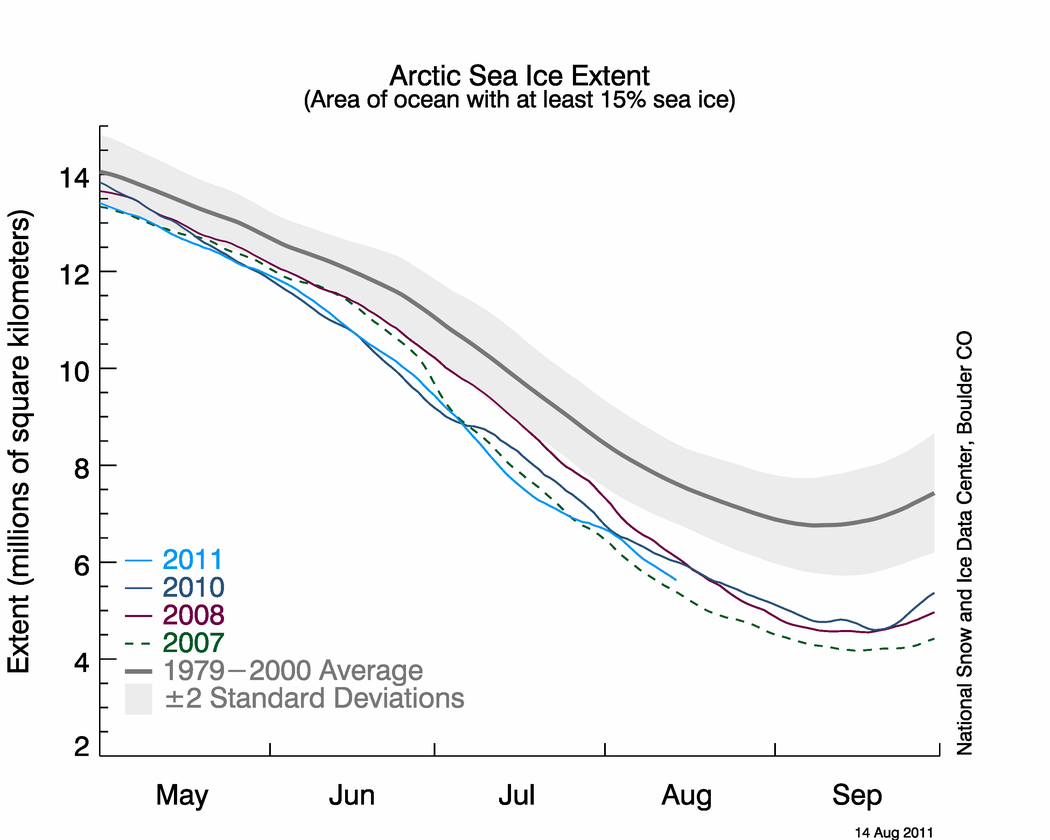
The graph above shows daily Arctic sea ice extent as of March 5, 2012, along with the ice extents for the previous four years. 2011 is shown in light blue, 2010 is in pink, 2009 in dark blue, 2008 is in purple, and 2007, the year with the record low minimum, is dashed green. The gray area around the average line shows the two standard deviation range of the data. Sea Ice Index data.

Credit: National Snow and Ice Data Center
High-resolution image

Conditions in context

Overall, the Arctic gained 956,000 square kilometers (369,000 square miles) of ice during the month. This was 486,000 square kilometers (188,000 square miles) more than the average ice growth for February 1979 to 2000. The overall low ice extent for the month stemmed mostly from the low ice extent in the Barents Sea: the extensive ice in the Bering Sea was not enough to compensate. On average, the Barents Sea has 865,000 square kilometers (334,000 square miles) of ice for the month of February. This year there were only 401,000 square kilometers (155,000 square miles) of ice in that region, the lowest recorded in the satellite data record.

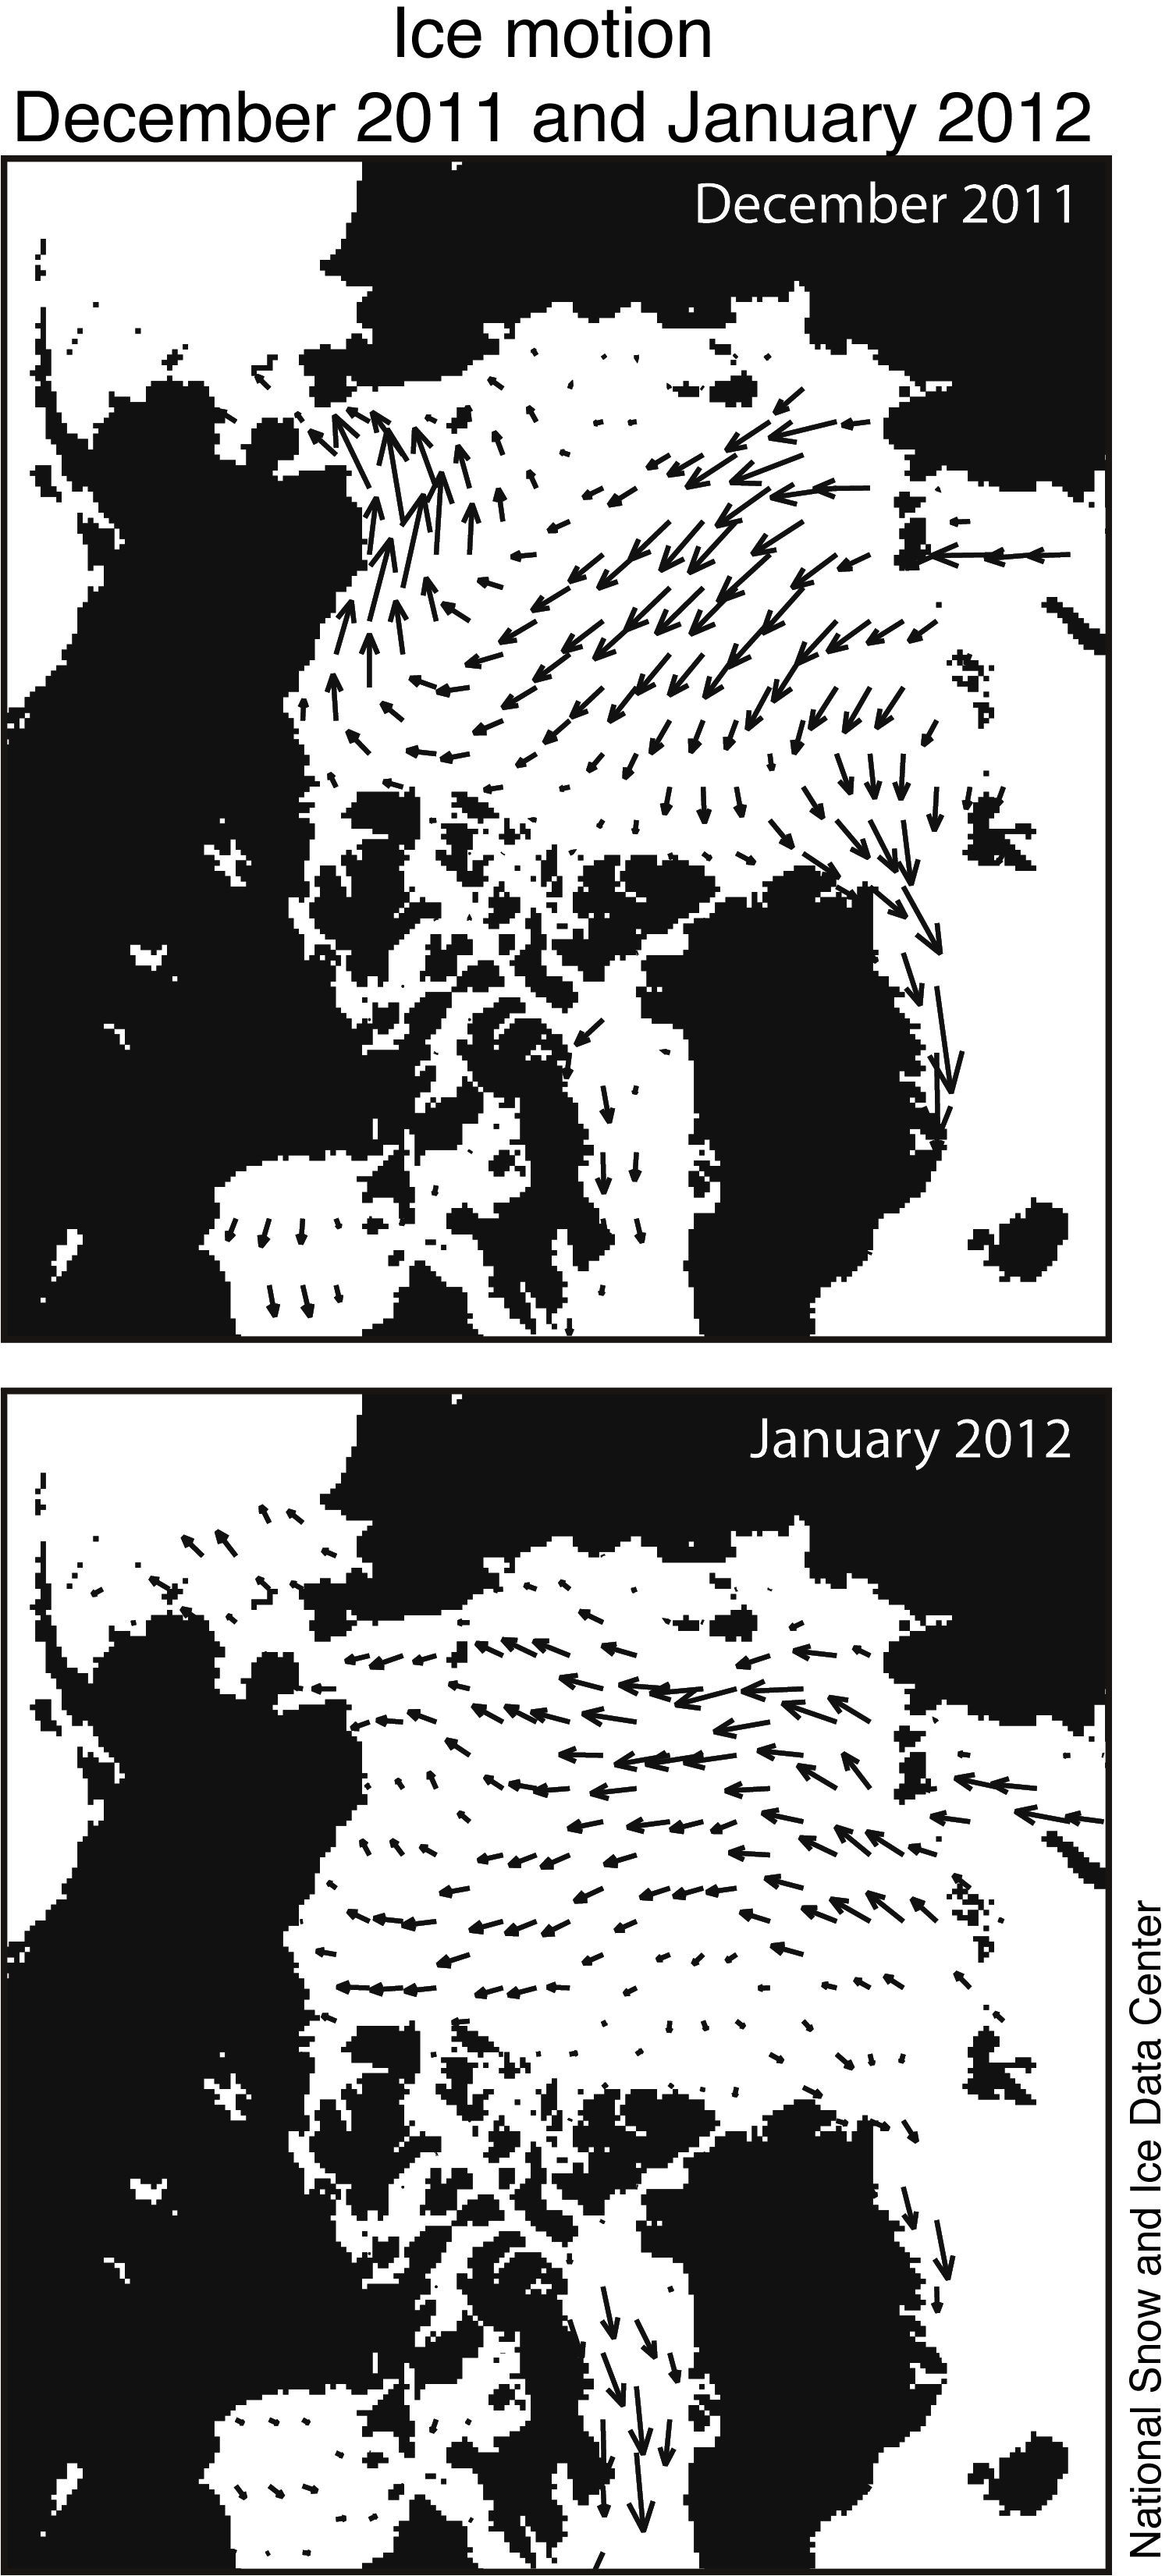
At the end of February, ice extent rose sharply. Data from the NSIDC Multisensor Analyzed Sea Ice Extent (MASIE) showed that the rise came mainly from the Bering Sea and Baffin Bay. In the Bering Sea and Baffin Bay, winds pushed the ice extent southward. Ice growth in the Kara Sea also contributed to the rise in ice extent. In the Kara Sea, westerly winds that had been keeping the area ice-free shifted, allowing the open water areas to freeze over. During late winter, ice extent can change quickly as winds push extensive ice cover together, or spread out ice floes over a greater area.

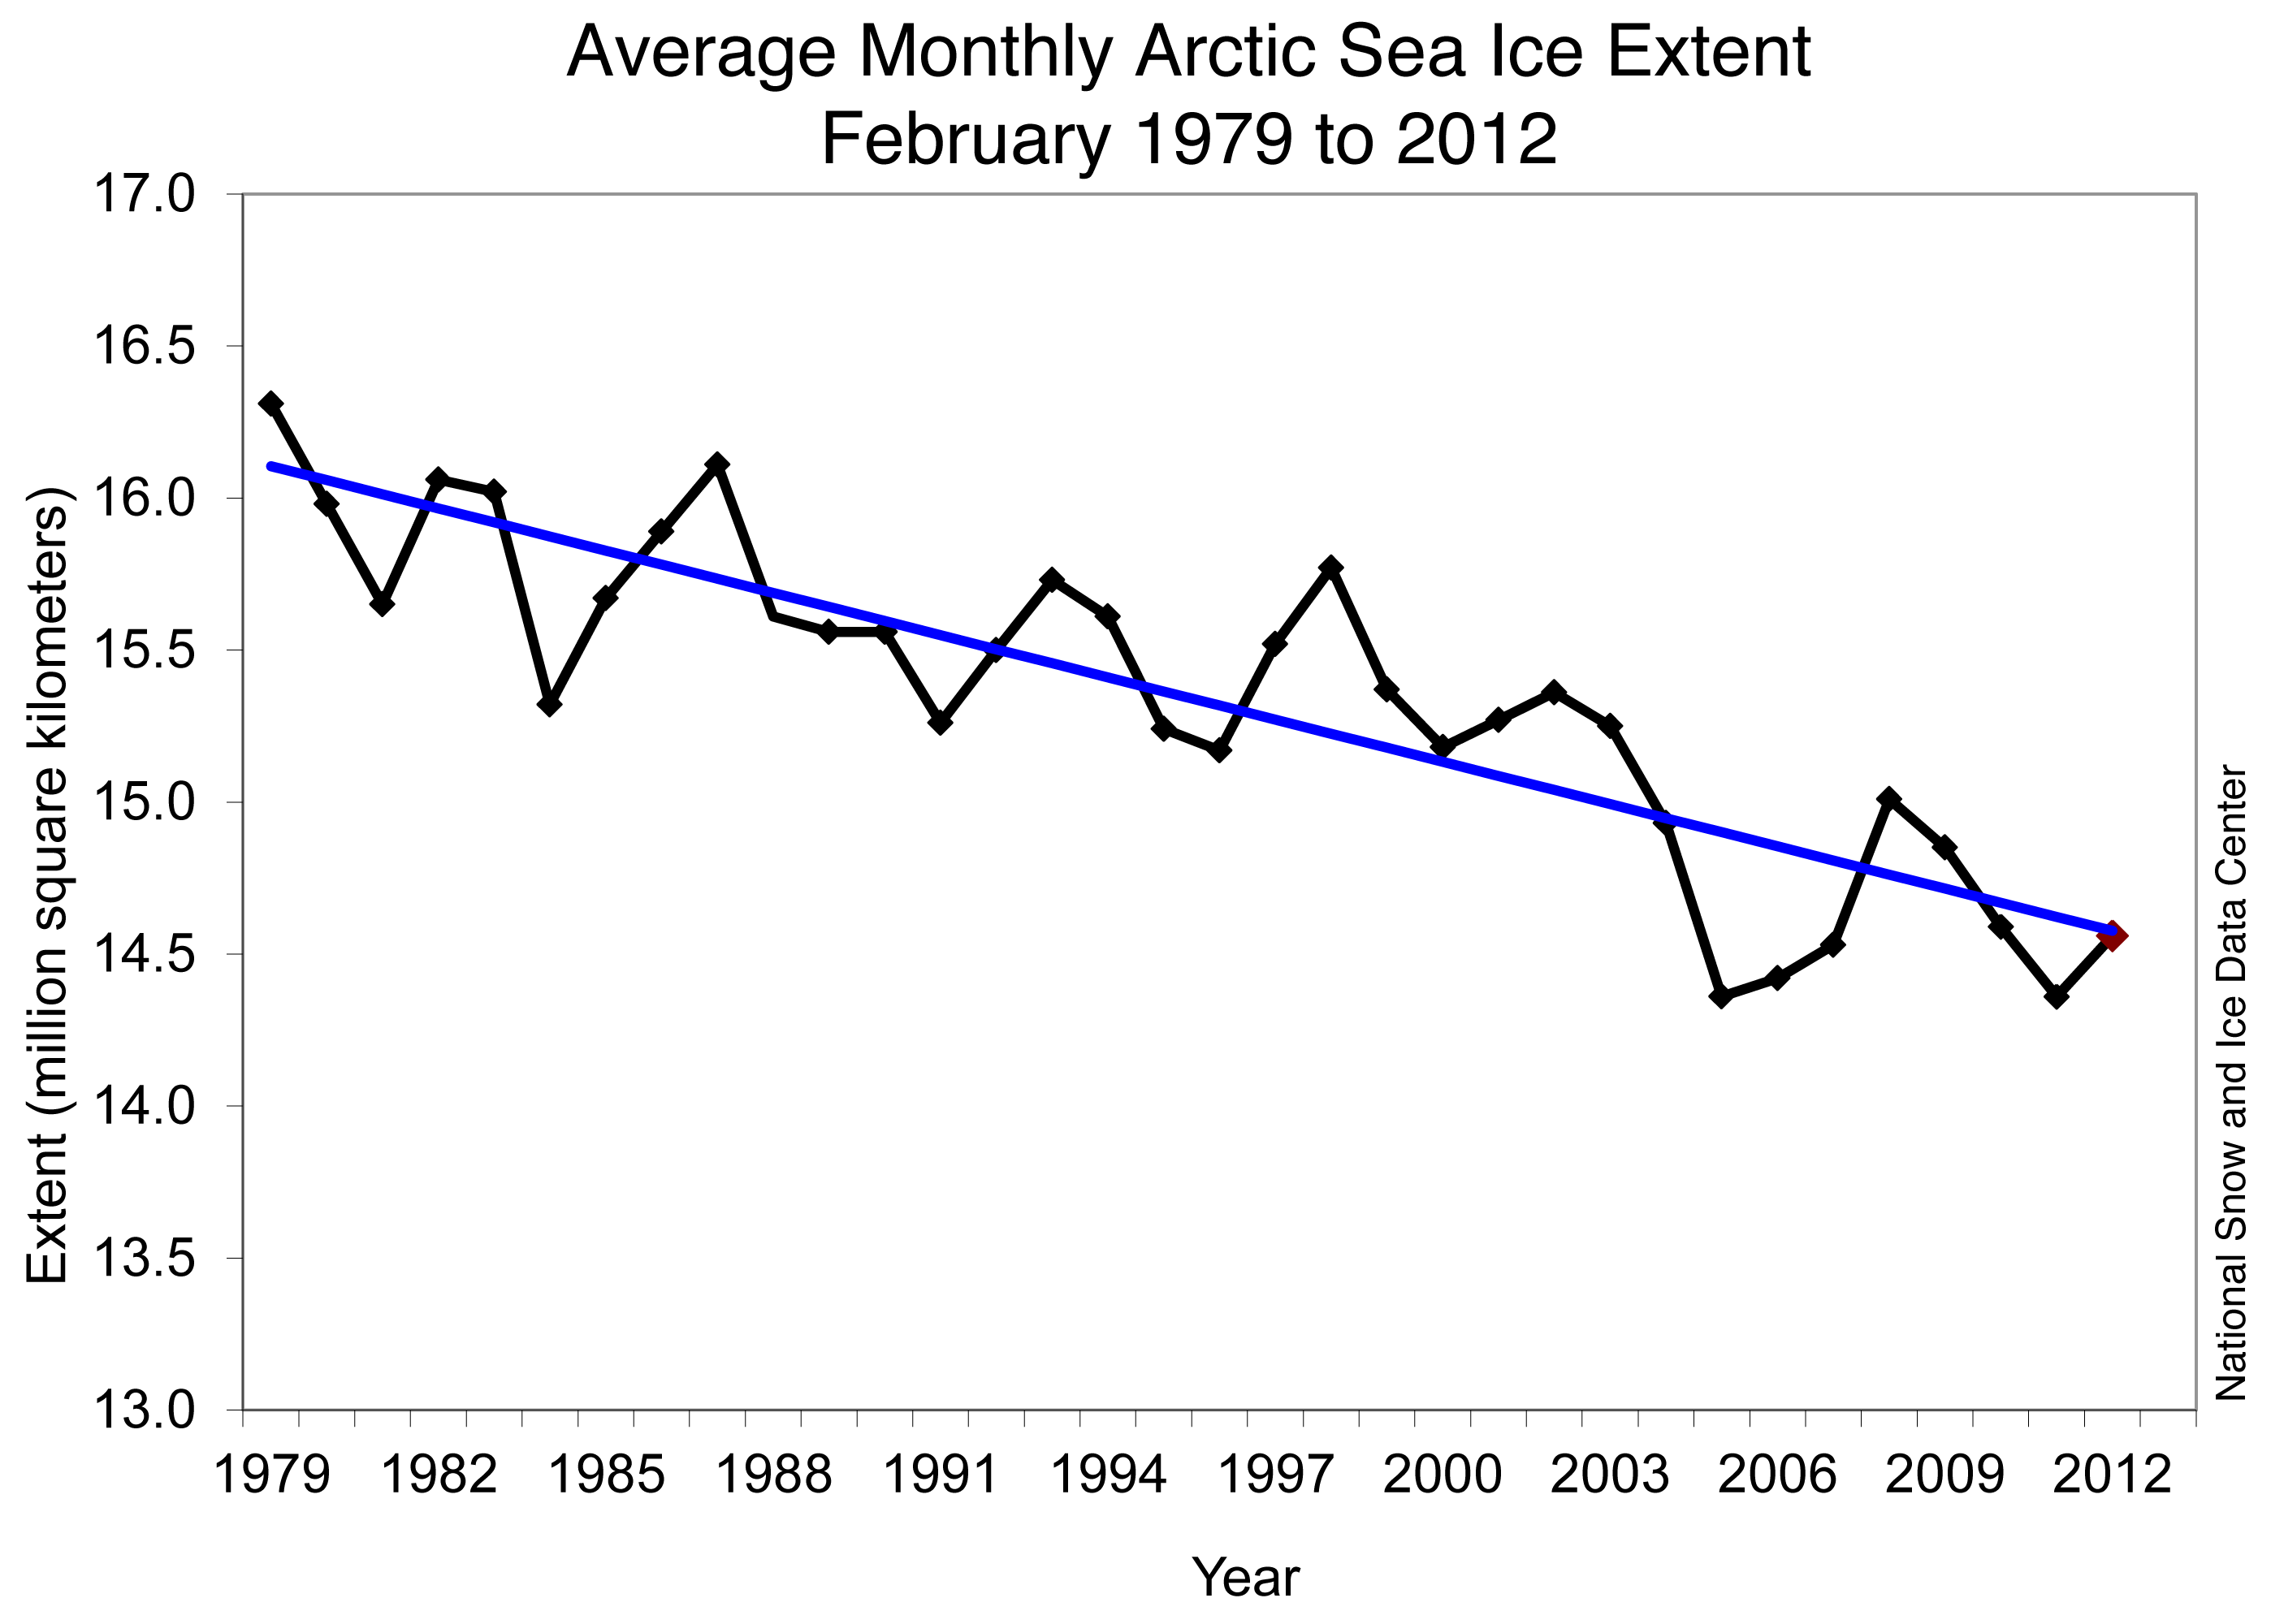
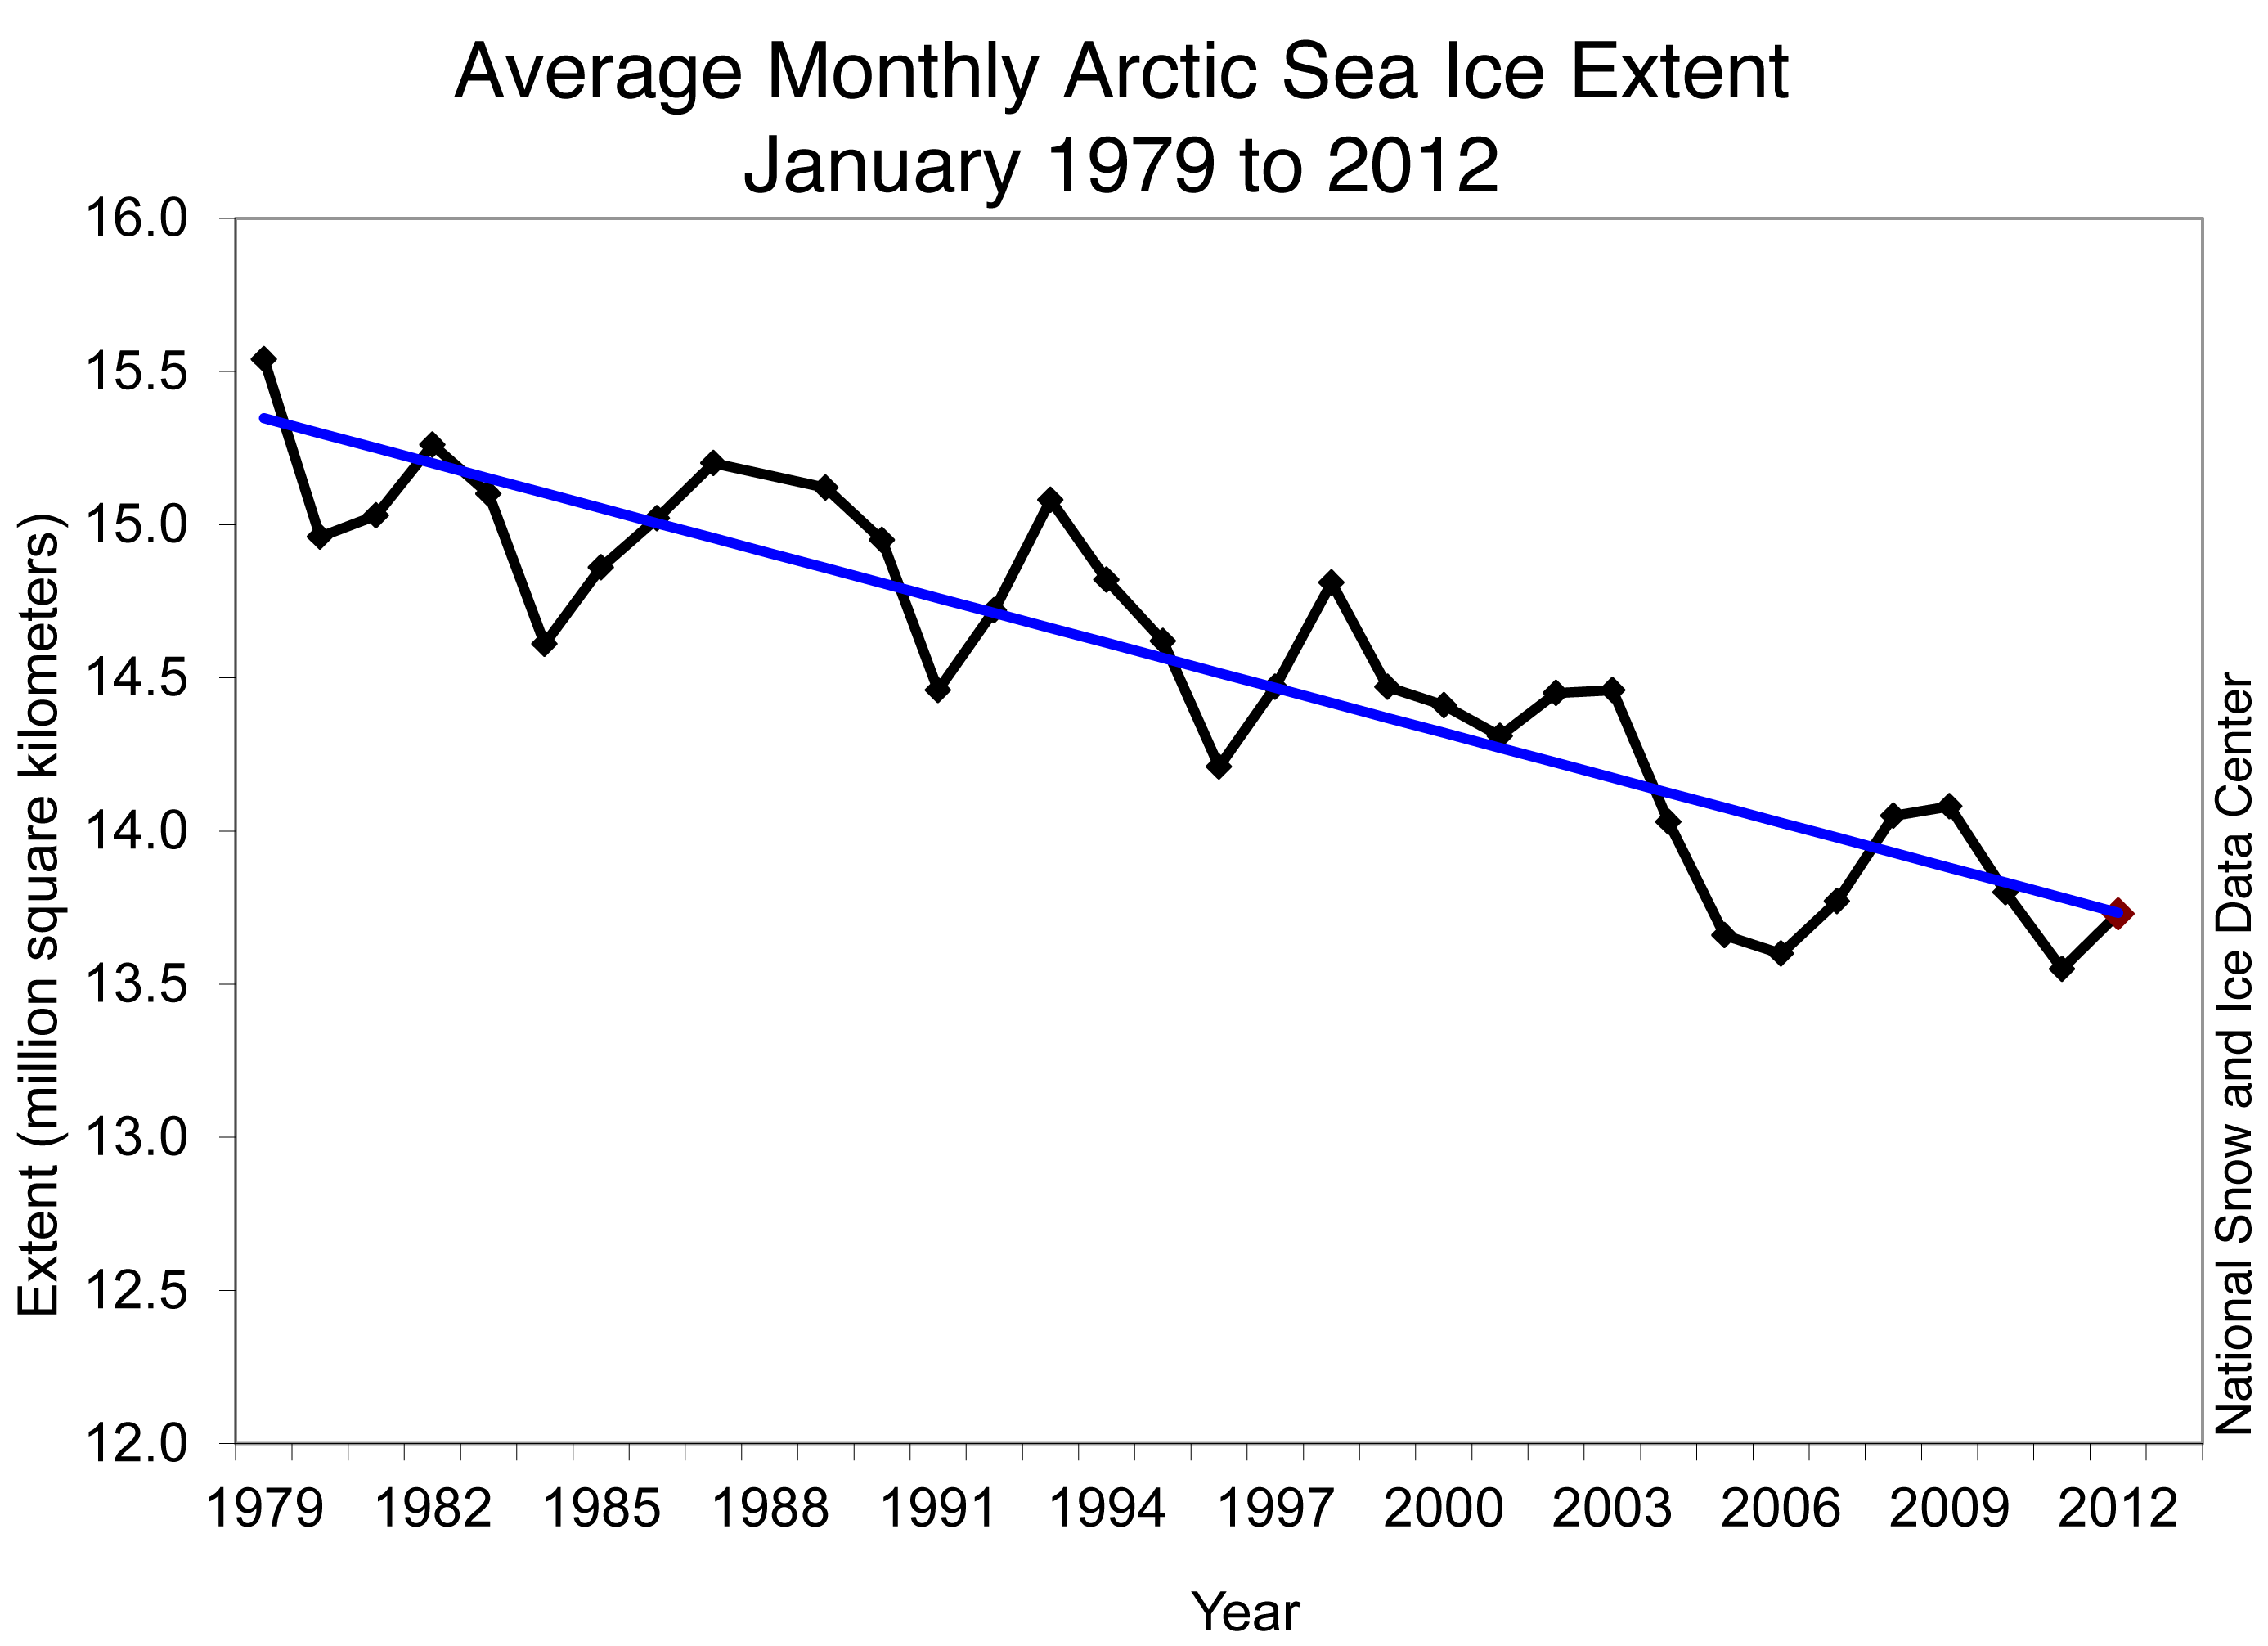
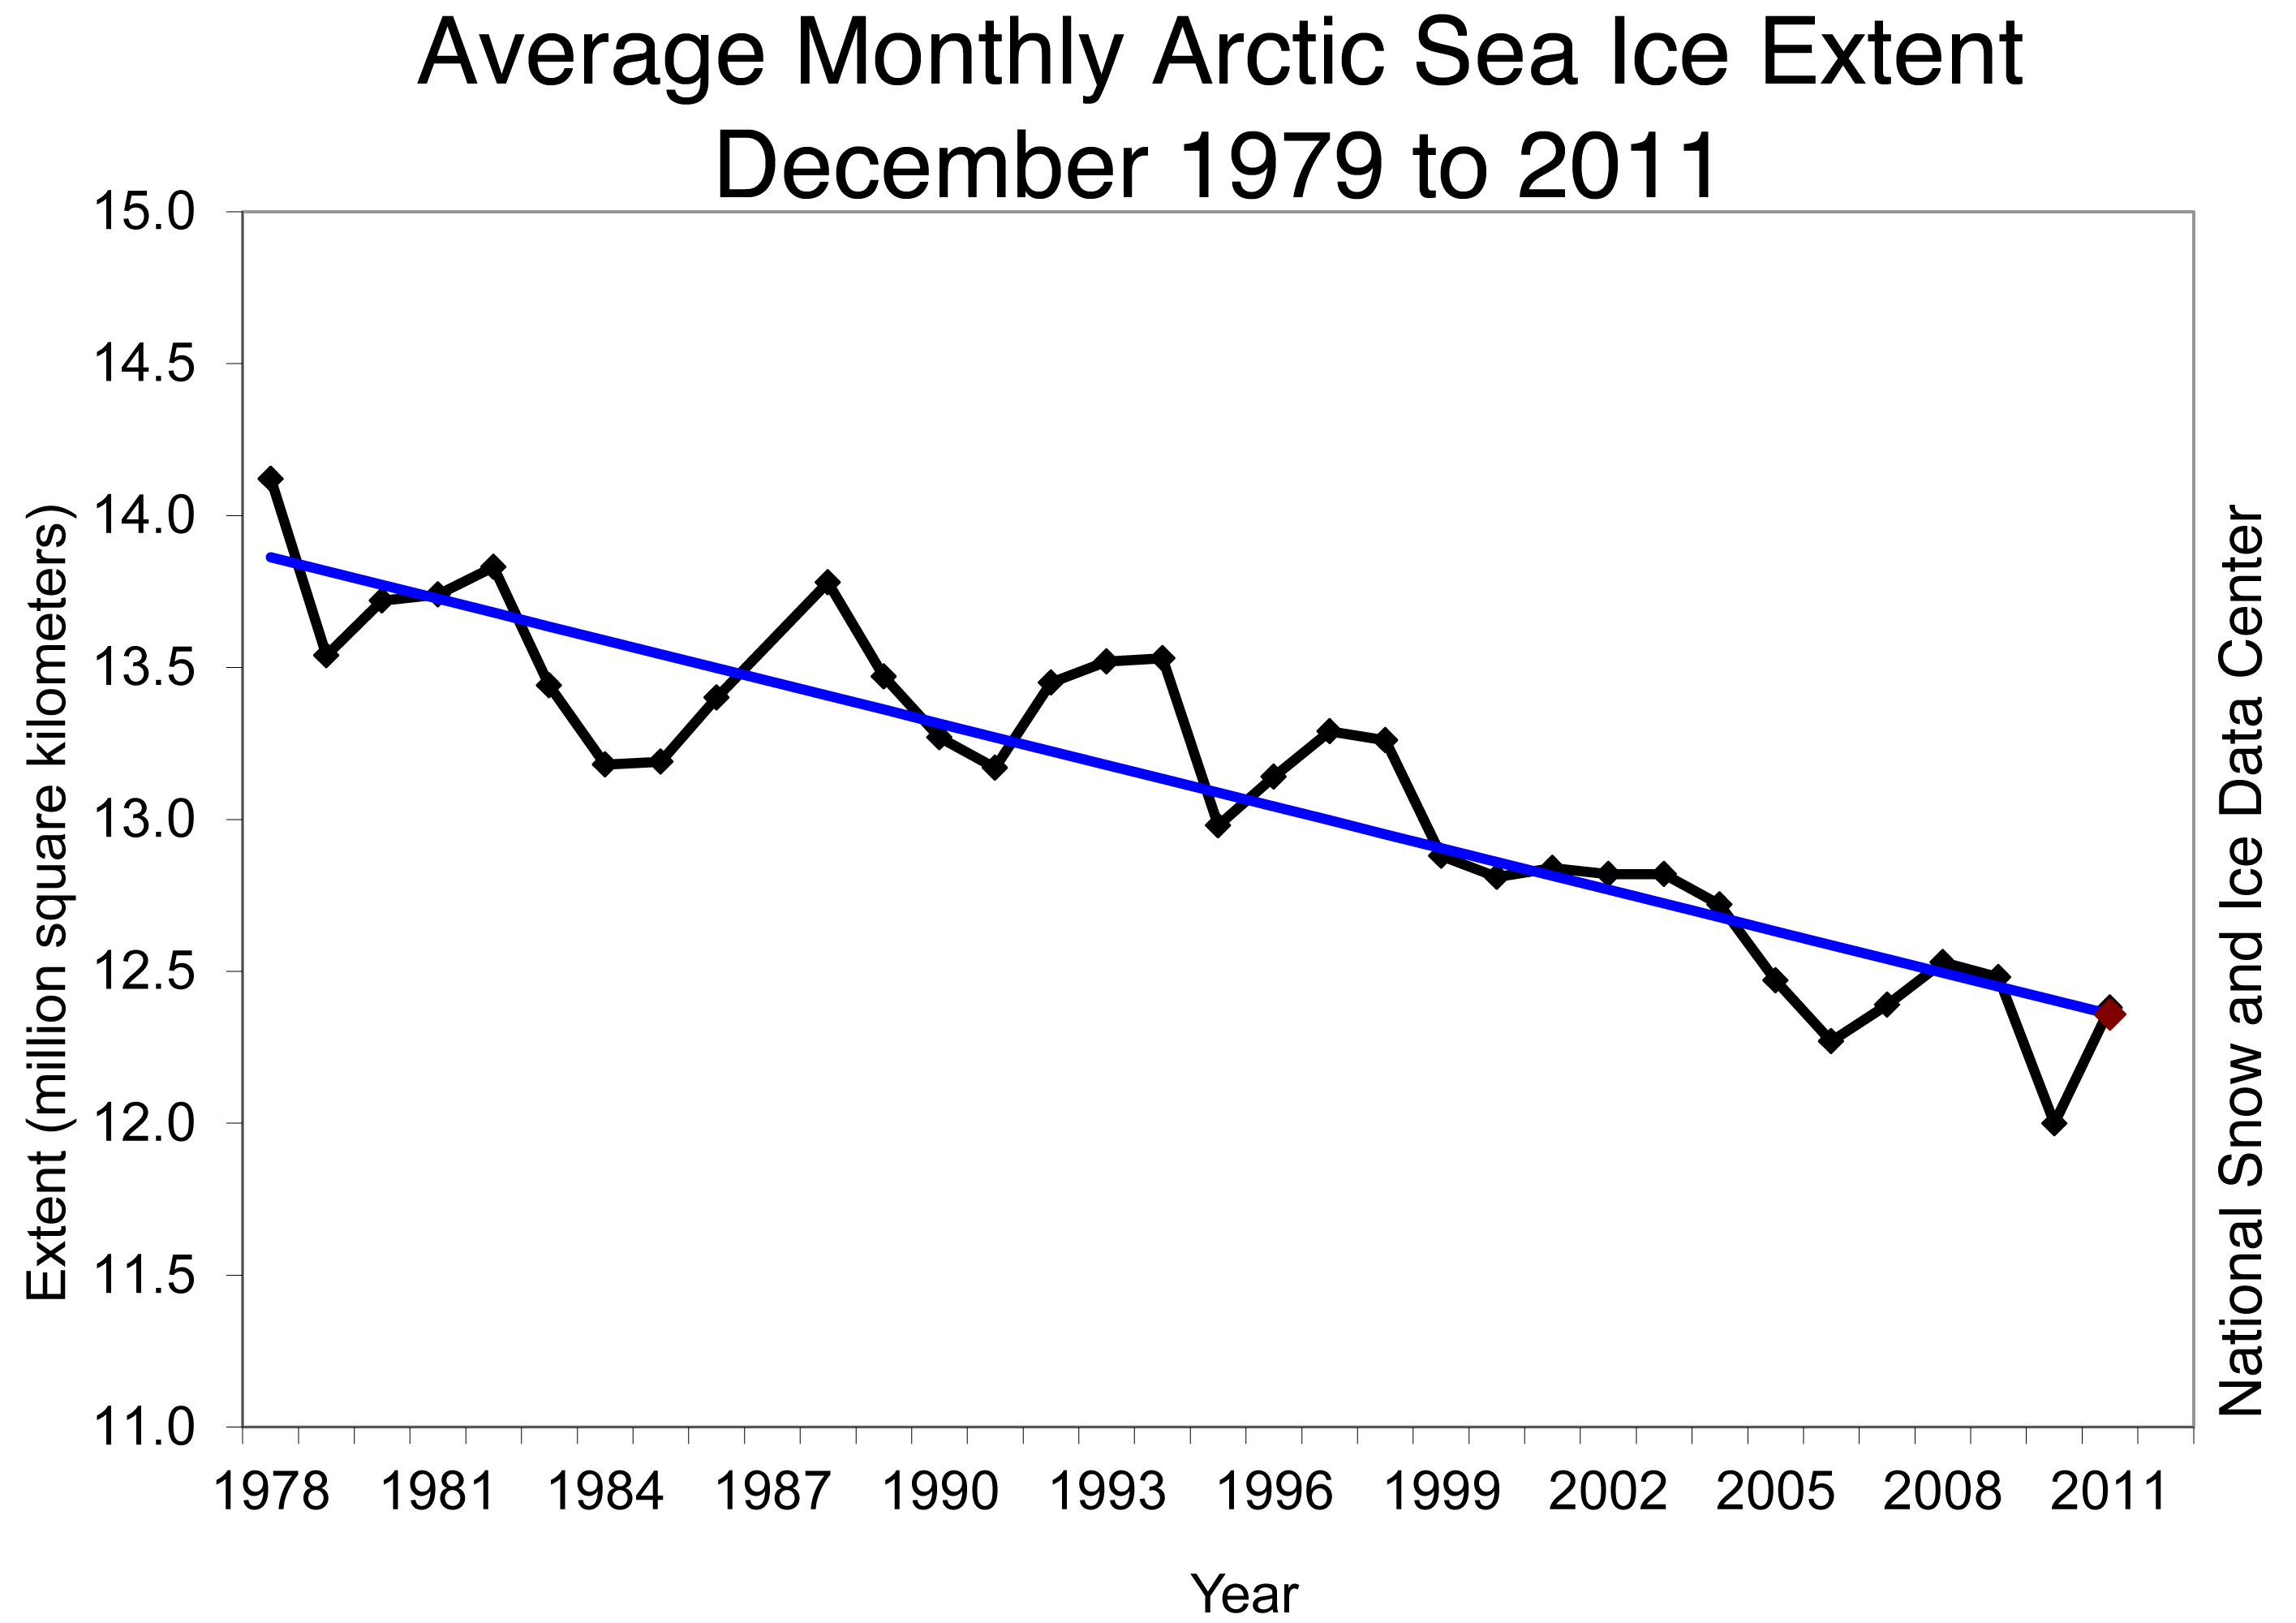
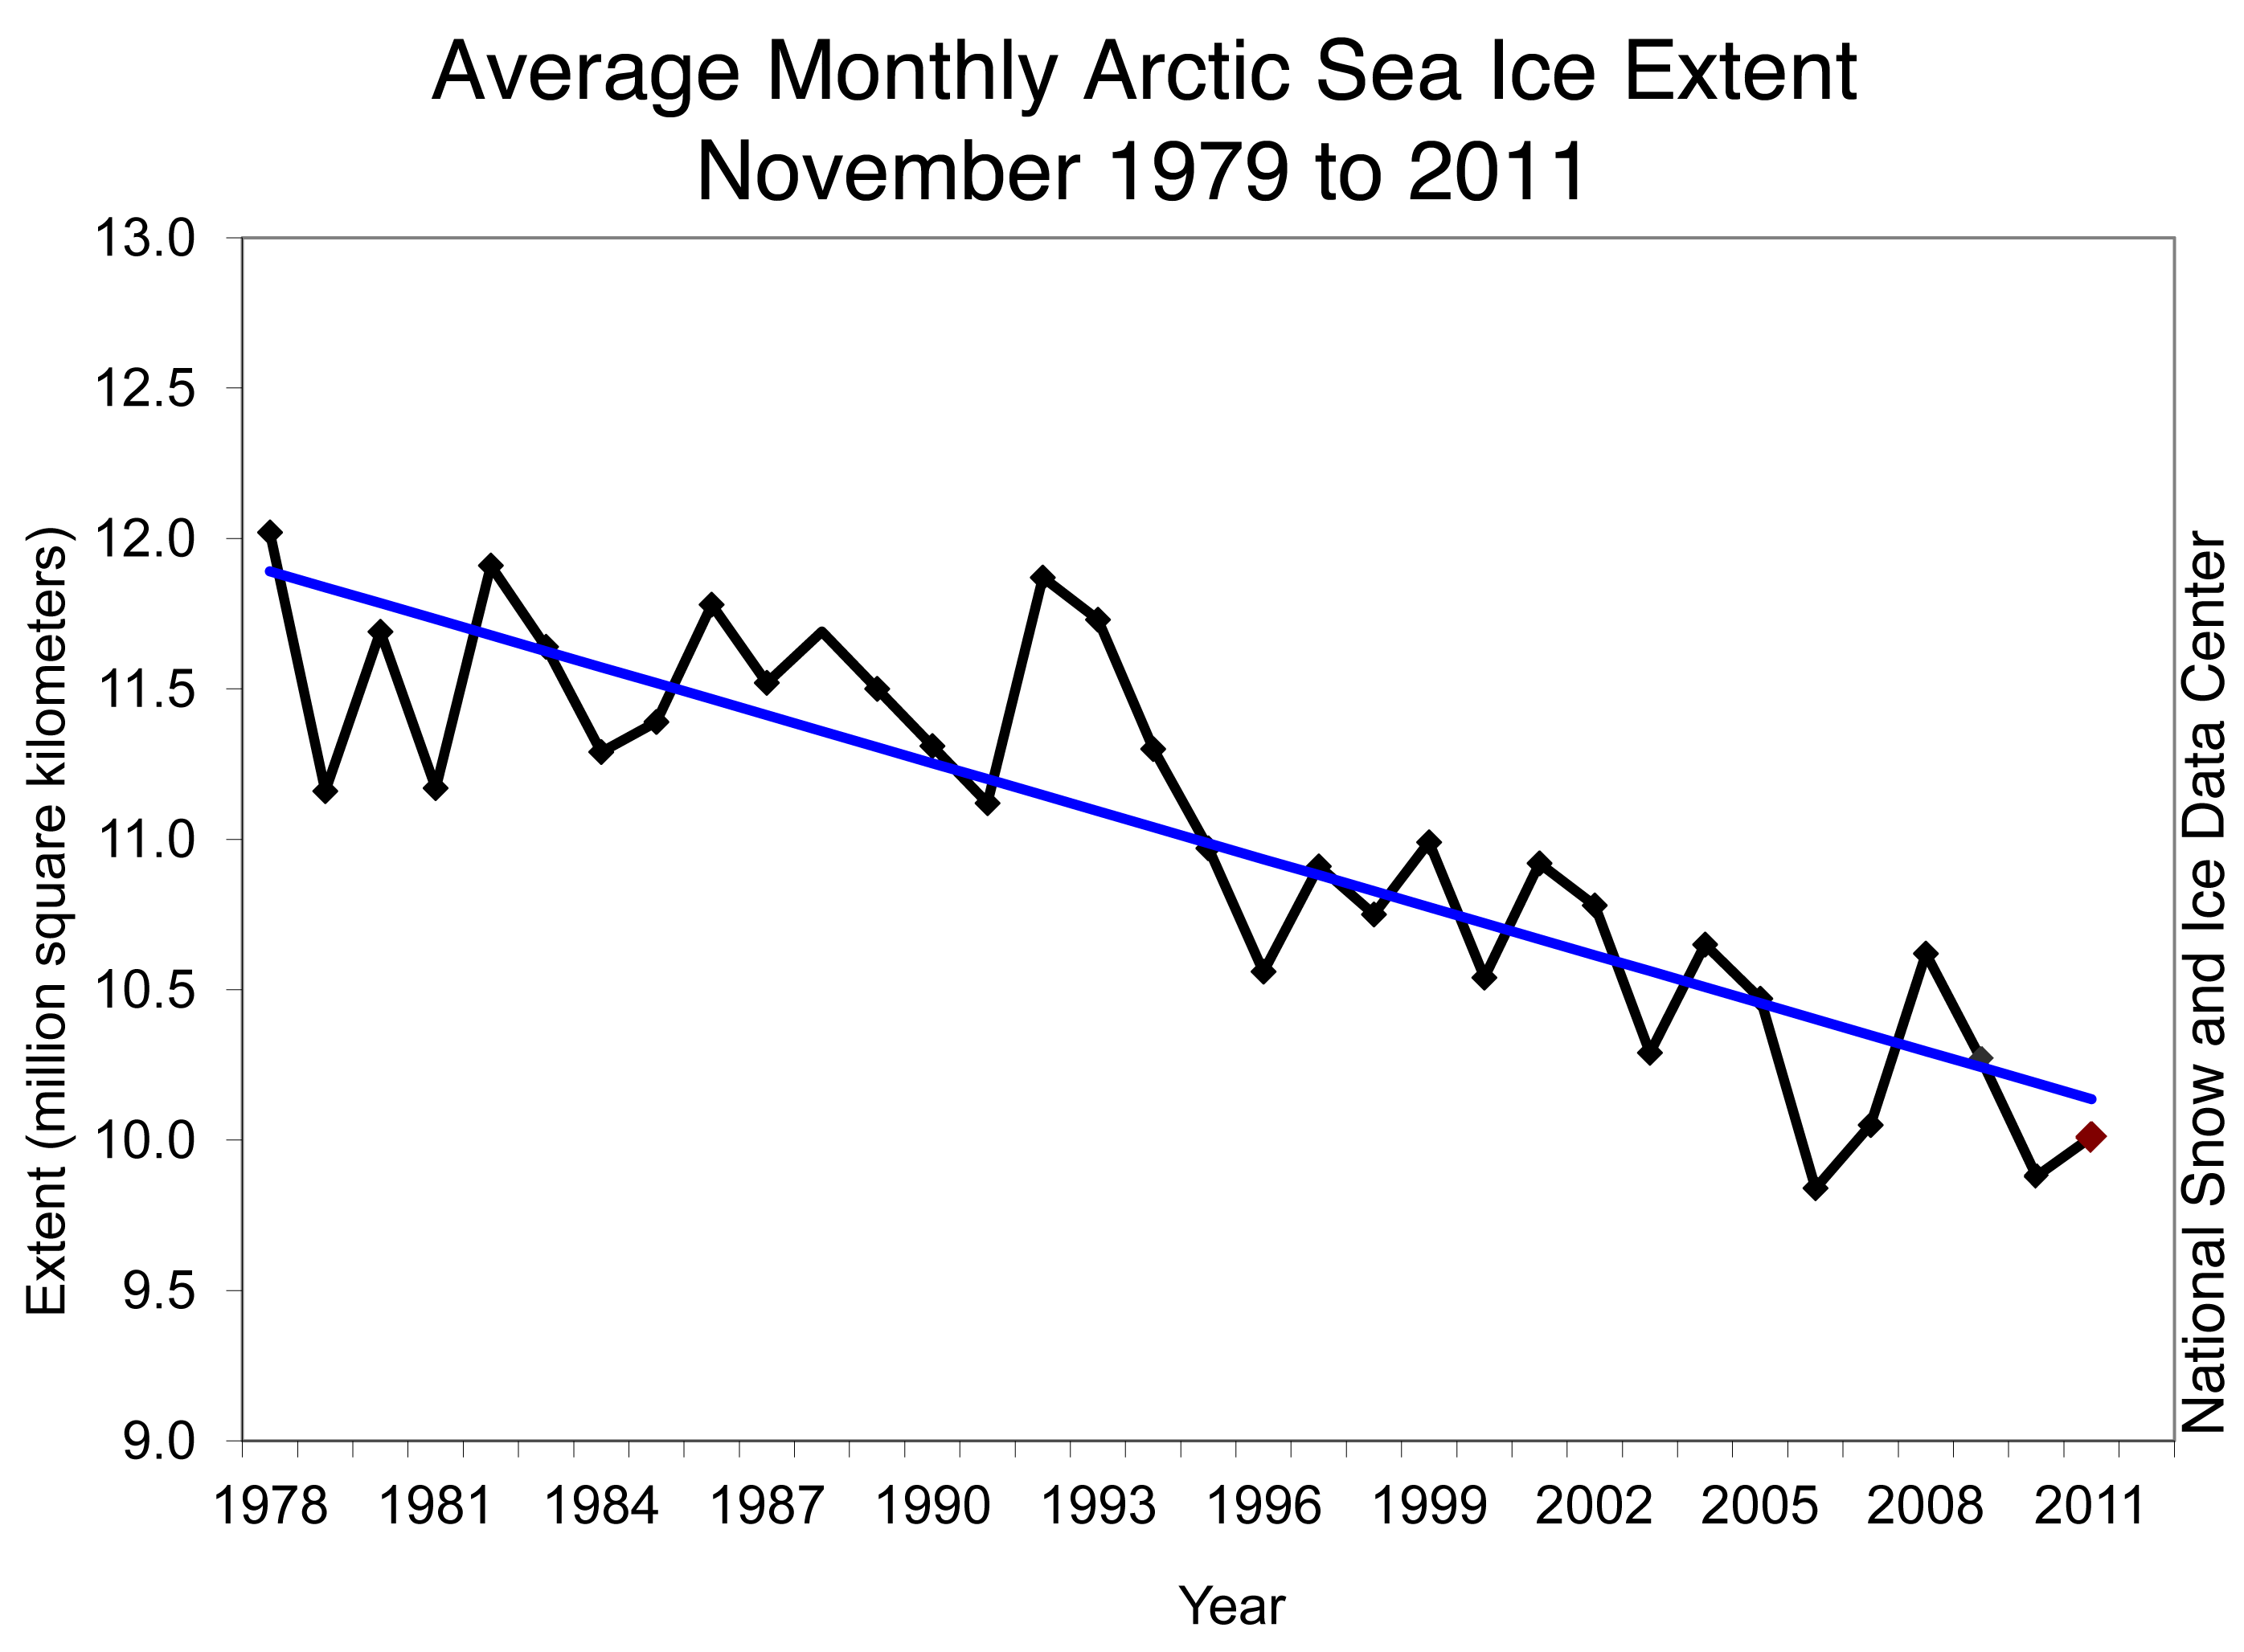
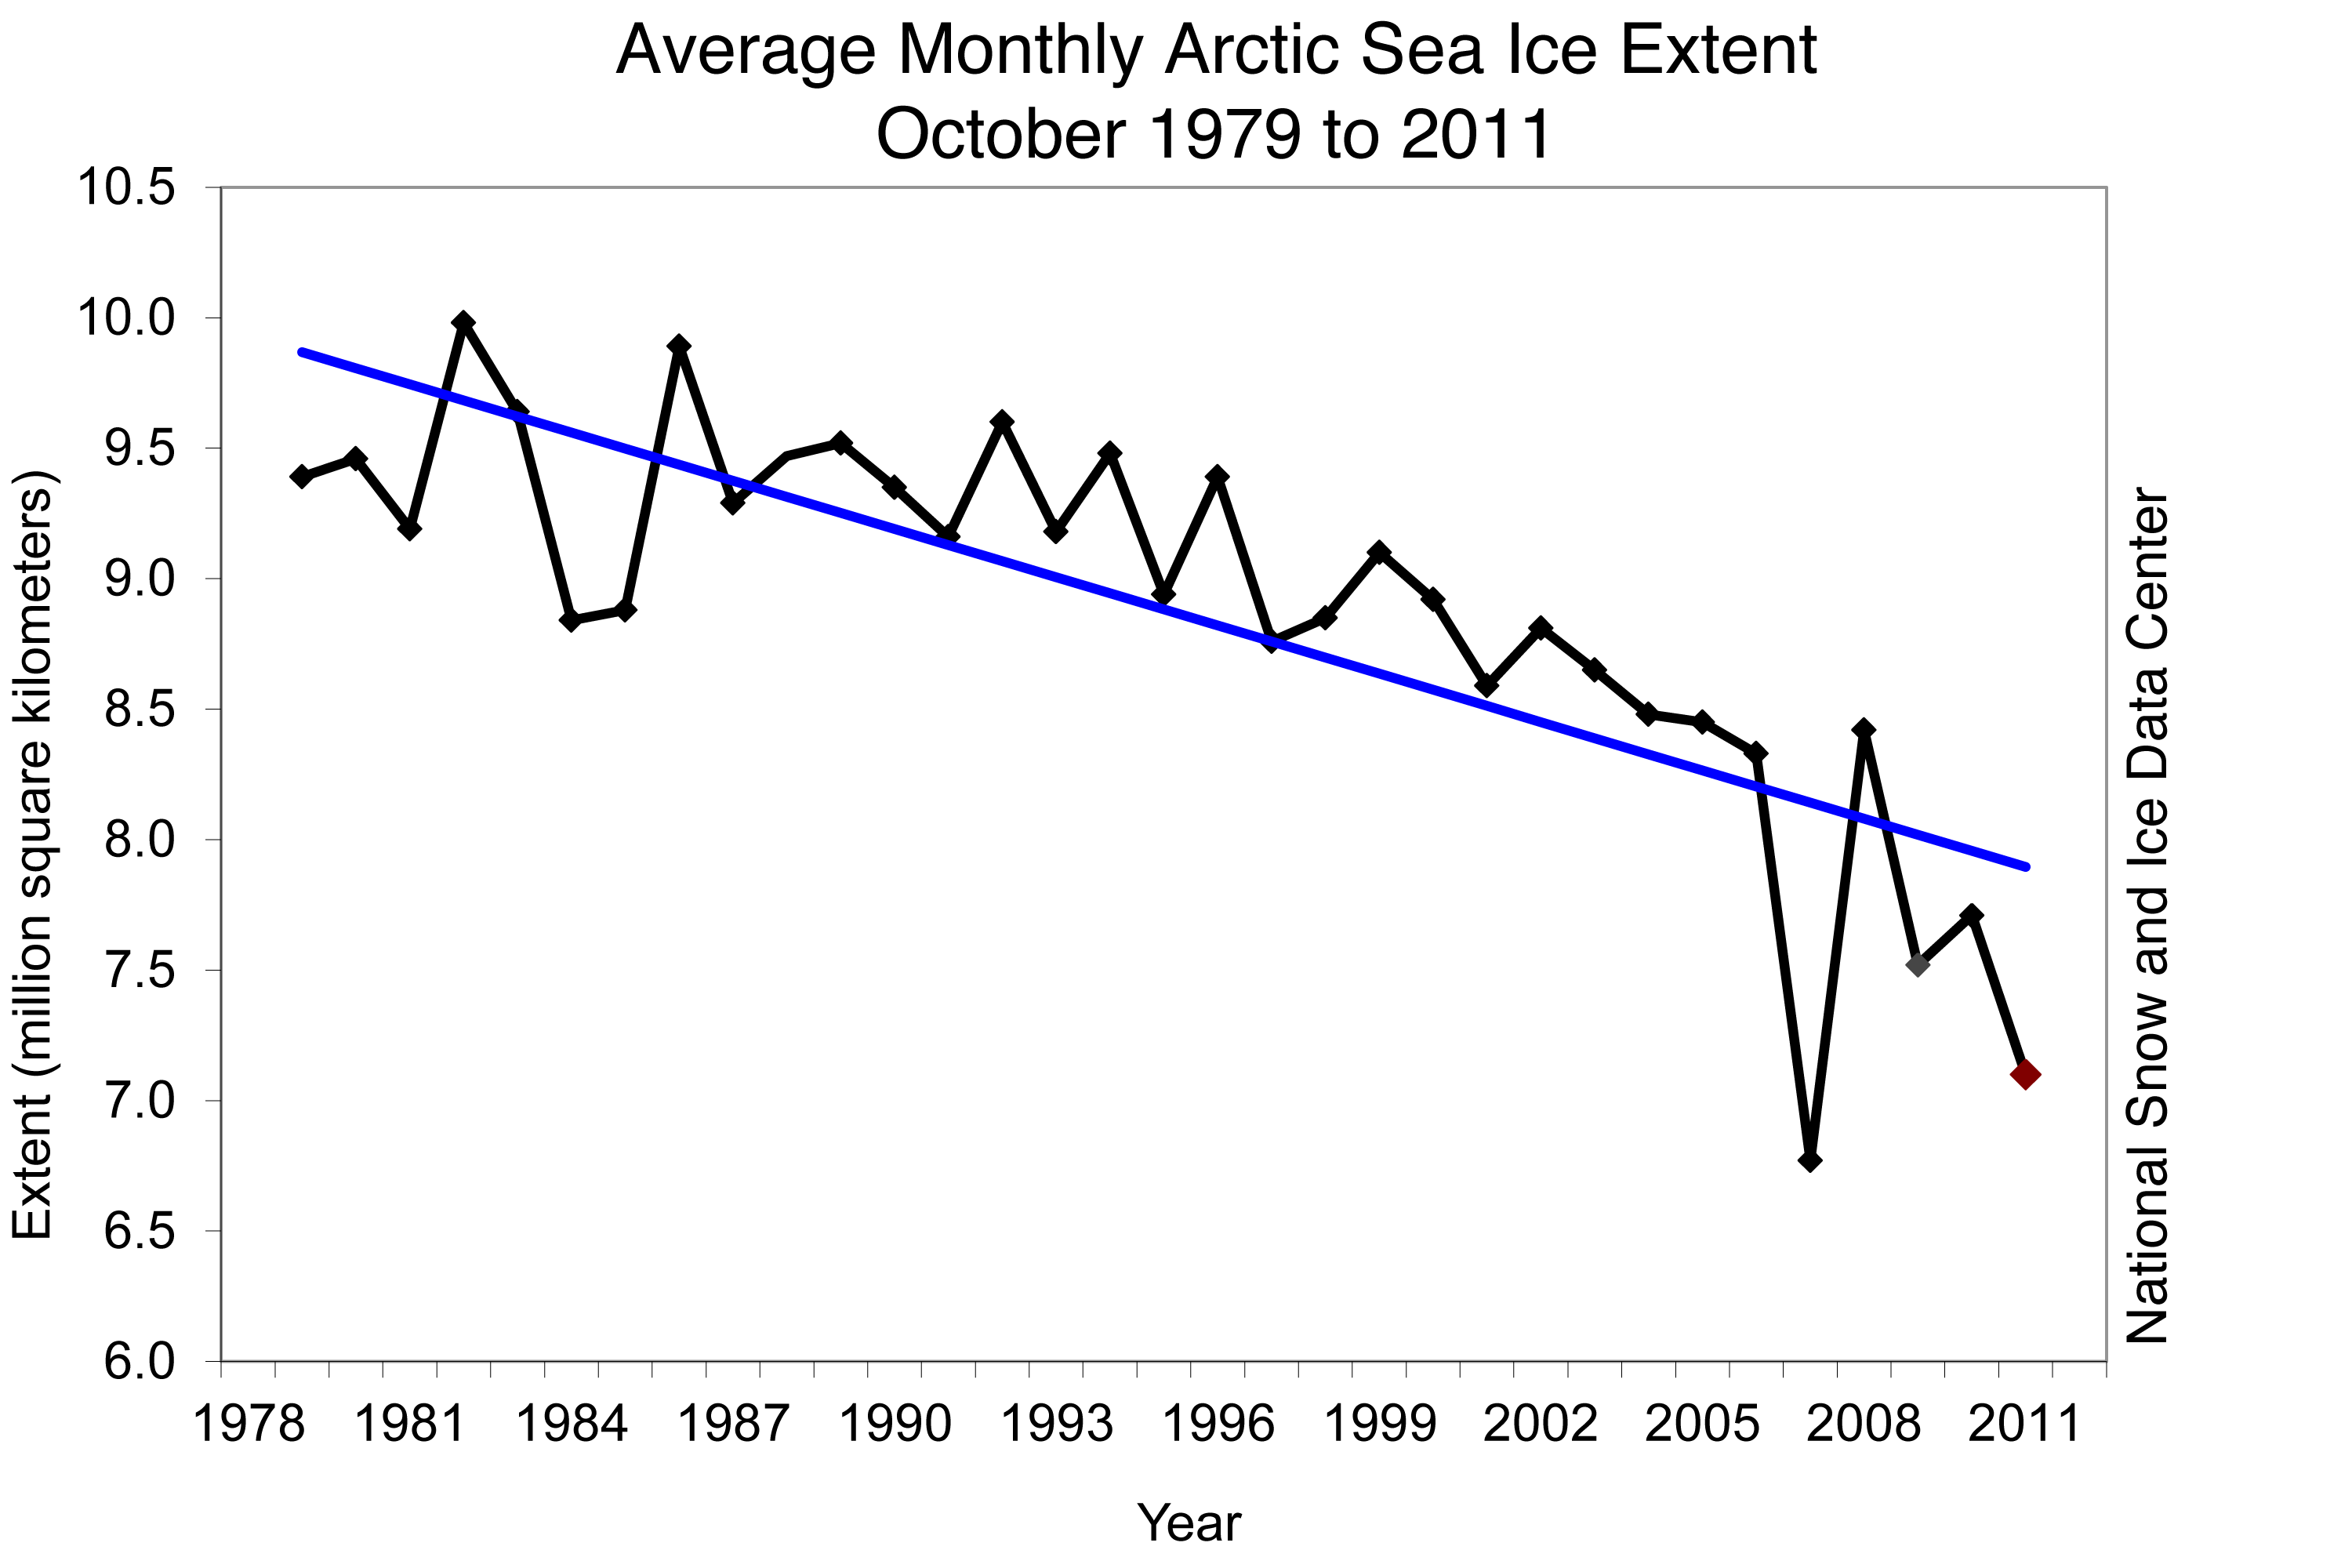
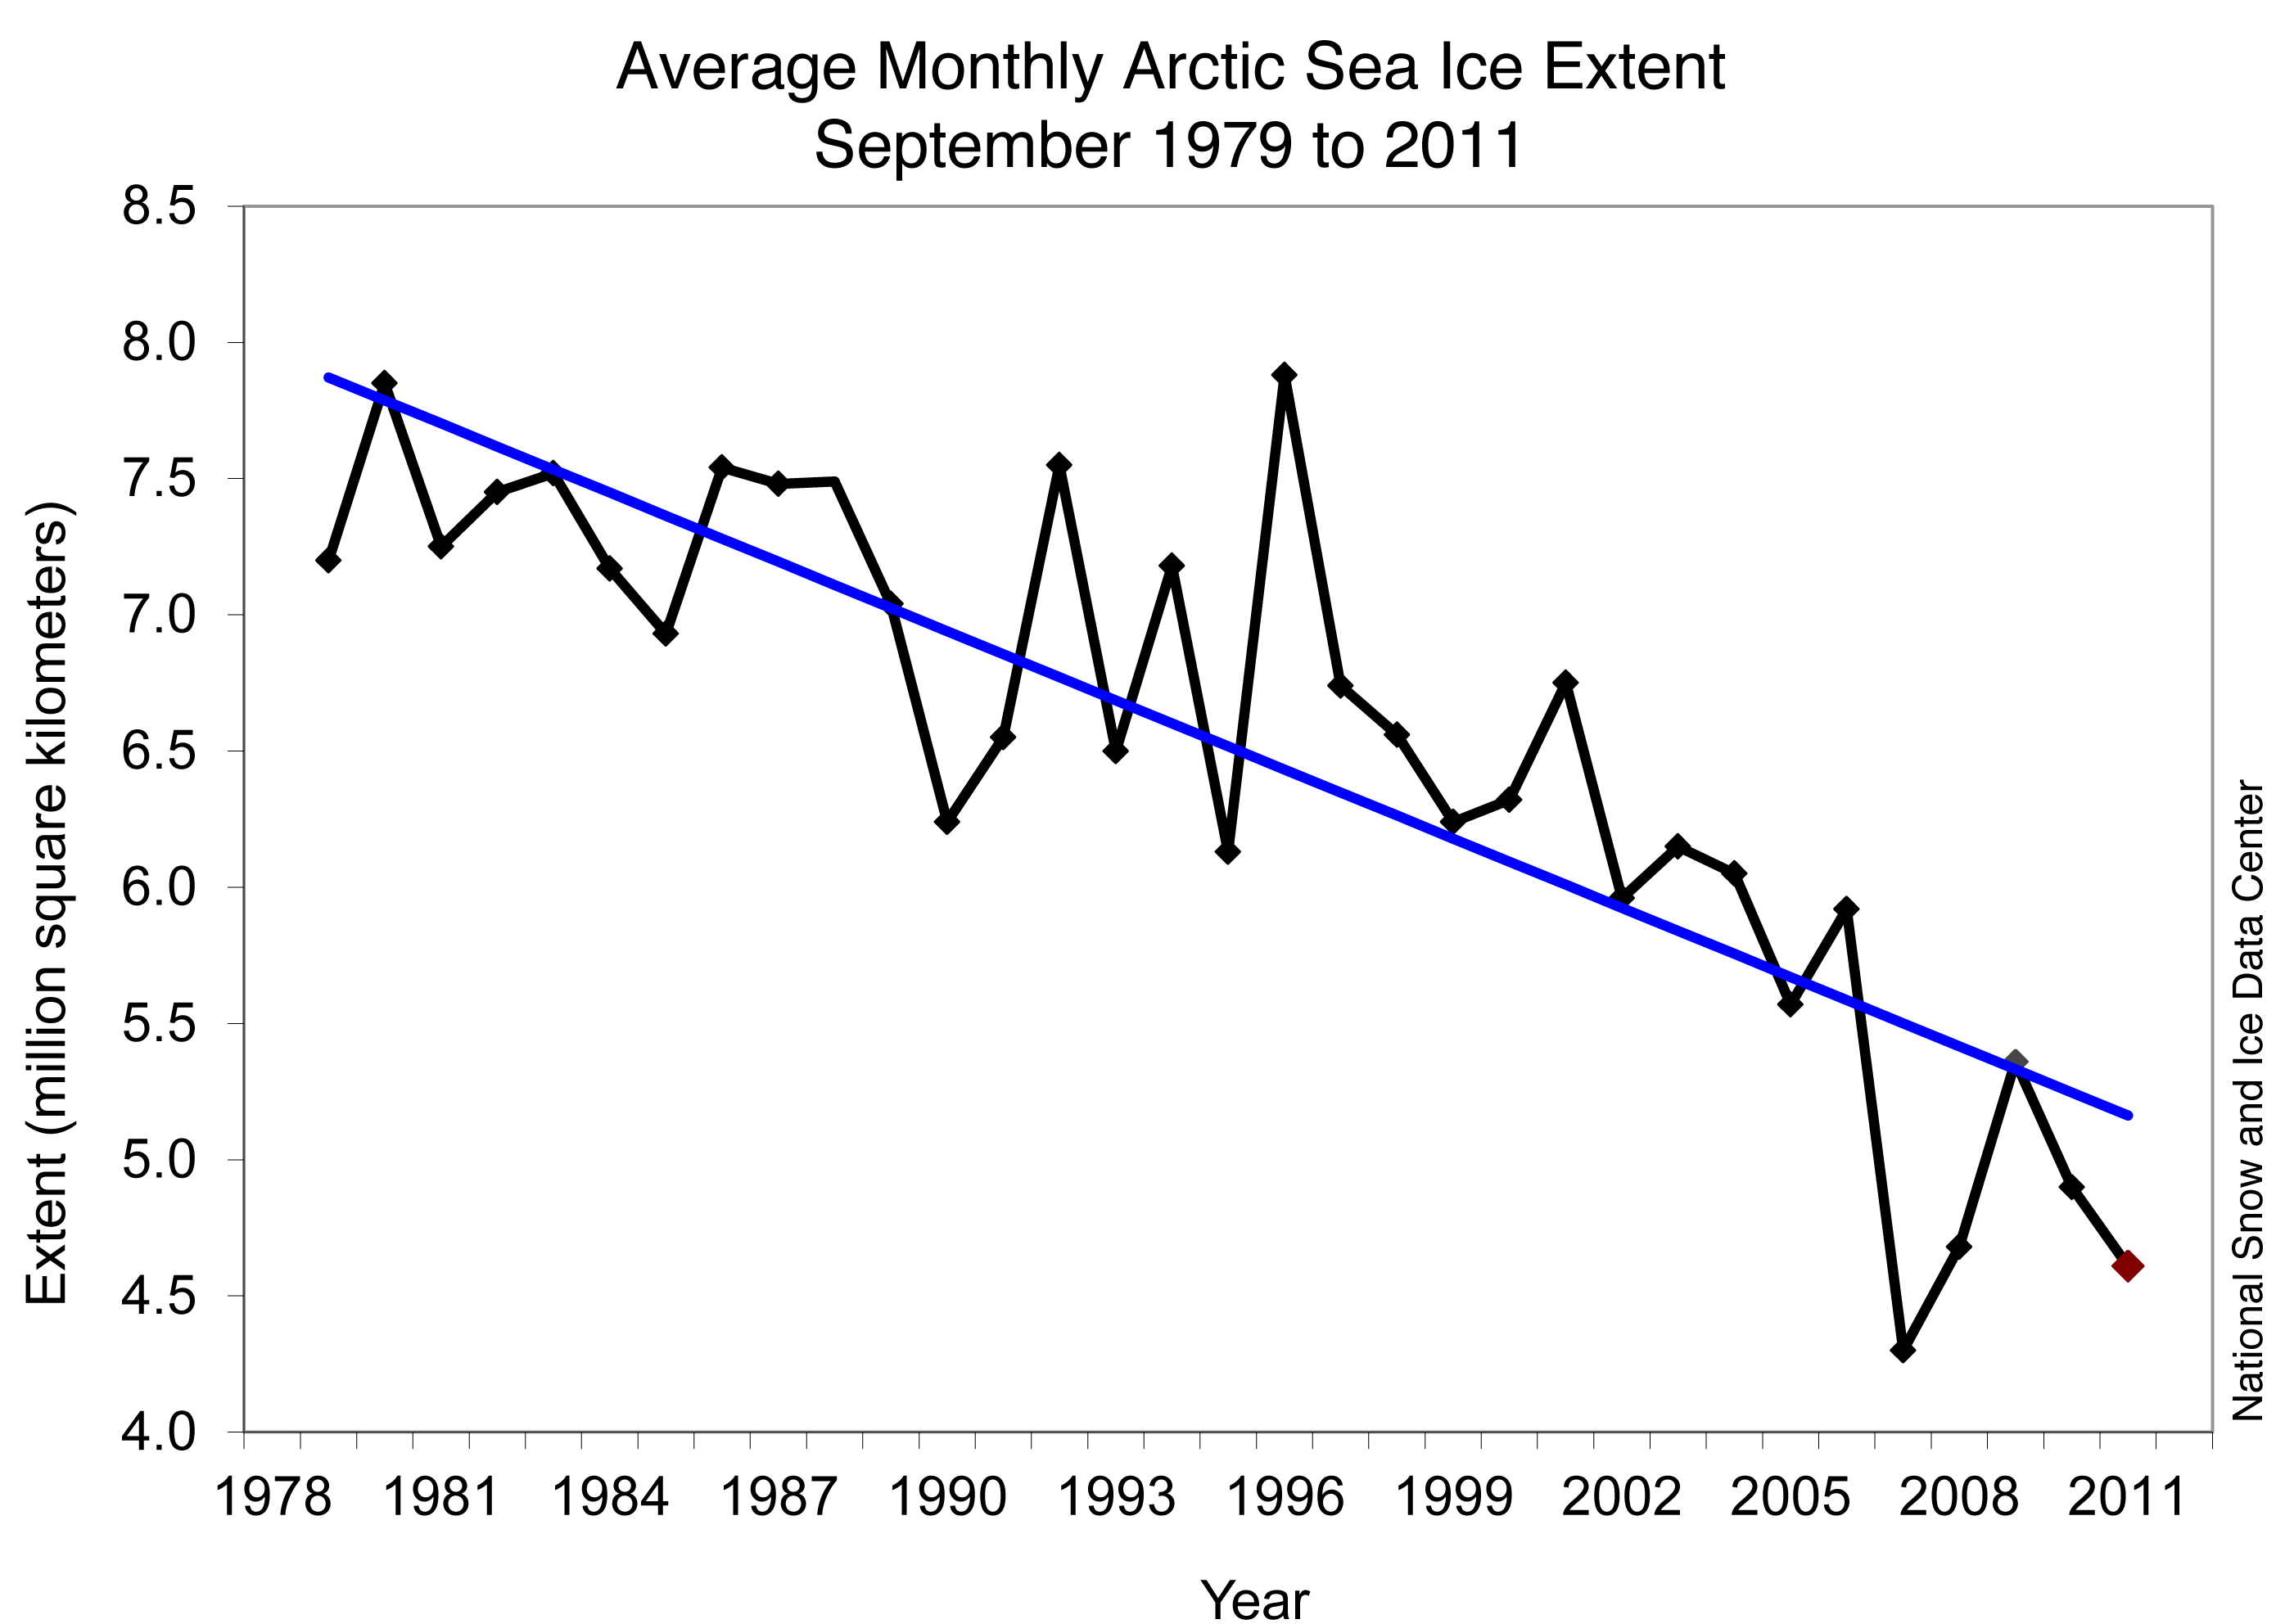
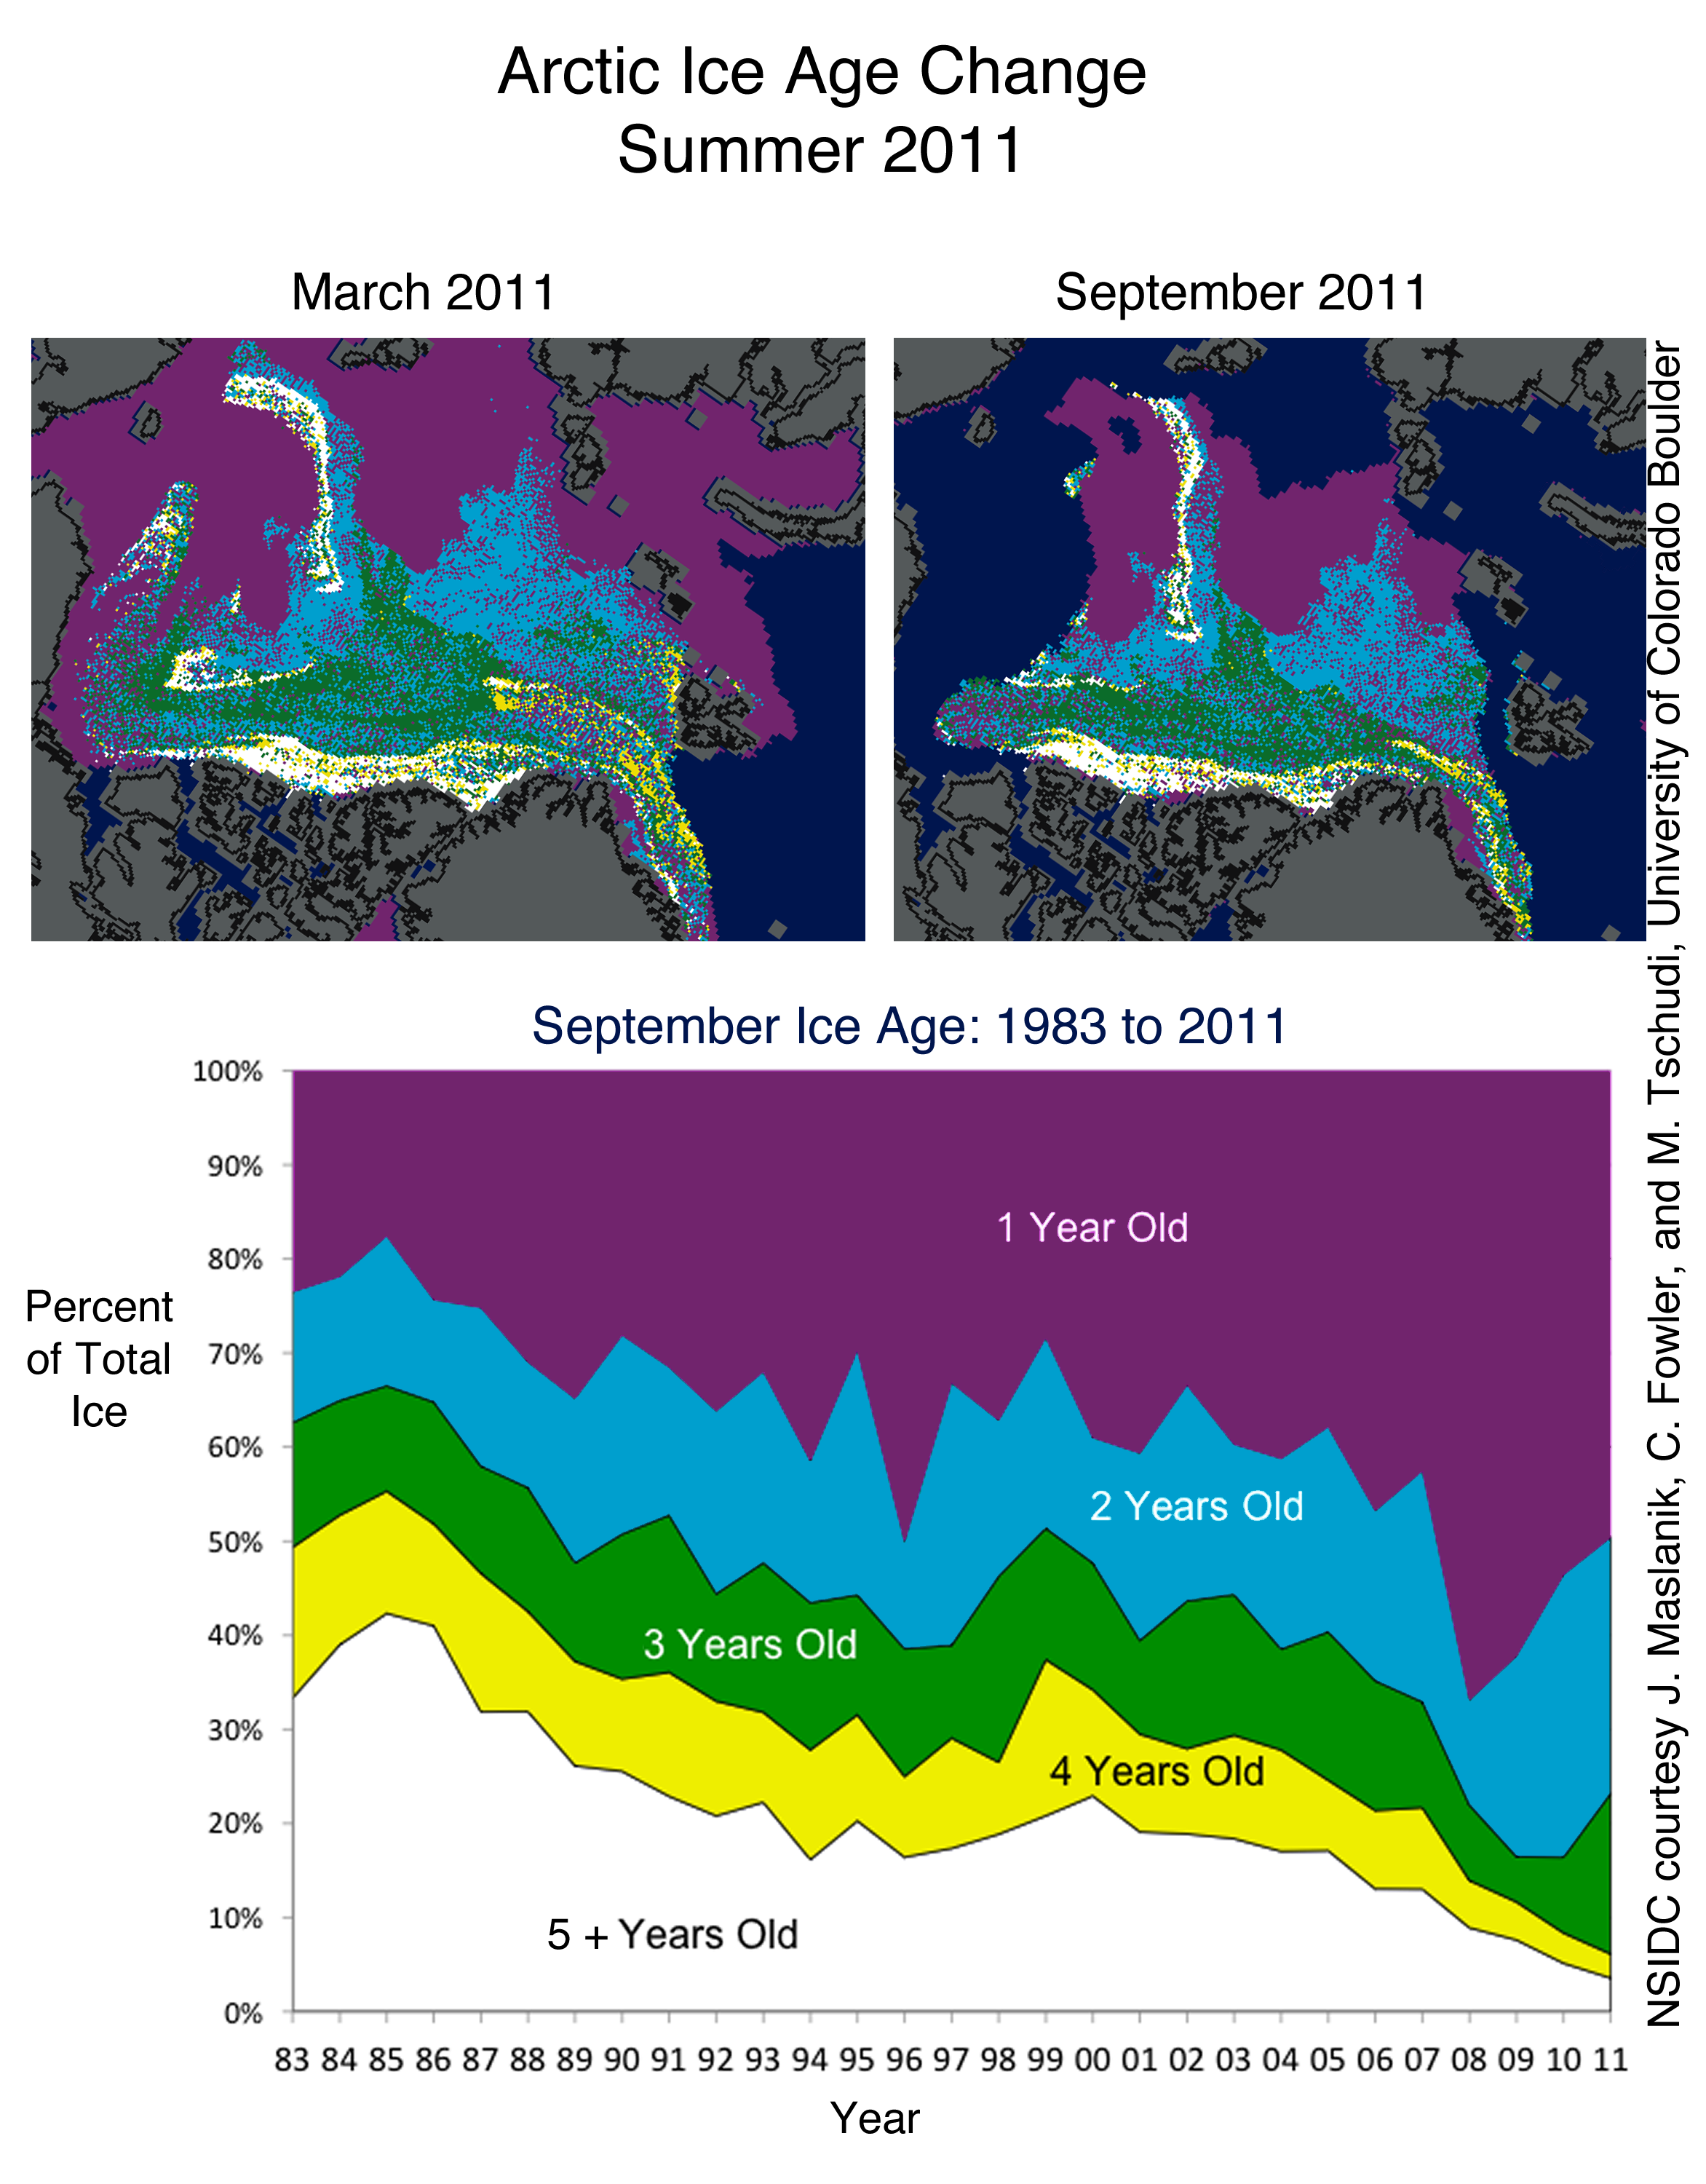
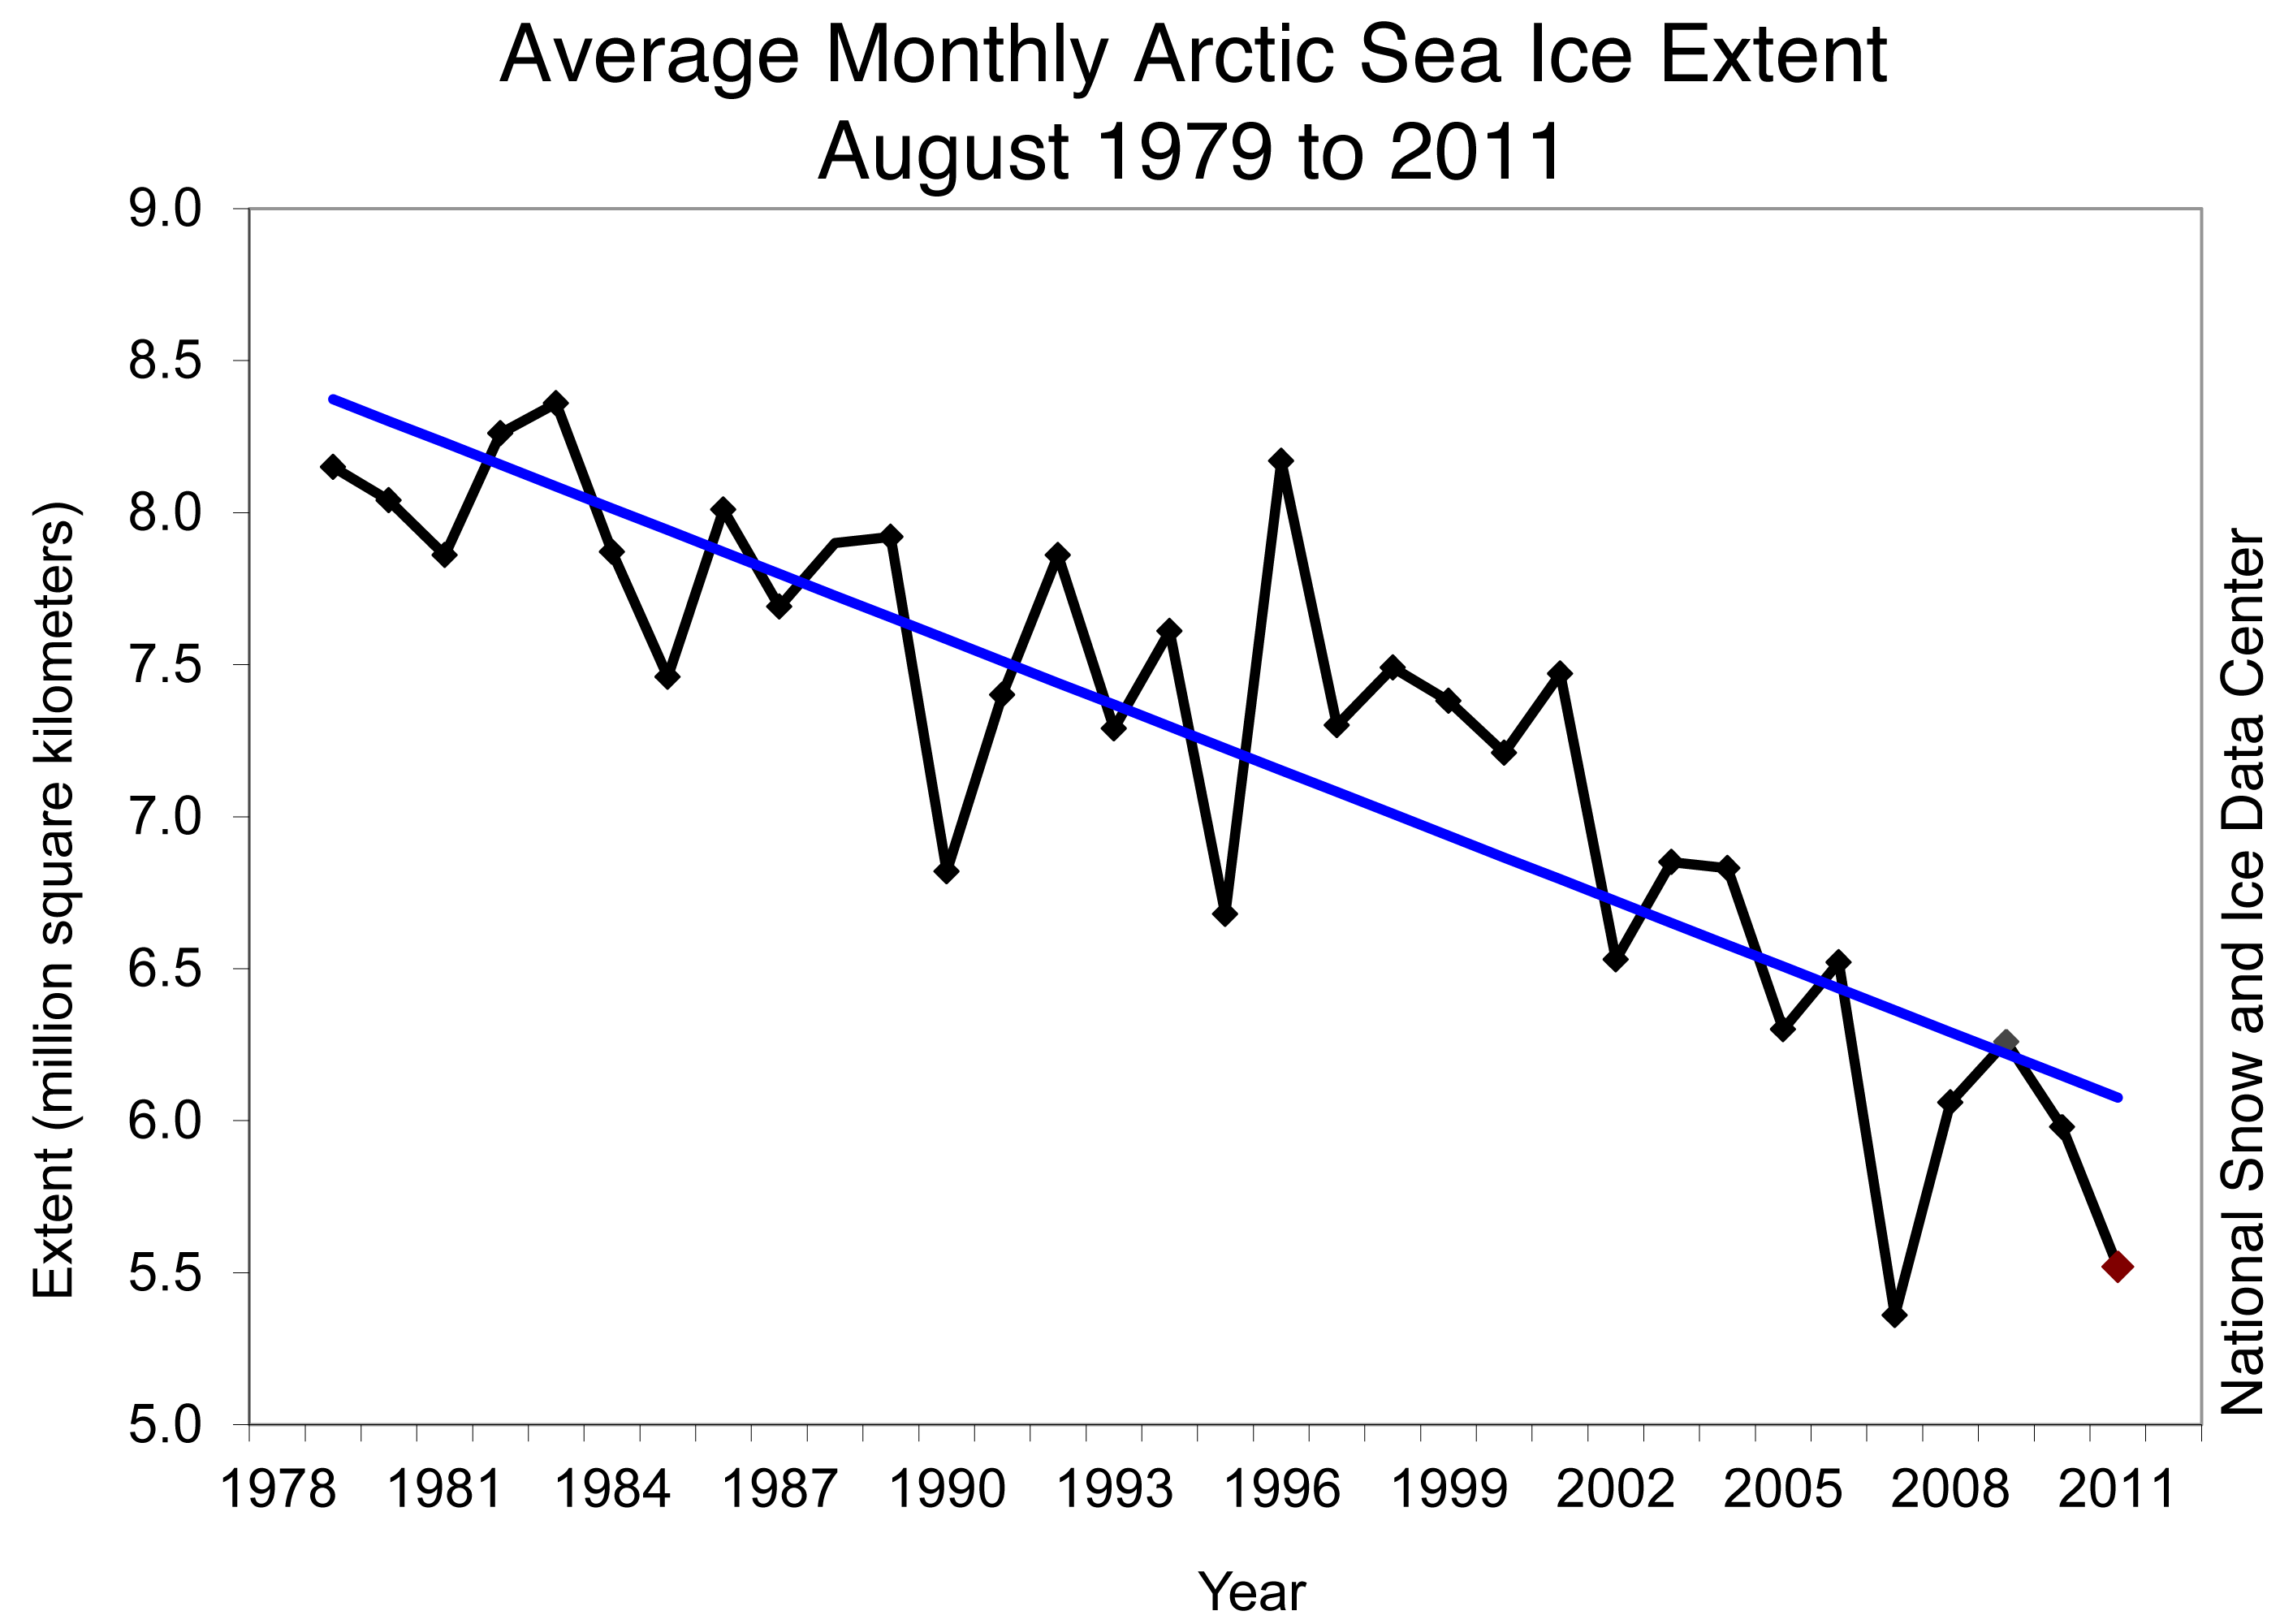
Monthly February ice extent for 1979 to 2012 shows a decline of 3.0% per decade.

Credit: National Snow and Ice Data Center
High-resolution image

February 2012 compared to past years
Arctic sea ice extent for February 2012 was the fifth lowest in the satellite record. Including the year 2012, the linear rate of decline for February ice extent over the satellite record is 3.0% per decade. Based on the satellite record, through 2003, average February ice extent had never been lower than 15 million square kilometers (5.79 million square miles). February ice extent has not exceeded that mark eight out of the nine years since 2003.

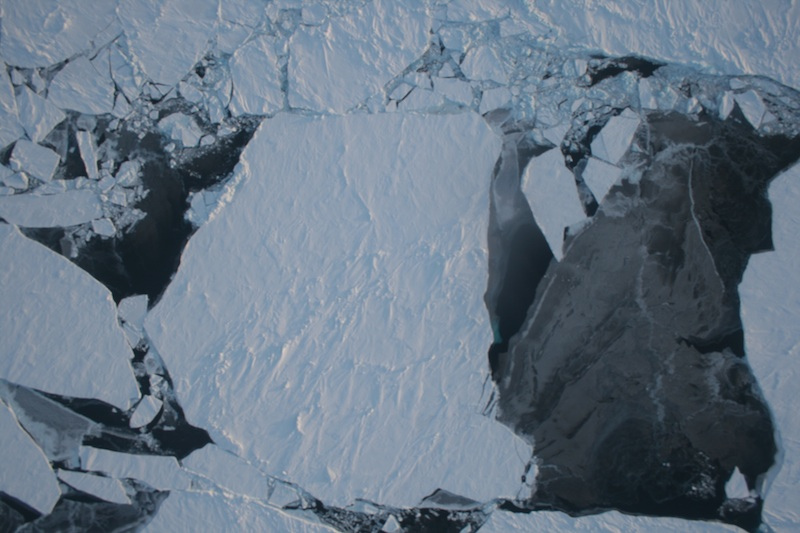
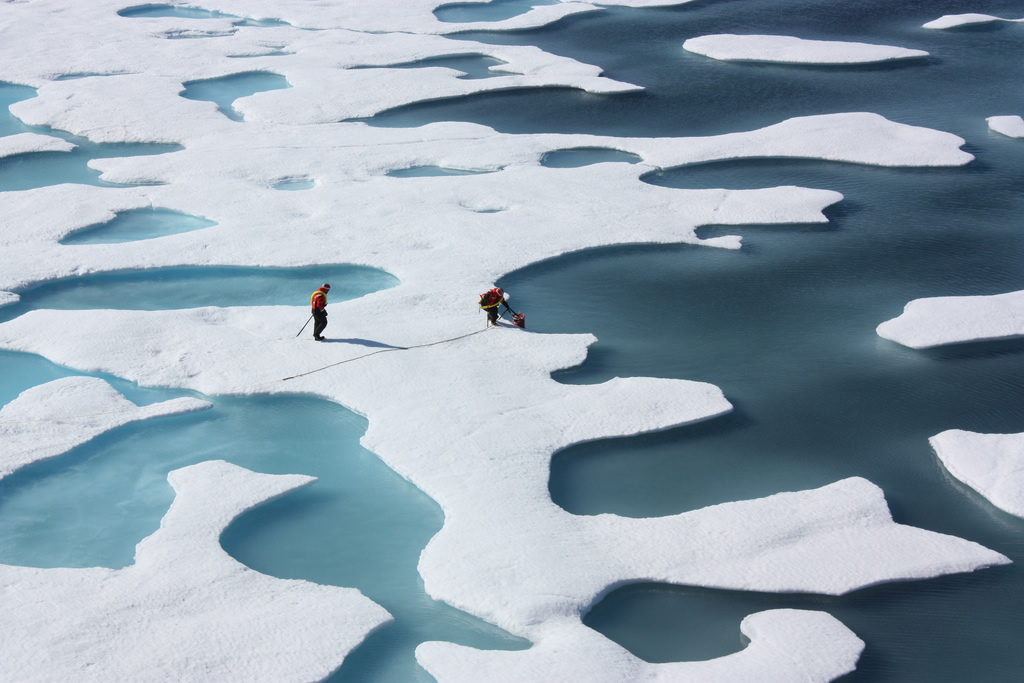
This photograph of sea ice near Greenland was taken on March 18, 2011 from the NASA P3 aircraft. The IceBridge mission is collecting data on ice thickness, an important measure of the health of sea ice.

Credit: NASA/ATM automatic Cambot system
High-resolution image

IceBridge thickness data
Measuring ice thickness is critical to assessing the overall health of Arctic sea ice. The passive microwave data that NSIDC presents here provide only ice extent, a two-dimensional measure of ice cover. But ice can vary in thickness from a few centimeters to several meters, and scientists want to know if the ice pack is thinning overall as well as declining in extent. A new study by NASA scientist Ron Kwok compared ice thickness data collected by airplanes during the ongoing Operation IceBridge with thickness data from the NASA Ice, Cloud and Land Elevation Satellite (ICESat), which ended its mission in 2009. IceBridge is an airborne data-collection mission that started in 2009, in order to bridge the data gap between the first ICESat and ICESat-2, which is scheduled to launch in 2016.

Kwok found good agreement between simultaneous IceBridge and ICESat freeboard measurements made in 2009. Freeboard is the elevation of sea ice above the ocean surface, and provides a measure of ice thickness. These results show that IceBridge measurements will be able to bridge the gap between the ICESat and ICESat-2 satellite missions and add to other ice thickness data from the European Space Association (ESA) Cryosat-2. Satellite measurements of ice thickness provide a third dimension of information on the changing sea ice cover, helping scientists to more accurately assess the amount of sea ice in the Arctic.

Data collected by the IceBridge mission is archived and distributed by the NSIDC IceBridge Data program.

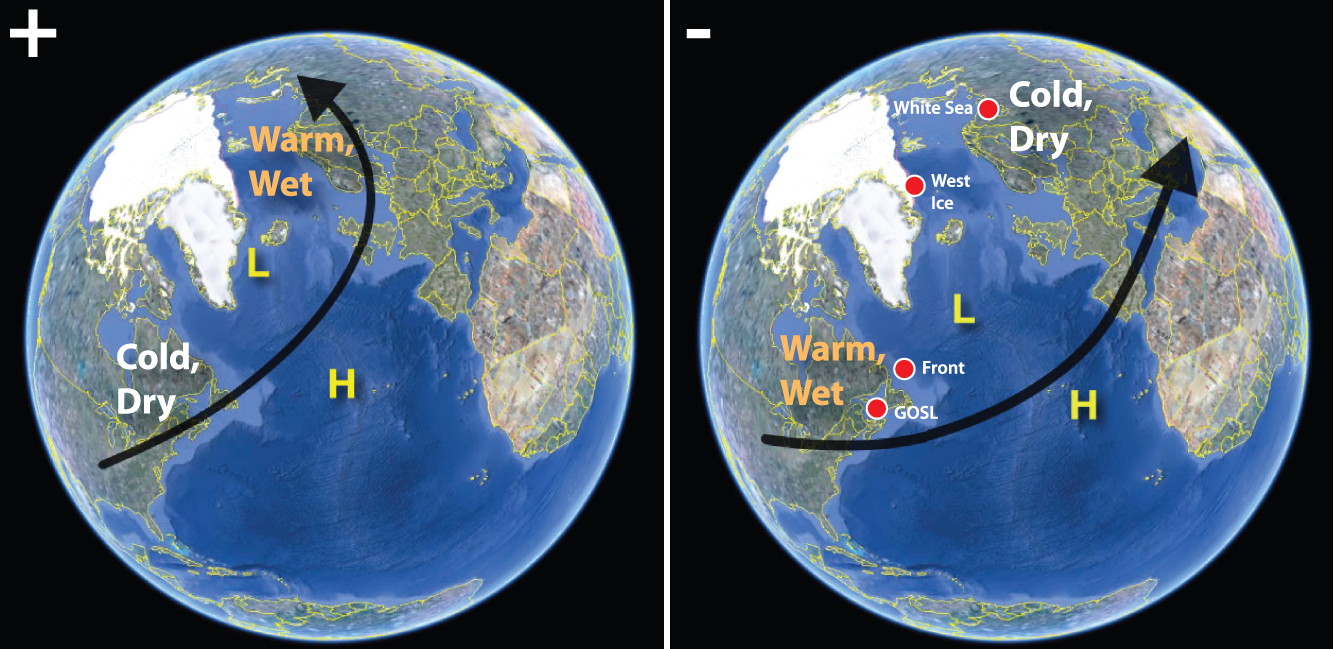
These images show the general effects of the positive phase (left) and negative phase (right) of the NAO. Red dots show the location of harp seal breeding grounds.

Credit: Johnston, et. al., 2012
High-resolution image

Regional ice conditions and harp seals
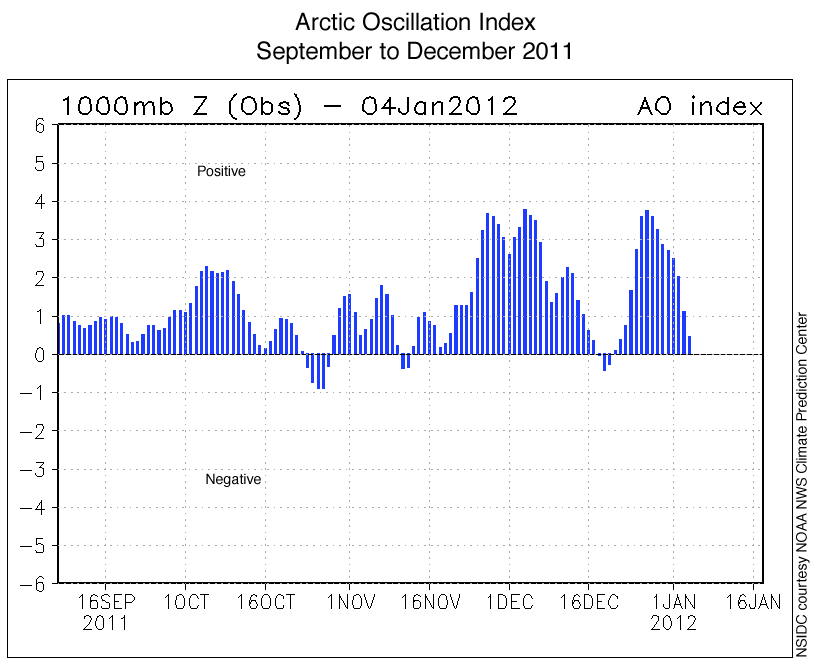
Many animals rely on sea ice as part of their habitat. Harp seals, for example, give birth to and care for their young on floes of sea ice. Recent research by David Johnston and colleagues at Duke University showed that harp seals in the northwest Atlantic have higher mortality rates during years when the North Atlantic Oscillation (NAO) is in its negative phase, a pattern that favors low ice cover in the Labrador Sea and Gulf of St. Lawrence, where harp seals breed. 

This winter, the NAO has mostly been in a positive phase and ice conditions in the Labrador Sea and Gulf of St. Lawrence have been at near-normal levels. However, in recent years, ice conditions in the region have been very low. The study showed a longer-term decline in sea ice cover of up to 6% per decade across all North Atlantic harp seal breeding grounds since 1979. While harp seals are well-suited to deal with natural short-term shifts in ice conditions, they may not be able to adapt to the combined effects of both short-term variability and long-term climate change.

Further reading
Friedlaender, A.S., D.W. Johnston and P.N. Halpin. 2010. Effects of the North Atlantic Oscillation on sea ice breeding habitats of harp seals (Pagophilus groenlandicus) across the North Atlantic, Progress in Oceanography, 86, 261-266. 

Johnston DW, Bowers MT, Friedlaender AS , Lavigne DM. 2012. The Effects of Climate Change on Harp Seals (Pagophilus groenlandicus). PLoS ONE, 7(1): e29158. doi:10.1371/journal.pone.0029158.

Kwok, R., G.F. Cunningham, S.S. Manizade and W.B. Krabill. 2012. Arctic sea ice freeboard from IceBridge acquisitions in 2009: Estimates and comparisons with ICESat, Journal of Geophysical Research, Vol. 117, C02018, doi:10.1029/2011JC007654.

Arctic ice extent low overall, high in the Bering Sea

Overall, Arctic sea ice extent remained lower than average in January. However, in the Bering Sea, ice extent was much greater than normal. The heavy ice cover caused problems for fishermen and made for an arduous late-season resupply mission to Nome, Alaska. The Arctic Oscillation, which had been in its positive phase most of the winter so far, switched to a negative mode, bringing cold weather to Europe and changing the direction of sea ice movement.

Figure 1. Arctic sea ice extent for January 2012 was 13.73 million square kilometers (5.30 million square miles). The magenta line shows the 1979 to 2000 median extent for that month. The black cross indicates the geographic North Pole. Sea Ice Index data.

Credit: National Snow and Ice Data Center
High-resolution image

Overview of conditions
Arctic sea ice extent in January 2012 averaged 13.73 million square kilometers (5.30 million square miles). This is the fourth-lowest January ice extent in the 1979 to 2012 satellite data record, 1.10 million square kilometers (425,000 square miles) below the 1979 to 2000 average extent.

As in December, ice extent was lower than normal on the Atlantic side of the Arctic, especially in the Barents Sea. However, on the other side of the Arctic, ice extent in the Bering Sea was much greater than average, reaching the second-highest levels for January in the satellite record. The greater-than-normal ice extent in the Bering Sea partly compensated for low ice extent on the Atlantic side of the Arctic Ocean, but ice extent as a whole remained far below average.

Figure 2. The graph above shows daily Arctic sea ice extent as of February 5, 2012, along with the ice extents for the previous four years. 2011 is shown in light blue, 2010 is in pink, 2009 in dark blue, 2008 is in purple, and 2007, the year with the record low minimum, is dashed green. The gray area around the average line shows the two standard deviation range of the data.
Sea Ice Index data.

Credit: National Snow and Ice Data Center
High-resolution image

Conditions in context
The growth rate for Arctic sea ice in January was the slowest in the satellite record. After growing relatively quickly early in January, ice extent declined briefly in the middle of the month, and then grew more slowly than normal for the rest of the month. The slow growth likely stemmed from winds from the south and west that compressed the sea ice in the Barents Sea, and above-average temperatures and winds that limited ice growth in the Sea of Okhotsk.

Overall, the Arctic gained 765,000 square kilometers (295,000 square miles) of ice during the month. This was 545,000 square kilometers (210,000 square miles) less than the average ice growth rate for January 1979 to 2000.

Figure 3. Monthly January ice extent for 1979 to 2012 shows a decline of 3.2% per decade.

Credit: National Snow and Ice Data Center
High-resolution image


January 2012 compared to past years

Arctic sea ice extent for January 2012 was the fourth lowest in the satellite record. Including the year 2012, the linear rate of decline for January ice extent over the satellite record is 3.2% per decade.
Based on the satellite record, before 2005 average January ice extent had never been lower than 14 million square kilometers (5.41 million square miles). January ice extent has now fallen below that mark six out of the last seven years.

Figure 4. Monthly average sea ice motion for December 2011 (top) and January 2012 (bottom), derived from the DMSP Special Sensor Microwave Imager and Sounder (SSMIS) shows how the changing Arctic Oscillation (AO) phase affects the movement of ice. In January, the AO switched from a positive phase to a negative phase.

Credit: National Snow and Ice Data Center
High-resolution image


The Arctic Oscillation turns negative

From November through the first part of January, the Arctic Oscillation (AO) was in a generally positive phase, which tends to bring warm conditions to the United States and Europe, and colder conditions to the Arctic. However, in the middle of the month, the AO shifted back to a negative phase. This shift helped bring cold air outbreaks over middle latitudes, notably a record cold snap throughout much of Europe.

The Arctic Oscillation also affects how sea ice moves in the Arctic, which can affect how much ice melts in the summer months. In December, when the AO was in its positive phase, ice was flowing from Siberia toward North America, and also south out of the Arctic through Fram Strait. That pattern favors a thinner, younger ice cover in the summer. In mid-January, the AO switched to its negative phase. In general, the negative phase of the AO tends to retain ice in the Arctic Ocean, leading to a stronger, more resilient summer sea ice cover. Ice motion charts for January confirm that in January, there was less motion across the pole and through Fram Strait but a stronger clockwise motion in the Beaufort Sea called the Beaufort Gyre.

For background on the Arctic Oscillation, see the NSIDC Icelights post: The Arctic Oscillation, winter storms and sea ice.

Figure 5. This NASA Moderate Resolution Imaging Spectroradiometer (MODIS) image, acquired in mid-January, shows heavy sea ice conditions in Bristol Bay and the Bering Sea, off the western coast of Alaska.

Credit: NASA Earth Observatory courtesy Jeff Schmaltz, LANCE/EOSDIS MODIS Rapid Response Team at NASA GSFC.
High-resolution image

Ice-covered Bering Sea
Arctic sea ice extent in the Bering Sea was the second highest in the satellite record for the month of January. Ice extent in the Bering Sea was 562,000 square kilometers (217,000 square miles), which is 104,600 square kilometers (40,400 square miles) above the 1979 to 2000 average. The record high ice extent for the month occurred in January 2000, at 629,000 square kilometers (242,900 square miles).

The above-average sea ice extent in the Bering Sea stemmed from a weather pattern that brought cold air from the Arctic into the Bering Sea, driving sea ice southwards. The weather pattern, which has persisted since November, features unusually low surface pressure south and east of the Alaskan coast, which leads to winds from the north or northeast that blow into the Bering Sea region. This weather pattern also brought moist air from the Pacific Ocean to the southern Alaska coast, helping to explain record snowfalls in towns such as Cordova, Alaska, which received over 15 feet of snow between early November and mid-January.

The extensive sea ice impeded winter fishing in the Bering Sea and slowed an important fuel resupply mission to Nome, on the west coast of Alaska. More information on sea ice conditions off southwestern Alaska, and a full-resolution version of the image at left, are available on the NASA Earth Observatory Web site.

Positively Arctic: Arctic Oscillation switches phase

Arctic sea ice extent remained unusually low through December, especially in the Barents and Kara seas.  In sharp contrast to the past two winters, the winter of 2011 has so far seen a generally positive phase of the Arctic Oscillation, a weather pattern that helps to explain low snow cover extent and warmer than average conditions over much of the United States and Eastern Europe.  In Antarctica, where summer is beginning, sea ice extent is presently above average.

Figure 1. Arctic sea ice extent for December 2011 was 12.38 million square kilometers (4.78 million square miles). The magenta line shows the 1979 to 2000 median extent for that month. The black cross indicates the geographic North Pole. Sea Ice Index data.

Credit: National Snow and Ice Data Center
High-resolution image


Overview of Conditions

Arctic sea ice extent in December 2011 averaged 12.38 million square kilometers (4.78 million square miles). This is the third lowest December ice extent in the 1979 to 2011 satellite data record, 970,000 square kilometers (375,000 square miles) below the 1979 to 2000 average extent.

Ice extent was particularly low on the Atlantic side of the Arctic, most notably in the Barents and Kara seas. The eastern coast of Hudson Bay did not freeze entirely until late in the month: normally, Hudson Bay has completely frozen over by the beginning of December. In the Bering Sea, ice extent was slightly above average.

Figure 2. The graph above shows daily Arctic sea ice extent as of January 3, 2012, along with the ice extents for the previous four years. 2011 is shown in light blue, 2010 is in pink, 2009 in dark blue, 2008 is in purple, and 2007, the year with the record low minimum, is dashed green. The gray area around the average line shows the two standard deviation range of the data. Sea Ice Index data.

Credit: National Snow and Ice Data Center
High-resolution image

Conditions in context
For the Arctic as a whole, ice extent for the month remained far below average. The Arctic sea ice cover grew slightly faster than average, but December started out with a lower-than-average ice extent.

Overall, the Arctic gained 2.37 million square kilometers (915,000 square miles) of ice during the month. The average ice gain for December was 1.86 million square kilometers (718,000 square miles). On December 31, Arctic sea ice extent was 13.25 million square kilometers (5.12 million square miles), 561,000 square kilometers (217,000 square miles) more than the ice extent on December 31, 2010, the lowest extent on December 31 in the satellite record.

Figure 3. Monthly December ice extent for 1979 to 2011 shows a decline of 3.5% per decade.

Credit: National Snow and Ice Data Center
High-resolution image

December 2011 compared to past years
Arctic sea ice extent for December 2011 was the third lowest in the satellite record. The five lowest December extents in the satellite record have occurred in the past six years. Including the year 2011, the linear rate of decline ice December ice extent over the satellite record is -3.5% per decade.

Figure 4. This map of air temperature anomalies at the 925 hPa level (approximately 3000 feet) for December 2011 shows near-normal or lower-than-average temperatures over much of the Arctic basin, while air temperatures over the Kara and Barents seas were warmer than normal.

Credit: NSIDC courtesy NOAA/ESRL PSD
High-resolution image

Arctic temperatures
Air temperatures in December were lower than average over much of the Arctic Ocean, but higher than average over the Kara and Barents seas. Higher-than-average temperatures in these regions stemmed from two major factors. First, where sea ice extent is low, heat can escape from areas of open water, warming the atmosphere. Second, surface winds in the Kara and Barents Sea ice blew persistently from the south, bringing in heat from lower latitudes. This imported heat also helped to keep sea ice extent low in this area. Conditions over Canada were also unusually warm during December, but conditions over southeast Greenland have been 6 to 8 degrees Celsius (11 to 14 degrees Fahrenheit) colder than average, partly because of northerly winds in the area.

Figure 5. This graph shows daily Arctic Oscillation Index values from the NOAA Climate Prediction Center for early September 2011 to early January 2012. The index is a normalized (unitless) index of relative pressure anomalies between polar and mid-latitude regions.

Credit: NSIDC courtesy NOAA NWS Climate Prediction Center
High-resolution image

Positive phase of the Arctic Oscillation
The past two Arctic winters were dominated by a negative phase of the Arctic Oscillation, a large-scale weather pattern that brings generally warm conditions to the Arctic and colder conditions to Europe and North America. In contrast, the winter of 2011 has so far seen a mostly positive phase of the Arctic Oscillation. While temperatures were above normal in the Kara and Barents seas, the positive phase of the Arctic Oscillation tends to keep the coldest winter air locked up in the Arctic, which keeps the middle latitudes free of frigid Arctic temperatures and strong snowstorms. This weather pattern helps to explain the low snow cover and warm conditions over much of the United States and Eastern Europe so far this winter.

Several studies have shown that during the positive phase of the Arctic Oscillation, thick ice tends to move out of the Arctic through Fram Strait, leaving the Arctic with thinner ice that melts out more easily in summer. Scientists will be watching closely for this connection if the positive phase of the Arctic Oscillation continues through the winter.

Some scientists have speculated that the negative Arctic Oscillation pattern of the last two winters was in part driven by low sea ice extent. The recurrence of the positive phase of the Arctic Oscillation so far this winter, following a near-record low summer sea ice extent, suggests that other factors play an important role.

Figure 6. This full-year graph puts 2011 sea ice extent in context. The gray line shows the 1979 to 2000 climatology, thick blue-gray indicates the 1981 to 2010 (30-year) climatology. NOAA this year switched to using the period 1981 to 2010 for their thirty-year climate comparison period. Sea Ice Index data.

Credit: National Snow and Ice Data Center
High-resolution image

2011 year in review
Arctic sea ice extent fell to its seasonal minimum on September 9, 2011, falling just short of the record low set in September 2007, when summer weather conditions were extremely favorable for ice loss. This summer, the weather was not as extreme as 2007, so it was surprising that ice extent dropped so low. The low ice extent, along with data on ice age, suggests that the Arctic ice cover remains thin and vulnerable to summer melt.

Northern Hemisphere snow cover retreated very rapidly last spring, with record and near-record low snow cover extents in May and June despite higher-than-average winter snow extent as of February and March.

Figure 7. This graph shows Antarctic sea ice extent as of January 3, 2011. This year’s sea ice extent is shown in light blue, and 2010 is shown in dark blue. The gray area around the average line shows the two standard deviation range of the data. Sea Ice Index data.

Credit: National Snow and Ice Data Center
High-resolution image

A quick look at Antarctica
After a particularly slow ice loss rate at the beginning of the month, Antarctic sea ice extent was unusually high through much of December, in particular in the northern Ross Sea and the eastern Weddell Sea. December and November have had a markedly strong Amundsen Sea Low, an atmospheric pressure pattern that tends to spread the sea ice cover northward in the Ross Sea. Low pressure over the eastern Weddell Sea later in the month had the same effect there. Sea ice for the Antarctic in December 2011 was the fifth-highest for that month in the satellite record; the highest December extent occurred in 2007. Overall though, Antarctic sea ice extent remained below or near normal for most of 2011. Antarctic sea ice data are available on the Sea Ice Index Web site.

References
Rigor, I. G., and J. M. Wallace. 2004. Variations in the age of Arctic sea-ice and summer sea-ice extent, Geophys. Res. Lett., 31, L09401, doi:10.1029/2004GL019492.

Winter in the Arctic: Ice and storms

Arctic sea ice continued its winter expansion, although ice growth slowed briefly in early November. The slowdown may have been related to a strong Arctic storm that tracked from the Bering Sea into the Beaufort and Chukchi seas. In the Southern Hemisphere, Antarctic sea ice is tracking near average for this time of year.

map from space showing sea ice extent, continentsFigure 1. Arctic sea ice extent for November 2011 was 10.01 million square kilometers (3.86 million square miles). The magenta line shows the 1979 to 2000 median extent for that month. The black cross indicates the geographic North Pole. Sea Ice Index data.

—Credit: National Snow and Ice Data Center
High-resolution image


Overview of conditions

Average ice extent for November 2011 was 10.01 million square kilometers (3.86 million square miles), 1.30 million square kilometers (502,000 square miles) below the 1979 to 2000 average. This was 170,000 square kilometers (66,000 square miles) above the average for November 2006, the lowest extent recorded for that month in the satellite data record.

At the end of November, ice extent remained below the 1979 to 2000 average in the Chukchi, Barents and Kara seas, and Hudson Bay was still nearly ice free. Ice extent was near average in the East Greenland and the Bering seas. These ice conditions may be connected to a strong positive phase of the Arctic Oscillation, which began during the last week of November. A positive Arctic Oscillation tends to help move ice out of Fram Strait and into the North Atlantic.

graph with months on x axis and extent on y axis Figure 2. The graph above shows daily Arctic sea ice extent as of December 1, 2011, along with the ice extents for the previous four years. 2011 is shown in light blue, 2010 is in pink, 2009 in dark blue, 2008 is in purple, and 2007, the year with the record low minimum, is dashed green. The gray area around the average line shows the two standard deviation range of the data. Sea Ice Index data.

—Credit: National Snow and Ice Data Center
High-resolution image


Conditions in context

The Arctic sea ice cover grew at an average pace through November, despite a brief slowdown early in the month. However, the ice extent remained far below average. Overall, the Arctic gained 2.36 million square kilometers (911,000 square miles) of ice during the month, which was slightly more than the average ice gain for November of 2.13 million square kilometers (822,000 square miles). On November 30, Arctic sea ice extent was 10.85 million square kilometers (4.19 million square miles), 625,000 square kilometers (241,000 square miles) more than the ice extent on November 30, 2006, the lowest extent on November 30 in the satellite record.

graph with months on x axis and extent on y axis Figure 3. Monthly November ice extent for 1979 to 2011 shows a decline of 4.7% per decade.

—Credit: National Snow and Ice Data Center
High-resolution image


November 2011 compared to past years

Ice extent for November 2011 was the third lowest in the satellite record for the month, behind 2006 and 2010. The linear rate of decline for November over the satellite record is now 53,200 square kilometers (20,500 square miles) per year, or 4.7% per decade relative to the 1979 to 2000 average.

graph with months on x axis and extent on y axis Figure 4. This map of air temperature anomalies at the 925 hPa level (approximately 3000 feet) for November 2011 shows near-normal or lower-than-average temperatures over much of the Arctic basin, while air
temperatures over the Kara and Barents Seas and Greenland were warmer than normal.
—Credit: NSIDC courtesy NOAA/ESRL PSD
High-resolution image


Atmospheric conditions and an Arctic storm

Low sea ice extent this summer may be contributing to warmer November temperatures and lower November ice extents in some areas. In recent years, low sea ice extent in the summer has been linked to unusually warm autumn air temperatures, resulting from the larger areas of open water that absorb more heat during the summer. This heat must escape back to the atmosphere in the fall, before the ocean can freeze over. This escaping heat contributes to warmer-than-average conditions, which have been most apparent in October but may also extend into November.

This November, air temperatures were near or slightly below average over most of the Arctic basin, but higher air temperatures were found over the Kara and Barents seas, the East Greenland Sea and the Canadian Archipelago: in general, the regions with above-average temperatures were the regions with below-average ice extent.

Lower than average temperatures in the Beaufort and Bering seas may be in part related to a strong low-pressure system that developed early in the month. In early November, a low-pressure system moved up from the Bering Sea into the Arctic, bringing strong winds and flooding to coastal villages in western Alaska. With a core pressure as low as 947 millibars, it was the strongest November storm to hit northwest Alaska since 1974. Much of the area affected by the storm was in areas that are typically ice-free, so the lack of sea ice probably did not play a direct role in the damage. For more information, see the Icelights article: An Arctic Hurricane?

graph with months on x axis and extent on y axis Figure 5. This map shows snow cover this November, compared to the 1971 to 2000 average. Areas in orange and red had lower snow cover than usual, while areas in blue had more snow than normal during November.

—Credit: NSIDC courtesy David Robinson, Rutgers University Snow Cover Laboratory
High-resolution image


Northern Hemisphere snow cover

The positive phase of the Arctic Oscillation also tends to be associated with unusually warm conditions over Scandinavia. According to Sweden’s meteorological office, the country’s average temperature for the month of November so far was 7 degrees Celsius (12.6 degrees Fahrenheit) above average. Typically by November, much of Scandinavia is already covered with snow, but maps from the Rutgers University Global Snow Lab show that snow cover levels were anomalously low over Scandinavia and northwestern Europe during November. Below-normal snow conditions were also evident over most of the continental United States, except for the northern Rockies.

However, overall Northern Hemisphere snow cover was more extensive than normal this November, with most of the extra snow cover found in Canada and Russia. Snow covered an average of 36.2 million square kilometers (14.0 million square miles) of Northern Hemisphere land. This is 2.79 million square kilometers (1.08 million square miles) above the 1971 to 2000 mean, and ranks as the fourth most extensive cover in the past 46 years of satellite-derived snow cover records.

Along with sea ice, change in snow cover can be an indicator of climate change. Higher air temperatures have resulted in a decline in snow cover in the spring, but in fall, the signal is more mixed. Some scientists also suspect there may be a link between early season high-latitude snow cover and winter weather patterns in the mid-latitudes. Judah Cohen and Justin Jones of Atmospheric and Environmental Research in Massachusetts have examined a potential link and suggest that this information could be used to improve winter forecasts. However, this research is still preliminary.

graph with months on x axis and extent on y axis Figure 6. This graph shows Antarctic sea ice extent as of December 1, 2011. This year’s sea ice extent is shown in light blue, and 2010 is shown in dark blue. The gray area around the average line shows the two standard deviation range of the data. Sea Ice Index data.

—Credit: National Snow and Ice Data Center
High-resolution image


A look at Antarctica

Arctic Sea Ice News & Analysis generally focuses on sea ice conditions in the Arctic, since these conditions are closely tied to climate and weather in the Northern Hemisphere. A seasonal cover of sea ice also surrounds the continent of Antarctica. Since reaching its seasonal maximum in September, Antarctic sea ice has been near average in recent months. In November, Antarctic extent was 16.15 million square kilometers (6.24 million square miles), 87,000 square kilometers (33,600 square miles) less than the 1979 to 2000 average. In recent years, the sea ice cover that surrounds the Antarctic continent has been higher than average, even reaching near-record highs.

Antarctic sea ice varies much more from year to year than Arctic sea ice, but overall, ice extent around Antarctica has been growing slightly over the past 30 years. The ice cover around Antarctica also varies widely by region, with some regions, for example the Amundsen and Bellingshausen seas, showing strong declines over the past three decades, while other regions such as the Ross Sea have seen significant increases. For more information on Antarctic sea ice, see All About Sea Ice: Antarctic vs. Arctic. Antarctic sea ice data are available from the Sea Ice Index.

Further Reading

Cohen, J., and J. Jones, 2011. A new index for more accurate winter predictions, Geophysical Research Letters, vol. 38, L21701, doi:10.1029/2011/GL049626.

NOAA has released their annual Arctic Report Card, an annual compilation of scientific observations of the changing Arctic region. NSIDC scientist Walt Meier contributed to the sea ice section of the report.

For previous analyses, please see the drop-down menu under Archives in the right navigation at the top of this page.

A rapid freeze-up

Arctic sea ice extent increased rapidly through October, as is typical this time of year. Large areas of open water were still present in the Beaufort and Chukchi seas at the end of the month. The open water contributed to unusually warm conditions along the coast of Siberia and in the Beaufort and Chukchi seas.

map from space showing sea ice extent, continentsFigure 1. Arctic sea ice extent for October 2011 was 7.10 million square kilometers (2.74 million square miles). The magenta line shows the 1979 to 2000 median extent for that month. The black cross indicates the geographic North Pole. Sea Ice Index data. —Credit: National Snow and Ice Data Center
High-resolution image

Overview of conditions

Average ice extent for October 2011 was 7.10 million square kilometers (2.74 million square miles), 2.19 million square kilometers (846,000 square miles) below the 1979 to 2000 average. This was 330,000 square kilometers (127,000 square miles) above the average for October 2007, the lowest extent in the satellite record for that month. By the end of October, ice extent remained below the 1979 to 2000 average in the Beaufort and Chukchi seas and in the Barents and Kara seas. Extent was near average in the East Greenland Sea. New ice growth has closed both the Northwest Passage and the Northern Sea Route.

graph with months on x axis and extent on y axis Figure 2. The graph above shows daily Arctic sea ice extent as of November 6, 2011, along with the lowest ice extents in the preceding decades, 1984 and 1999. 2011 is shown in light blue. 2007, the year with the record low minimum, is dashed green. Purple indicates 1999 and light green shows 1984. The gray area around the average line shows the two standard deviation range of the data. Sea Ice Index data. —Credit: National Snow and Ice Data Center
High-resolution image


Conditions in context

Arctic sea ice extent increased rapidly through October. Ice extent during October 2011 increased at an average rate of 114,900 square kilometers (44,360 square miles) per day, about 40% faster than the average growth rate for October 1979 to 2000. On October 30, Arctic sea ice extent was 8.41 million square kilometers (3.25 million square miles), 226,000 square kilometers (87,300 square miles) more than the ice extent on October 30, 2007, the lowest extent on that date in the satellite record.

During the month of October, the freeze-up that begins in September kicks into high gear. The rate of freeze-up depends on several factors including the atmospheric conditions and the amount of heat in the ocean that was accumulated during the summer. However, each decade, the October extent has started from a lower and lower point, with the record low extent during the 1980s (1984) substantially higher than the record low extent during the 1990s (1999), which in turn is substantially higher than the record low extent during the 2000s (2007).

graph with months on x axis and extent on y axis Figure 3. Monthly October ice extent for 1979 to 2011 shows a decline of 6.6% per decade. —Credit: National Snow and Ice Data Center
High-resolution image


October 2011 compared to past years

Ice extent for October 2011 was the second lowest in the satellite record for the month, behind 2007. The linear rate of decline for October over the satellite record is now -61,700 square kilometers (-23,800 square miles) per year, or -6.6% per decade relative to the 1979 to 2000 average.

graph with months on x axis and extent on y axis Figure 4. This map of air temperature anomalies at the 925 hPa level (approximately 3000 feet) for October 2011 shows unusually high temperatures over most of the Arctic Ocean (yellow shading) and unusually low temperatures over the eastern Canadian Arctic Archipelago and Greenland (blue shading). —Credit: National Snow and Ice Data Center
High-resolution image


Atmospheric conditions

In recent years, low sea ice extent in the summer has been linked to unusually warm temperatures at the surface of the Arctic Ocean in the fall. This pattern appeared yet again this fall.

Air temperatures over most of the Arctic Ocean for October 2011 ranged from 1 to 4 degrees Celsius (1.8 to 7.2 degrees Fahrenheit) above average, measured at the 925 millibar level, about 1,000 meters or 3,000 feet above the surface. However, over the eastern Canadian Arctic and Greenland, temperatures were as much as 3 degrees Celsius (5.4 degrees Fahrenheit) below average.

These temperature anomalies in part reflect a pattern of above-average sea level pressure centered over the northern Beaufort Sea, and lower than average sea level pressure extending across northern Eurasia. This pattern is linked to persistence of the positive phase of the Arctic Oscillation through most of the month. These pressure and temperature anomalies tend to bring in heat from the south, warming the Eurasian coast, but they also lead to cold northerly winds over the eastern Canadian Arctic Archipelago. However, along the Siberian coast and in the Beaufort and Chukchi seas, warmer temperatures came primarily from the remaining areas of open water in the region, as heat escaped from the water. These effects are more strongly apparent in the surface air temperatures: average October temperatures in the region were 5 to 8 degrees Celsius (9.0 to 14.4 degrees Fahrenheit) above average.

graph with months on x axis and extent on y axis Figure 5. The top panel of this figure shows the number of open water days for the approximate 75 kilometer (46.6 mi) coastal zone along the Beaufort Sea (data for each year and linear trend). The bottom panel shows the average annual coastal erosion rate for three periods, 1979-1999, 2000-2007 and 2008-2009. —Credit: NSIDC courtesy Irina Overeem, CU Boulder
High-resolution image


Sea ice loss and coastal erosion

Declining sea ice in the Arctic has led to increasing erosion rates along the coast of the Beaufort Sea over the past fifty years, according to a new study led by Irina Overeem of the University of Colorado Institute for Arctic and Alpine Research (INSTAAR). Their study used a wave model driven by sea ice position and wind data.

As the period of open water on the coast of the Beaufort Sea has increased, so has the mean annual erosion rate, the study showed. From 1979 to 1999, the average erosion rate was 8.5 meters (27.9 feet) per year. The average rate over the period 2000 to 2007 was 13.6 meters (44.6 feet) per year, while the rate for the last two years of the record, 2008 to 2009, was 14.4 meters (47.2 feet) per year.

With a longer open water season, ocean water warms more and waves eat away at the coastline. The sediments comprising the coastal bluffs are locked together by permafrost—hard frozen ground with a concrete-like consistency. As the waves lap at the permafrost, they also help to thaw it, making the ground much more vulnerable to erosion.

Further ReadingOvereem, I., R.S. Anderson, C.W. Wobus, G.D. Clow, F.E. Urban, and N. Matell. 2011: Sea ice loss enhances wave action at the Arctic coast. Geophysical Research Letters, 38, L17503, doi:10.1029/2011GL048681.

Serreze, M.C., and R.G. Barry. 2011: Processes and impacts of Arctic Amplification: A research synthesis. Global and Planetary Change, 77,85-96.

For previous analyses, please see the drop-down menu under Archives in the right navigation at the top of this page.

Summer 2011: Arctic sea ice near record lows

The summer sea ice melt season has ended in the Arctic. Arctic sea ice extent reached its low for the year, the second lowest in the satellite record, on September 9. The minimum extent was only slightly above 2007, the record low year, even though weather conditions this year were not as conducive to ice loss as in 2007. Both the Northwest Passage and the Northern Sea Route were open for a period during September.

map from space showing sea ice extent, continentsFigure 1. Arctic sea ice extent for September 2011 was 4.61 million square kilometers (1.78 million square miles). The magenta line shows the 1979 to 2000 median extent for that month. The black cross indicates the geographic North Pole. Sea Ice Index data.—Credit: National Snow and Ice Data Center
High-resolution image


Overview of conditions

Average ice extent for September 2011 was 4.61 million square kilometers (1.78 million square miles), 2.43 million square kilometers (938,000 square miles) below the 1979 to 2000 average. This was 310,000 square kilometers (120,000 square miles) above the average for September 2007, the lowest monthly extent in the satellite record. Ice extent was below the 1979 to 2000 average everywhere except in the East Greenland Sea, where conditions were near average.

As in recent years, northern shipping routes opened up this summer. The Northern Sea Route opened by mid August and still appeared to be open as of the end of September. The southern “Amundsen Route” of the Northwest Passage, through the straits of the Canadian Arctic Archipelago, opened for the fifth year in a row. Overall, sea ice in the wider and deeper northern route through Parry Channel reached a record low, according to Stephen Howell of Environment Canada, based on Canadian Ice Service analysis. Parry Channel had a narrow strip of ice that blocked a short section of the channel, but it did appear to open briefly in early September.

For additional numbers for previous years, see Table 1.

graph with months on x axis and extent on y axis Figure 2. The graph above shows daily Arctic sea ice extent as of October 1, 2011, along with daily ice extents for the previous three lowest years for the minimum ice extent. Light blue indicates 2011, dashed green shows 2007, dark blue shows 2010, purple shows 2008, and dark gray shows the 1979 to 2000 average. The gray area around the average line shows the two standard deviation range of the data. Sea Ice Index data.—Credit: National Snow and Ice Data Center
High-resolution image


Conditions in context

While the melt season in 2011 got off to a slow start, the ice loss pace quickened during June. Ice retreated quite rapidly in the Kara and Barents seas, with rates more than double the average rate. Rapid ice loss continued during the first half of July but then slowed considerably as a series of low pressure systems moved over the central Arctic Ocean. By the end of July, ice extent was slightly above that seen in 2007.

Ice extent stayed above 2007 for the remainder of the melt season, reaching its minimum of 4.33 million square kilometers (1.67 million square miles) on September 9, 2011. Since the minimum, a rapid freeze-up has begun. On October 1, the five-day average extent rose above 5 million square kilometers (1.93 million square miles).

graph with months on x axis and extent on y axis Figure 3. Monthly September ice extent for 1979 to 2011 shows a decline of 12.0% per decade.—Credit: National Snow and Ice Data Center
High-resolution image


September 2011 compared to past years

Ice extent for September 2011 was the second lowest in the satellite record for the month. The last five years (2007 to 2011) have had the five lowest September extents in the satellite record. The linear rate of decline is now -84,700 square kilometers (-32,700 square miles) per year, or -12% per decade relative to the 1979 to 2000 average. In contrast to 2007, when a “perfect storm” of atmospheric and ocean conditions contributed to summer ice loss, this year’s conditions were less extreme. From the beginning of the melt season in March, to the minimum extent on September 9, the Arctic Ocean lost 10.3 million square kilometers (4.0 million square miles) of sea ice. It was the fifth year in a row with more than 10 million square kilometers of ice extent change from maximum to minimum. In comparison, the average seasonal ice loss during the 1980s was 9.0 million square kilometers (3.5 million square miles)

graph with months on x axis and extent on y axis Figure 4. Ice motion charts for August 2011 show different movement patterns for this summer compared to 2007. The arrows show the direction of ice motion, with larger arrows indicating stronger motion. In 2007, northward ice motion helped push the ice together and flush it out of the Arctic.—Credit: National Snow and Ice Data Center
High-resolution image


Atmospheric conditions

In 2007, a persistent dipole anomaly weather pattern, with unusually high pressure over the Beaufort Sea and unusually low pressure over the Kara Sea, helped contribute to the record ice loss. This pattern resulted in strong southerly winds from the Bering Strait region across the North Pole, which brought warmer winds and ocean waters northward to melt the ice edge and push the ice northward. In addition, especially strong high pressure over the Beaufort and Chukchi Seas in June 2007 resulted in less than average cloudiness, allowing more sunlight to reach the ice.

The Arctic saw a similar weather pattern this summer, but not as strong and persistent as in 2007. The location of the high and low pressure centers was also shifted, so that the winds blew east to west instead of toward the north as in 2007. This shift is reflected in the movement of the sea ice, particularly during August.

Patterns of air temperatures (measured at the 925 millibar level or about 1,000 meters or 3,000 feet above the surface) were also quite different this year compared to 2007. In summer 2007, temperatures in the Beaufort and Chukchi Seas were 5 degrees Celsius (9 degrees Fahrenheit) above average. This year, temperatures in that region were near average, but north of Greenland and in the Canadian Archipelago, conditions were even warmer than in 2007. These high temperatures likely played a role in the opening of the Northwest Passage.

graph with months on x axis and extent on y axis Figure 5. Sea surface temperatures this year were generally lower than in 2007, although some areas of the ocean surface still had higher than average temperatures.—Credit: NSIDC courtesy M. Steele and W. Ermold, Univ. Washington PSC, and NOAA
High-resolution image


Sea surface temperatures

Ocean sea surface temperatures (SSTs), based on National Oceanographic and Atmospheric Administration (NOAA) data provided by Michael Steele and Wendy Ermold of the University of Washington Polar Science Center, indicate above normal temperatures on the surface of the Arctic Ocean. However, the temperatures anomalies were not as extreme as in 2007 and were comparable to those recorded for 2009 and 2010. These lower temperatures may be the result of less solar heating of the exposed ocean surface or less transport of warm waters from the south. In 2007, ice retreated early from the shores of Alaska and Siberia, allowing the ocean mixed layer to heat up and enhance melting of the ice from below. In contrast, ice was slower to retreat in this region in summer 2011, and less bottom melt was observed.

ice age image Figure 6. Data on ice age show that coverage of the oldest, thickest ice types (ice four years or older) has declined over the past 28 years.—Credit: National Snow and Ice Data Center courtesy J. Maslanik, C. Fowler, and M. Tschudi, U. Colorado Boulder
High-resolution image


Ice remains younger, thinner

Why did ice extent fall to a near record low without the sort of extreme weather conditions seen in 2007? One explanation is that the ice cover is thinner than it used to be; the melt season starts with more first-year ice (ice that formed the previous autumn and winter) and less of the generally thicker multi-year ice (ice that has survived at least one summer season). First- and second-year ice made up 80% of the ice cover in the Arctic Basin in March 2011, compared to 55% on average from 1980 to 2000. Over the past few summers, more first-year ice has survived than in 2007, replenishing the younger multi-year ice categories (2- to 3-year-old ice). This multi-year ice appears to have played a key role in preserving the tongue of ice extending from near the North Pole toward the East Siberian Sea. However, the oldest, thickest ice (five or more years old) has continued to decline, particularly in the Beaufort and Chukchi Seas. Continued loss of the oldest, thickest ice has prevented any significant recovery of the summer minimum extent. In essence, what was once a refuge for older ice has become a graveyard.

Table 1. Previous Arctic sea ice extents
for the month of September
Year Average Arctic Sea Ice Extent for September Trend, in % per decade (relative to 1979-2000 avg.)
in millions of square kilometers in millions of square miles
2007 4.30 1.66 -10.2
2008 4.67 1.80 -11.1
2009 5.36 2.07 -11.2
2010 4.90 1.89 -11.6
2011 4.61 1.78 -12.0
1979 to 2000 average 7.04 2.72
1979 to 2010 average 6.52 2.52

For previous analyses, please see the drop-down menu under Archives in the right navigation at the top of this page.

Arctic sea ice at minimum extent

Arctic sea ice appears to have reached its lowest extent for the year. The minimum ice extent was the second lowest in the satellite record, after 2007, and continues the decadal trend of rapidly decreasing summer sea ice.

Please note that this is a preliminary announcement. Changing winds could still push ice floes together, reducing ice extent further. NSIDC scientists will release a full analysis of the melt season in early October, once monthly data are available for September.

map from space showing sea ice extent, continentsFigure 1. Arctic sea ice extent on September 9, 2011 was 4.33 million square kilometers (1.67 million square miles). The orange line shows the 1979 to 2000 median extent for that day. The black cross indicates the geographic North Pole. Sea Ice Index data.—Credit: National Snow and Ice Data Center
High-resolution image


Overview of conditions

On September 9, 2011 sea ice extent dropped to 4.33 million square kilometers (1.67 million square miles). This appears to have been the lowest extent of the year, and may mark the point when sea ice begins its cold-season cycle of growth. However, a shift in wind patterns or late season melt could still push the ice extent lower.

This year’s minimum was 160,000 square kilometers (61,800 square miles) above the 2007 record minimum extent, and 2.38 million square kilometers (919,000 square miles) below the 1979 to 2000 average minimum. Note that our estimated uncertainty for extent is plus or minus 50,000 square kilometers (about 20,000 square miles). The minimum ice extent this year is very close to 2007, and indeed some other research groups place 2011 as the lowest on record. At this point, using our processing and sensor series, the 2011 minimum is a close second.

graph with months on x axis and extent on y axis Figure 2. The graph above shows daily Arctic sea ice extent as of September 13, 2011, along with daily ice extents for the previous three lowest years for the minimum ice extent. Light blue indicates 2011, dashed green shows 2007, dark blue shows 2010, purple shows 2008, and dark gray shows the 1979 to 2000 average. The gray area around the average line shows the two standard deviation range of the data. Sea Ice Index data.—Credit: National Snow and Ice Data Center
High-resolution image


Conditions in context

The last five years (2007 to 2011) have been the five lowest extents in the continuous satellite record, which extends back to 1979. While the record low year of 2007 was marked by a combination of weather conditions that favored ice loss (including clearer skies, favorable wind patterns, and warm temperatures), this year has shown more typical weather patterns but continued warmth over the Arctic. This supports the idea that the Arctic sea ice cover is continuing to thin. Models and remote sensing data also indicate this is the case. A large area of low concentration ice in the East Siberian Sea, visible in NASA Moderate Resolution Imaging Spectroradiometer (MODIS) imagery, suggests that the ice cover this year is particularly thin and dispersed this year.

Table 1. Previous minimum Arctic sea ice extents
Year Minimum Ice Extent Date
in millions of square kilometers in millions of square miles
2007 4.17 1.61 September 16
2008 4.55 1.76 September 18
2009 5.10 1.97 September 12
2010 4.60 1.78 September 19
2011 4.33 1.67 September 9
1979 to 2000 average 6.71 2.59 September 10
1979 to 2010 average 6.29 2.43 September 12

For previous analyses, please see the drop-down menu under Archives in the right navigation at the top of this page.

Arctic sea ice nears minimum extent

In the last few days, the decline in Arctic sea ice extent has slowed. NSIDC data show Arctic sea ice extent currently at the second-lowest levels in the satellite record.

map from space showing sea ice extent, continentsFigure 1. The graph above shows ice extent this year, along with daily ice extents for the previous three lowest extent years. Light blue indicates 2011, dashed green shows 2007, dark blue shows 2010, purple shows 2008, and dark gray shows the 1979 to 2000 average. The gray area around the average line shows the two standard deviation range of the data. Sea Ice Index data. About the data. —Credit: National Snow and Ice Data Center
High-resolution image


Overview of conditions

On September 10, Arctic sea ice extent was 4.34 million square kilometers (1.68 million square miles). This was 110,000 square kilometers (42,500 square miles) above the 2007 value on the same date. The record minimum Arctic sea ice extent, recorded in 2007, was 4.17* million square kilometers (1.61 million square miles).

The rate of decline has flattened considerably the last few days: Arctic sea ice is likely near its minimum value for the year. However, weather patterns could still push the ice extent lower. NSIDC scientists will make an announcement when ice extent has stopped declining and has expanded for several days in a row, indicating that the Arctic sea ice has reached its lowest extent for the year and has begun freezing over. During the first week of October, after data are processed and analyzed for the month of September, NSIDC scientists will issue a more detailed analysis of this year’s melt season and the state of the sea ice.

NSIDC’s sea ice data come from the Special Sensor Microwave Imager/Sounder (SSMIS) sensor on the Defense Meteorological Satellite Program (DMSP) F17 satellite. This data record, using the NASA Team algorithm developed by scientists at NASA Goddard Space Flight Center, is the longest time series of sea ice extent data, extending back to 1979.

Other sea ice data are available from other data providers, using different satellite sensors and sea ice algorithms. For example, data from the University of Bremen indicate that sea ice extent from their algorithm fell below the 2007 minimum. They employ an algorithm that uses high resolution information from the JAXA AMSR-E sensor on the NASA Aqua satellite. This resolution allows small ice and open water features to be detected that are not observed by other products. This year the ice cover is more dispersed than 2007 with many of these small open water areas within the ice pack. While the University of Bremen and other data may show slightly different numbers, all of the data agree that Arctic sea ice is continuing its long-term decline.

For more information about the Arctic sea ice minimum, see the NSIDC Icelights article, Heading Towards the Summer Minimum Ice Extent.

*Near-real-time data initially recorded the 2007 record low as 4.13 million square kilometers 1.59 million square miles). The final data, reprocessed by NASA Goddard Space Flight Center using slightly different processing and quality control procedures, record the number as 4.17 million square kilometers (1.61 million square miles). NSIDC reports daily extent as a 5-day average. For more about the data, see the FAQ, Do your data undergo quality control?

For previous analyses, please see the drop-down menu under Archives in the right navigation at the top of this page.

Arctic sea ice near record lows

Arctic sea ice extent averaged for August 2011 reached the second lowest level for the month in the 1979 to 2011 satellite record. Both the Northwest Passage and the Northern Sea route appear to be open. Throughout August, sea ice extent tracked near the record lows of 2007, underscoring the continued decline in Arctic ice cover.

Note: Arctic sea ice extent will likely reach its minimum extent for the year sometime in the next two weeks. NSIDC will make a preliminary announcement when ice extent has stopped declining and has increased for several days in a row. Monthly data for September will be released in early October.

map from space showing sea ice extent, continentsFigure 1. Arctic sea ice extent for August 2011 was 5.52 million square kilometers (2.13 million square miles). The magenta line shows the 1979 to 2000 median extent for that month. The black cross indicates the geographic North Pole. Sea Ice Index data. About the data. —Credit: National Snow and Ice Data Center
High-resolution image


Overview of conditions

Average ice extent for August 2011 was 5.52 million square kilometers (2.13 million square miles). This is 160,000 square kilometers (61,800 square miles) above the previous record low for the month, set in August 2007, and 2.15 million square kilometers (830,000 square miles), or 28% below the average for 1979 to 2000. Sea ice coverage remained below normal everywhere except the East Greenland Sea. In addition, several large areas of open water (polynyas) have opened within the ice pack.

On August 31, 2011 Arctic sea ice extent was 4.63 million square kilometers (1.79 million square miles). This is 100,000 square kilometers (38,600 square miles) higher than the previous record low for the same day of the year, set in 2007. As of September 5, ice extent had fallen below the minimum ice extents in September 2010 and 2008 (previously the third- and second-lowest minima in the satellite record). If ice stopped declining in extent today it would be the second-lowest minimum extent in the satellite record.

Higher-resolution Advanced Microwave Scanning Radiometer-Earth Observing System (AMSR-E) data processed by the University of Bremen showed ice extent on September 5 as falling below the same date in 2007.

graph with months on x axis and extent on y axis Figure 2. The graph above shows daily Arctic sea ice extent as of September 5, 2011, along with daily ice extents for previous low-ice-extent years. Light blue indicates 2011, dashed green shows 2007, dark blue shows 2010, purple shows 2008, and dark gray shows the 1979 to 2000 average. The gray area around the average line shows the two standard deviation range of the data. Sea Ice Index data.—Credit: National Snow and Ice Data Center
High-resolution image


Conditions in context

In August, sunlight wanes in the Arctic and the sea ice decline starts to slow down. Although the decline slowed somewhat during August, ice extent retreated at a faster pace than average, at a pace of 67,700 square kilometers (26,100 square miles) per day. In comparison, the average rate of decline for August 1979 to 2000 was 53,700 square kilometers (20,700 square miles) per day.

Air temperatures were 1 to 4 degrees Celsius (2 to 7 degrees Fahrenheit) higher than average (relative to the 1981 to 2010 climatology) over the Arctic Ocean (measured approximately 1000 meters above the surface). The strongest anomalies were over the Northwest Passage region. High pressure persisted over much of the central Arctic Ocean, associated with a wind pattern that helped to push ice from the Beaufort Sea westward into the Chukchi Sea. This may have slowed some ice loss in the Chukchi Sea region. However, the wind pattern also transported ice into open waters warmed during the summer, fostering melt.

monthly average data graph Figure 3. Monthly August ice extent for 1979 to 2011 shows a decline of 9.3% per decade. —Credit: NSIDC
High-resolution image


August 2011 compared to previous years

Average Arctic sea ice extent for August 2011 was the second-lowest for August in the satellite data record. Including 2011 the linear trend for August now stands at –9.3% per decade.

figure 4 Figure 4. This time series shows total sea ice area (top) and multi-year ice area (bottom) for selected years within the Western Parry Channel route of the Northwest Passage. The black line with red dots shows 2011, and other colors show ice conditions in different years.—Credit: NSIDC courtesy Stephen Howell, Environment Canada, from Canadian Ice Service data
High-resolution image


Northwest Passage sea ice at record low levels

Sea ice is now almost completely gone from the channels of the Northwest Passage, with the exception of a small strip of ice across a stretch of the Parry Channel. The southern route (Amunden’s Route) is ice free. According to the Canadian Ice Service, sea ice extent in the western Parry Channel is now the lowest at this time of year since record keeping began in 1966 and very little multi-year ice remains. According to Multisensor Analyzed Sea Ice Extent (MASIE) data, ice cover across the Canadian Archipelago is at record low levels.

The Northern Sea Route along Siberia remains ice-free, with a number of cargo ships passing through in recent weeks. However, some areas of older, thicker ice have helped preserve the tongue of ice extending into the East Siberian Sea.

figure 5 Figure 5. This photograph from the NASA ICESCAPE mission in July shows melt ponds on the surface of the Arctic sea ice cover. Surface melt has now stopped as air temperatures have cooled. But relatively warm water will continue to melt the ice from below for another couple of weeks.—Credit: NASA/Kathryn Hansen
High-resolution image


Will Arctic sea ice extent reach a new record in 2011?

The melt season for Arctic sea ice will soon draw to a close. Surface melt has already largely ended and the ocean waters are cooling. Air temperatures at the North Pole have fallen below freezing. However, with the ice cover now thinner than in years past, there is a greater potential for late-season ice loss, caused by warm water melting ice from below or winds that push the ice together.

Whether Arctic sea ice breaks a new record hinges on three factors: First, how much heat is left in the ocean to eat away at the ice edge and bottom? Second, will wind patterns blow the ice together and reduce ice extent or will they disperse the ice and expand ice extent? Finally, just how thin is the remaining ice cover? Thin ice quickly melts away when it is surrounded by warm water.

For previous analyses, please see the drop-down menu under Archives in the right navigation at the top of this page.

Arctic sea ice at the crossroads

After a period of slow melt from late July through early August, Arctic ice extent is again declining at a brisk pace, but remains higher than for 2007, the record low year. Data also indicate continued thinning of the ice. With about a month left in the sea ice melt season, the amount of further ice loss will depend mostly on weather patterns.

map from space showing sea ice extent, continentsFigure 1. Arctic sea ice extent on August 14, 2011 was 5.56 million square kilometers (2.15 million square miles). The orange line shows the 1979 to 2000 median extent for that day. The black cross indicates the geographic North Pole. Sea Ice Index data. About the data. —Credit: National Snow and Ice Data Center
High-resolution image


Overview of conditions

As of August 14, 2011, Arctic sea ice extent was 5.56 million square kilometers (2.15 million square miles), 2.11 million square kilometers (815,000 square miles) below the 1979 to 2000 average for that day, and 220,000 square kilometers (84,900 square miles) above the extent on that day in 2007.

Sea ice is low across almost all of the Arctic, with the exception of some areas of the East Greenland Sea. It is exceptionally low in the Laptev and Kara Sea areas.

The southern route of the Northwest Passage now appears to be free of sea ice according to imagery from the University of Bremen and the NSIDC Multisensor Analyzed Sea Ice Extent (MASIE) analyses. However, U.S. National Ice Center analyses indicate that there may be up to 20% ice concentration remaining in some parts of the route.

graph with months on x axis and extent on y axis Figure 2. The graph above shows daily Arctic sea ice extent as of August 14, 2011, along with daily ice extents for previous low-ice-extent years. Light blue indicates 2011, dashed green shows 2007, dark blue shows 2010, purple shows 2008, and dark gray shows the 1979 to 2000 average. The gray area around the average line shows the two standard deviation range of the data. Sea Ice Index data.—Credit: National Snow and Ice Data Center
High-resolution image


Conditions in context

Arctic sea ice loss slowed down in late July through early August; then over the past week, the rate of ice loss sped up. At present there is more ice than at the same time in 2007, which saw the record minimum September extent.

Data from the Advanced Microwave Scanning Radiometer – Earth Observing System (AMSR-E) sensor, processed by the University of Bremen, show ice tracking near 2007 levels. The AMSR-E instrument can detect small but widespread areas of open water within the ice pack in the Beaufort and East Siberian seas, because of its resolution (6.25 kilometers or 3.88 miles). Normally, NSIDC uses data from the Defense Meteorological Satellite Program (DMSP) F17 Special Sensor Microwave Imager/Sounder (SSMIS). F17 provides a longer time series of data, but at a 25-kilometer (15.5-mile) resolution.

amsr and modis image Figure 3. The map of sea level pressure for the first half of August shows high pressure over Greenland and the central Arctic, surrounded by low-pressure areas. This weather pattern has contributed to a speed-up in ice loss so far in August.—Credit: NSIDC courtesy NOAA/ESRL Physical Sciences Division
High-resolution image


A change in the weather

During early summer, a high-pressure cell persisted over the northern Beaufort Sea, promoting ice loss. This weather pattern broke down toward the end of July, slowing ice loss but spreading out the ice pack, making it thinner on average. The weather has now changed again, bringing another high-pressure pattern. Winds associated with this pressure pattern generally bring warm temperatures, and tend to push the ice together and reduce overall extent. In the Kara Sea, the combination of a high-pressure cell with low pressure to the west has resulted in strong northward ice movement, pushing the ice pack away from the coast and reducing ice extent. The same weather pattern is also increasing the movement of ice out of Fram Strait, between Greenland and Spitsbergen.

figure 4: melt onset map of Arctic Figure 4. This map shows surface melt (in red) and bottom melt (in yellow) of the sea ice cover at ice mass balance buoy (IMB) sites on July 20, 2011. Surface melt at IMB sites located in the vicinity of the ice edge are consistent with past years. IMB sites located closer to the North Pole are melting more on the surface than on the underside. Data provided by D. Perovich and J. Richter-Menge.—Credit: NSIDC courtesy US Army Cold Regions Research and Engineering Laboratory
High-resolution image


Summer melt and sea ice thickness

Data indicate that the Arctic ice cover continues to thin. Sea ice thickness is also an indicator of the health of the ice cover; thick ice is resistant to melt. Specialized buoys managed by the U.S. Army Cold Regions Research and Engineering Laboratory help supplement limited satellite measurements of sea ice thickness. The buoys provide accurate data at specific locations, and can tell us whether thickness changes are due to surface melt, melt at the bottom of the ice floe, or ice growth. These buoys are deployed on thick multiyear ice, which provide long-lasting, stable platforms.

Data from six of these buoys through July 20 show that this year, the ice surface is melting faster than the underside of the ice. As the sun starts to sink on the horizon, surface melt will slow. However, ocean waters warmed during the summer will continue to melt the ice from below, reducing ice thickness and extent into September.

figure 5: ice volume graphic from UW Figure 5. This graph shows total Arctic sea ice volume averaged by month. The 1979 to 2010 average is marked by black circles, 2007 is represented by black crosses, and the current year is shown with blue triangles. The dark gray and light gray areas represent the 1 and 2 standard deviation range of the data. The data were estimated by the University of Washington Polar Science Center PIOMAS model. —Credit: NSIDC courtesy Unviersity of Washington APL/PSC
High-resolution image


Ice volume

Combining ice thickness with sea ice area gives the total sea ice volume. At present, researchers cannot measure volume directly, so they estimate the volume with computer models. The University of Washington’s Pan-Arctic Ice Ocean Modeling and Assimilation System (PIOMAS) model combines data on sea ice concentration with models of ocean and atmospheric conditions to estimate total ice volume. Sea ice volume normally changes with the seasons, but monthly estimates through July 2011 show that the volume for each month has tracked well below the 1979 to 2010 average, and below the volume for 2007, which saw the record low ice extent. PIOMAS projects that this year’s minimum volume in September will very likely finish below 2007 and could even reach a record low volume.

References

Perovich, D.K., J.A. Richter-Menge, B. Elder, K. Claffey, and C. Polashenski. 2009. Observing and understanding climate change: Monitoring the mass balance, motion, and thickness of Arctic sea ice. http://IMB.crrel.usace.army.mil.

Schweiger, A., R. Lindsay, J. Zhang, M. Steele, H. Stern. 2011. Uncertainty in modeled Arctic sea ice volume, Journal of Geophysical Research. doi:10.1029/2011JC007084. In press.

Zhang, J.L. and D.A. Rothrock. 2003. Modeling global sea ice with a thickness and enthalpy distribution model in generalized curvilinear coordinates, Monthly Weather Review, 131, 845-861.

For previous analyses, please see the drop-down menu under Archives in the right navigation at the top of this page.