Please note that this is a preliminary announcement. Changing winds could still push ice floes together, reducing ice extent further. NSIDC scientists will release a full analysis of the melt season in early October, once monthly data are available for September.
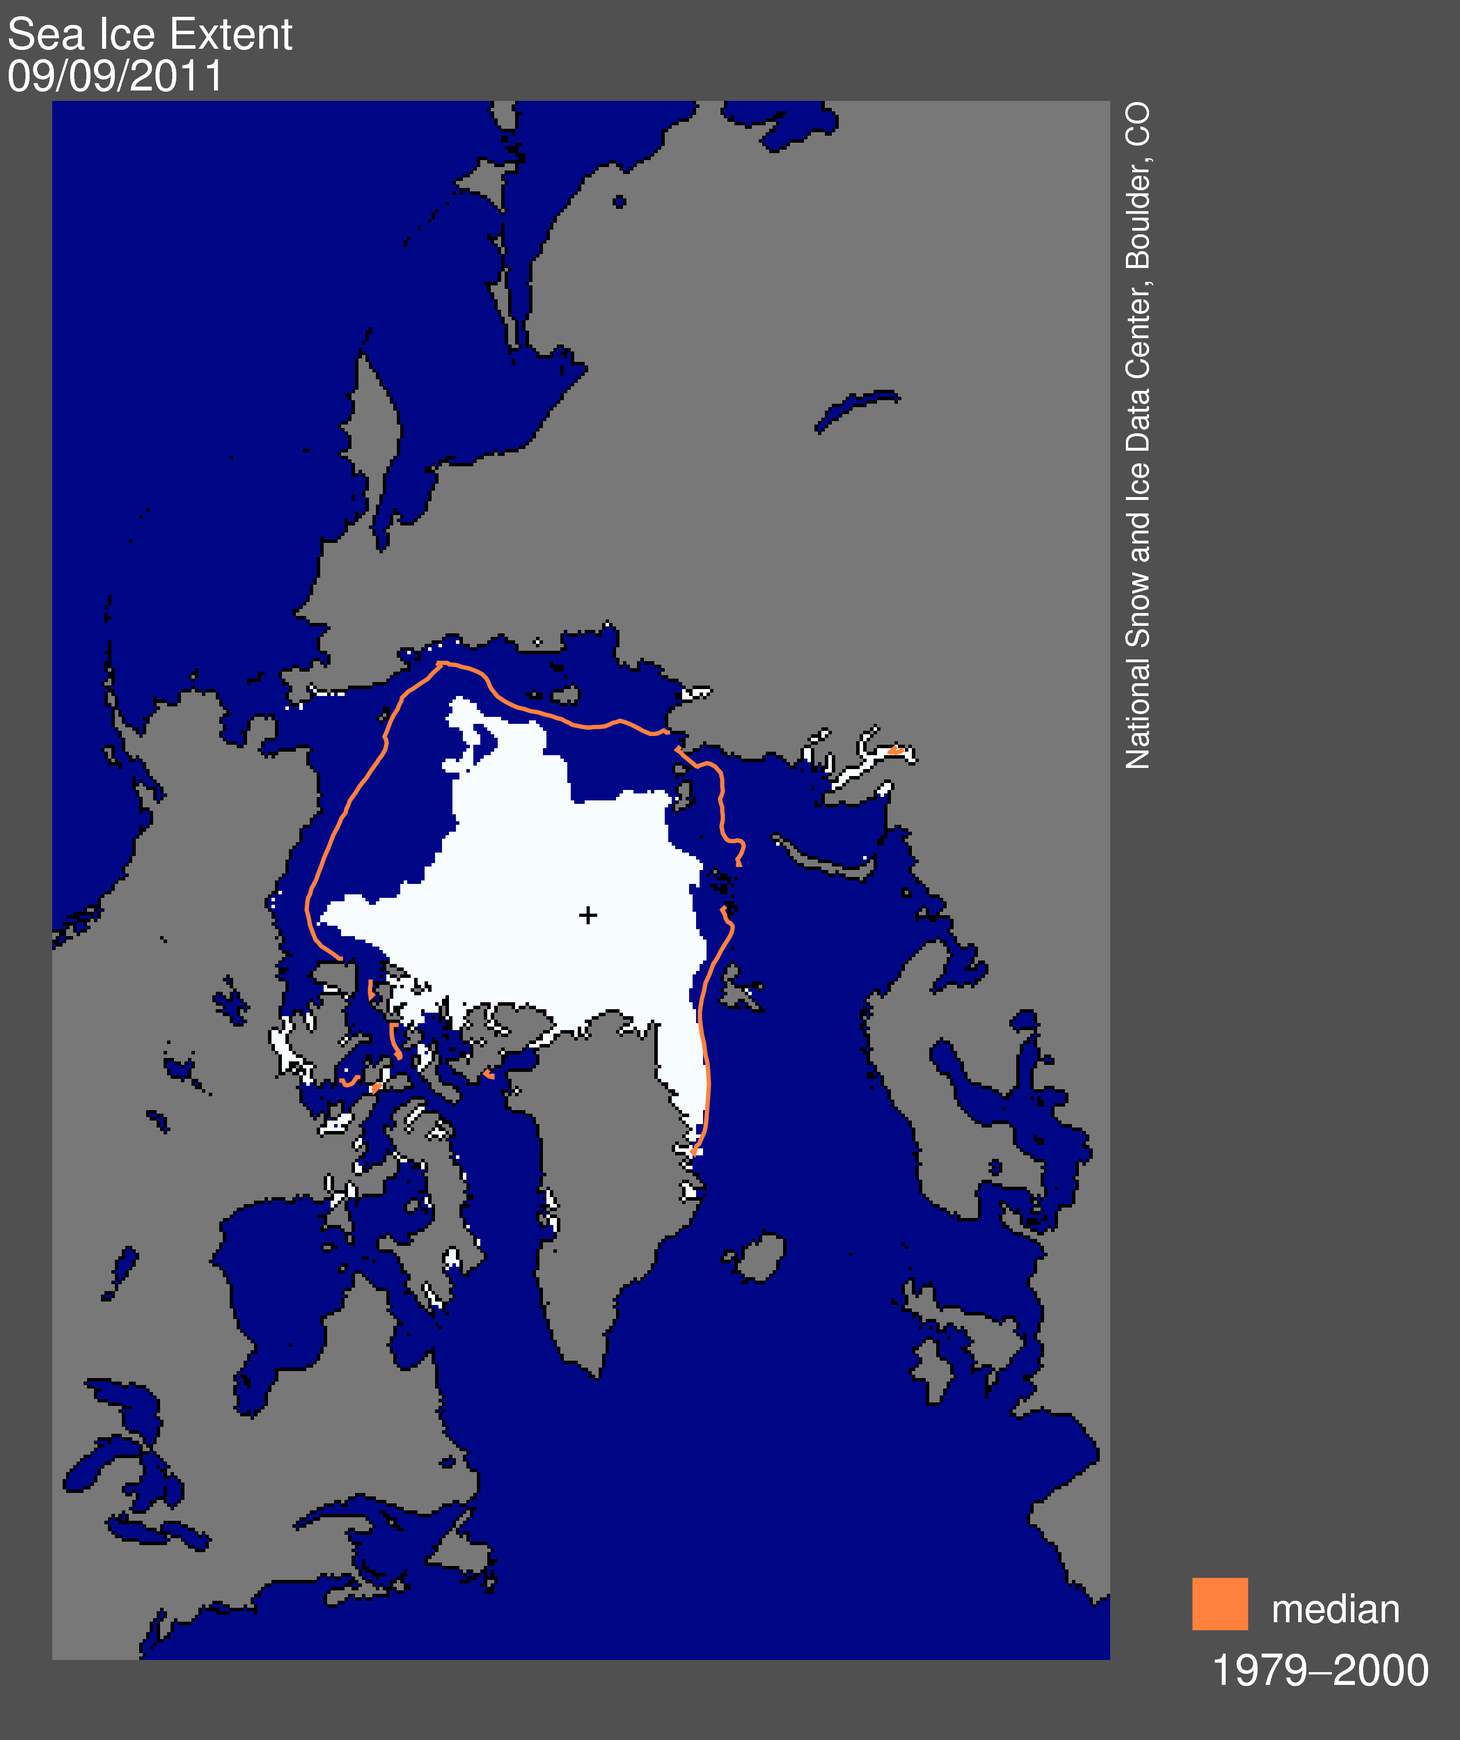 Figure 1. Arctic sea ice extent on September 9, 2011 was 4.33 million square kilometers (1.67 million square miles). The orange line shows the 1979 to 2000 median extent for that day. The black cross indicates the geographic North Pole. Sea Ice Index data.—Credit: National Snow and Ice Data Center
High-resolution image
Overview of conditions
On September 9, 2011 sea ice extent dropped to 4.33 million square kilometers (1.67 million square miles). This appears to have been the lowest extent of the year, and may mark the point when sea ice begins its cold-season cycle of growth. However, a shift in wind patterns or late season melt could still push the ice extent lower.
This year’s minimum was 160,000 square kilometers (61,800 square miles) above the 2007 record minimum extent, and 2.38 million square kilometers (919,000 square miles) below the 1979 to 2000 average minimum. Note that our estimated uncertainty for extent is plus or minus 50,000 square kilometers (about 20,000 square miles). The minimum ice extent this year is very close to 2007, and indeed some other research groups place 2011 as the lowest on record. At this point, using our processing and sensor series, the 2011 minimum is a close second.
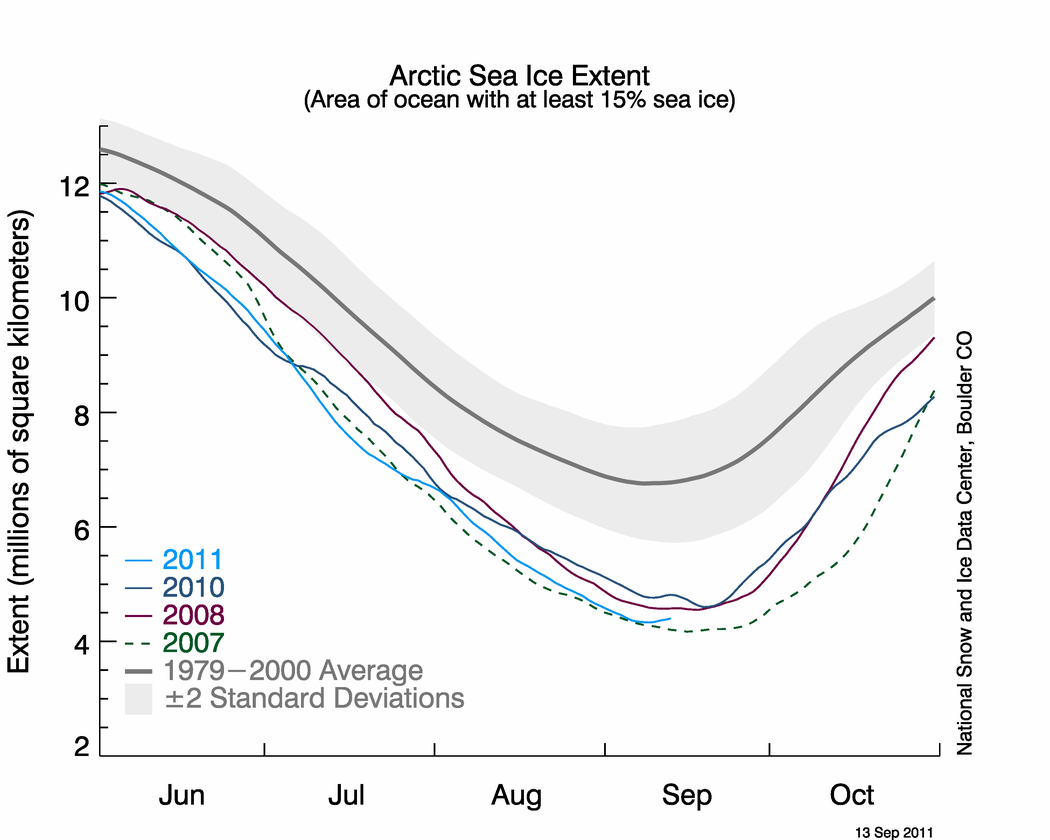 Figure 2. The graph above shows daily Arctic sea ice extent as of September 13, 2011, along with daily ice extents for the previous three lowest years for the minimum ice extent. Light blue indicates 2011, dashed green shows 2007, dark blue shows 2010, purple shows 2008, and dark gray shows the 1979 to 2000 average. The gray area around the average line shows the two standard deviation range of the data. Sea Ice Index data.—Credit: National Snow and Ice Data Center
High-resolution image
Conditions in context
The last five years (2007 to 2011) have been the five lowest extents in the continuous satellite record, which extends back to 1979. While the record low year of 2007 was marked by a combination of weather conditions that favored ice loss (including clearer skies, favorable wind patterns, and warm temperatures), this year has shown more typical weather patterns but continued warmth over the Arctic. This supports the idea that the Arctic sea ice cover is continuing to thin. Models and remote sensing data also indicate this is the case. A large area of low concentration ice in the East Siberian Sea, visible in NASA Moderate Resolution Imaging Spectroradiometer (MODIS) imagery, suggests that the ice cover this year is particularly thin and dispersed this year.
| Year | Minimum Ice Extent | Date | |
|---|---|---|---|
| in millions of square kilometers | in millions of square miles | ||
| 2007 | 4.17 | 1.61 | September 16 |
| 2008 | 4.55 | 1.76 | September 18 |
| 2009 | 5.10 | 1.97 | September 12 |
| 2010 | 4.60 | 1.78 | September 19 |
| 2011 | 4.33 | 1.67 | September 9 |
| 1979 to 2000 average | 6.71 | 2.59 | September 10 |
| 1979 to 2010 average | 6.29 | 2.43 | September 12 |
For previous analyses, please see the drop-down menu under Archives in the right navigation at the top of this page.

