The Arctic climate was extraordinary in 2020, but the year ended with a less spectacular December. Ice growth was faster than average throughout the month, but extent at month’s end remained among the lowest in the satellite record. Air temperatures for the month were higher than average in most areas, but less so than in many previous months. Overall, it was an extremely warm 2020, especially over Siberia.
Overview of conditions
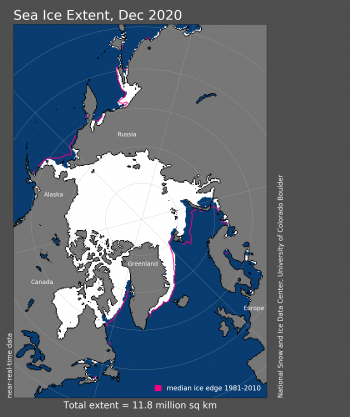
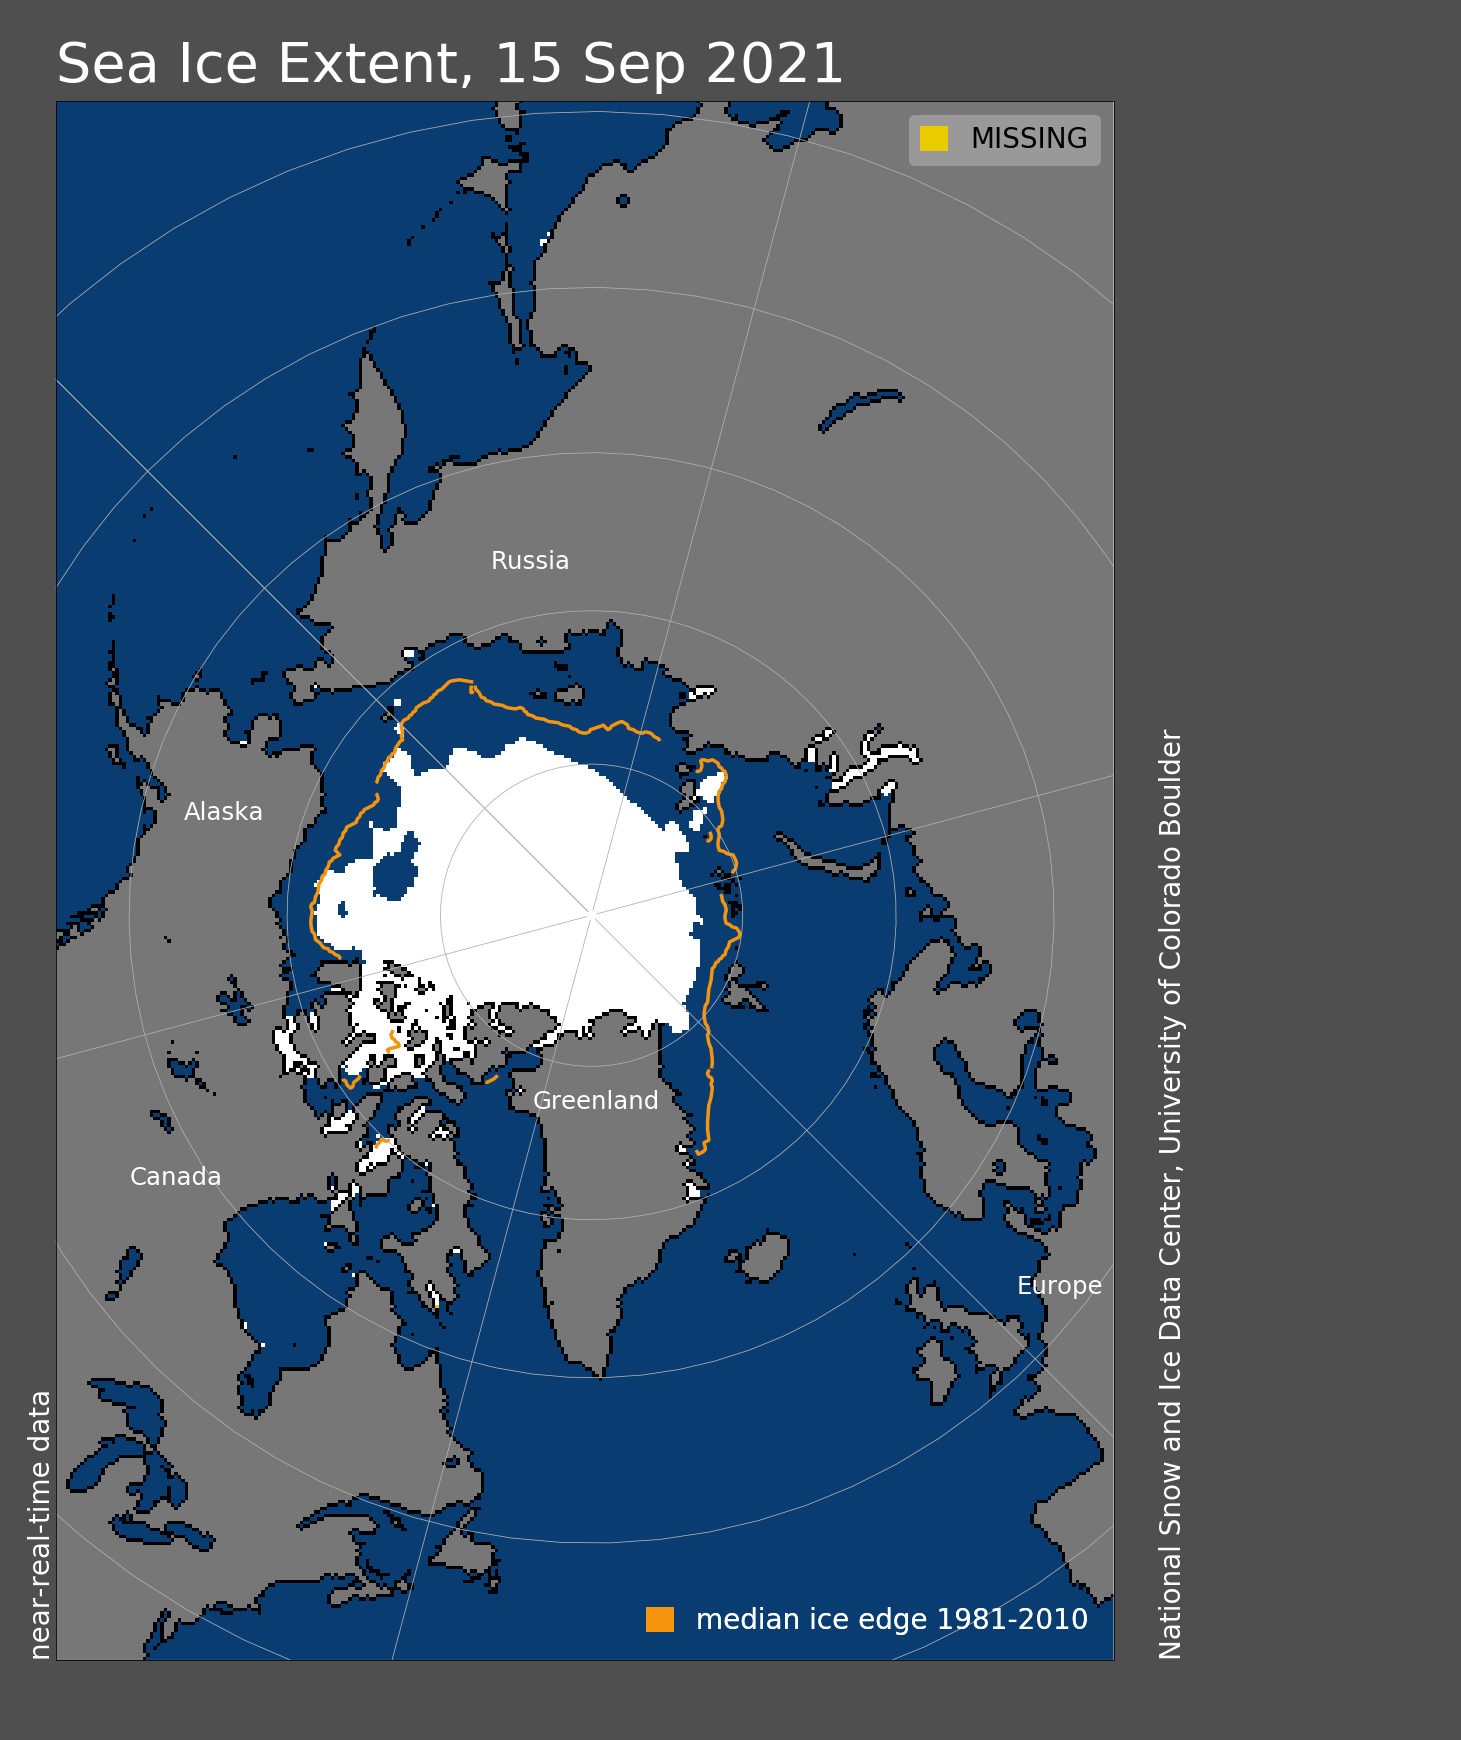
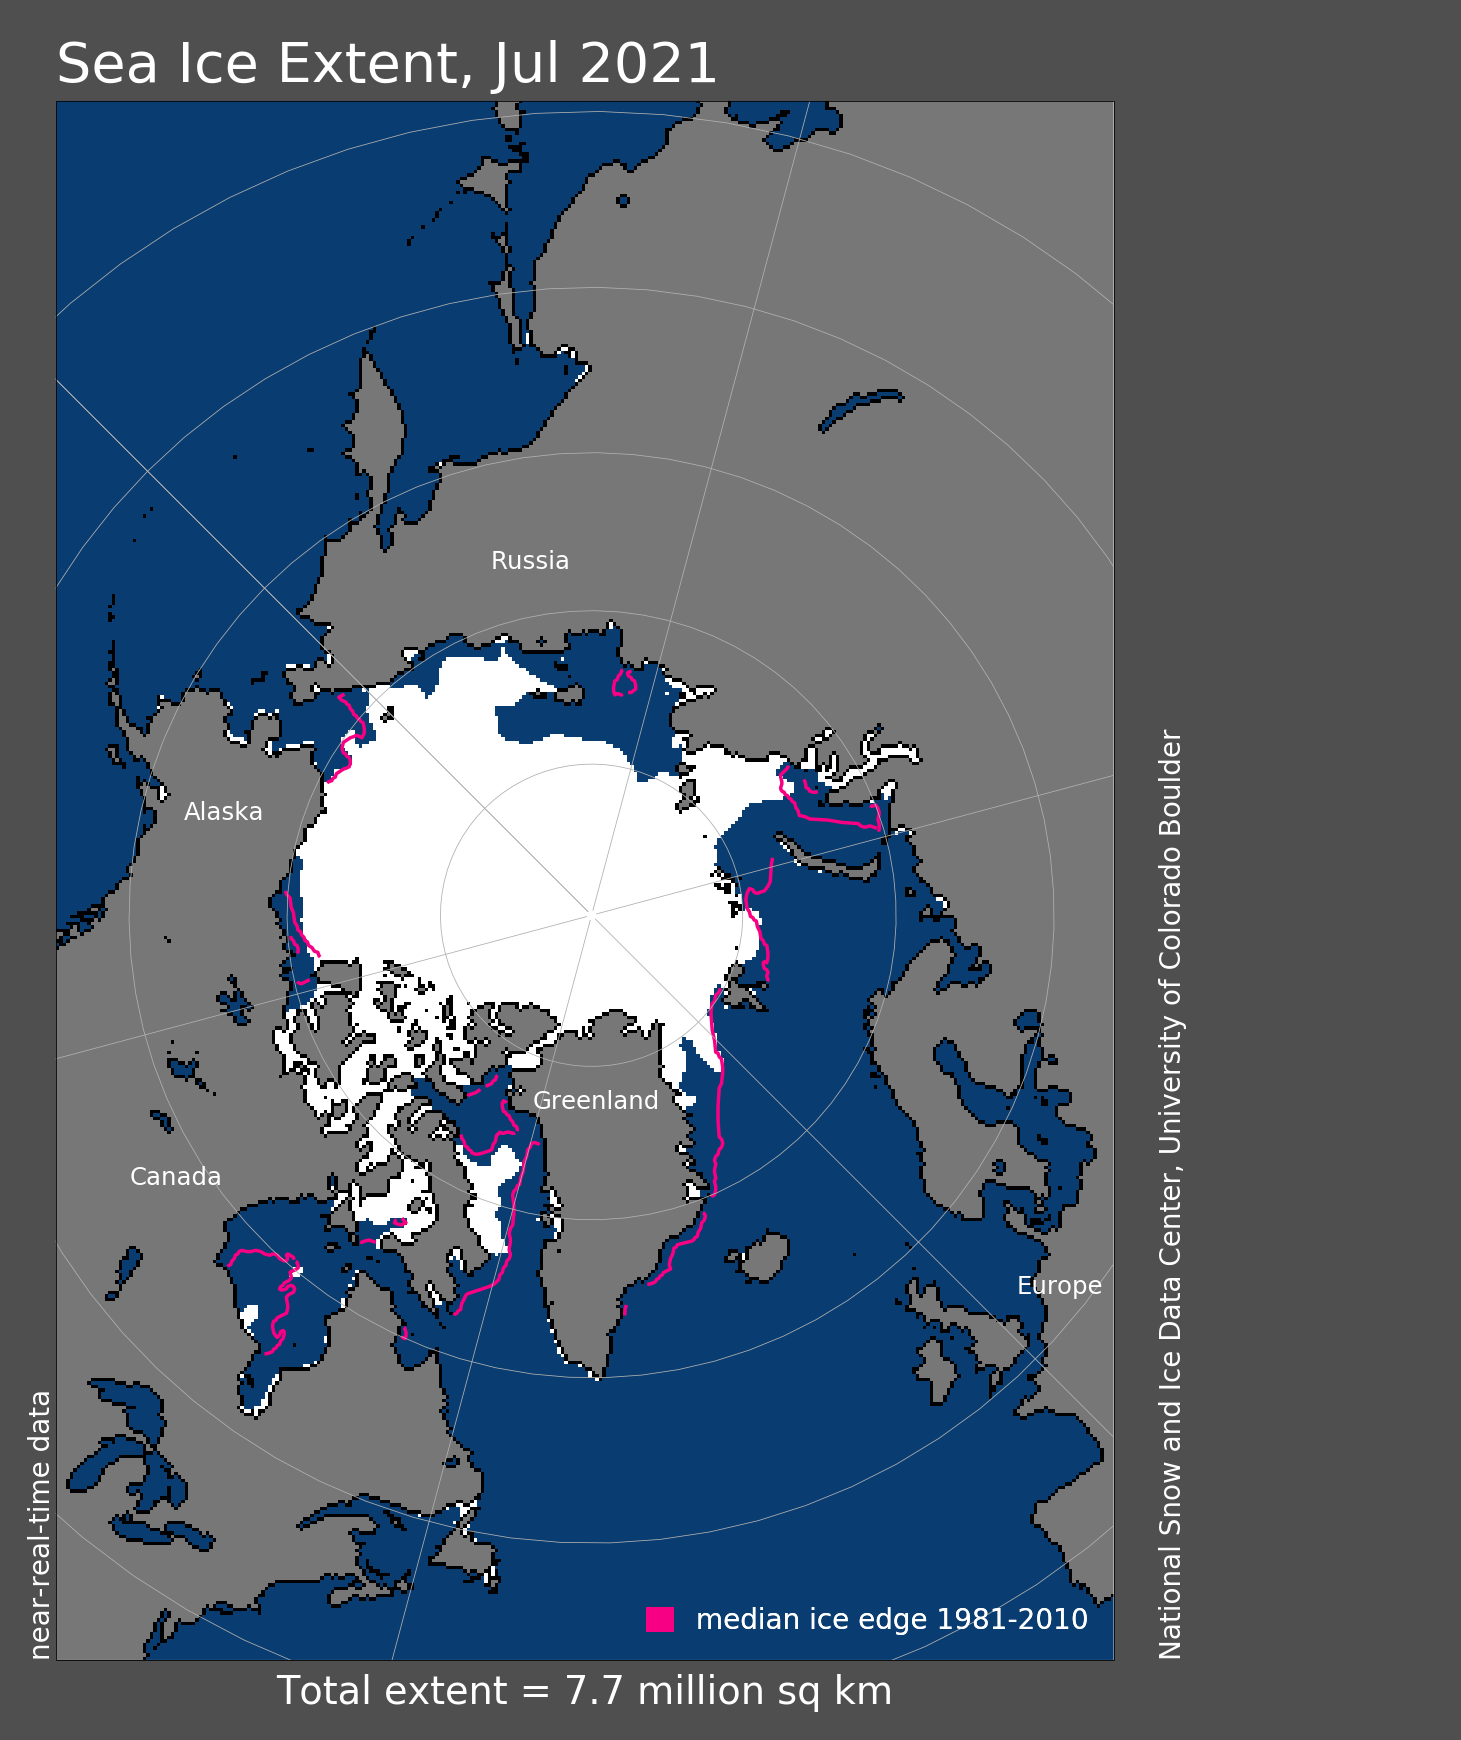
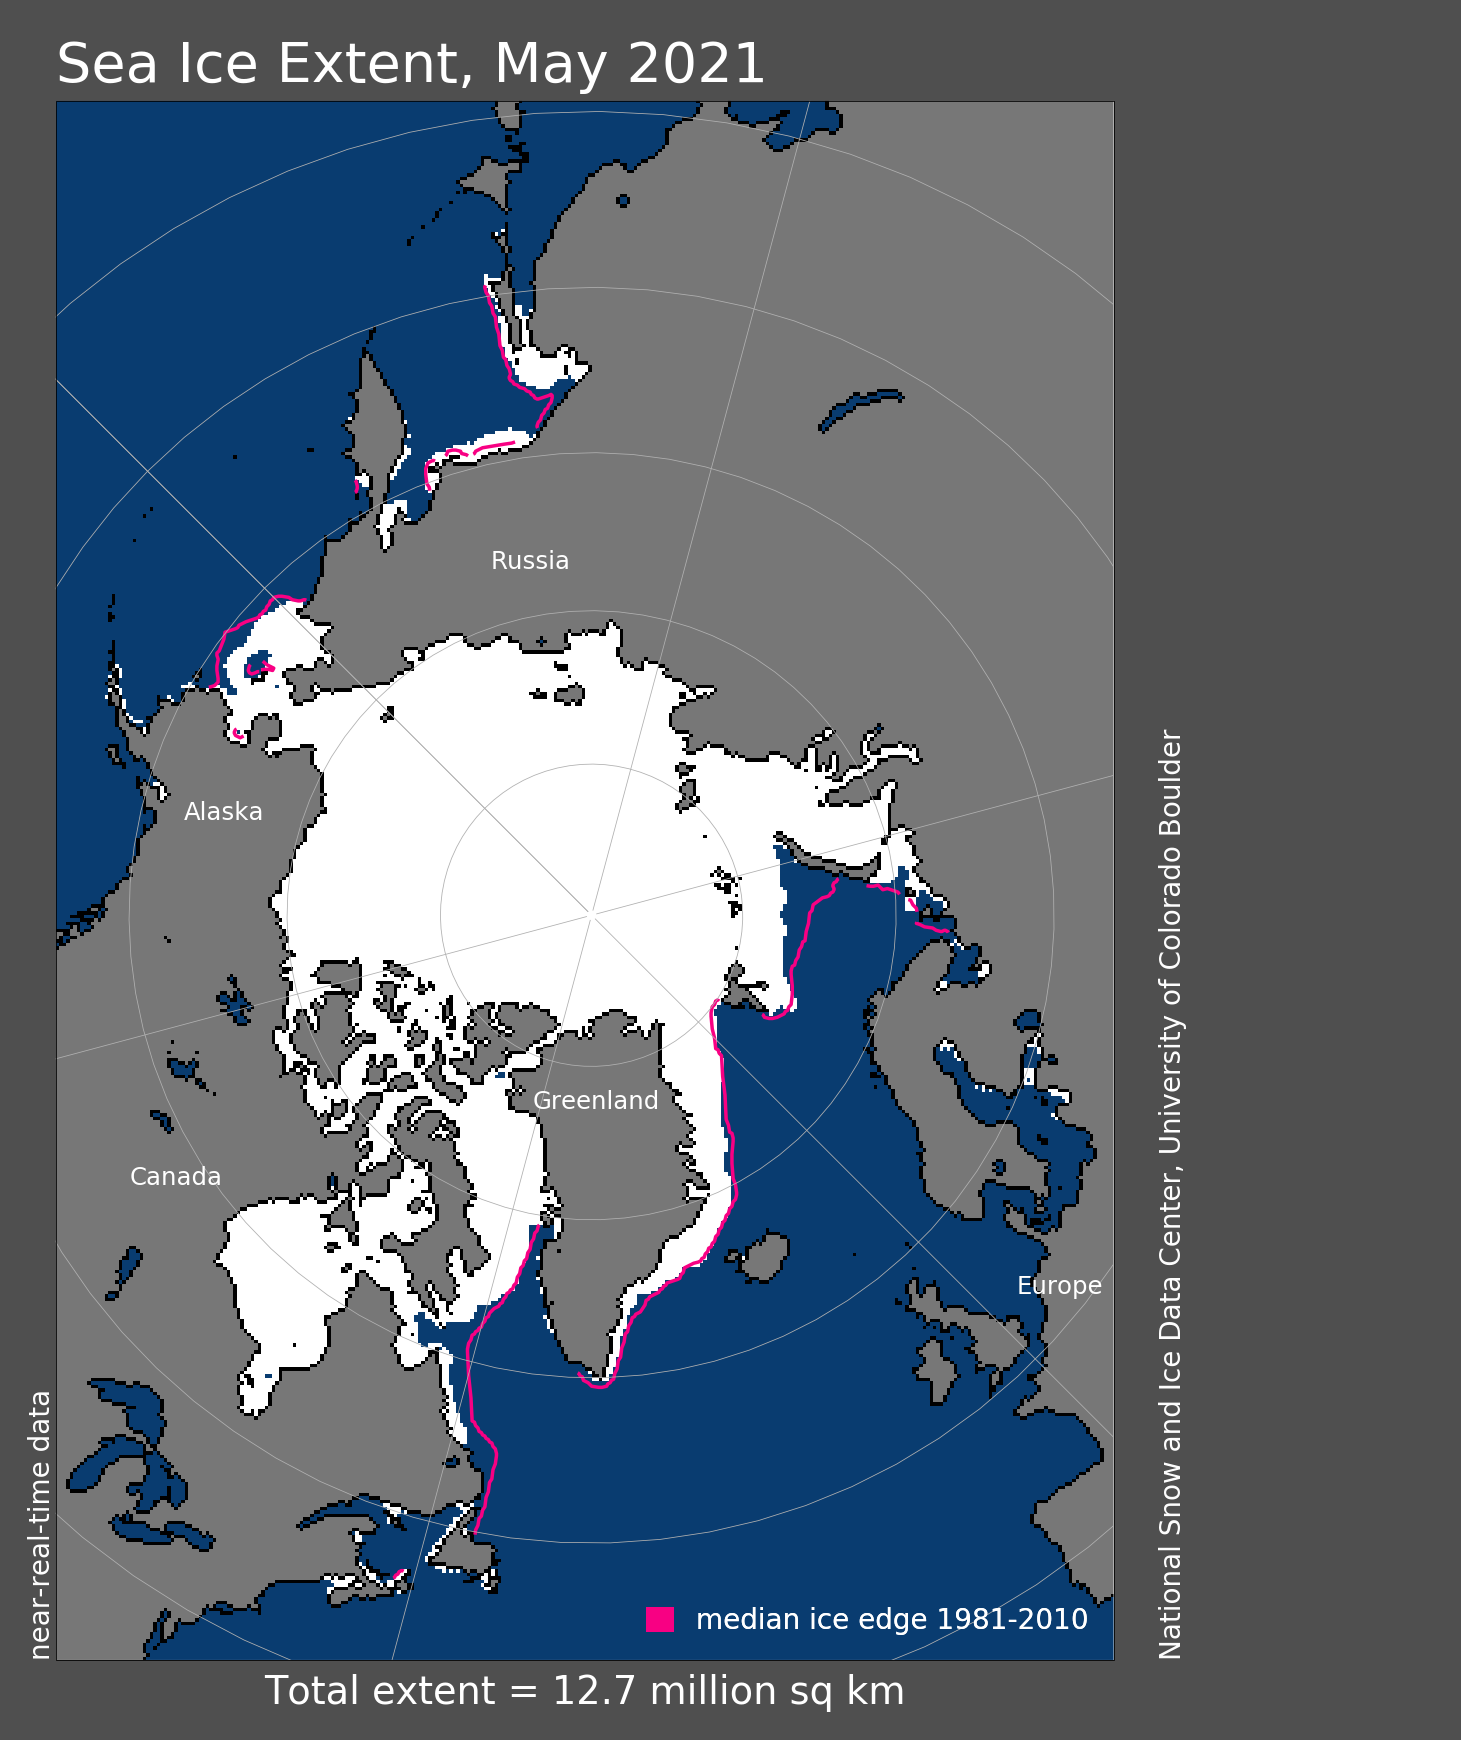
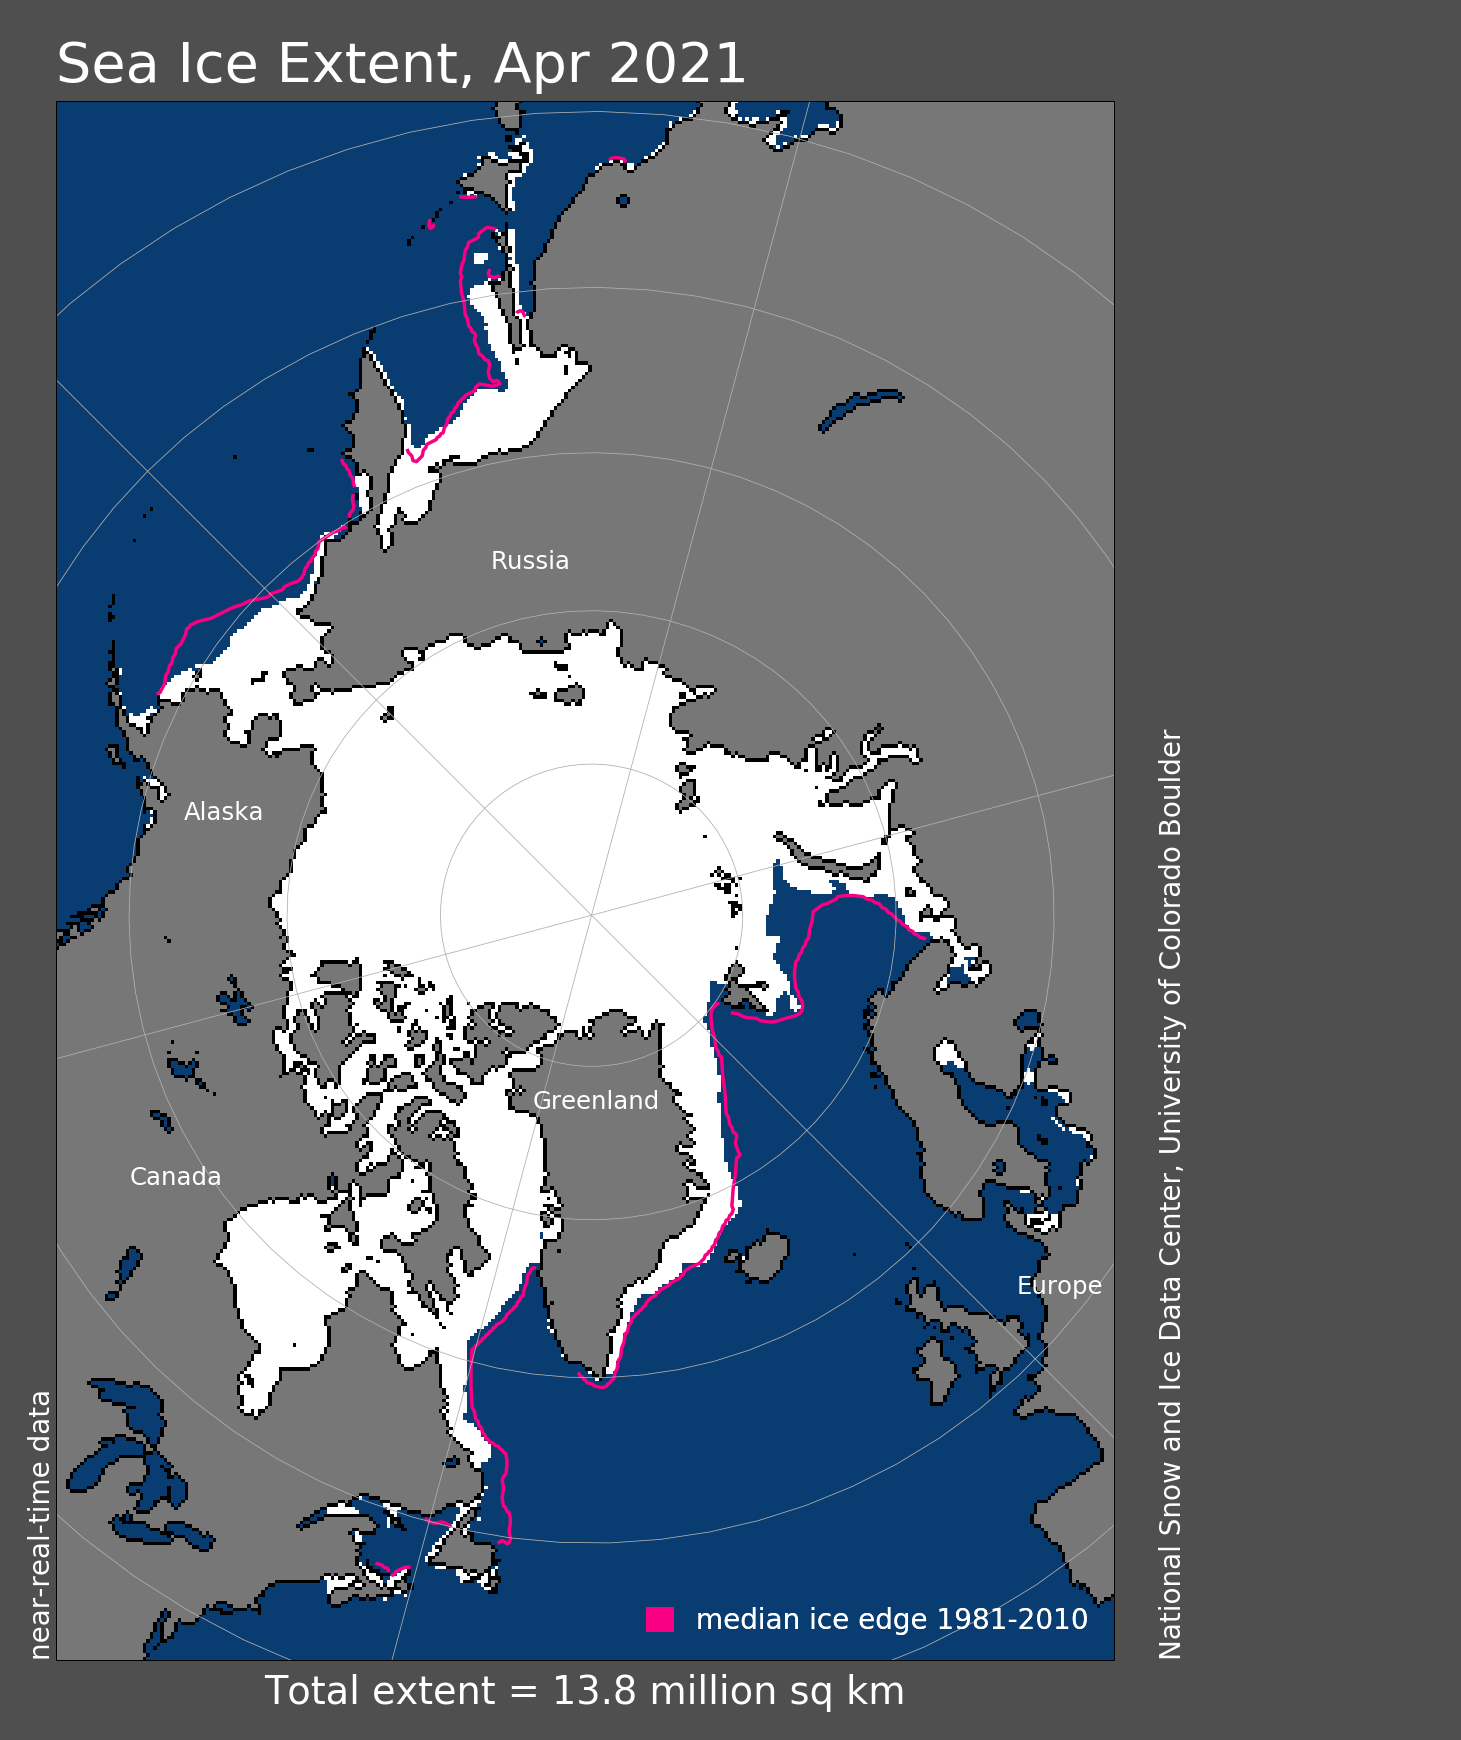
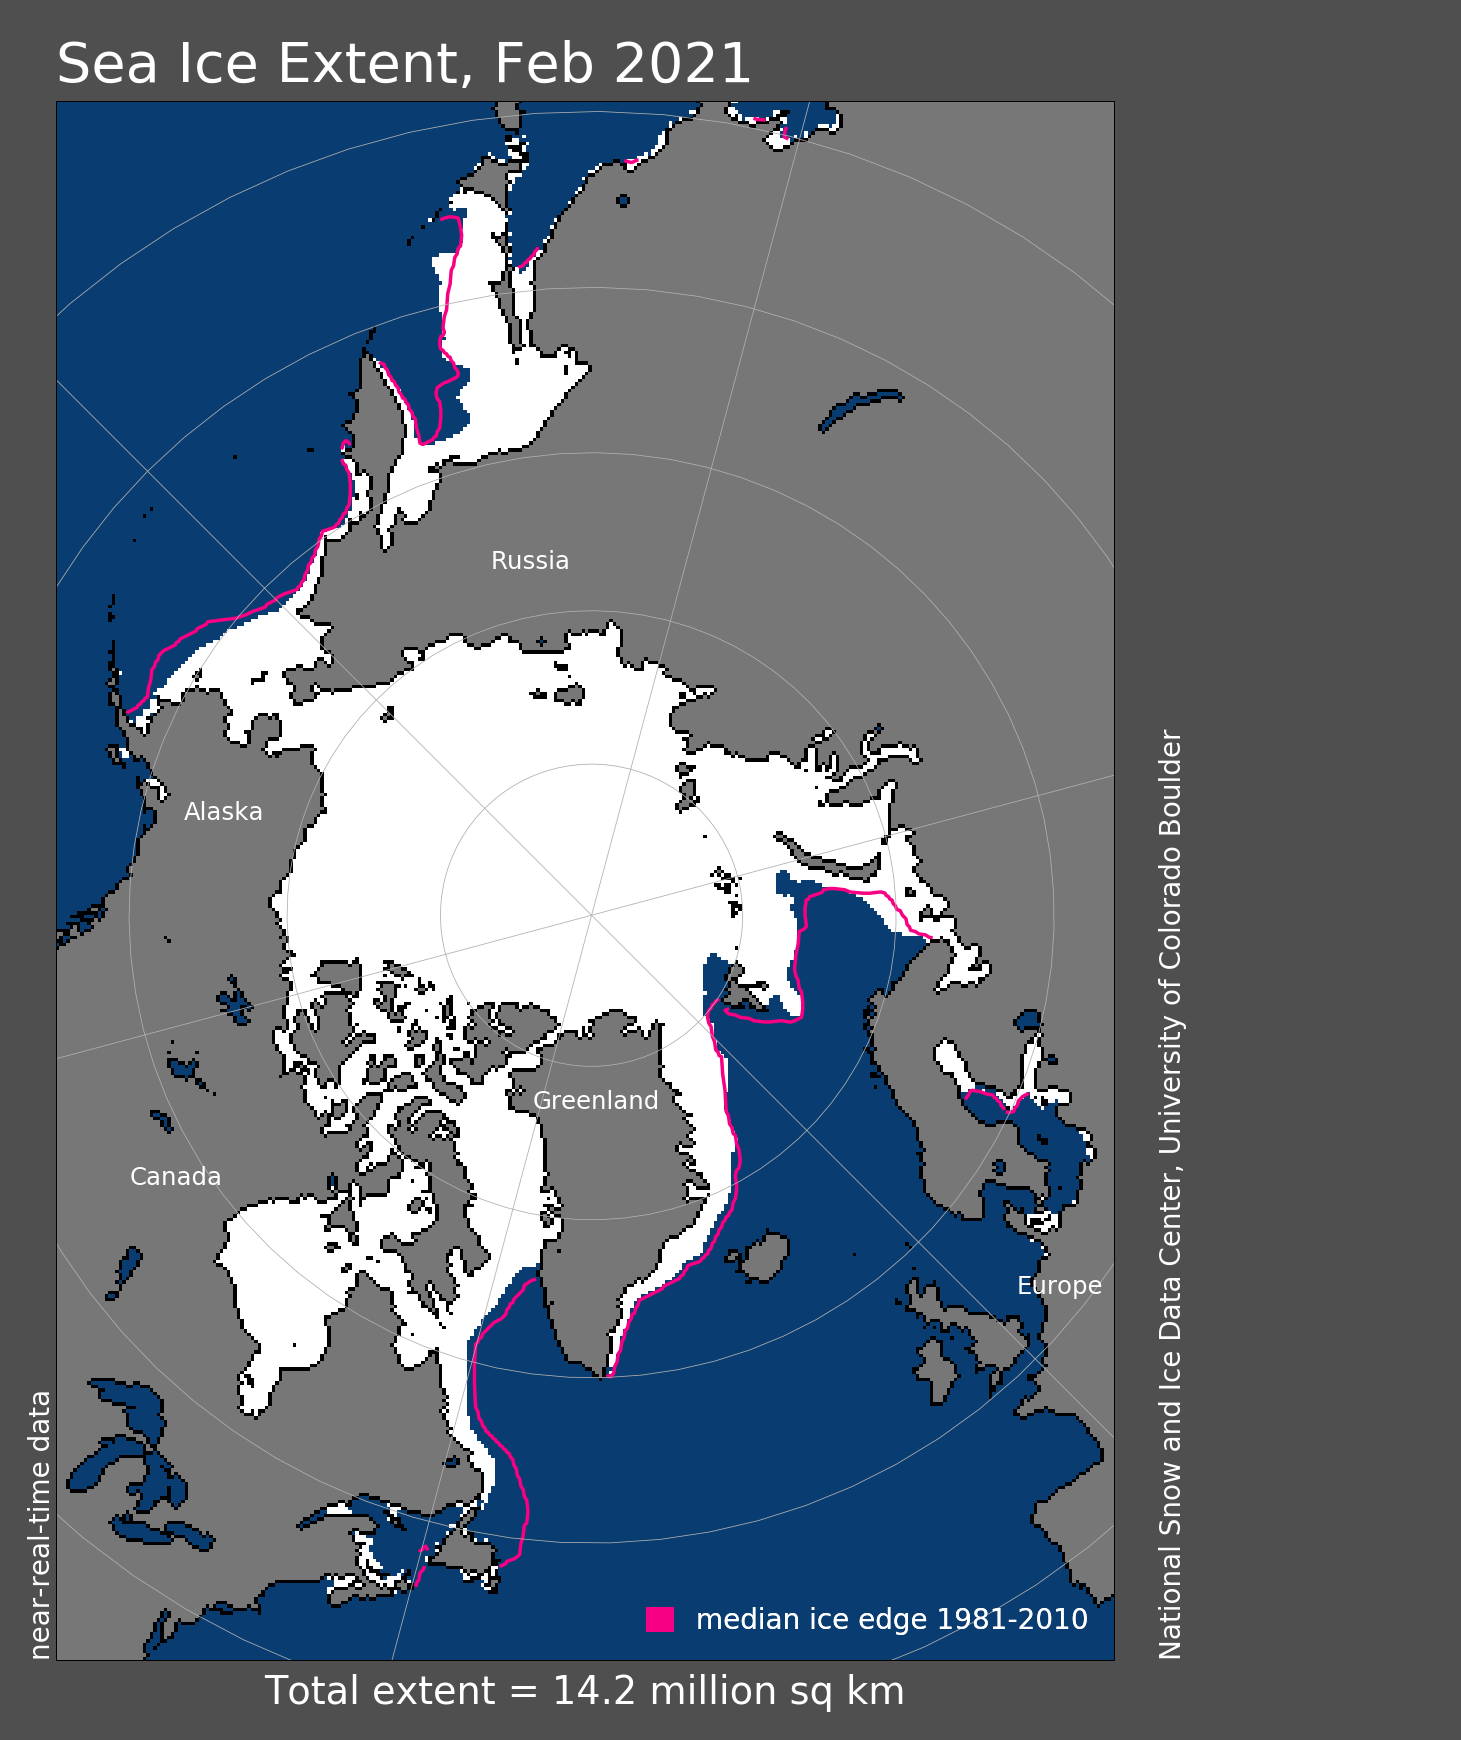
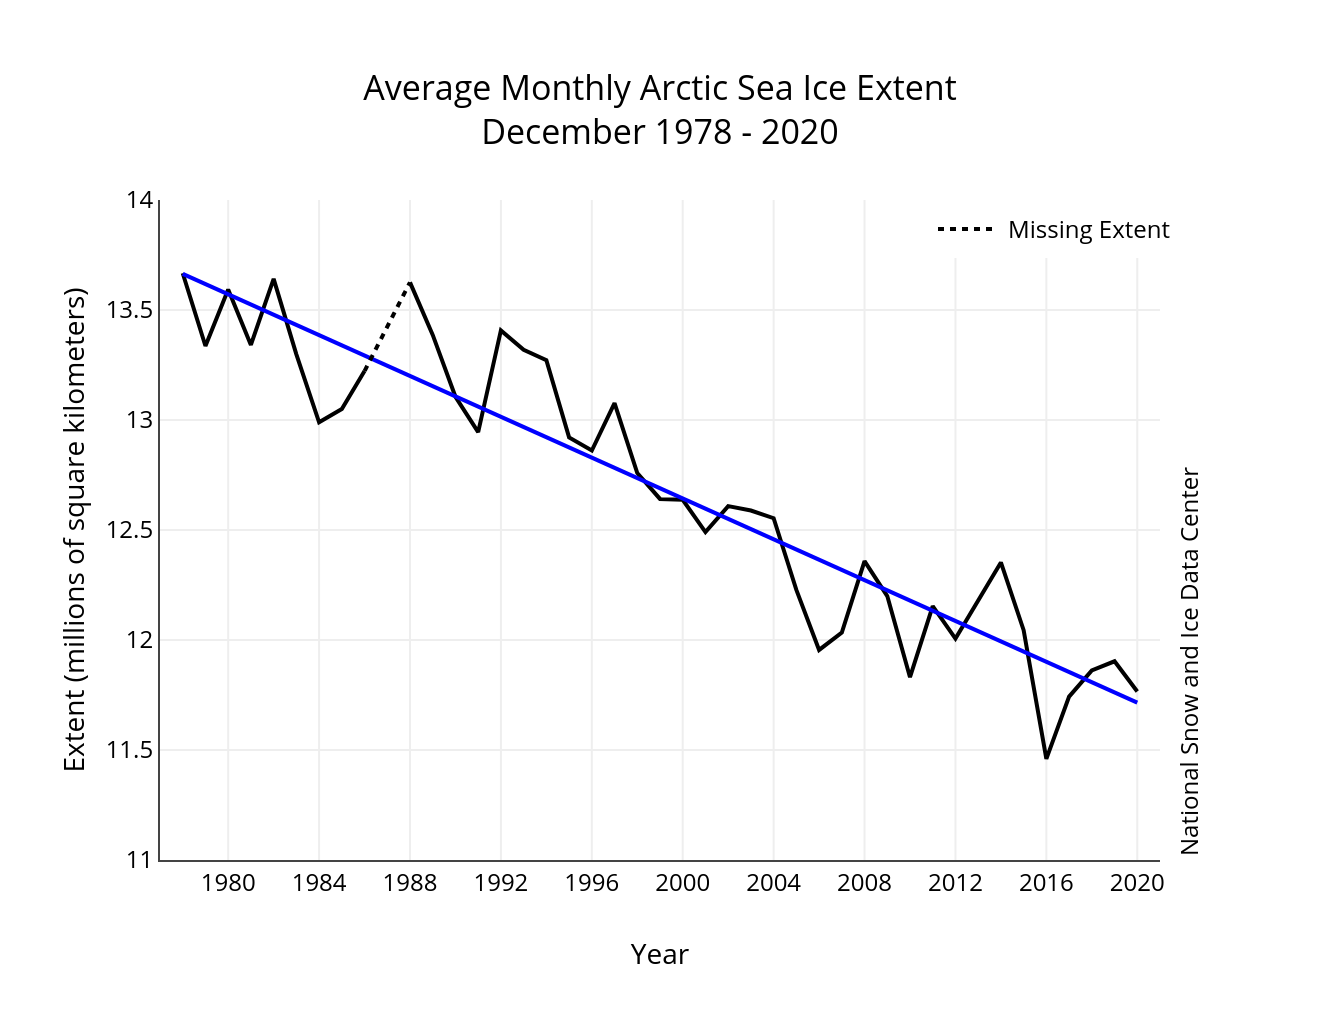
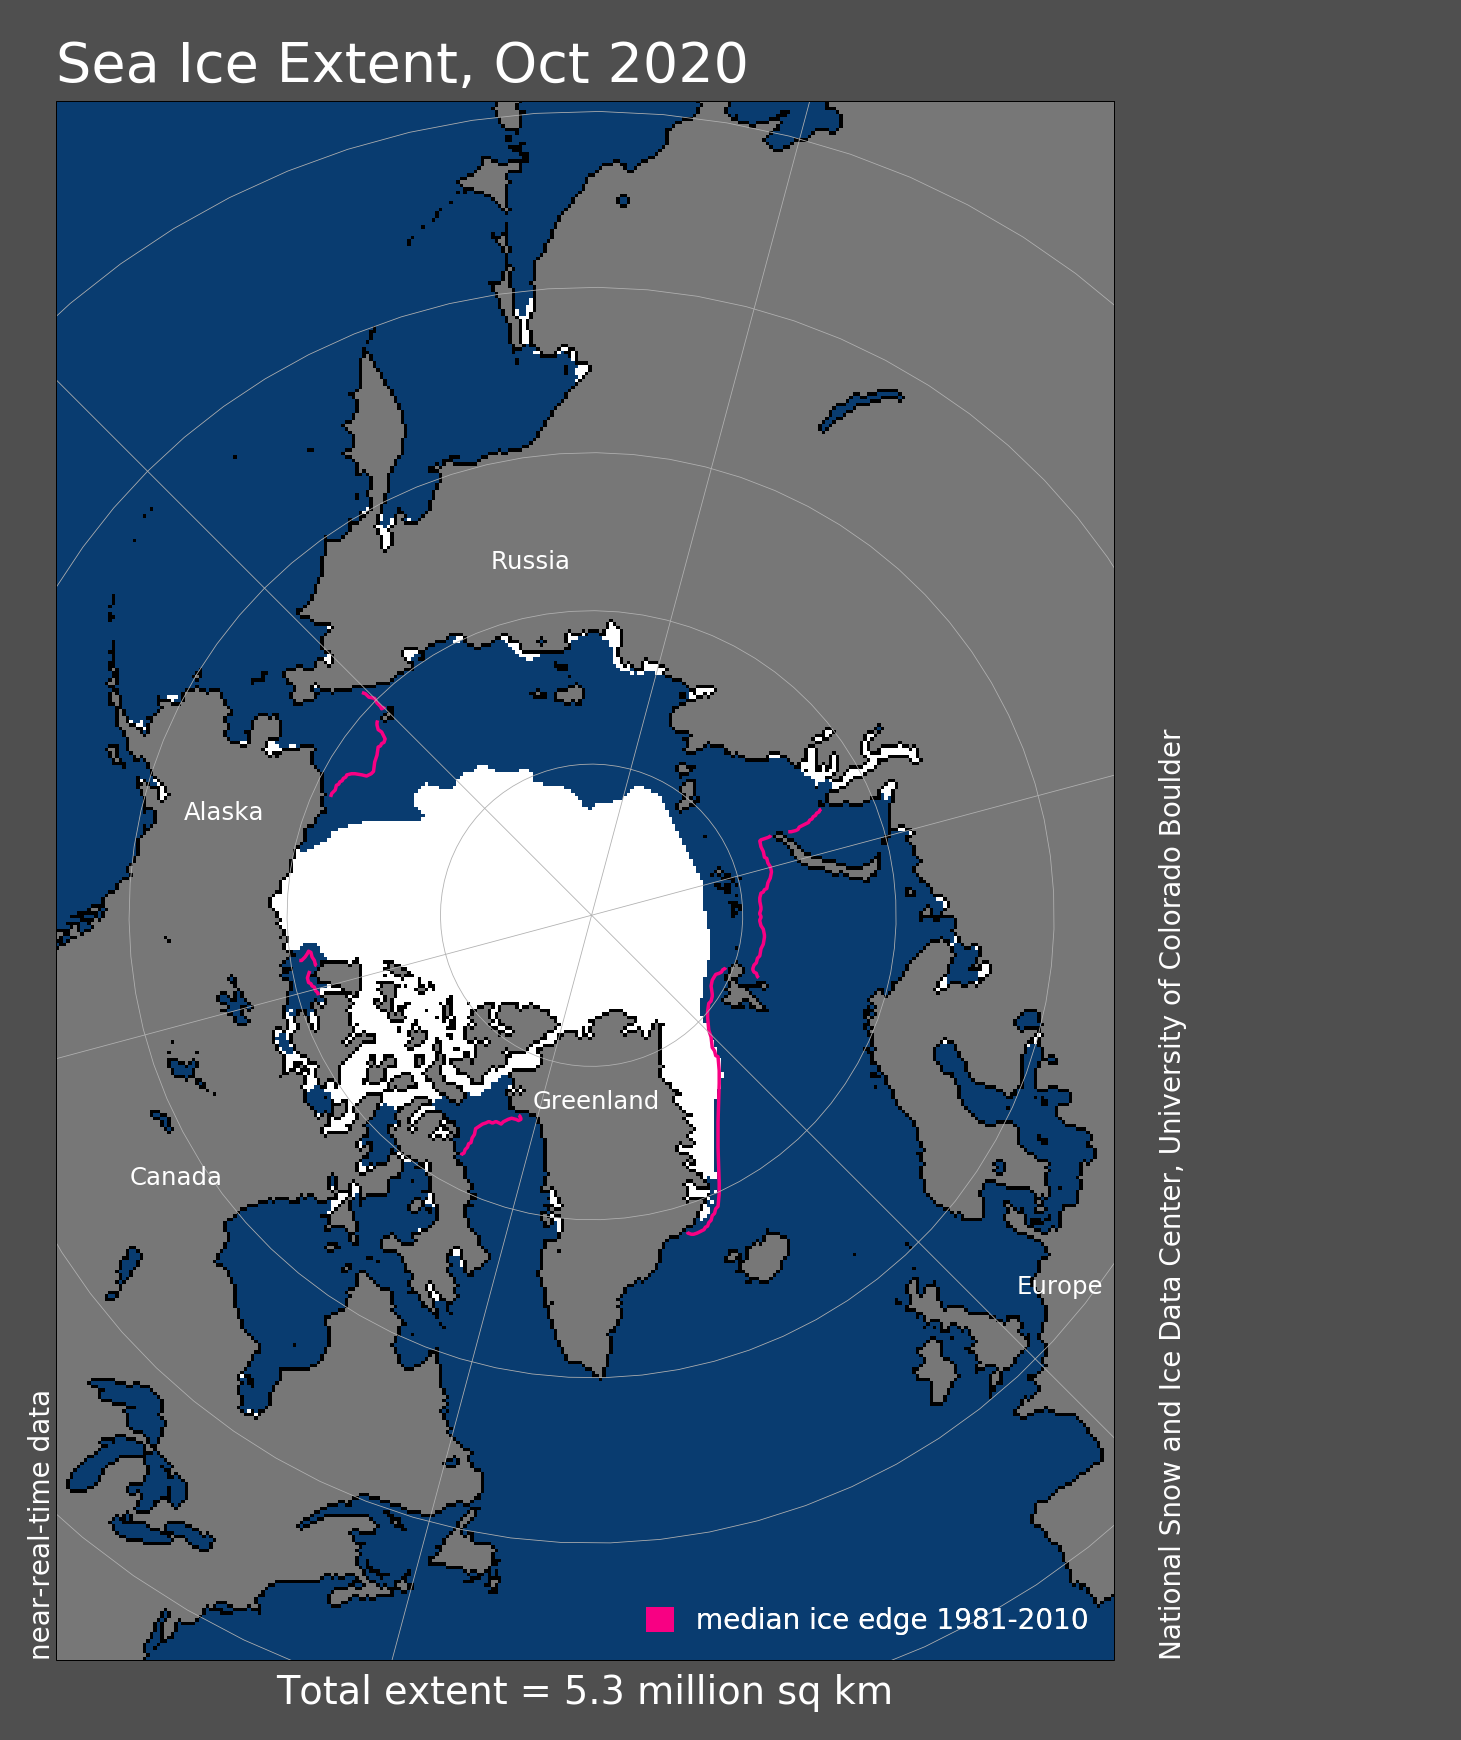
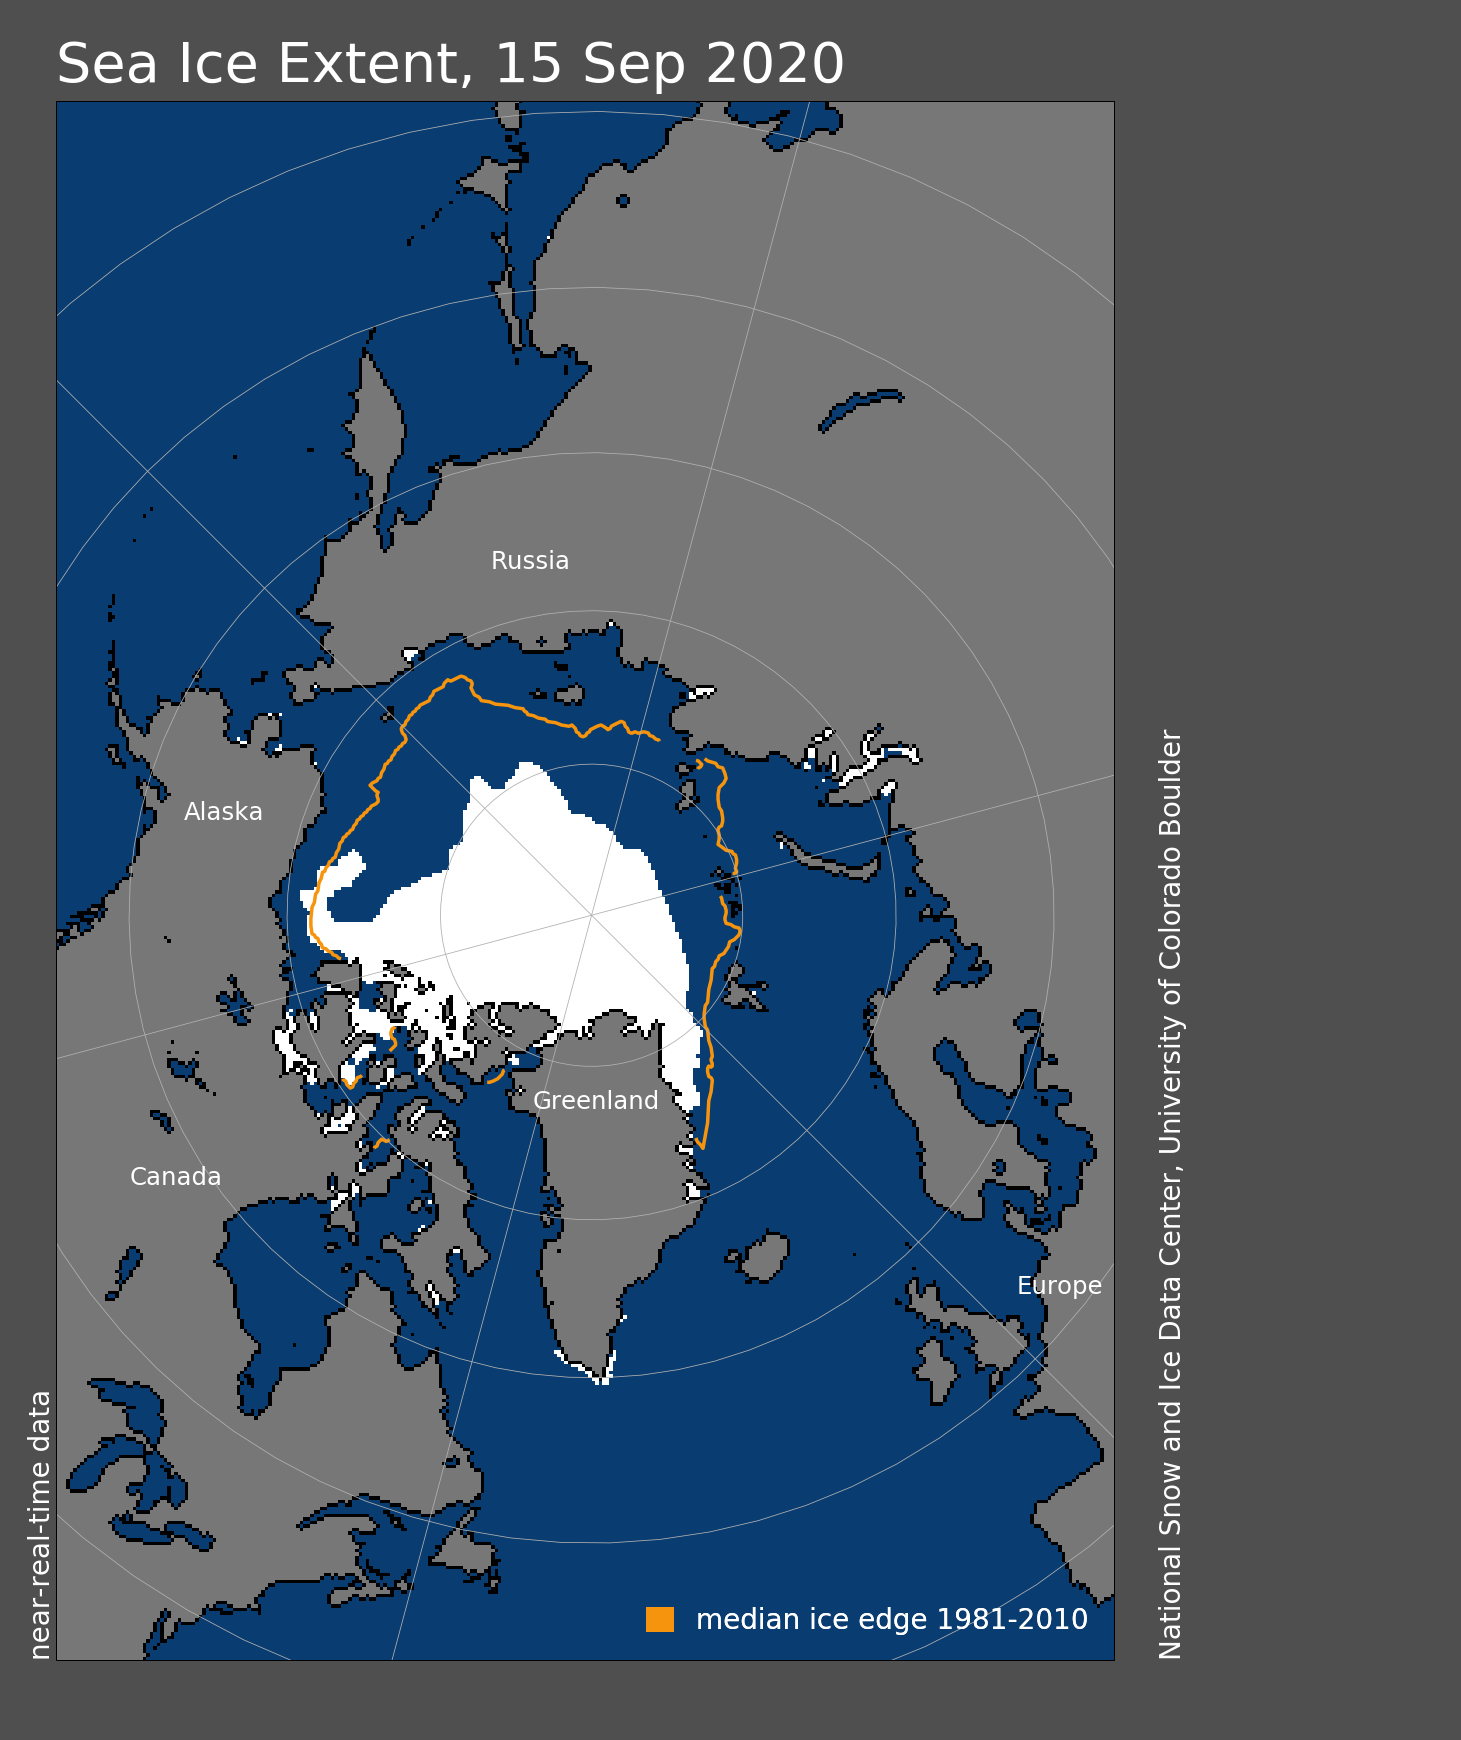
Figure 1. Arctic sea ice extent for December 2020 was 11.77 million square kilometers (4.54 million square miles). The magenta line shows the 1981 to 2010 average extent for that month. Sea Ice Index data. About the data
Credit: National Snow and Ice Data Center
High-resolution image
Arctic sea ice extent averaged for December 2020 was the third lowest in the satellite record. The monthly average extent of 11.77 million square kilometers (4.54 million square miles) was 1.07 million square kilometers (413,000 square miles) below the 1981 to 2010 December average. Sea ice cover was below average in the Bering Sea on the Pacific side and the Barents Sea on the Atlantic side. Compared to 2016, which had the lowest December sea ice extent on record, the ice edge in 2020 is further south in the Barents and East Greenland Seas, but further north in Davis Strait and the Labrador Sea.
Conditions in context
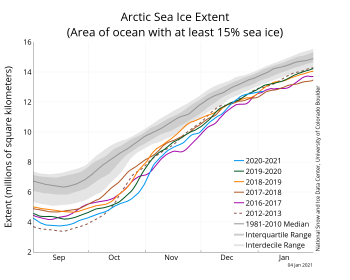
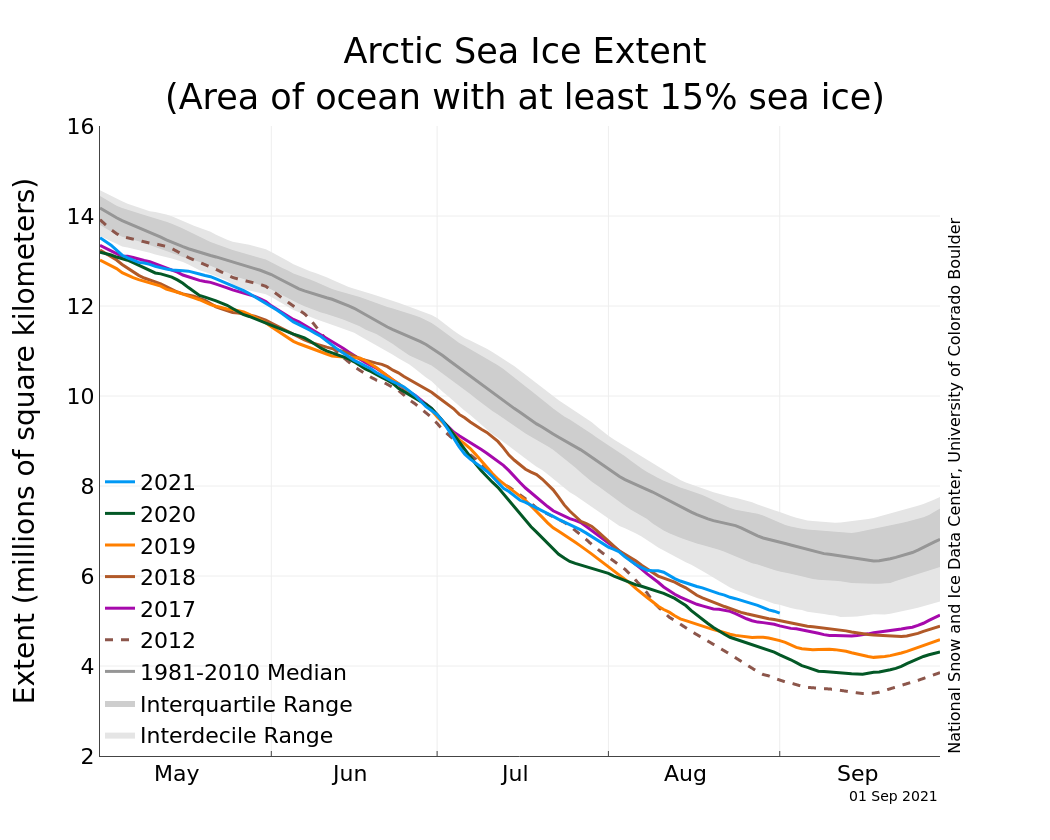
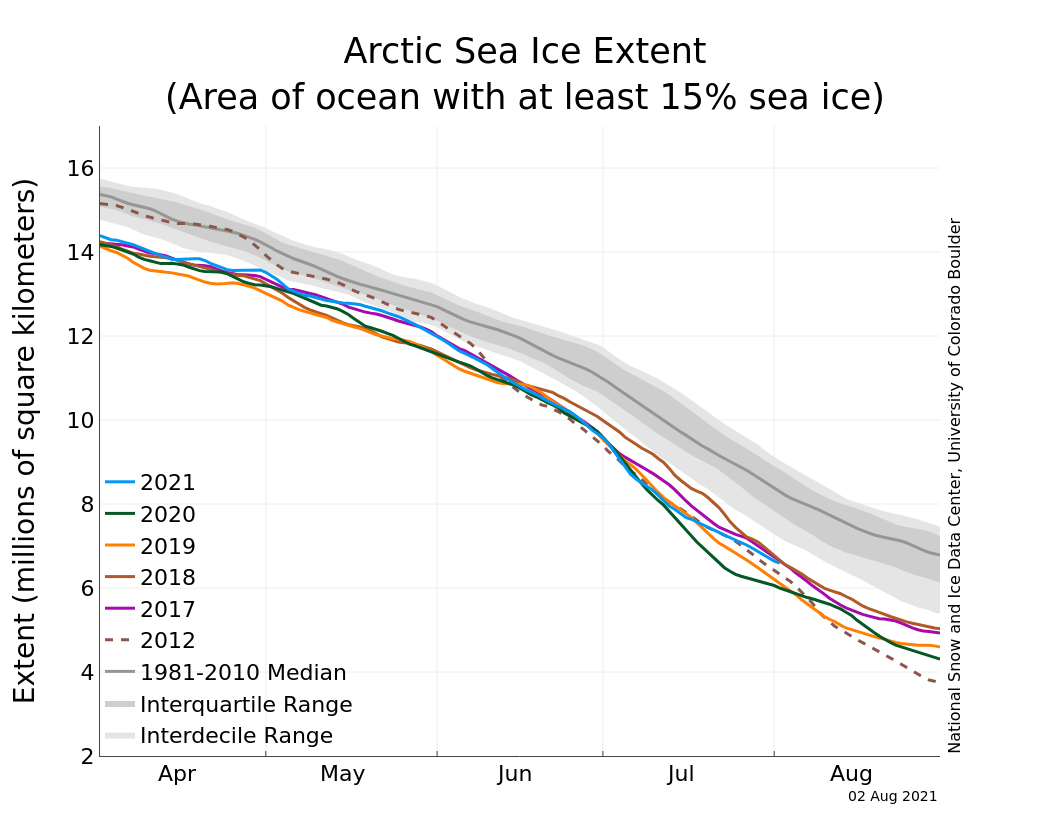
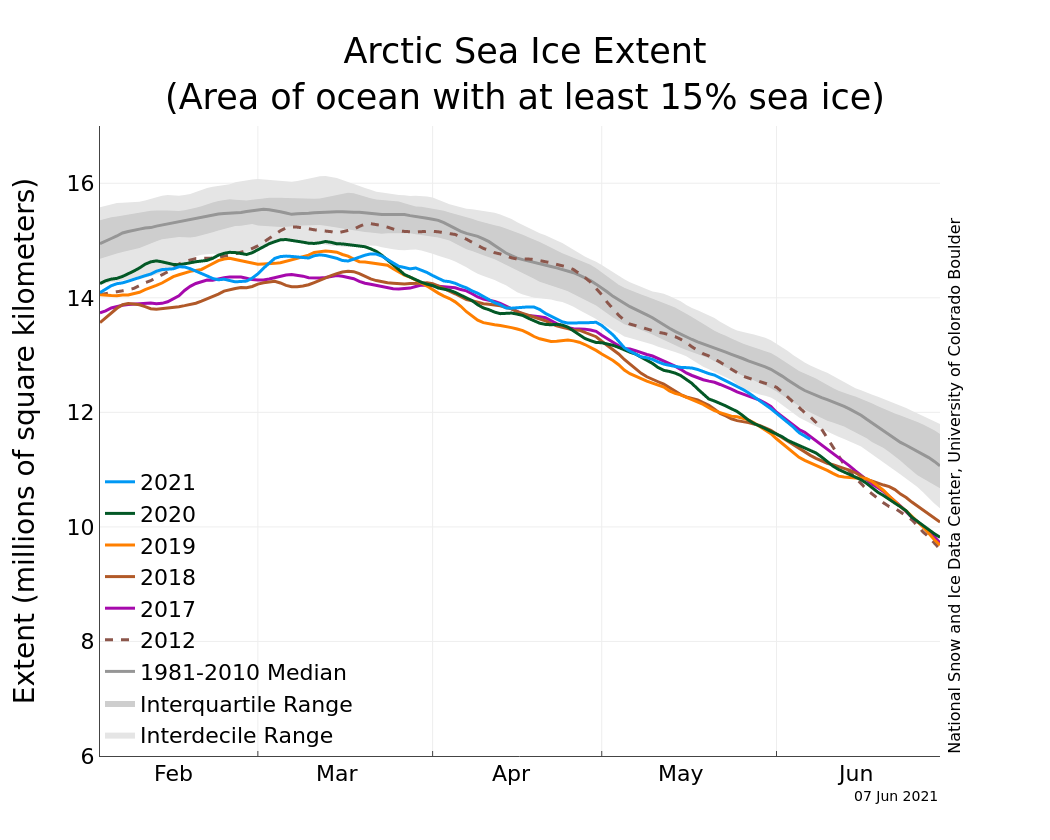
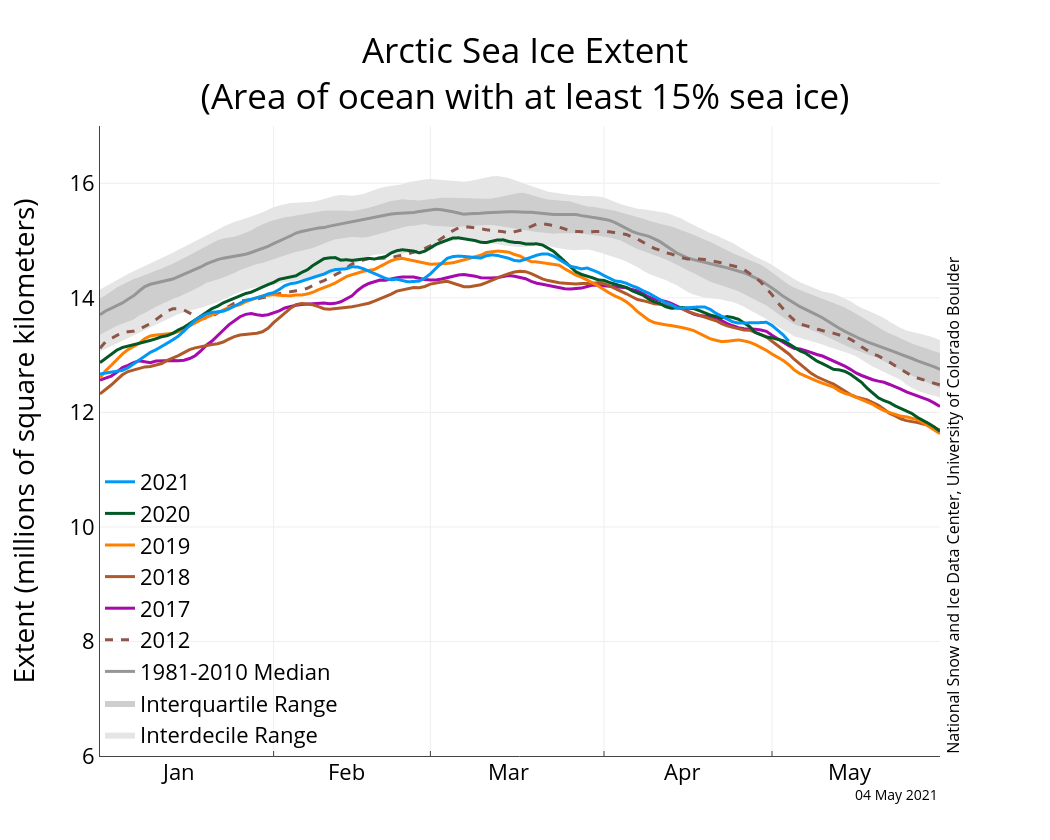
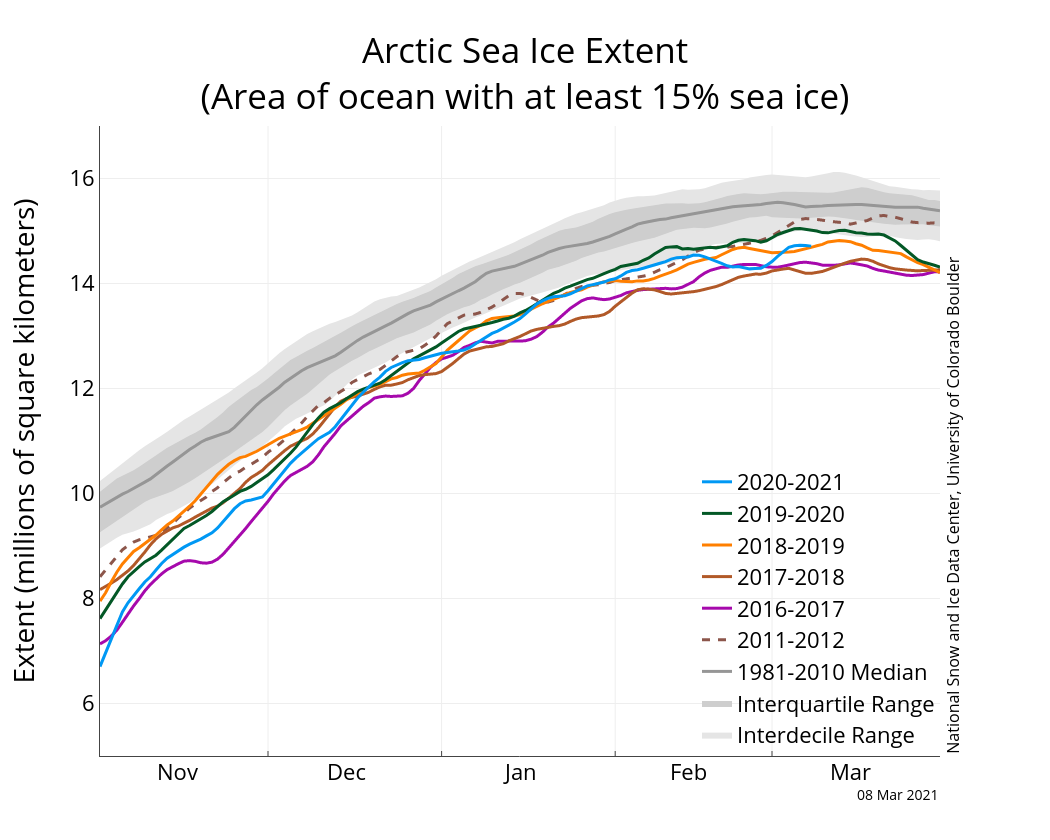
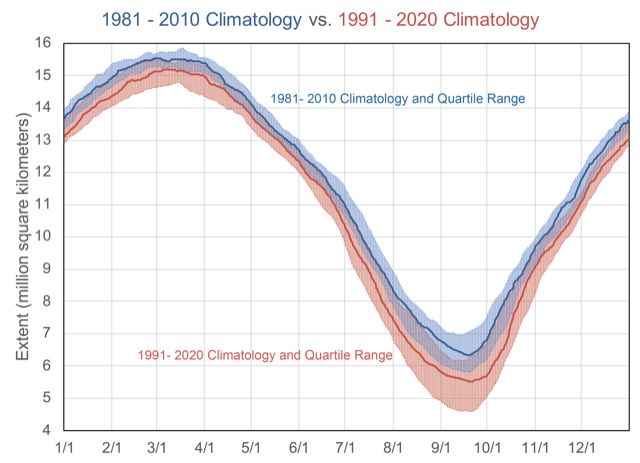
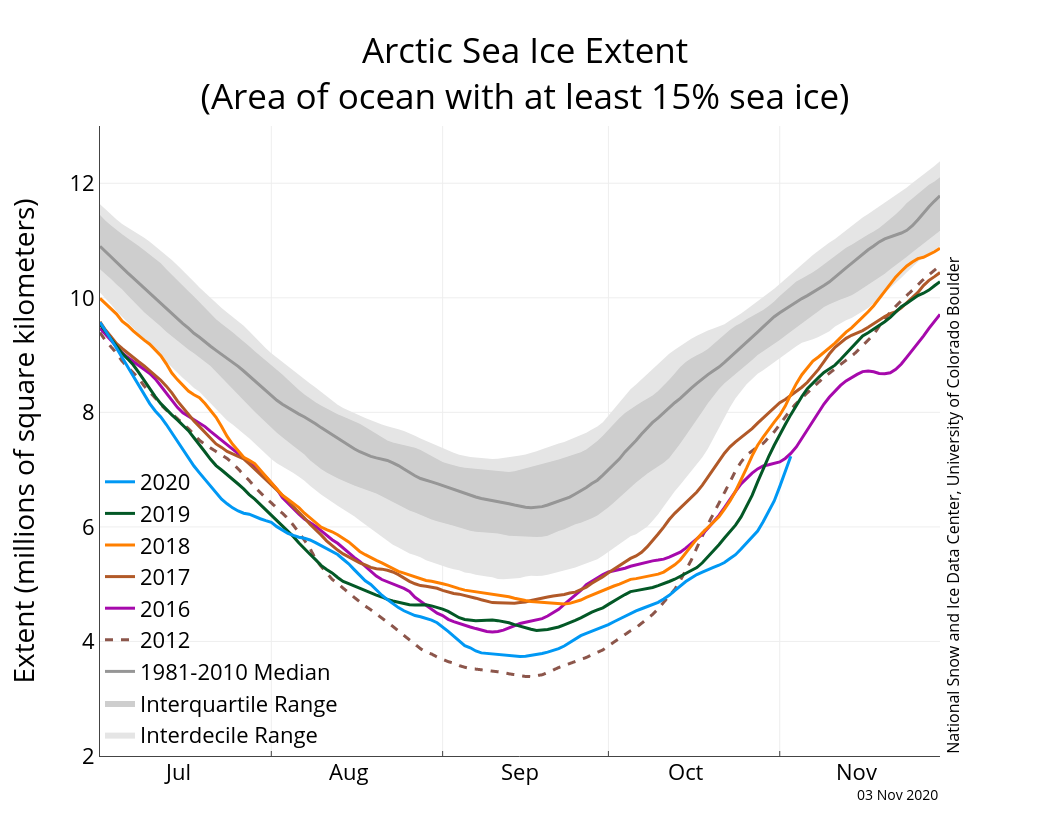
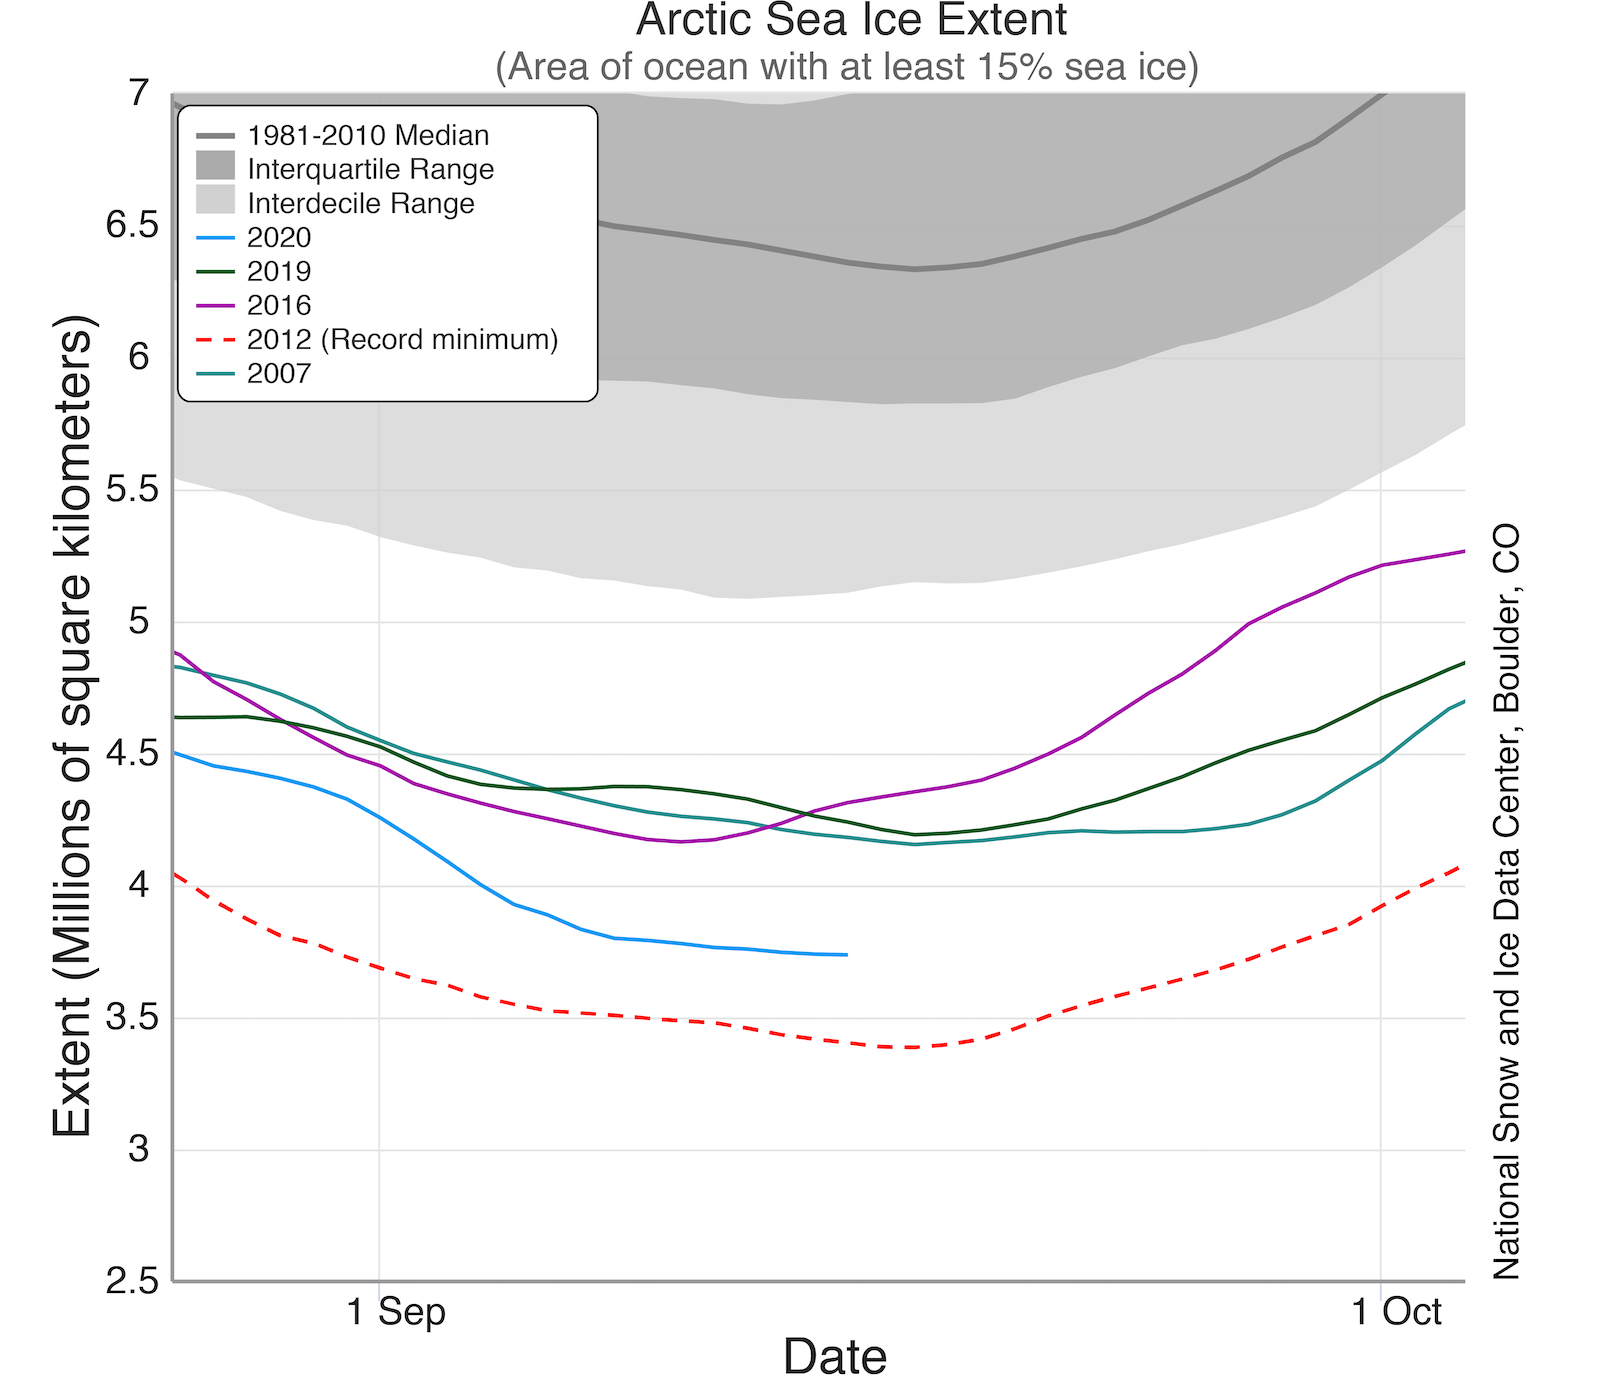
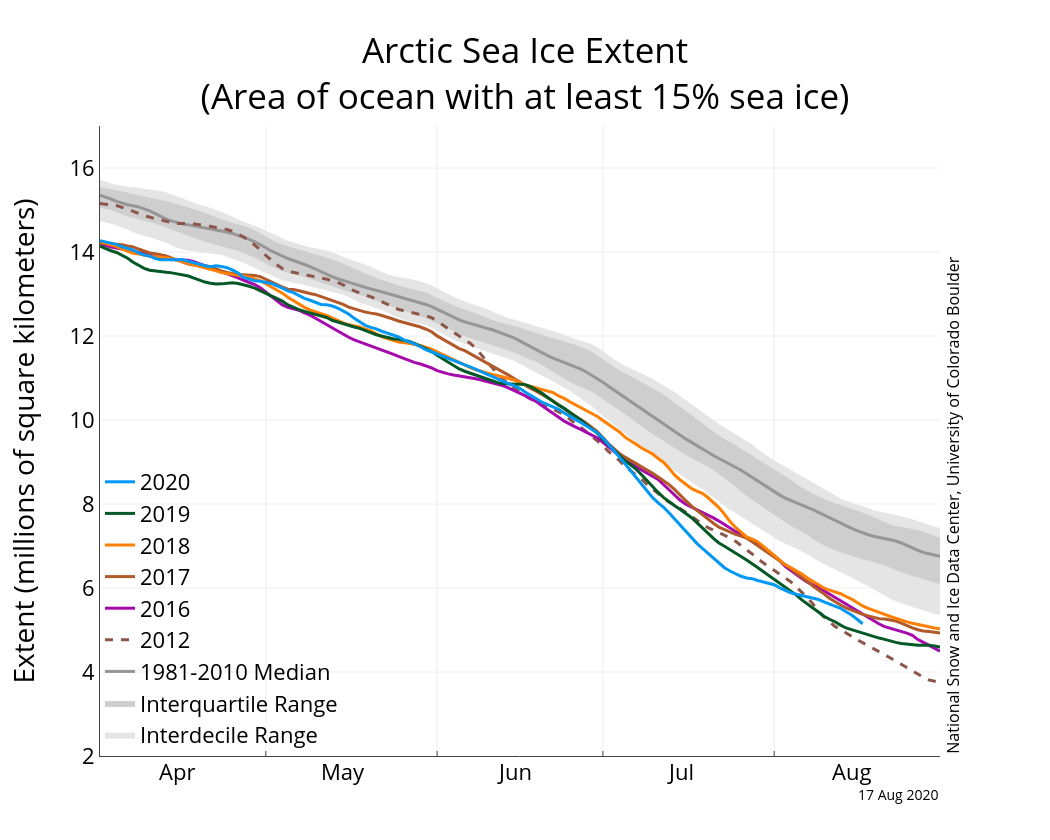
Figure 2a. The graph above shows Arctic sea ice extent as of January 4, 2021, along with daily ice extent data for five previous years and the record low year. 2020 to 2021 is shown in blue, 2019 to 2020 in green, 2018 to 2019 in orange, 2017 to 2018 in brown, 2016 to 2017 in magenta, and 2012 to 2013 in dashed brown, the record low year. The 1981 to 2010 median is in dark gray. The gray areas around the median line show the interquartile and interdecile ranges of the data. Sea Ice Index data.
Credit: National Snow and Ice Data Center
High-resolution image
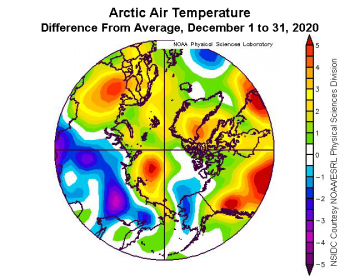
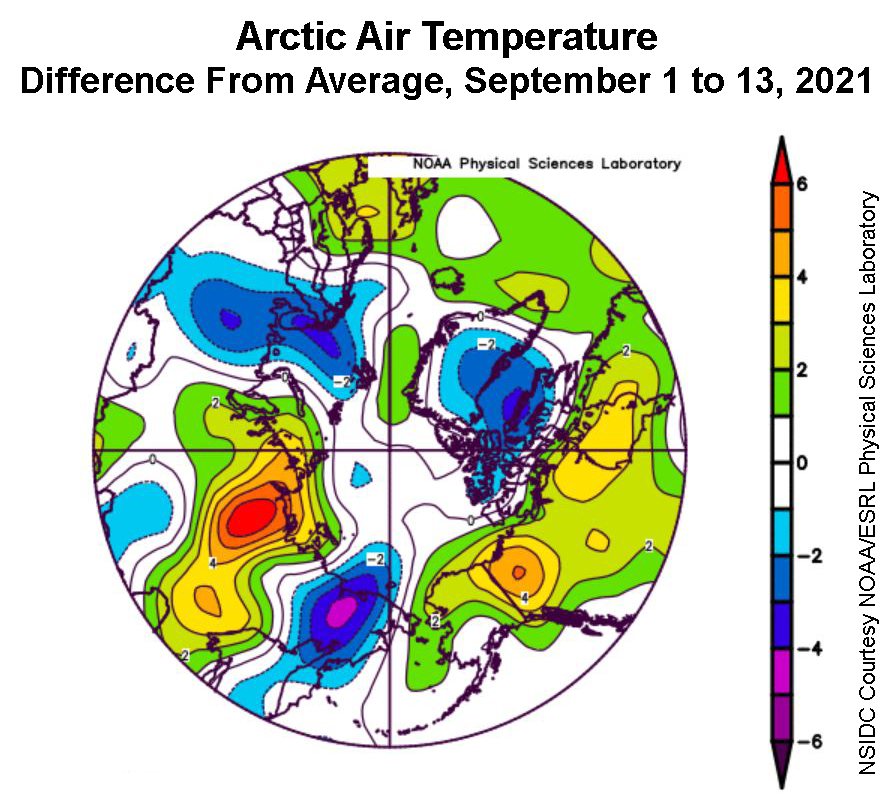
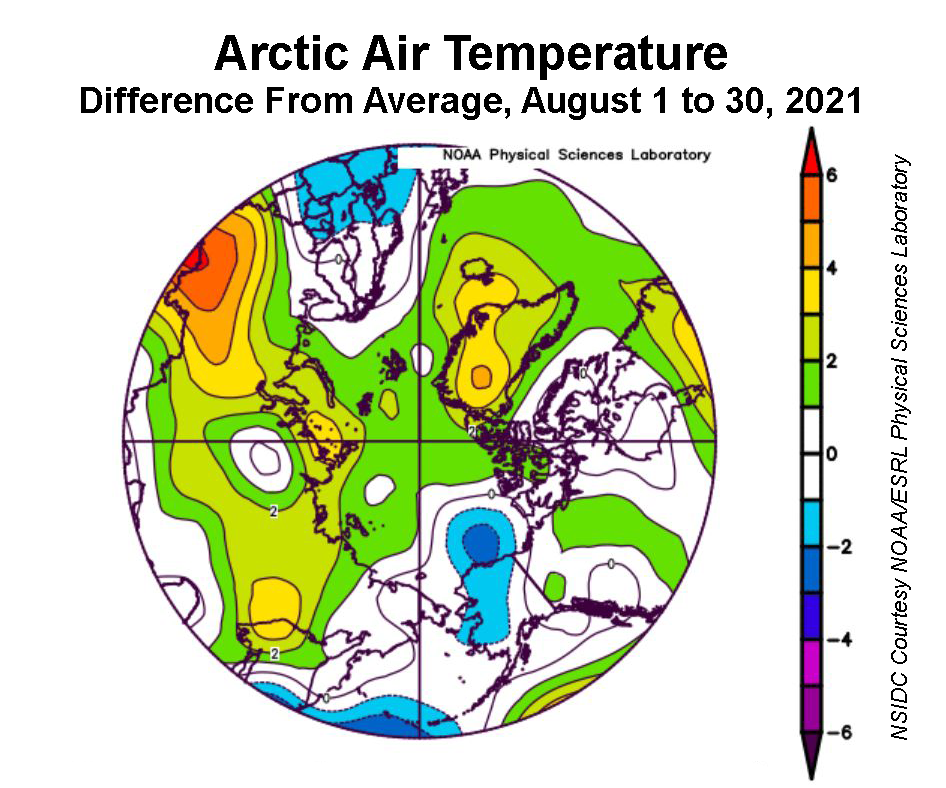
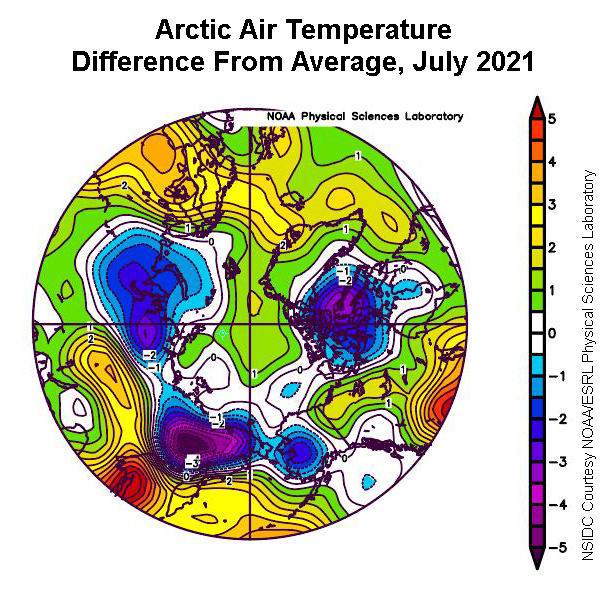
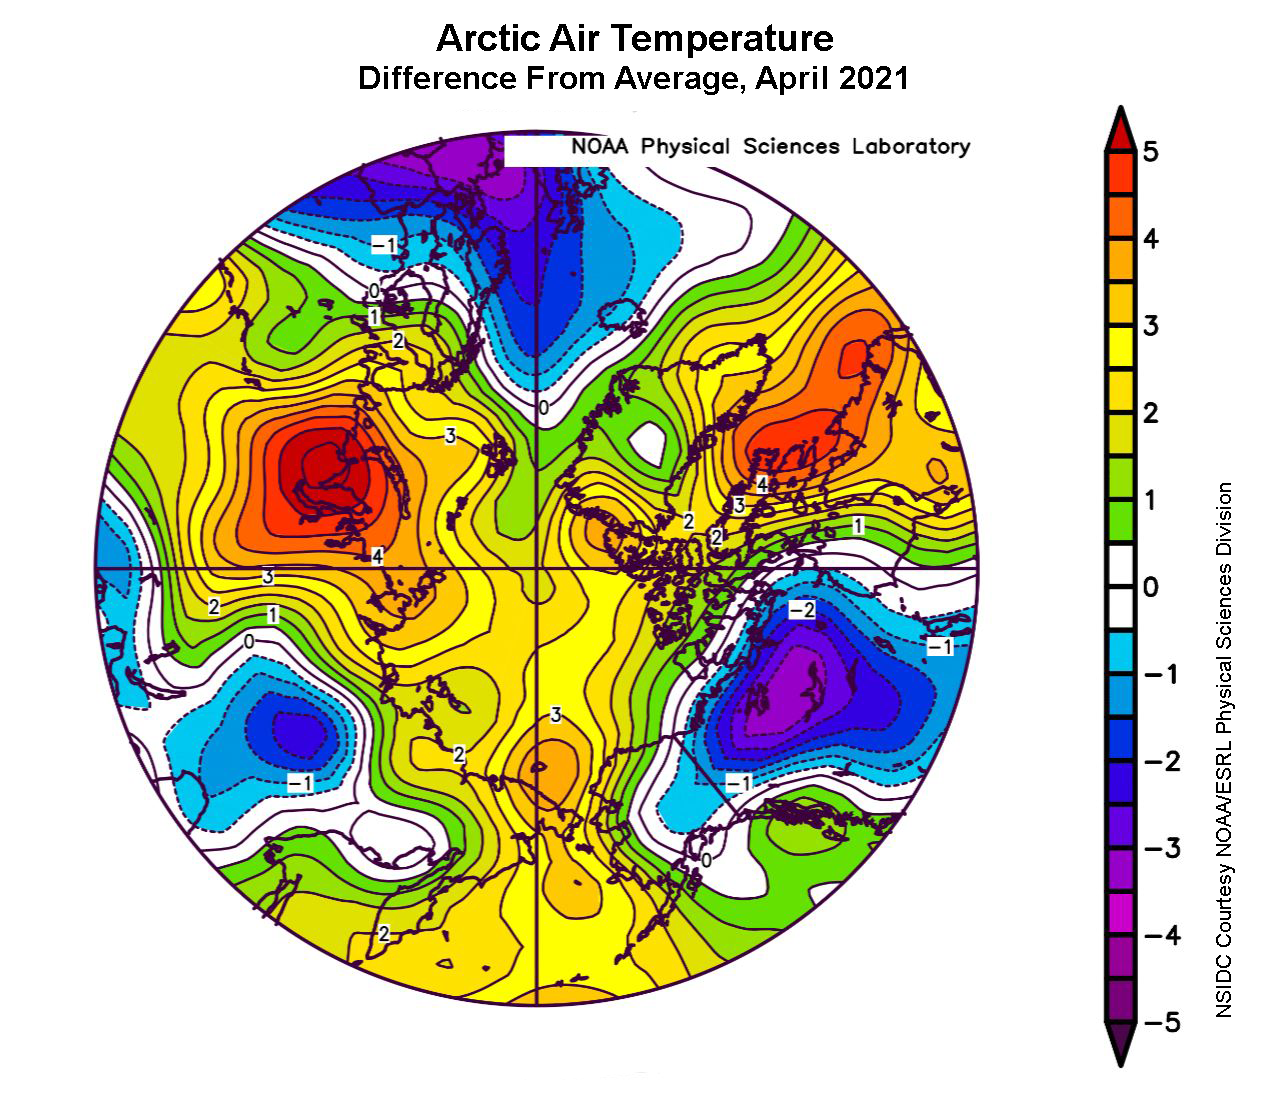
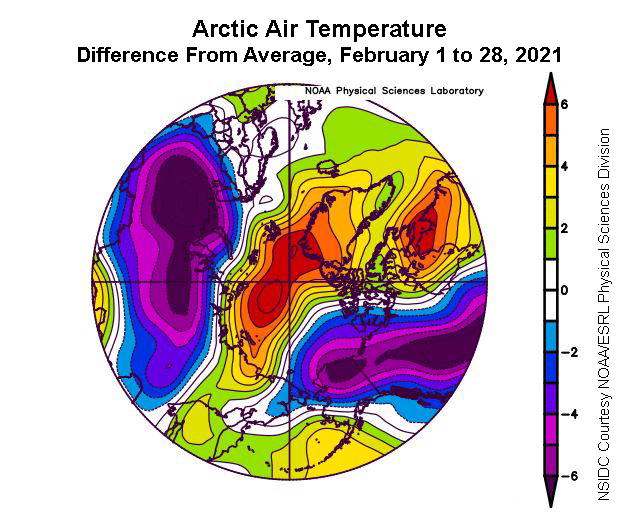
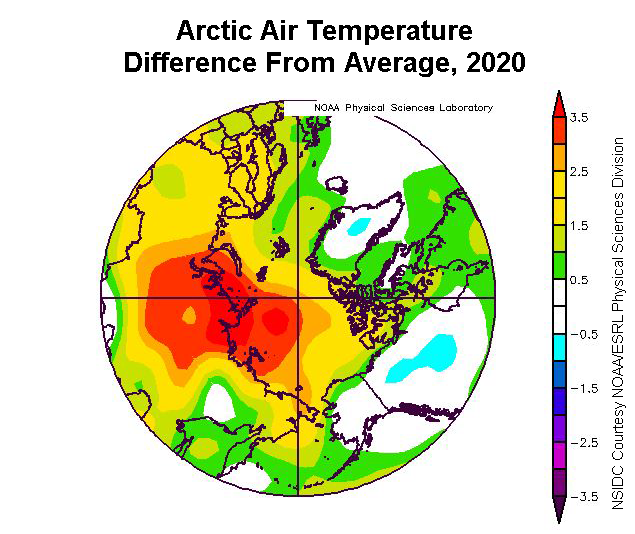
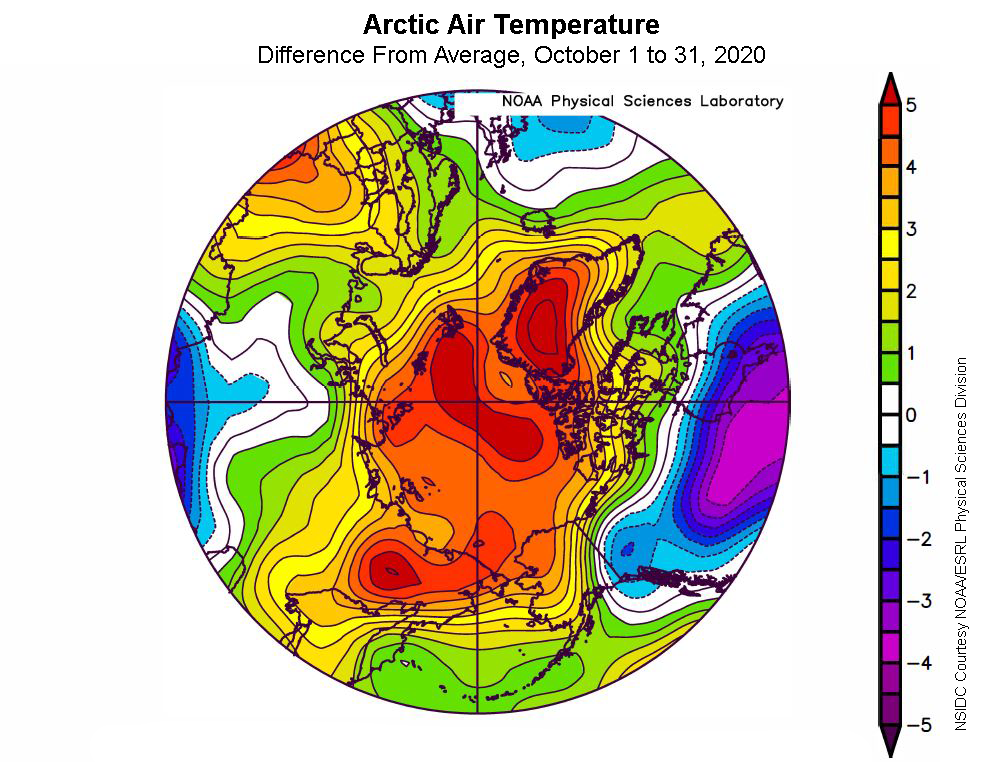
Figure 2b. This plot shows the departure from average air temperature in the Arctic at the 925 hPa level, in degrees Celsius, for December 2020. Yellows and reds indicate higher than average temperatures; blues and purples indicate lower than average temperatures.
Credit: NSIDC courtesy NOAA Earth System Research Laboratory Physical Sciences Division
High-resolution image
Sea ice extent increased by 2.71 million square kilometers (1.05 million square miles) during the month of December. This was greater than the 1981 to 2010 average gain in December of 1.99 square kilometers (780,000 square miles). However, after a rapid early and mid-month gain, the rate of extent increase slowed considerably (Figure 2a).
December air temperatures at the 925 mb level (about 2,500 feet about sea level) continued to be relatively high for this time of year over much of the Arctic Ocean, particularly north of the Laptev and East Siberian Seas, which saw temperatures of 5 degrees Celsius (9 degrees Fahrenheit) above the 1981 to 2010 average (Figure 2b). Average and below average temperatures prevailed in the Beaufort and eastern Chukchi Seas.
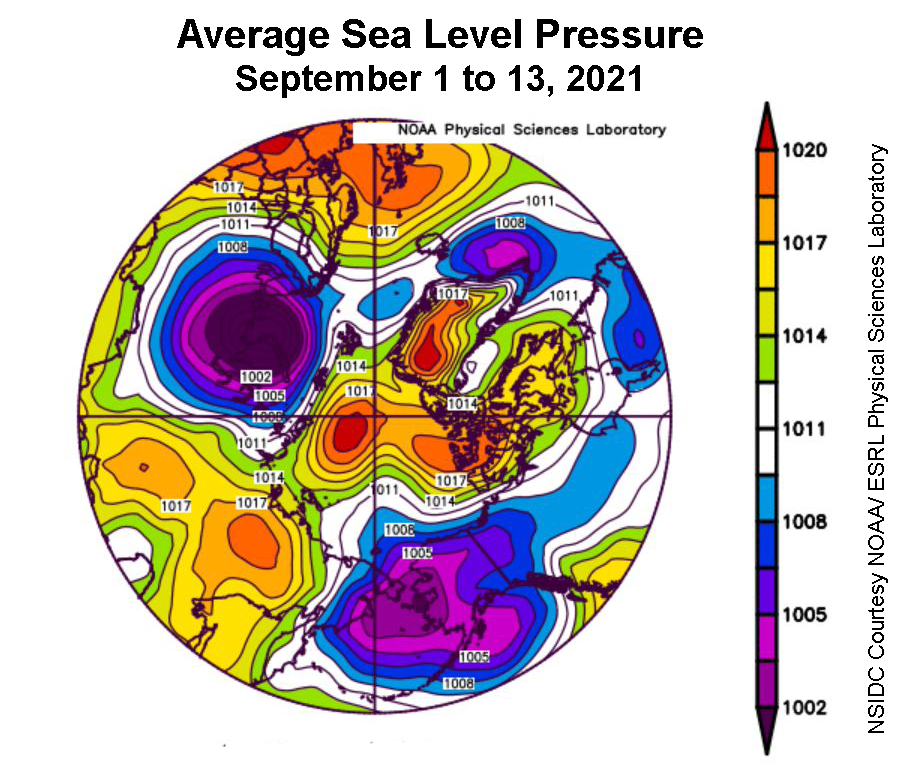
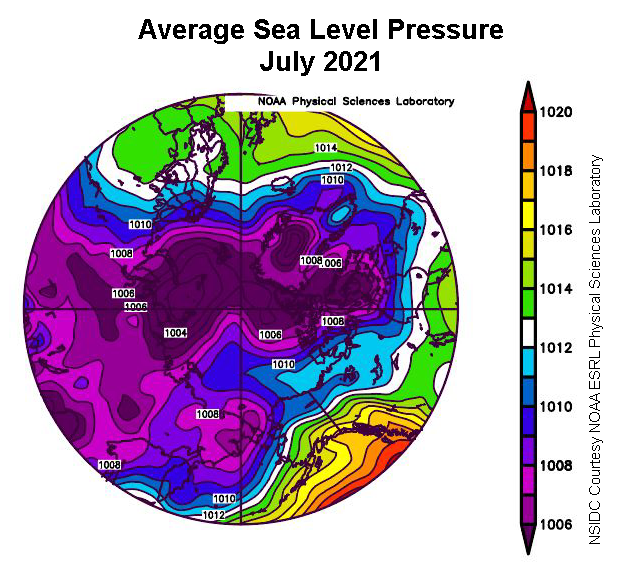
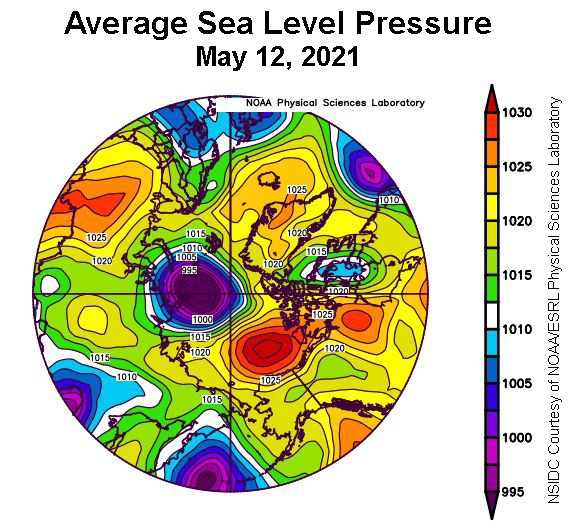
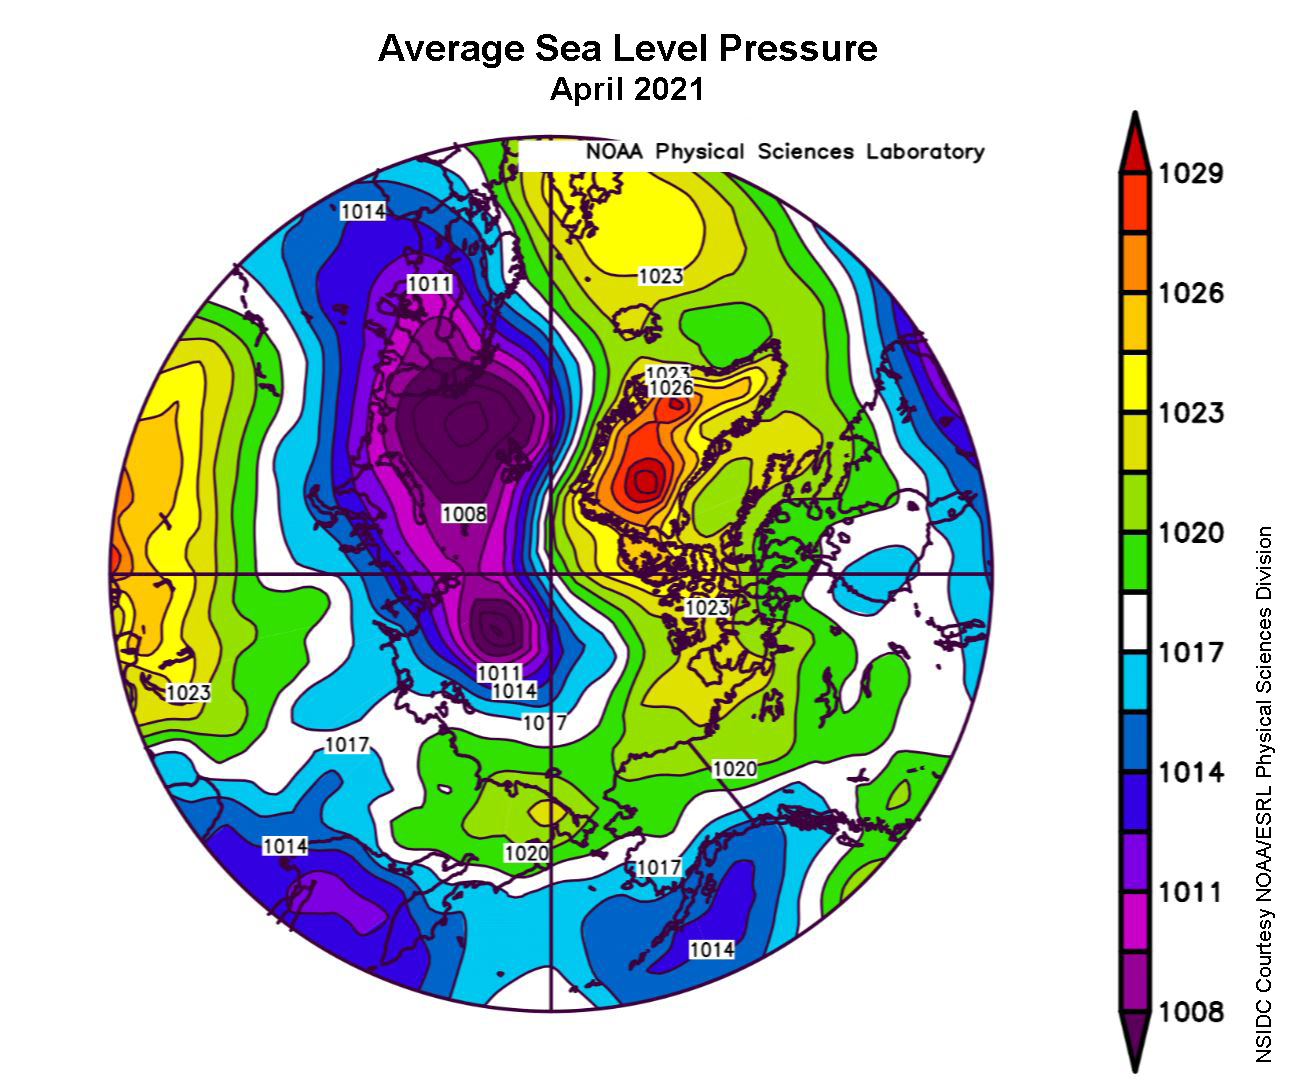
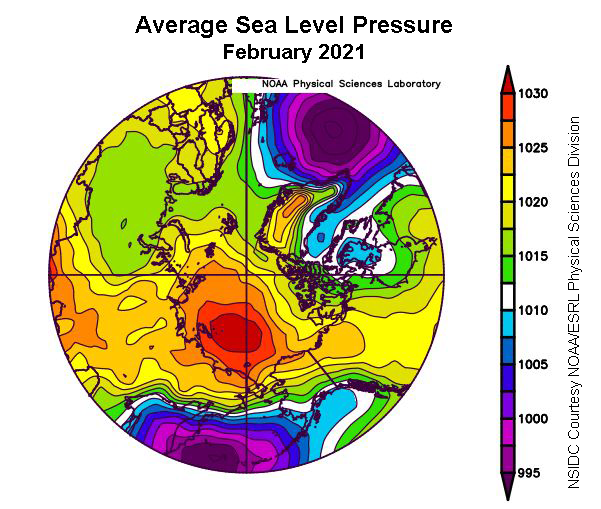
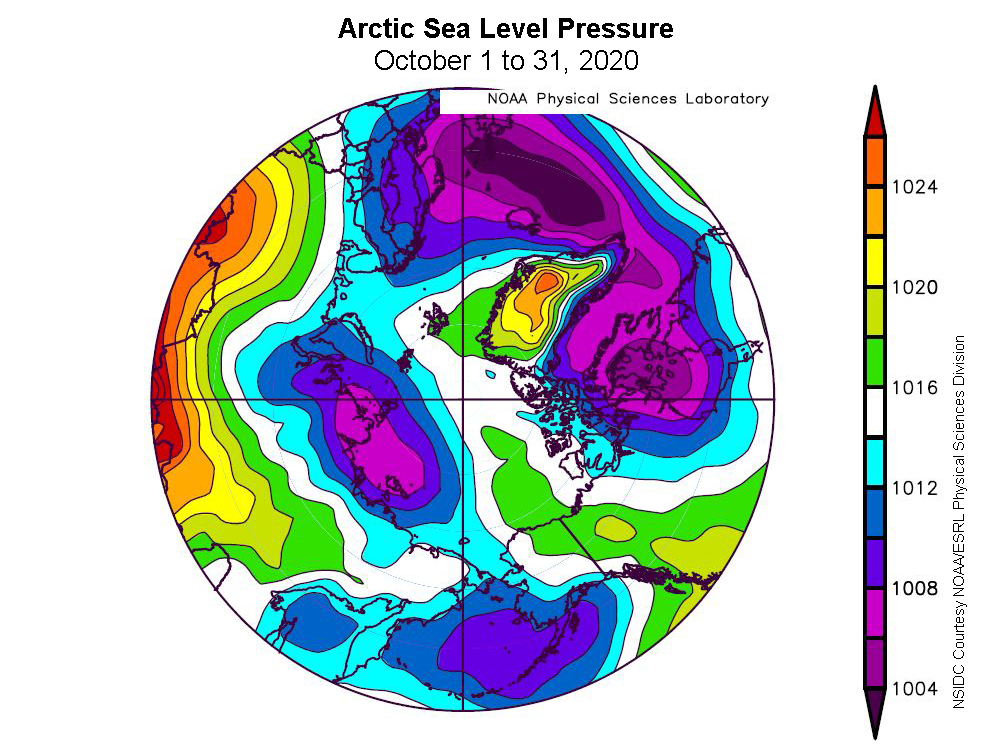
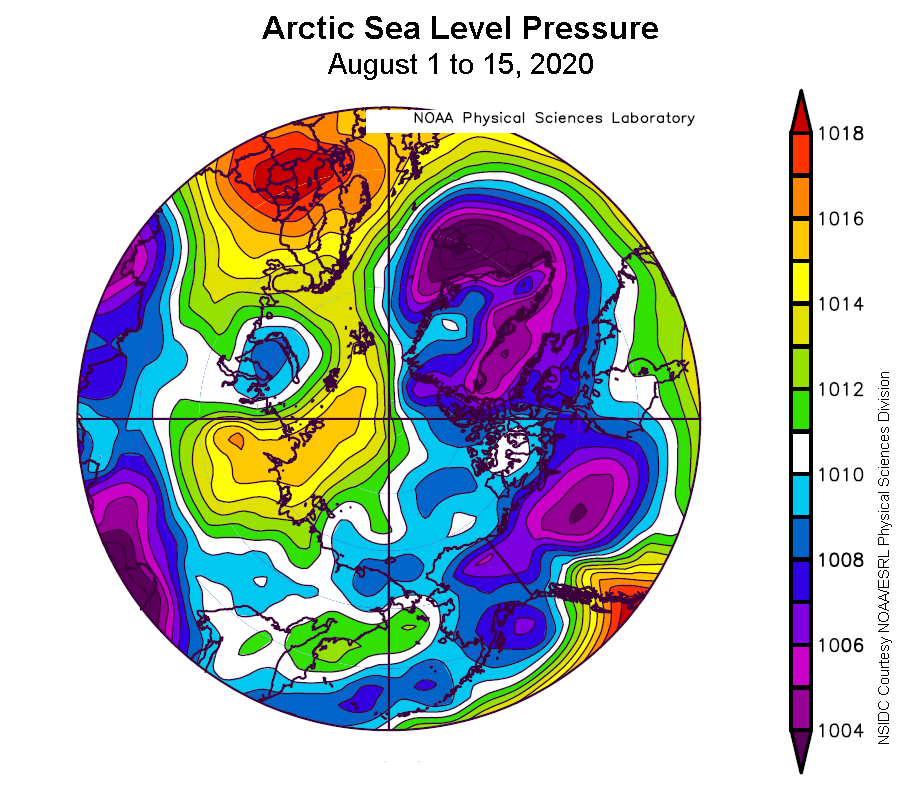
The Arctic Oscillation (AO), after being in a strong positive mode for most of November, flipped to a negative mode for most of December. As a result of the AO flipping to negative, a sea level pressure pattern formed in December with high pressure over the Arctic Ocean, a fairly strong Beaufort Sea High pressure pattern, and low pressure over the Atlantic and Pacific subarctic. Earlier research (Rigor et al., 2002) argued that during winter, a negative mode tends to retain older and thicker ice within the Arctic Ocean, which potentially portends a more moderate ice loss the following summer. Conversely, when the AO is positive, the wind pattern helps to transport ice from the Siberian coast, across the pole and out of the Arctic Ocean via the Fram Strait, leaving more thin ice along the Siberian shore that melts out readily in summer. The strong positive AO during the winter of 2019 to 2020 may have played a role in this past summer’s low sea ice extent. However, this relationship between the AO and summer ice extent has not been strong in recent years.
December 2020 compared to previous Decembers
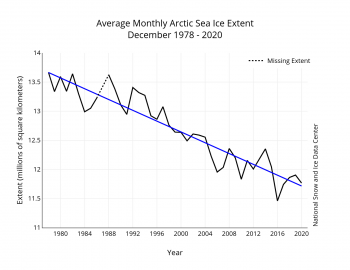
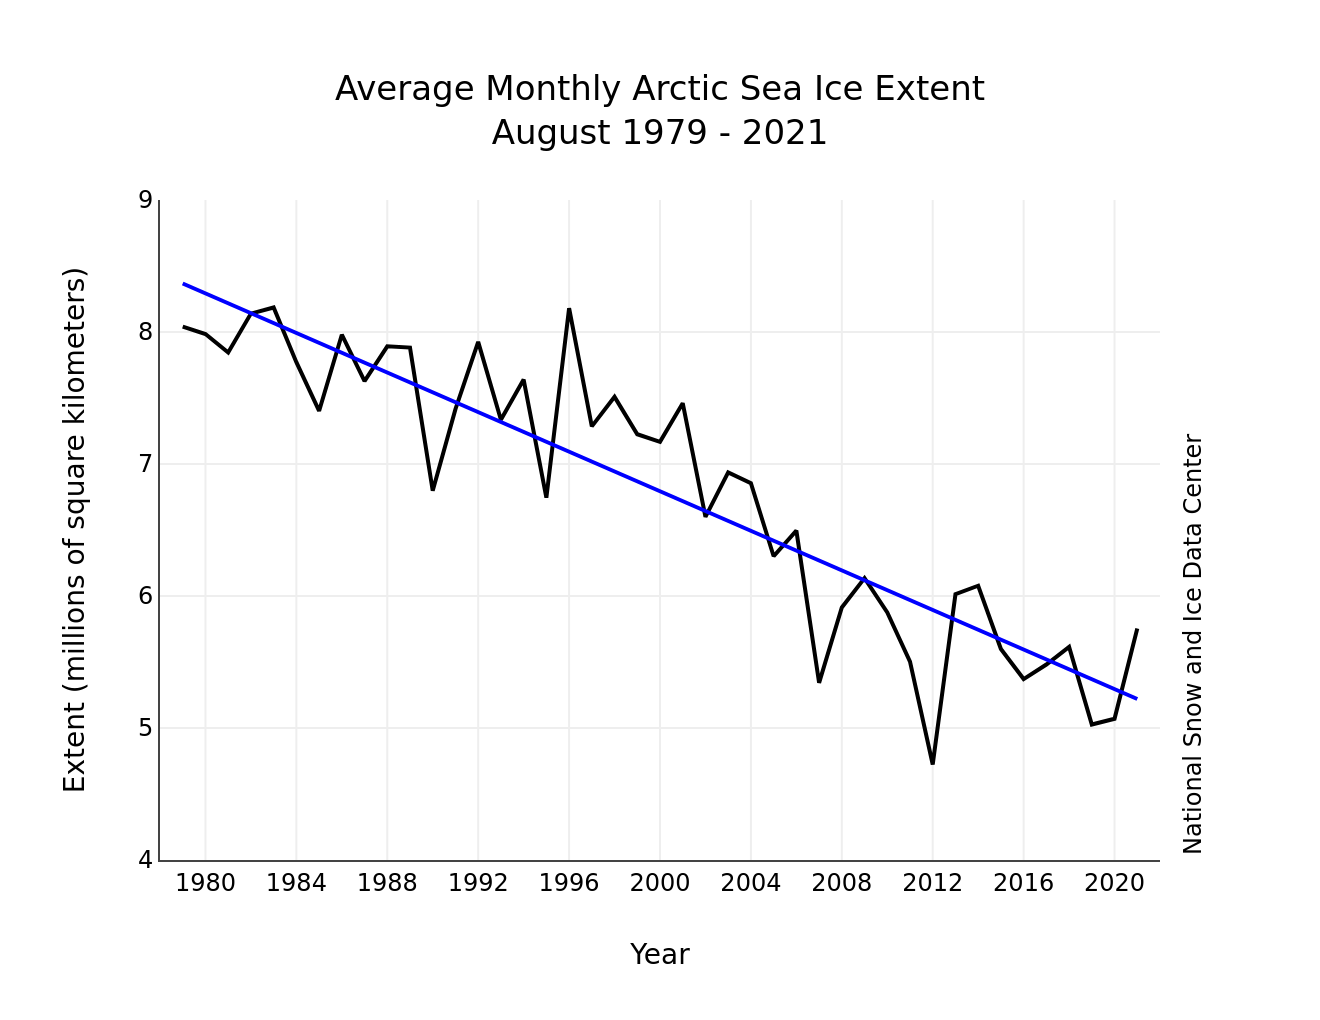
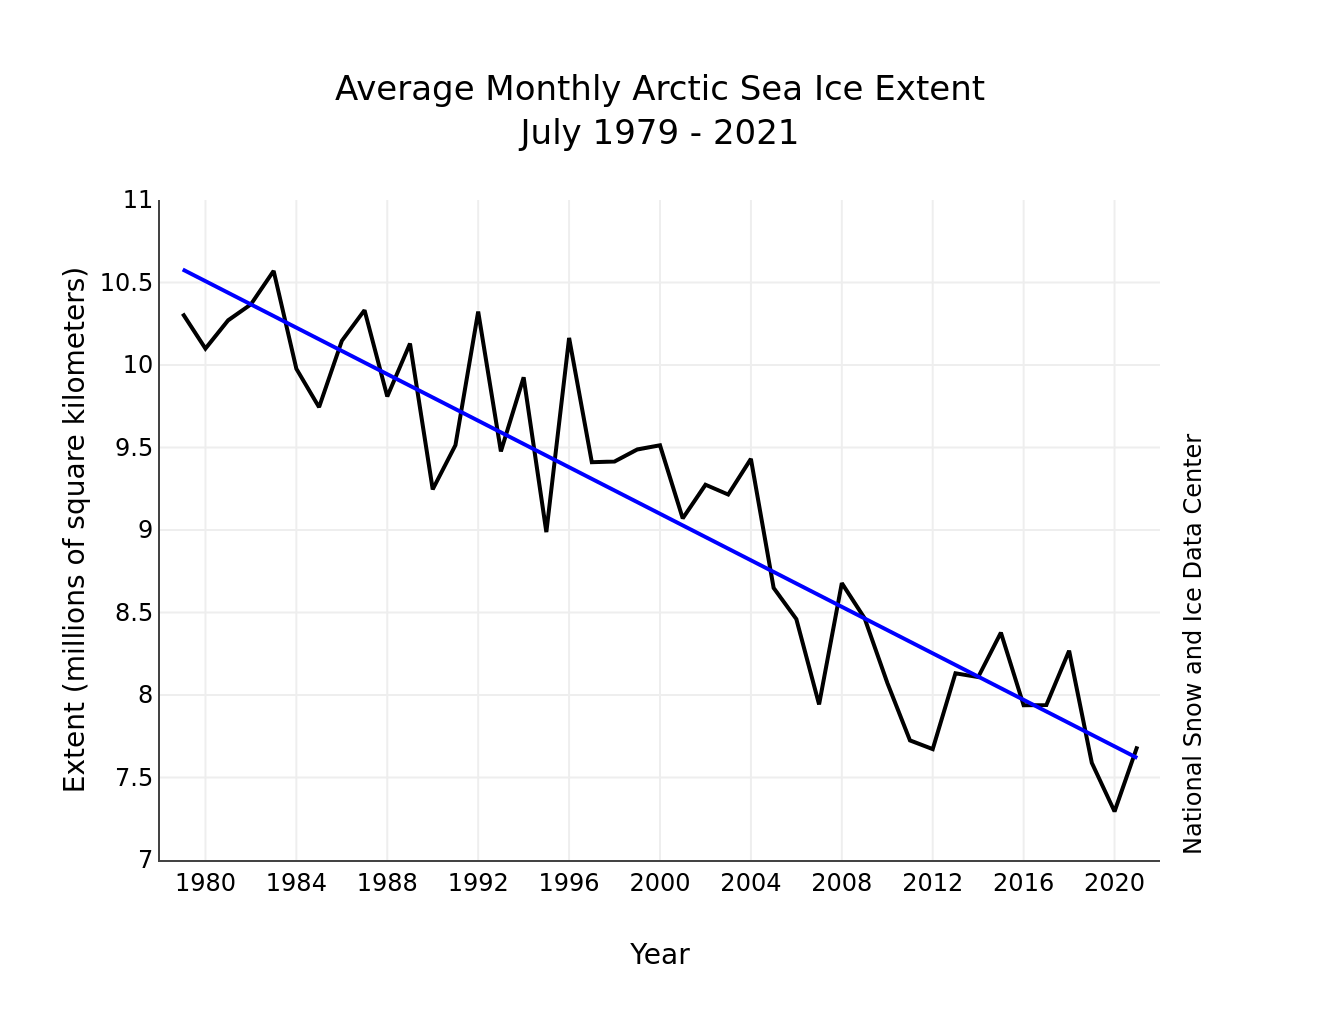
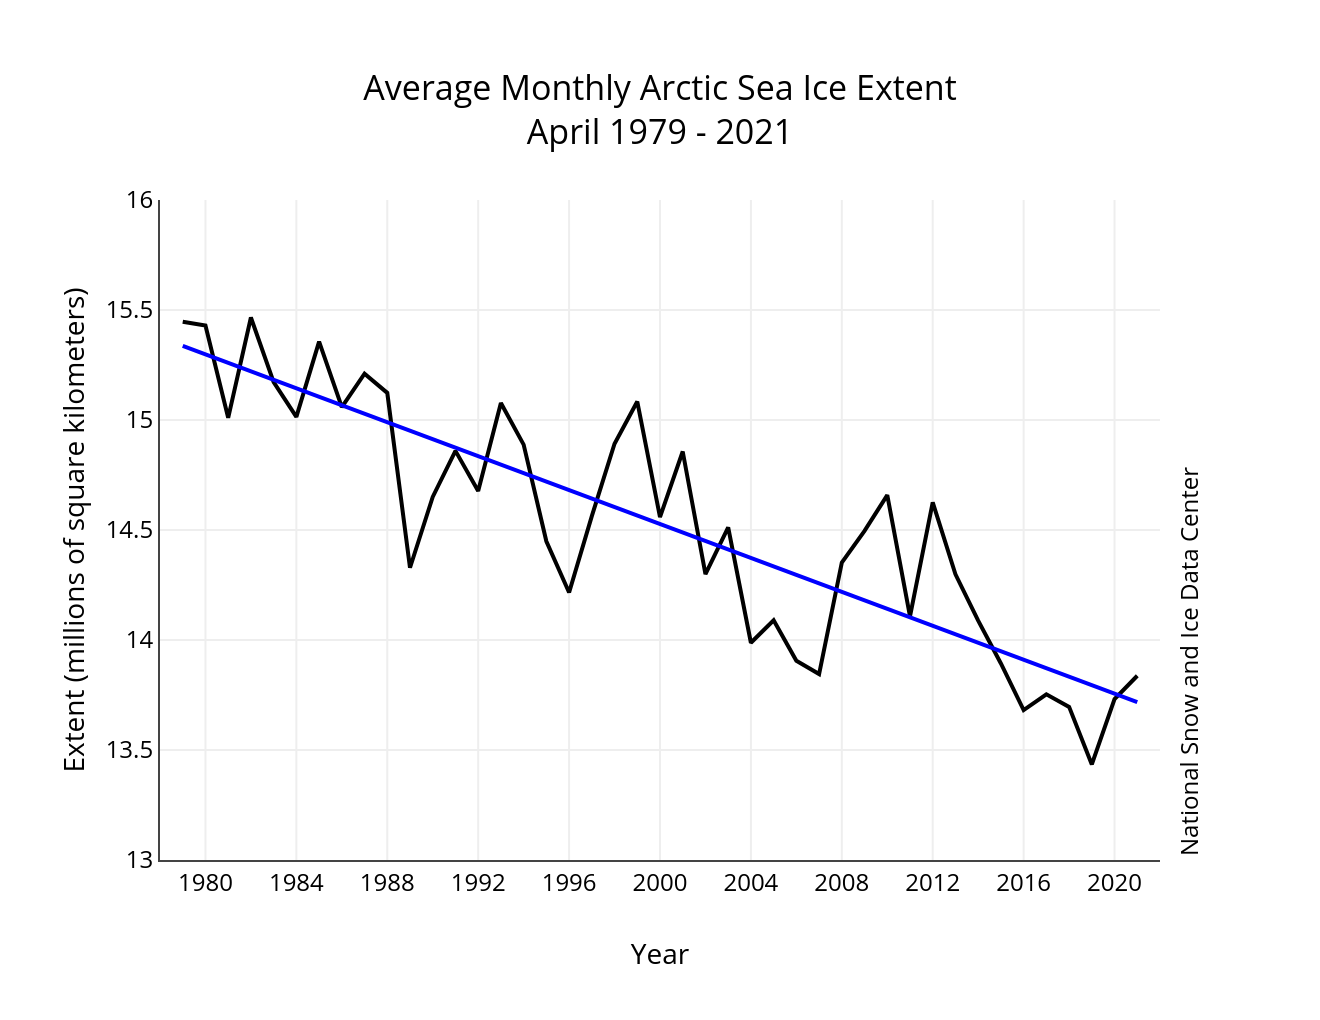
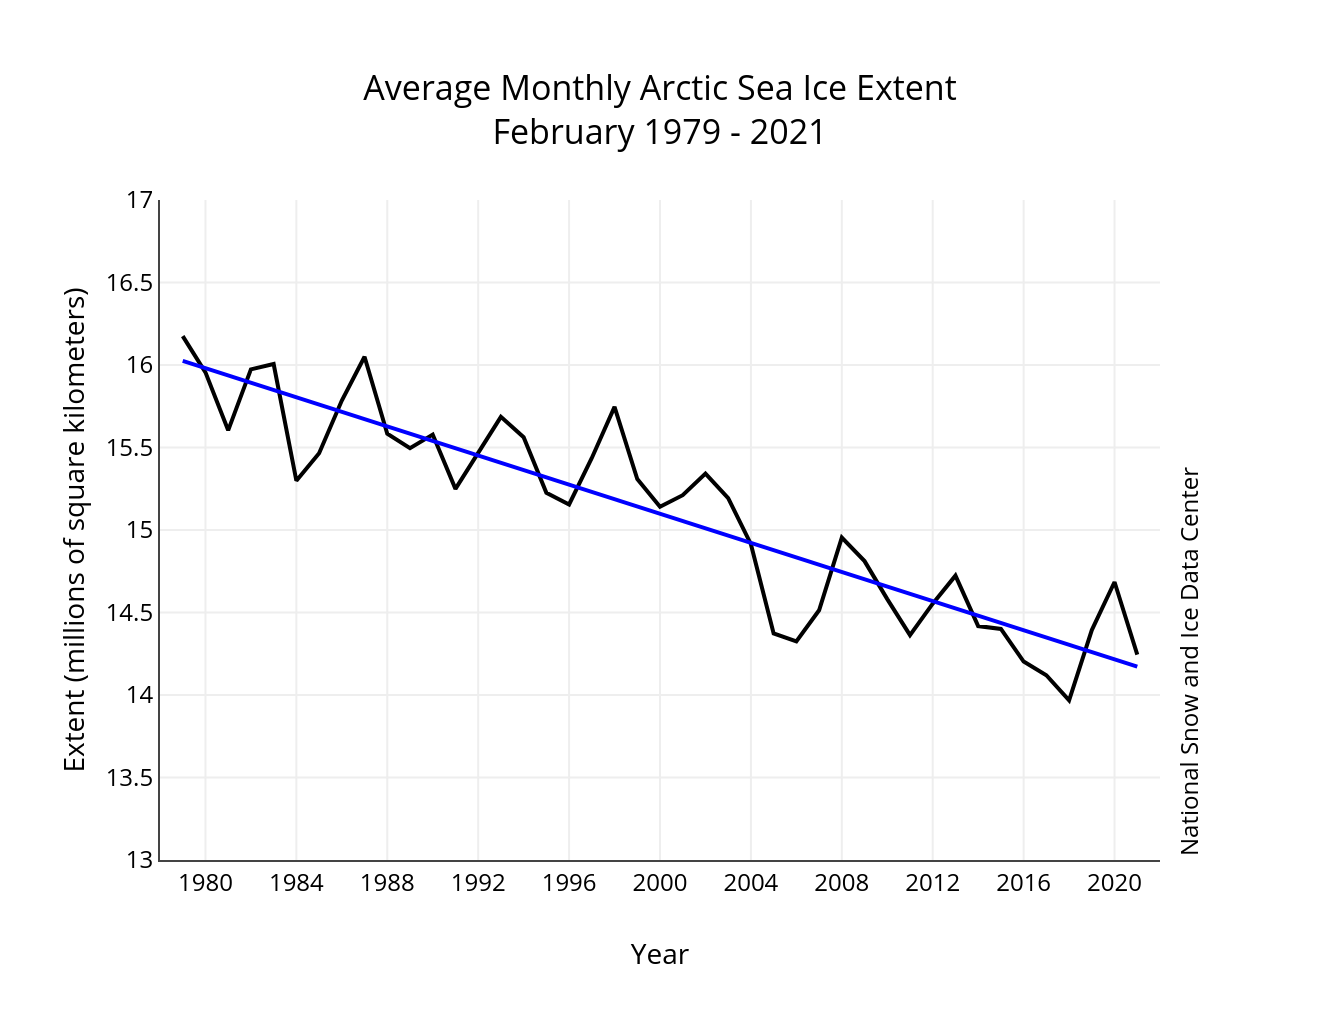
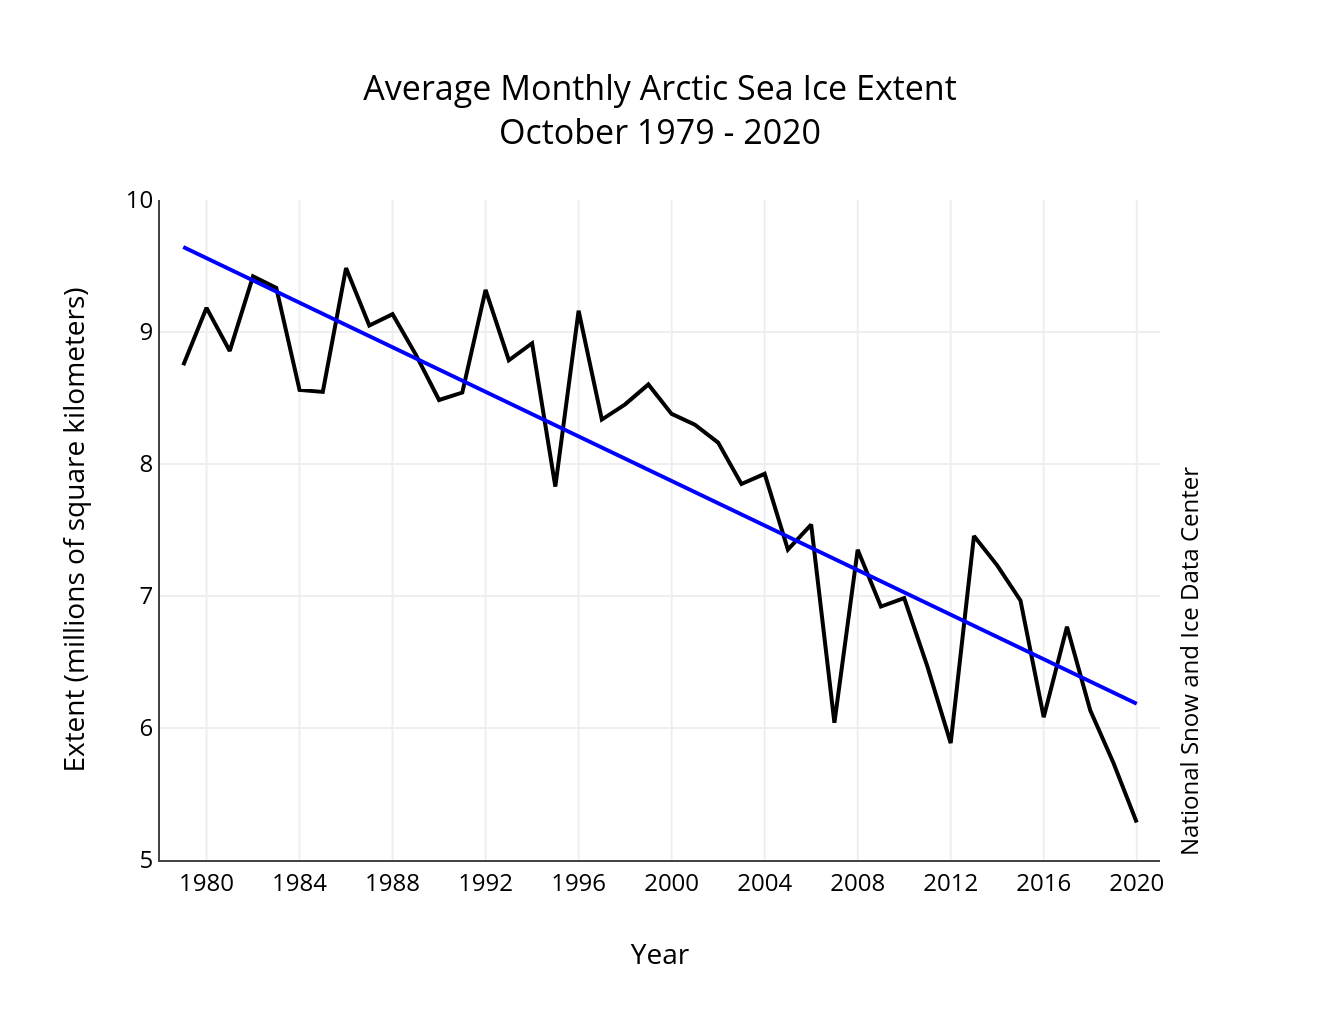
Figure 3. Monthly December ice extent for 1979 to 2020 shows a decline of 3.6 percent per decade.
Credit: National Snow and Ice Data Center
High-resolution image
Through 2020, the linear rate of decline for December sea ice extent is 3.6 percent per decade, which corresponds to 46,500 square kilometers (18,000 square miles) per year, about twice the size of New Hampshire. The cumulative December ice loss over the 43-year satellite record is 1.97 million square kilometers (761,000 square miles), based on the difference in linear trend values in 2020 and 1978. This is equivalent to about three times the size of Texas.
Check in down south
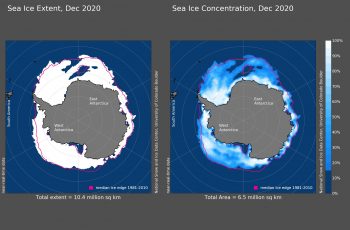
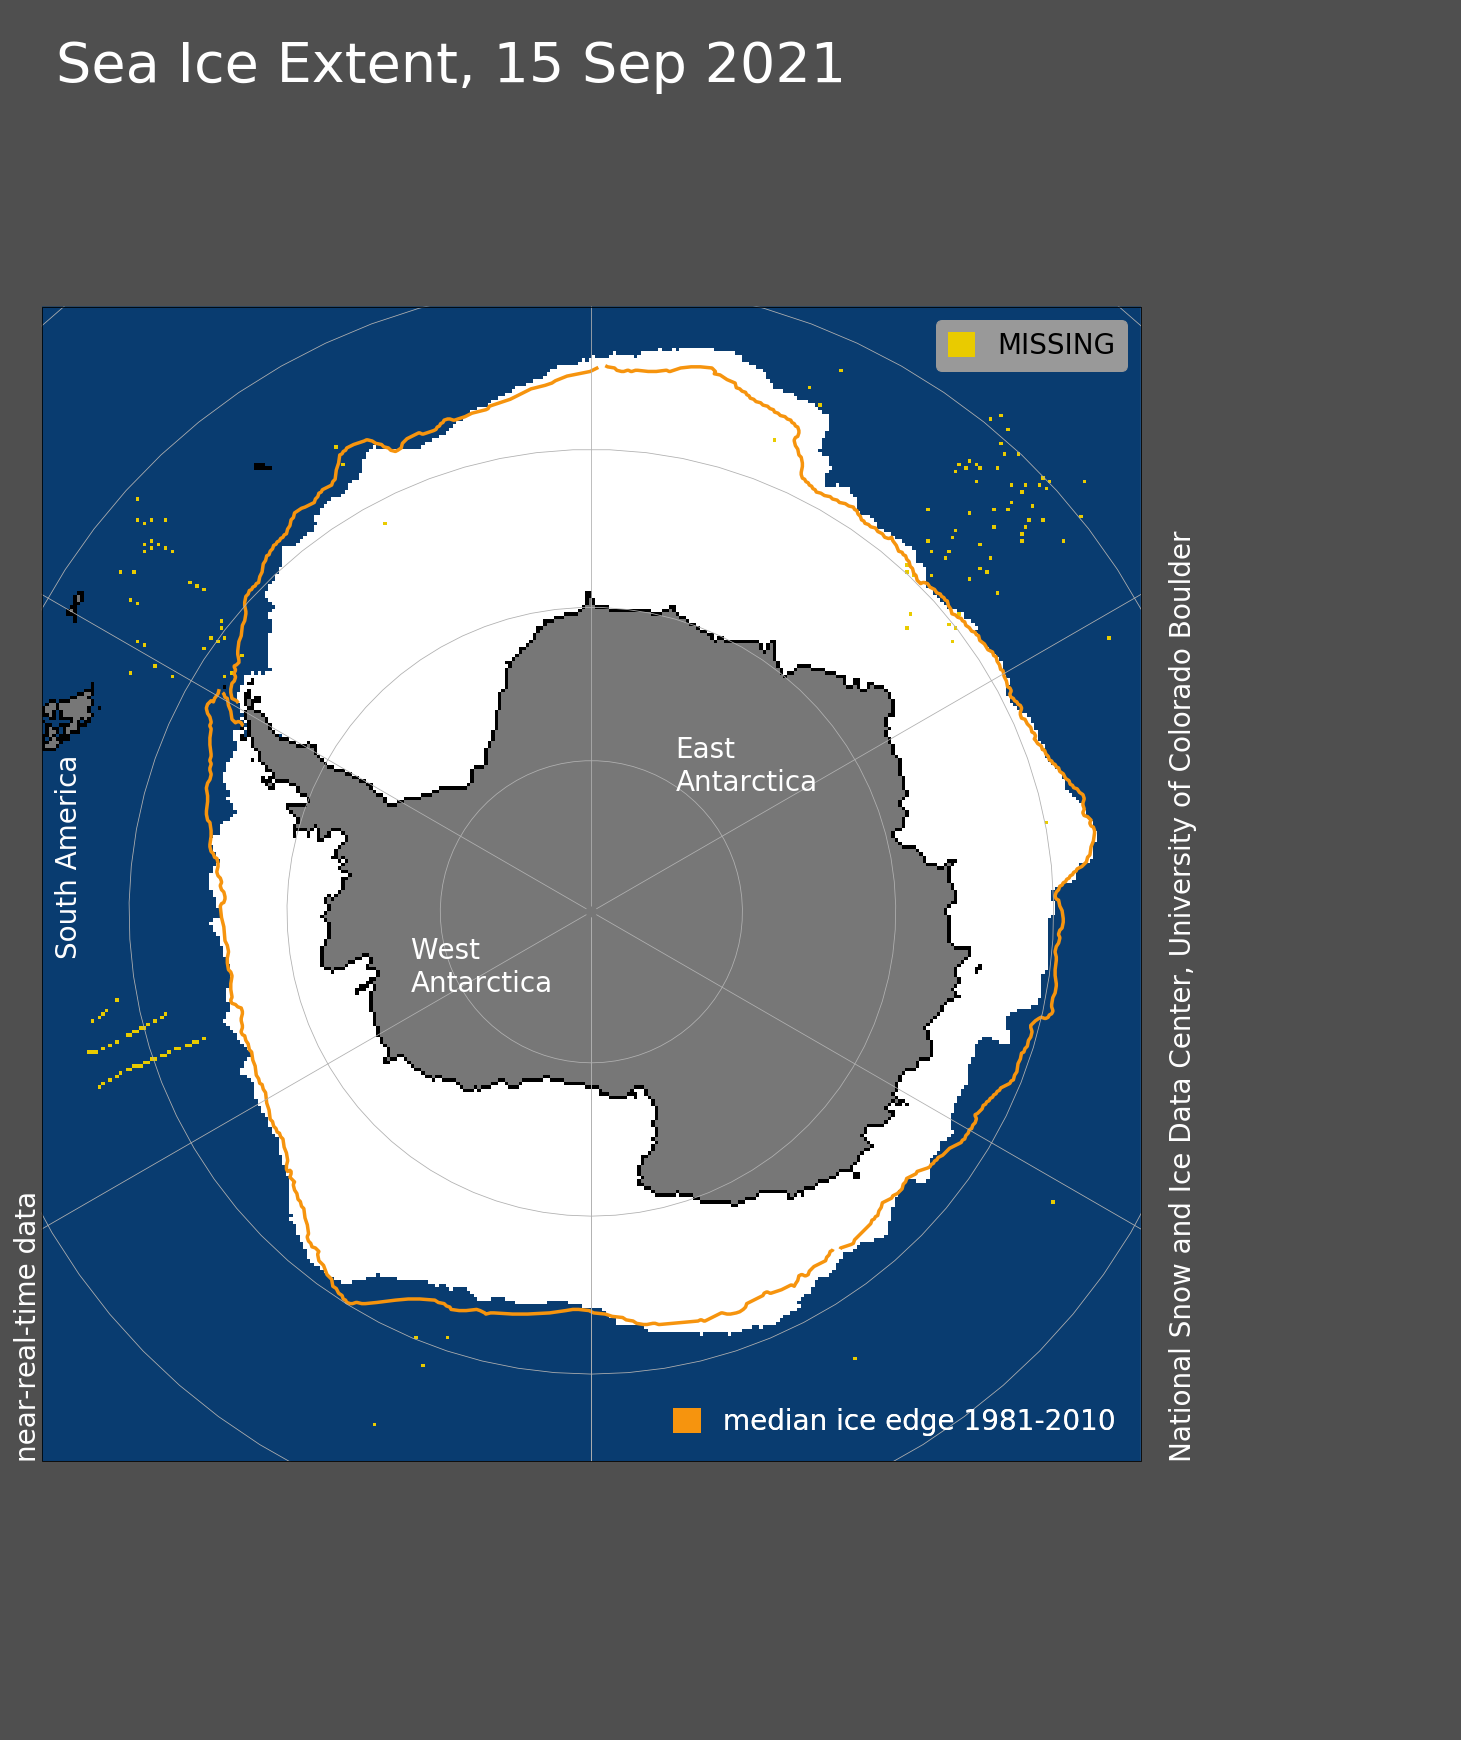
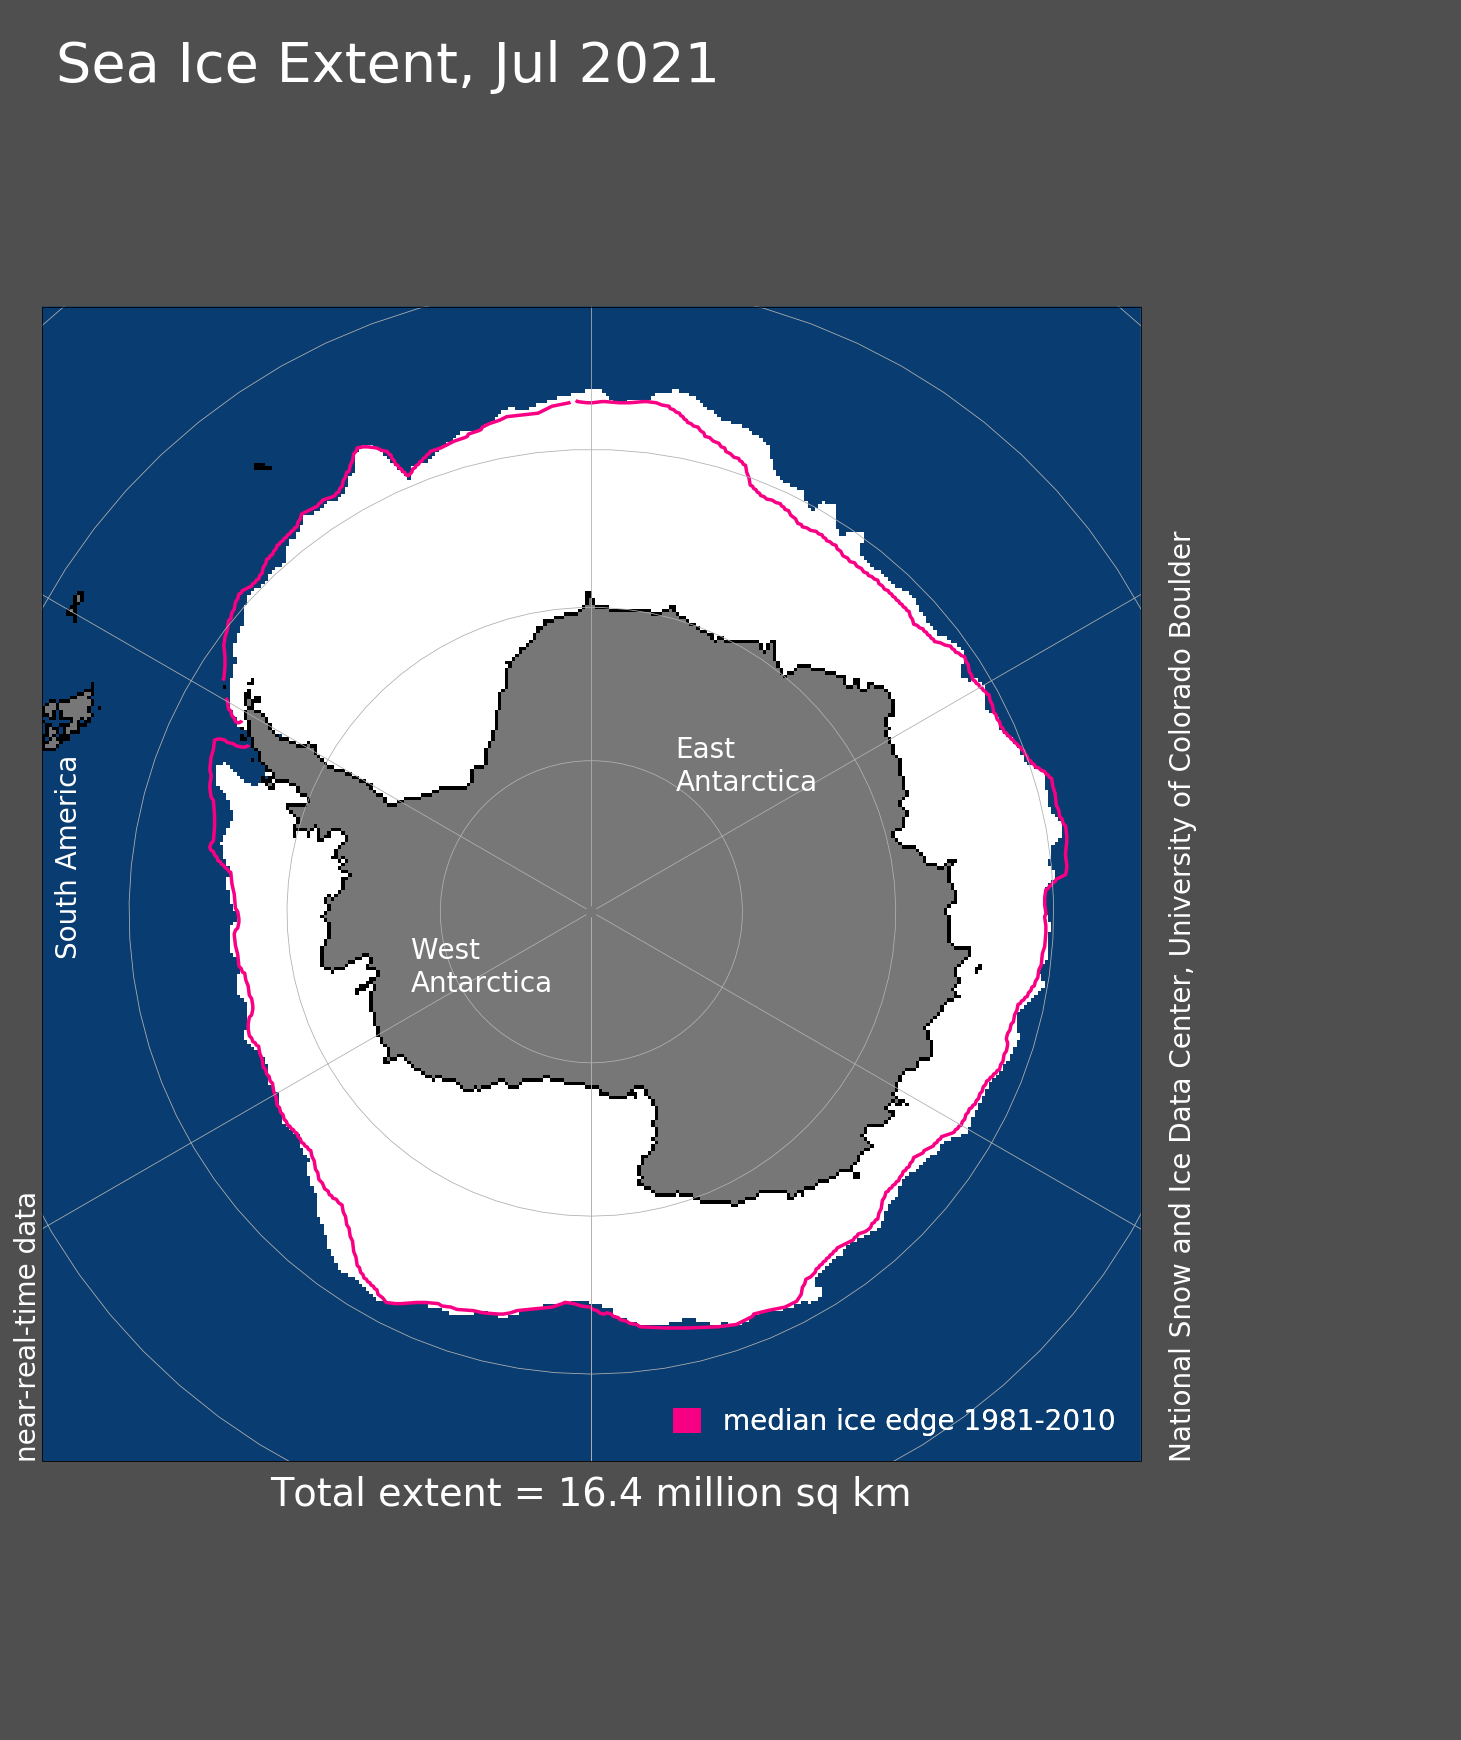
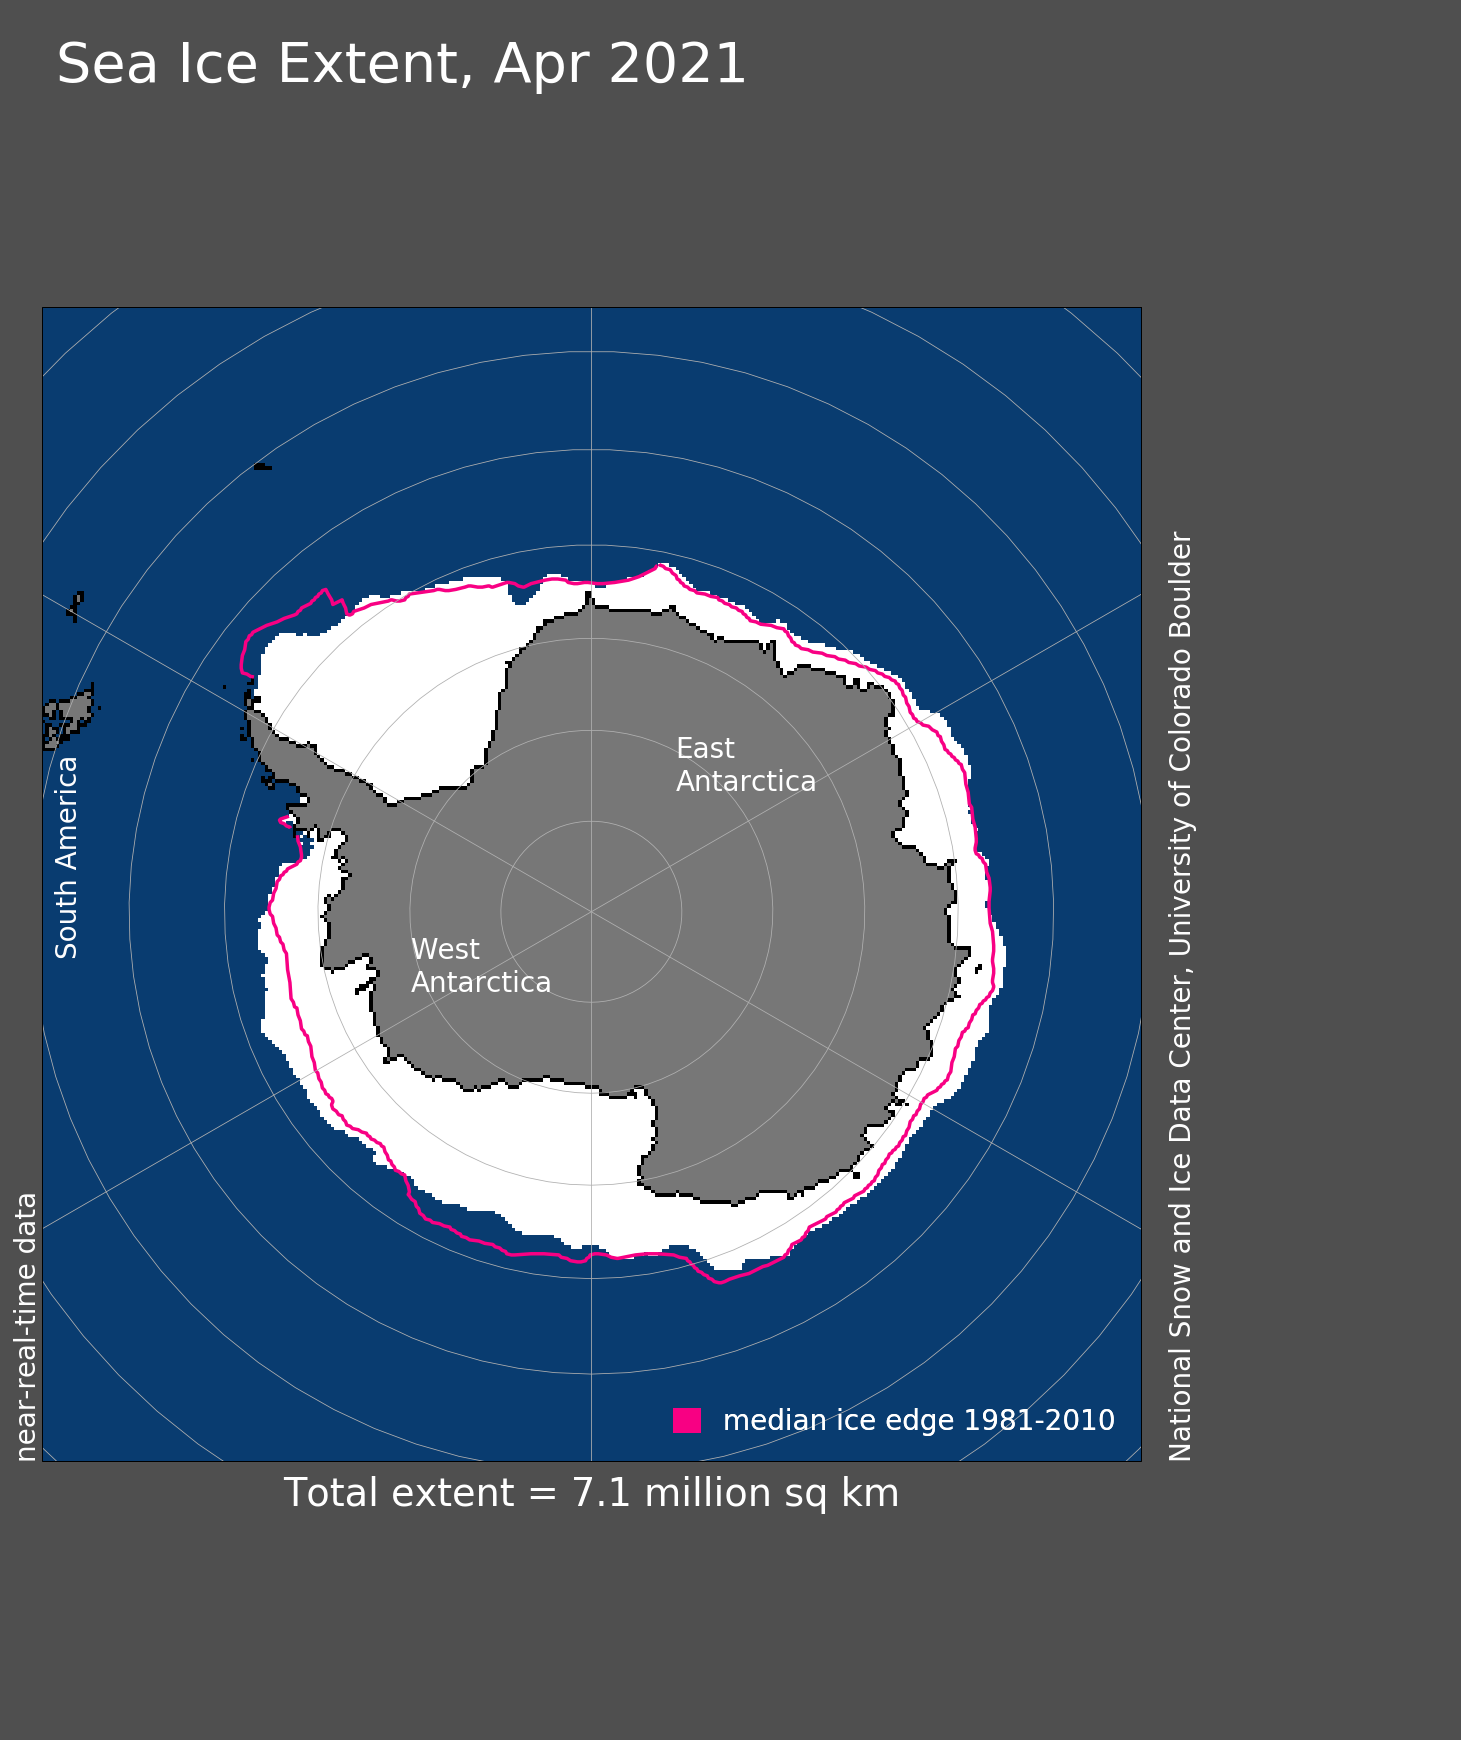
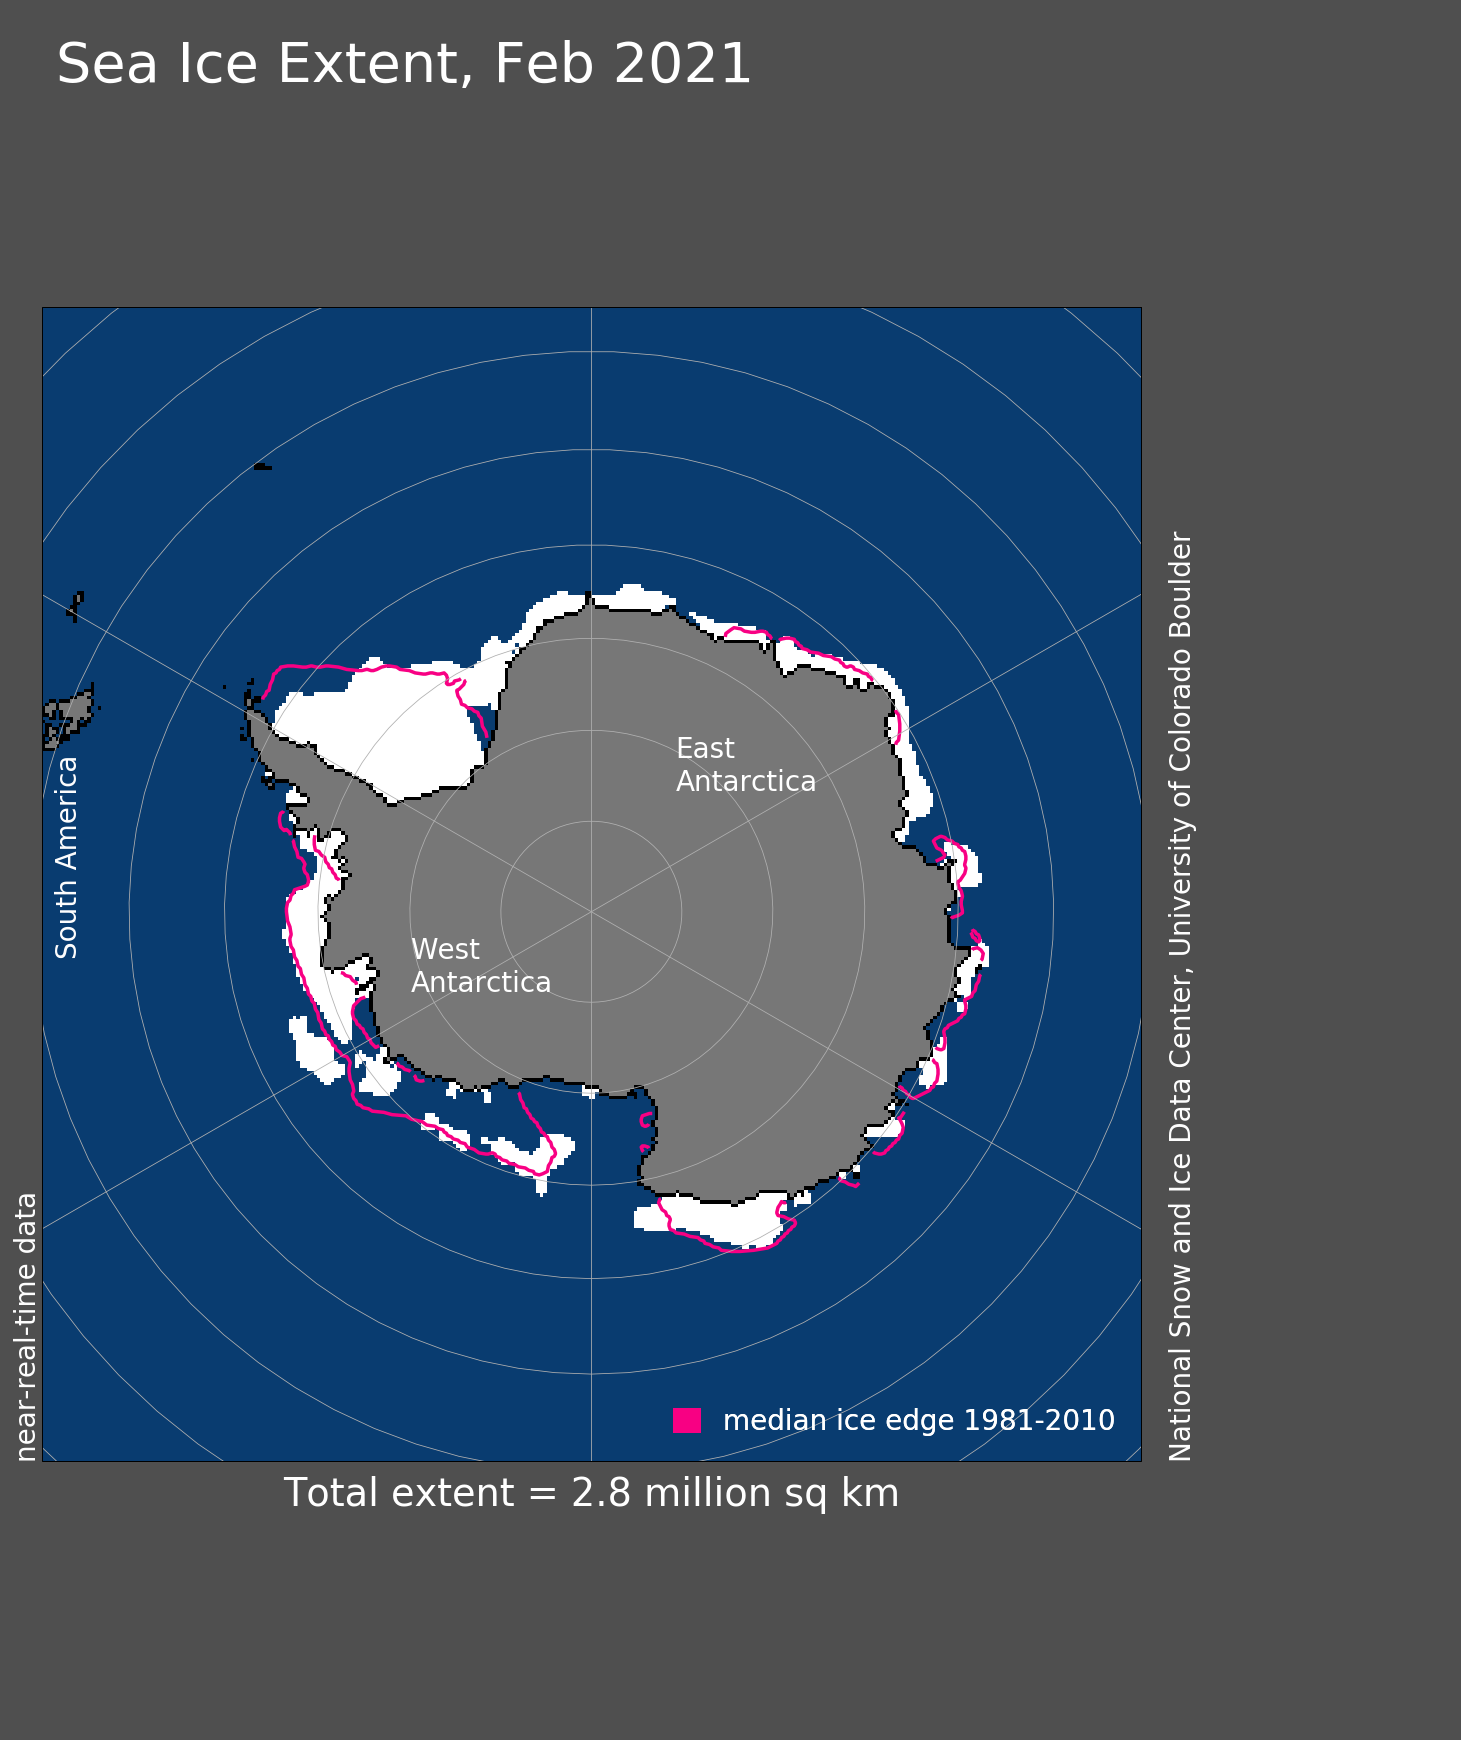
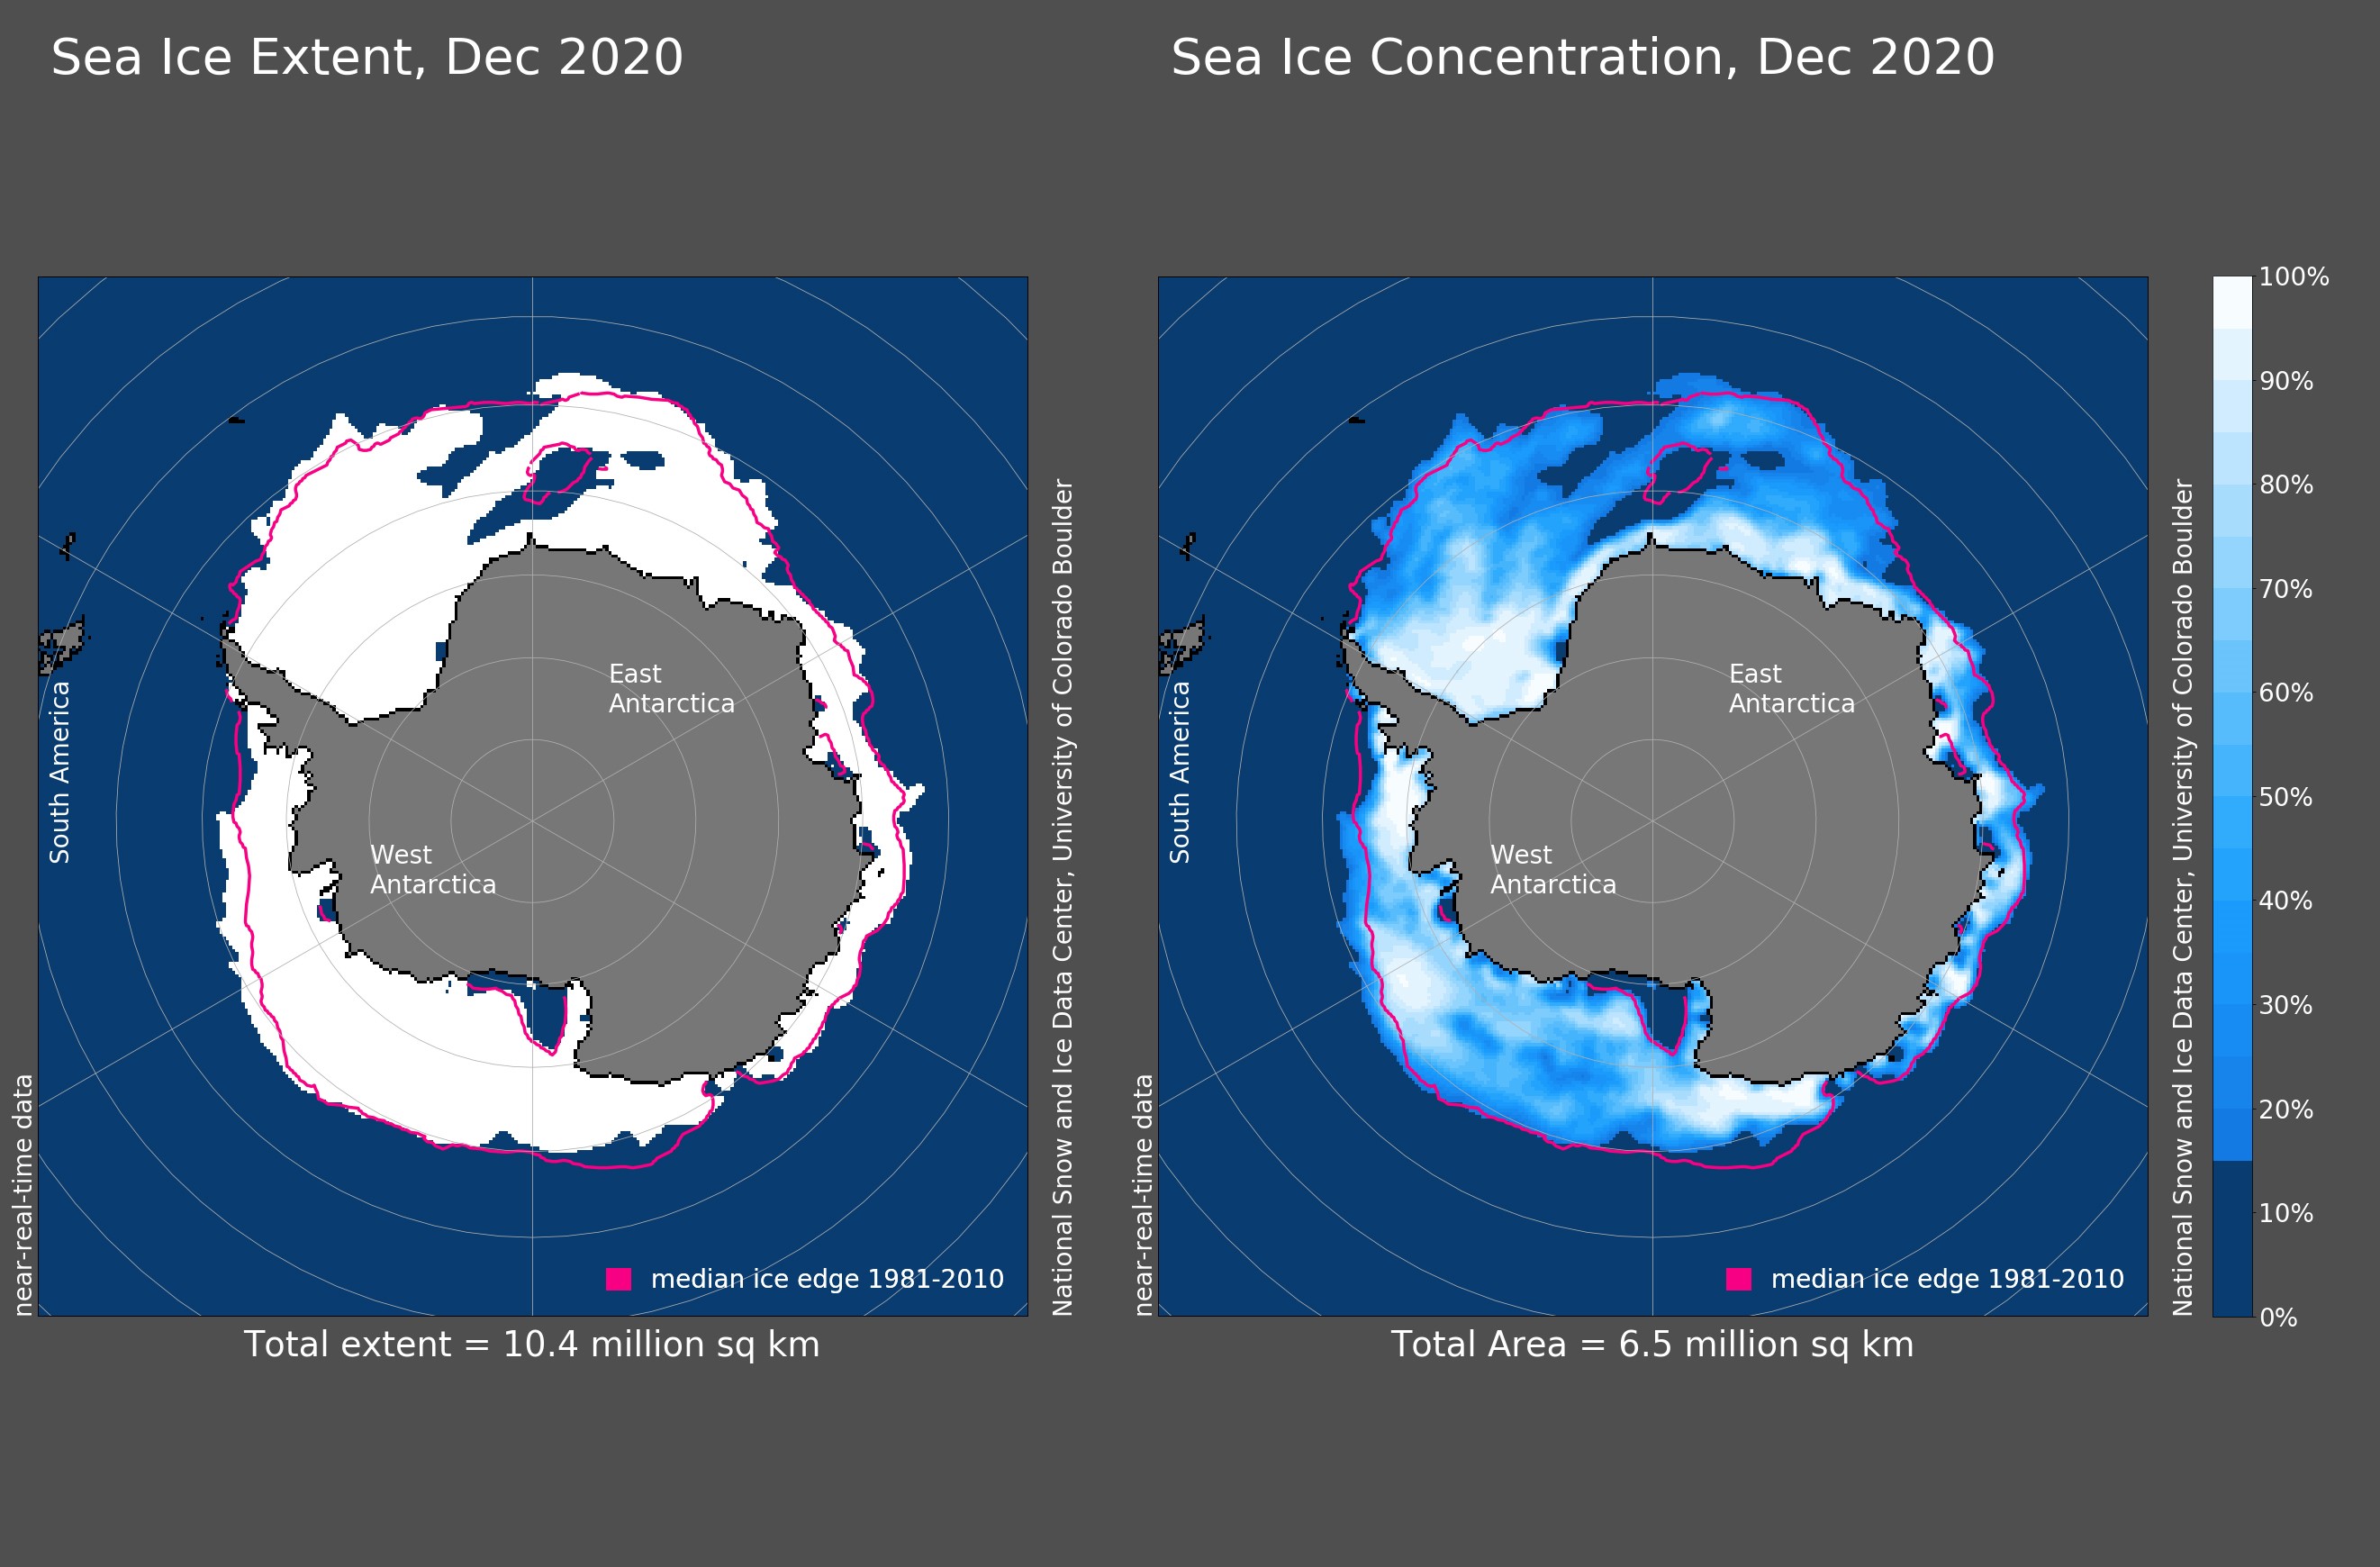
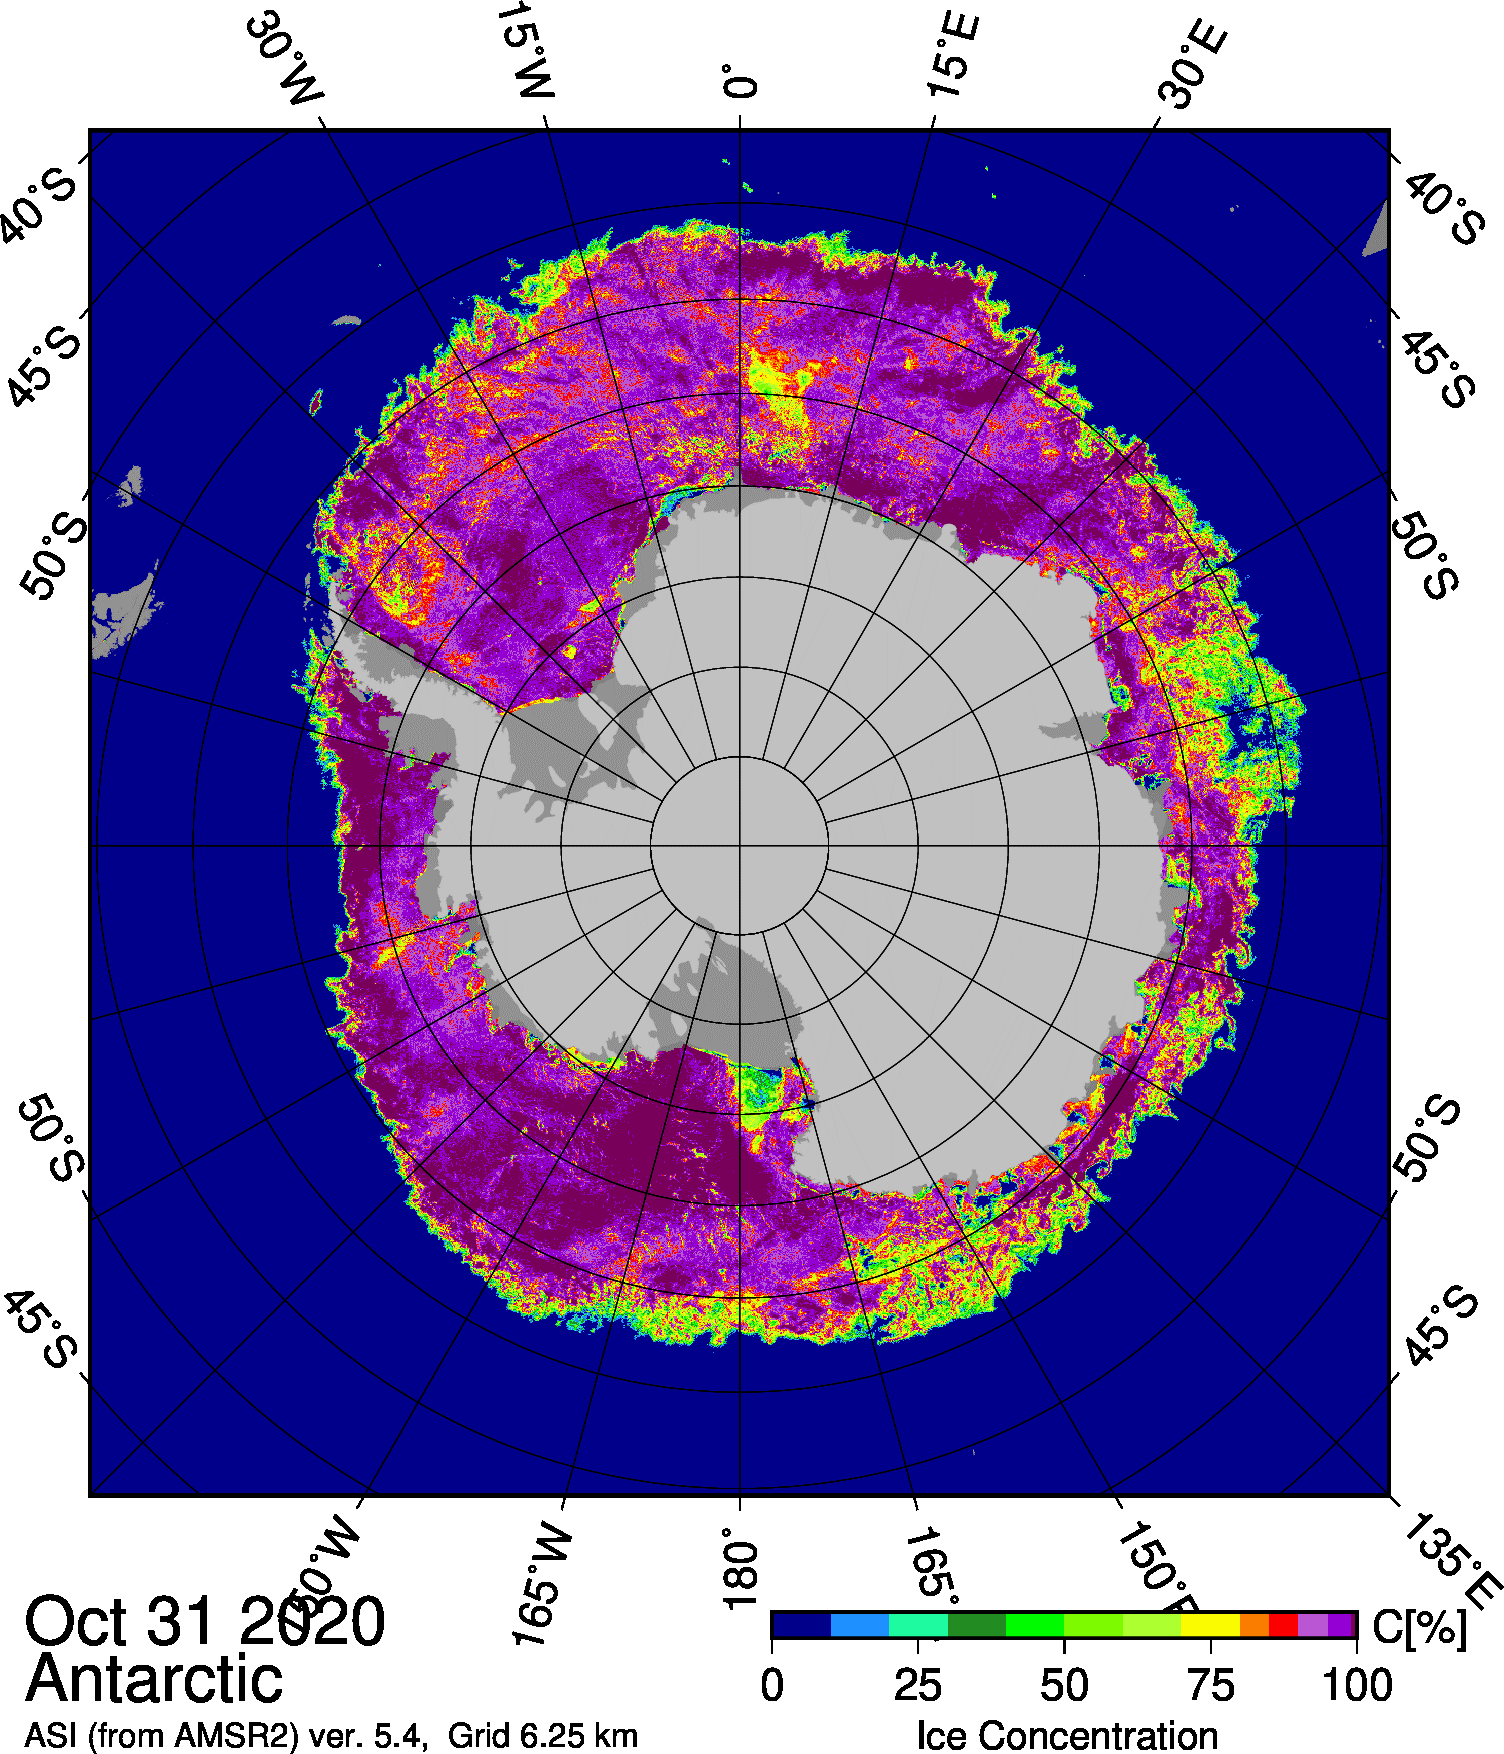
Figure 4a. Antarctic sea ice extent (left) for December 2020 was 10.4 million square kilometers (4.02 million square miles). Antarctic sea ice concentration (right) for December 2020 was 6.5 million square kilometers (2.51 million square miles). The magenta line shows the 1981 to 2010 average extent (left) and concentration (right) for that month. Sea Ice Index data. About the data
Credit: National Snow and Ice Data Center
High-resolution image
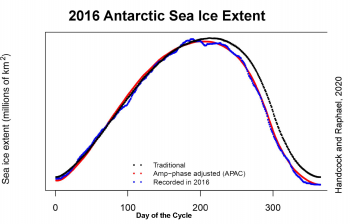
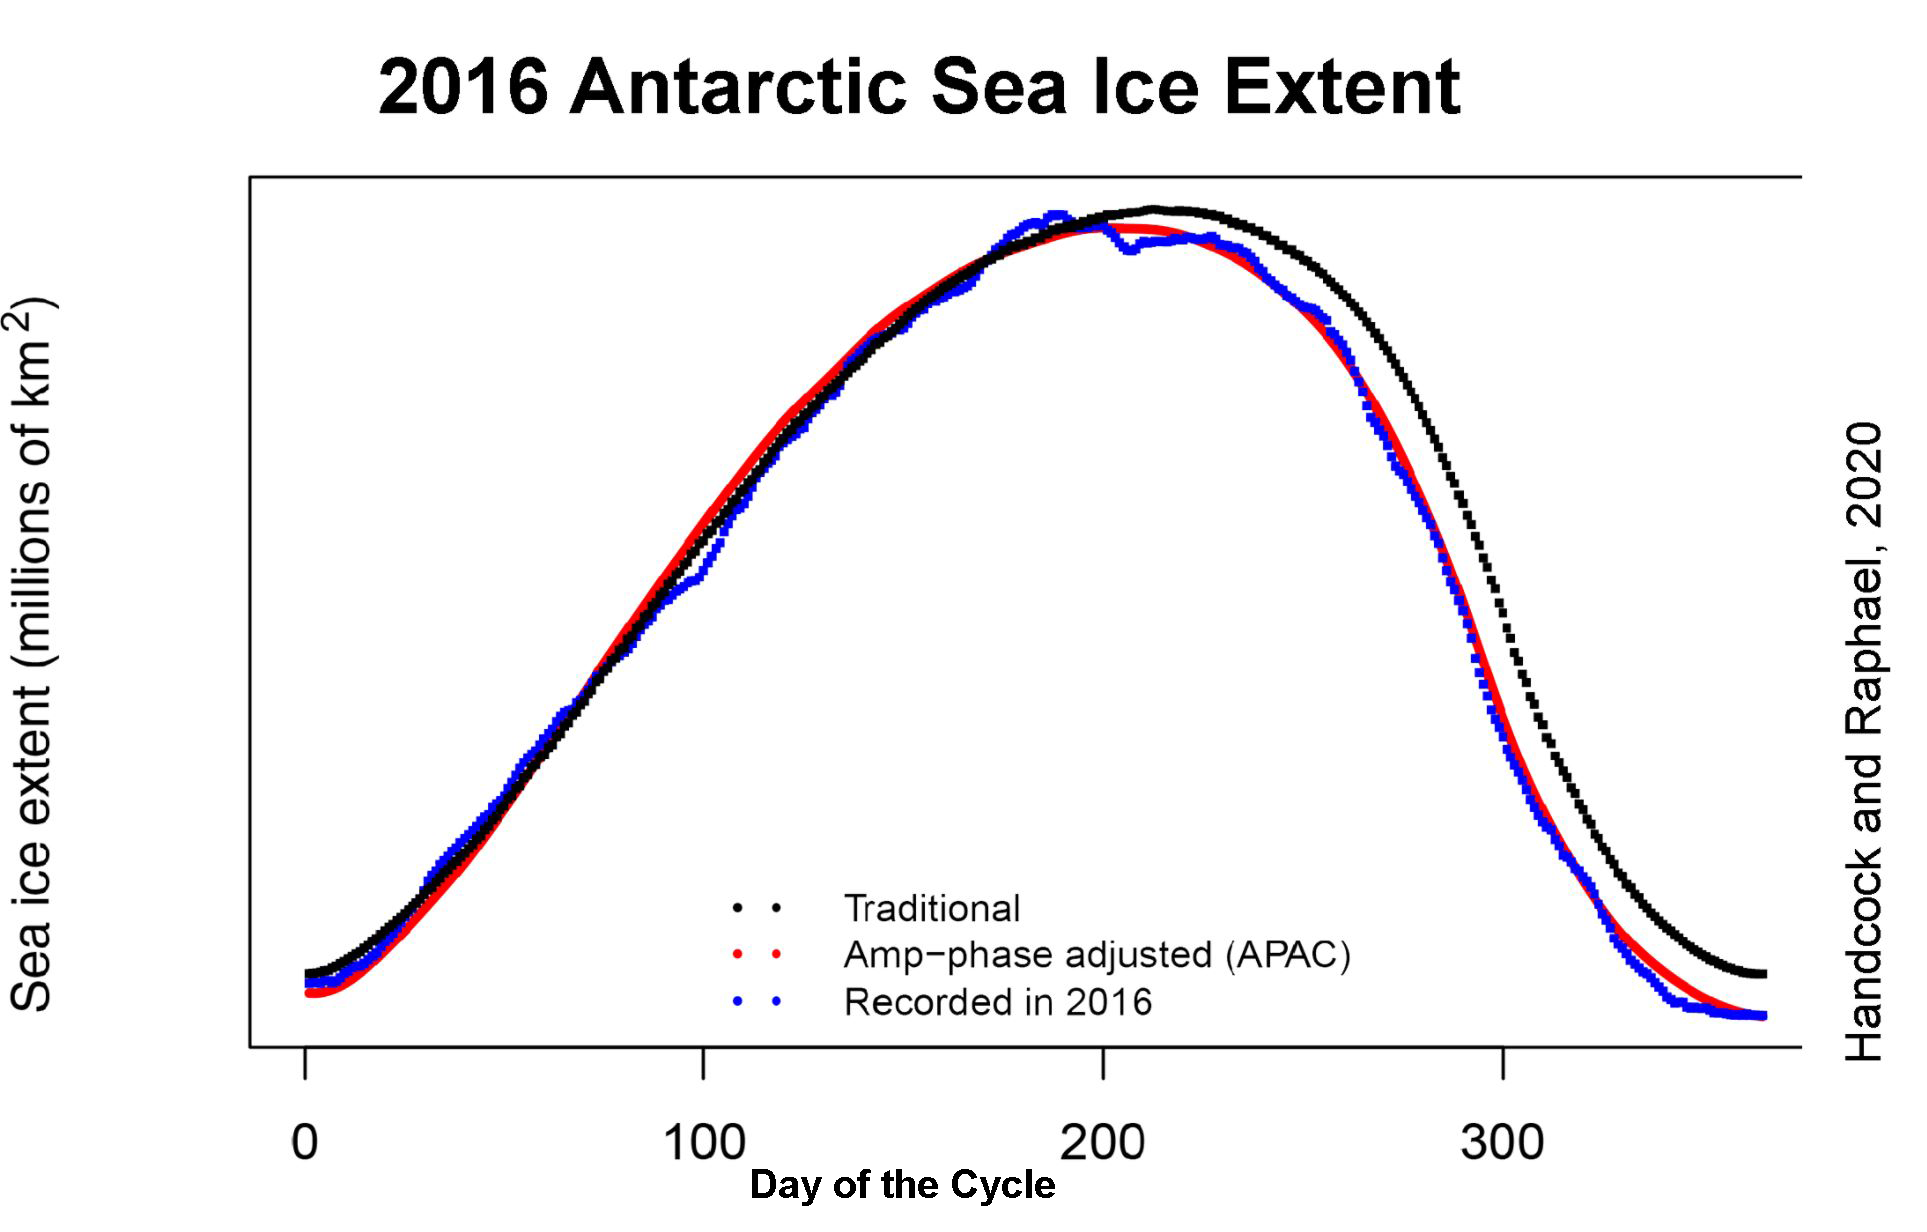
Figure 4b. This figure shows the impact of the sudden decline of Antarctic sea ice extent in August 2016 on the ice extent for the rest of the year. This was due to a phase shift of the decline pattern.
Credit: Handcock and Raphael, 2020
High-resolution image
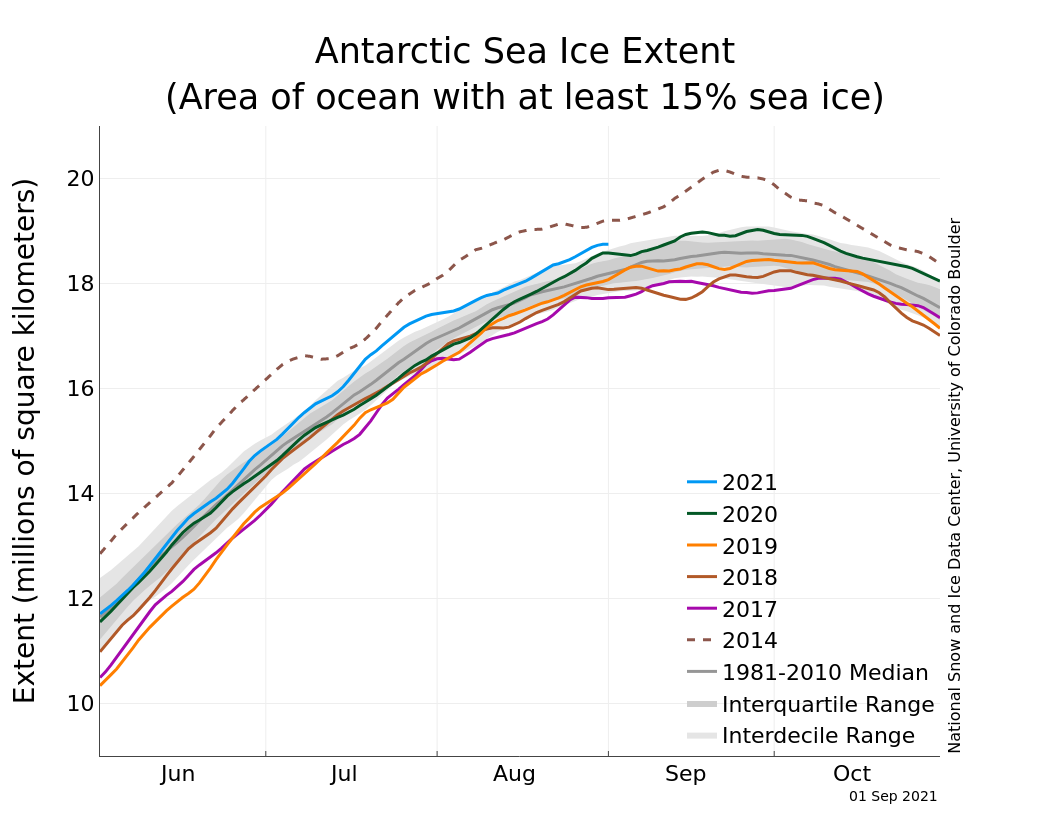
After being above average for much of the austral winter and spring, Antarctic sea ice extent dropped below average in the last week of December. Ice extent tends to see a steep decline in December as the ice begins to disintegrate all around the continent. However, the decline in sea ice extent in the Weddell and Ross Seas has been unusually rapid this year and large regions of low-concentration ice are present at year’s end (Figure 4a).
In a recent study, Handcock and Raphael (2020) note that in the Antarctic, much of the departure from average extent depends on the timing of the ice loss. For example, when extent is dropping substantially each day, a few days difference in the timing of the beginning and end of ice loss and gain can result in relatively large departure in ice extent from average. The causes of earlier or later onsets of ice loss—weather or ocean forcings on the cyclical annual trend—have long-running effects if they adjust the phase of the cycle.
After an extended period of below-average ice extent since the second half of 2016, Antarctic sea ice expanded to above-average levels in August of 2020 and remained high until the last week of this month. Once again, the Maud Rise polynya was open, but only briefly in late November and early December, as sea ice retreat in the Weddell proceeded and the ice edge swept past the polynya.
The Arctic sea ice year in review

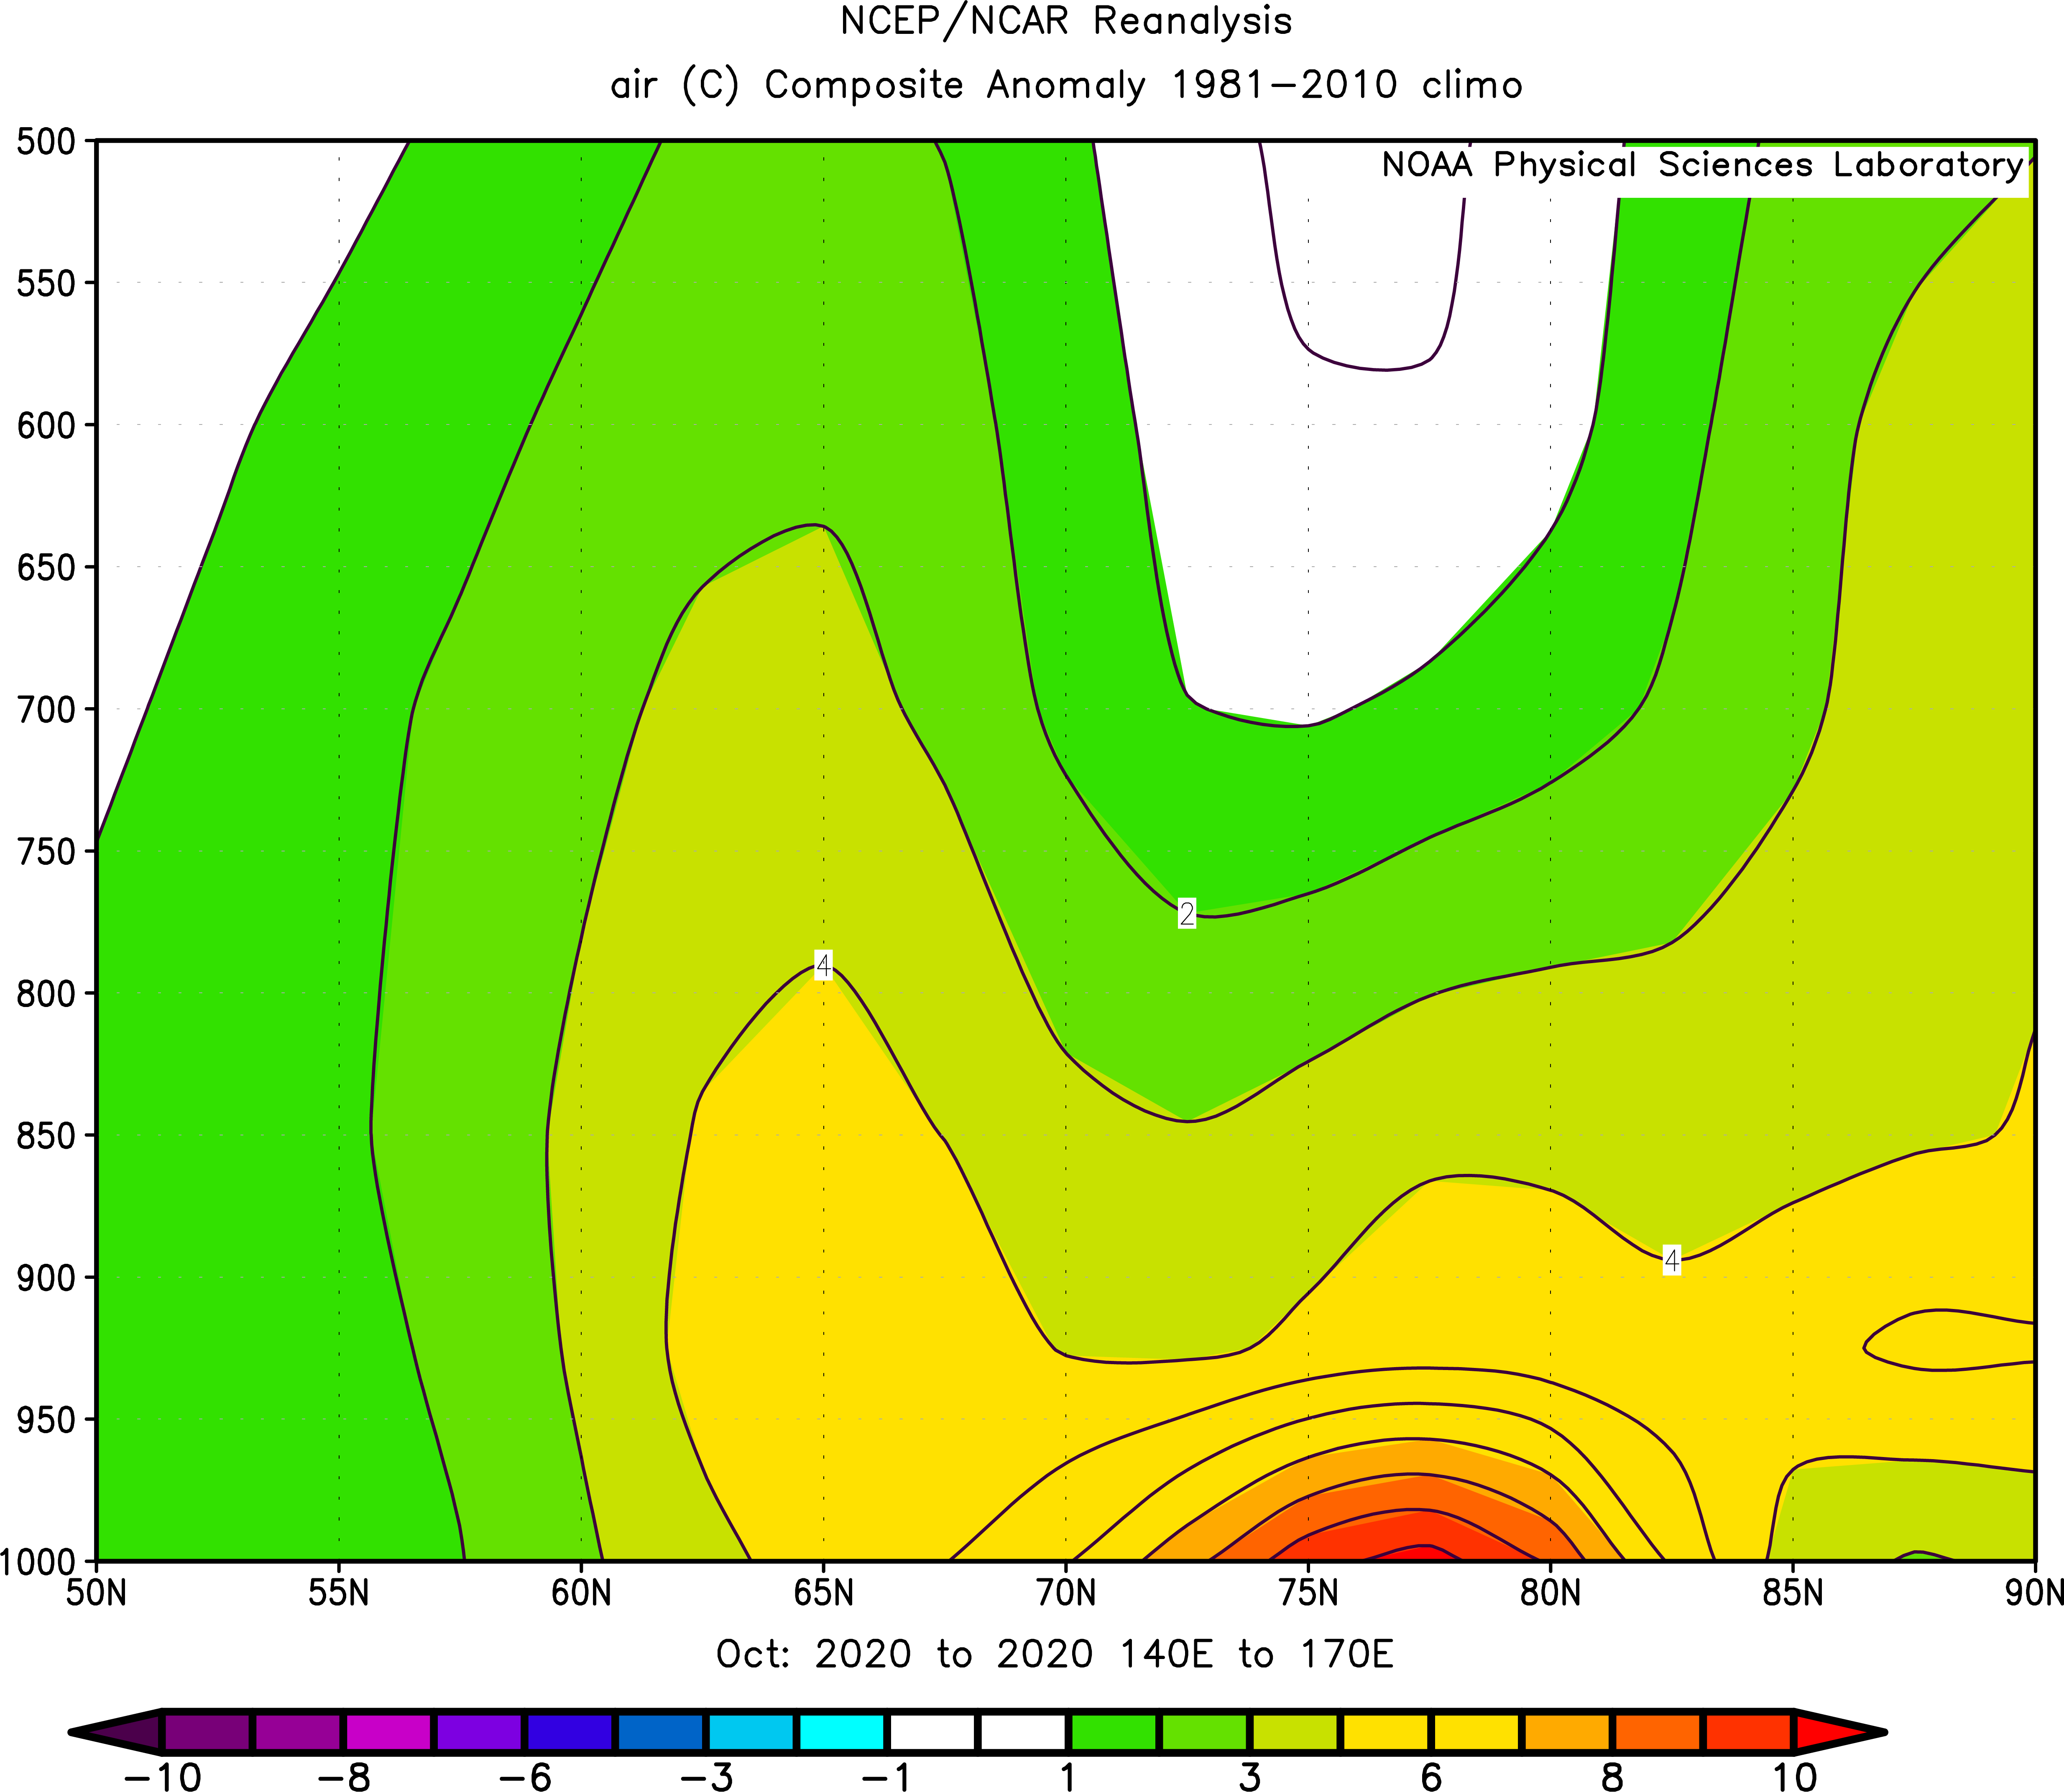
Figure 5a. This plot shows the departure from average air temperature in the Arctic at the 925 hPa level, in degrees Celsius, for the full calendar year 2020. Yellows and reds indicate higher than average temperatures; blues and purples indicate lower than average temperatures.
Credit: NSIDC courtesy NOAA Earth System Research Laboratory Physical Sciences Division
High-resolution image
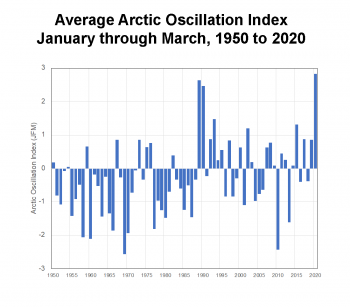
Figure 5b. This figure shows the average January, February, March Arctic Oscillation (AO) Index for 1950 to 2020.
Credit: NSIDC courtesy, with data from the NOAA NCEP Climate Prediction Center.
High-resolution image
The year 2020 was extreme for the Arctic, even compared to the past 20 years. Notable was the extreme heat over Siberia. The annual average temperature at the 925 mb level (about 2,500 feet above sea level) was over 3.5 degrees Celsius (6 degrees Fahrenheit) above the 1981 to 2010 annual average over a broad area of North Central Siberia extending over the Kara and Laptev Seas (Figure 5a). Temperatures were particularly high in the region through the first six months of the year, culminating in a 100-degree Fahrenheit (38-degrees Celsius) temperature reading in June in Verkhojansk, Russia. This was the first recorded temperature of over 100 degrees Fahrenheit north of the Arctic Circle.
These very warm conditions, coupled with winds from the south, led to early melt onset and ice retreat in the Laptev Sea. By mid-June, ice in the Laptev Sea had reached record low extent for that time of year. The strong positive mode of the Arctic Oscillation (AO) during the 2020 winter from January through March may have contributed to thin ice in the region that melted out easily once melt started. The average 2020 winter AO index was the most positive in the National Centers for Environmental Prediction (NCEP) record, dating back to 1950. Only 1989 and 1990 rivaled 2020 (Figure 5b).
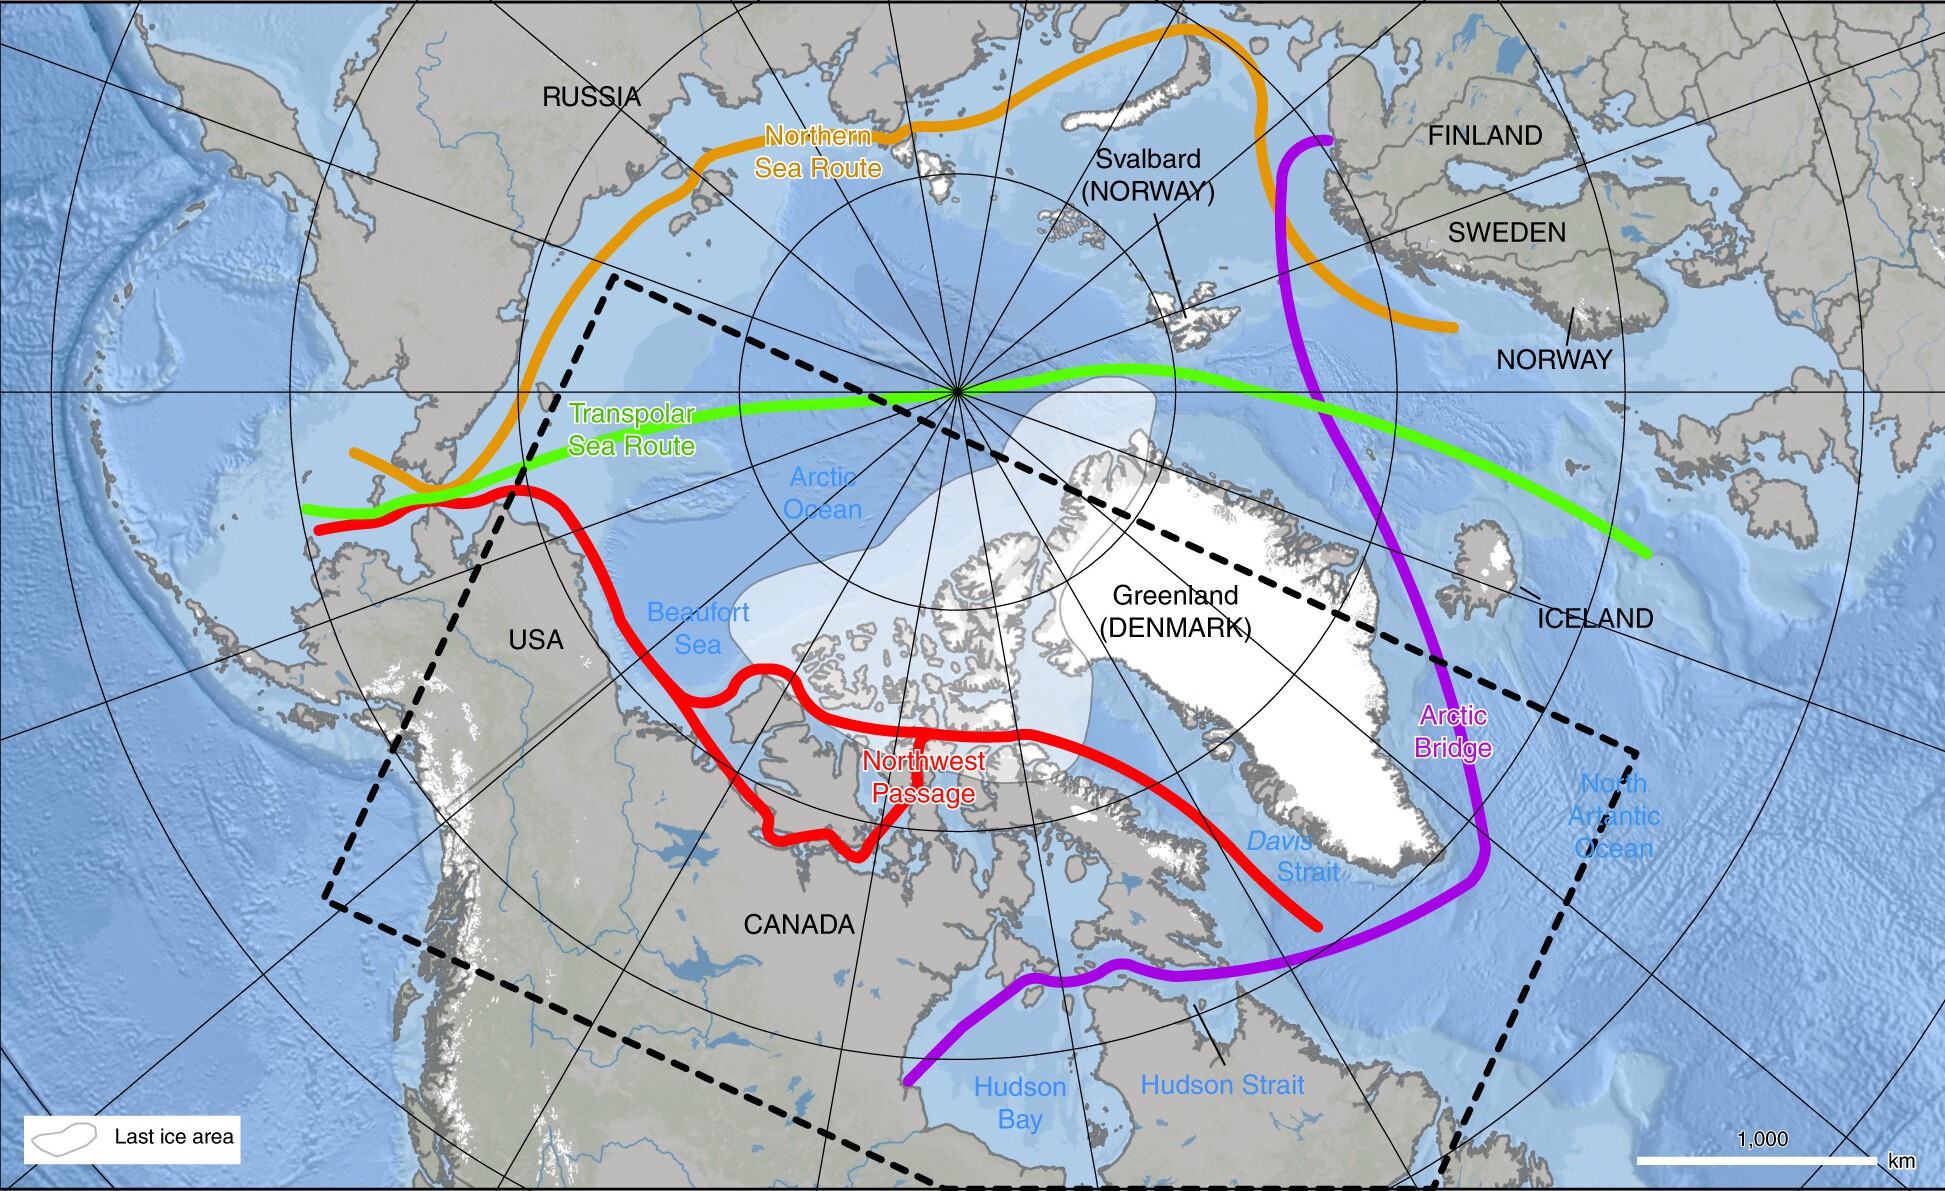
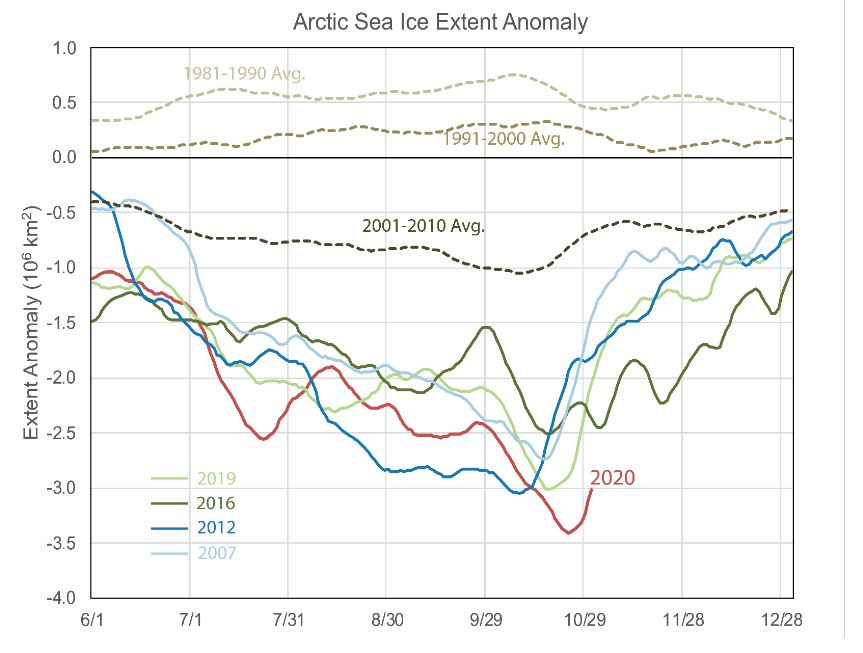
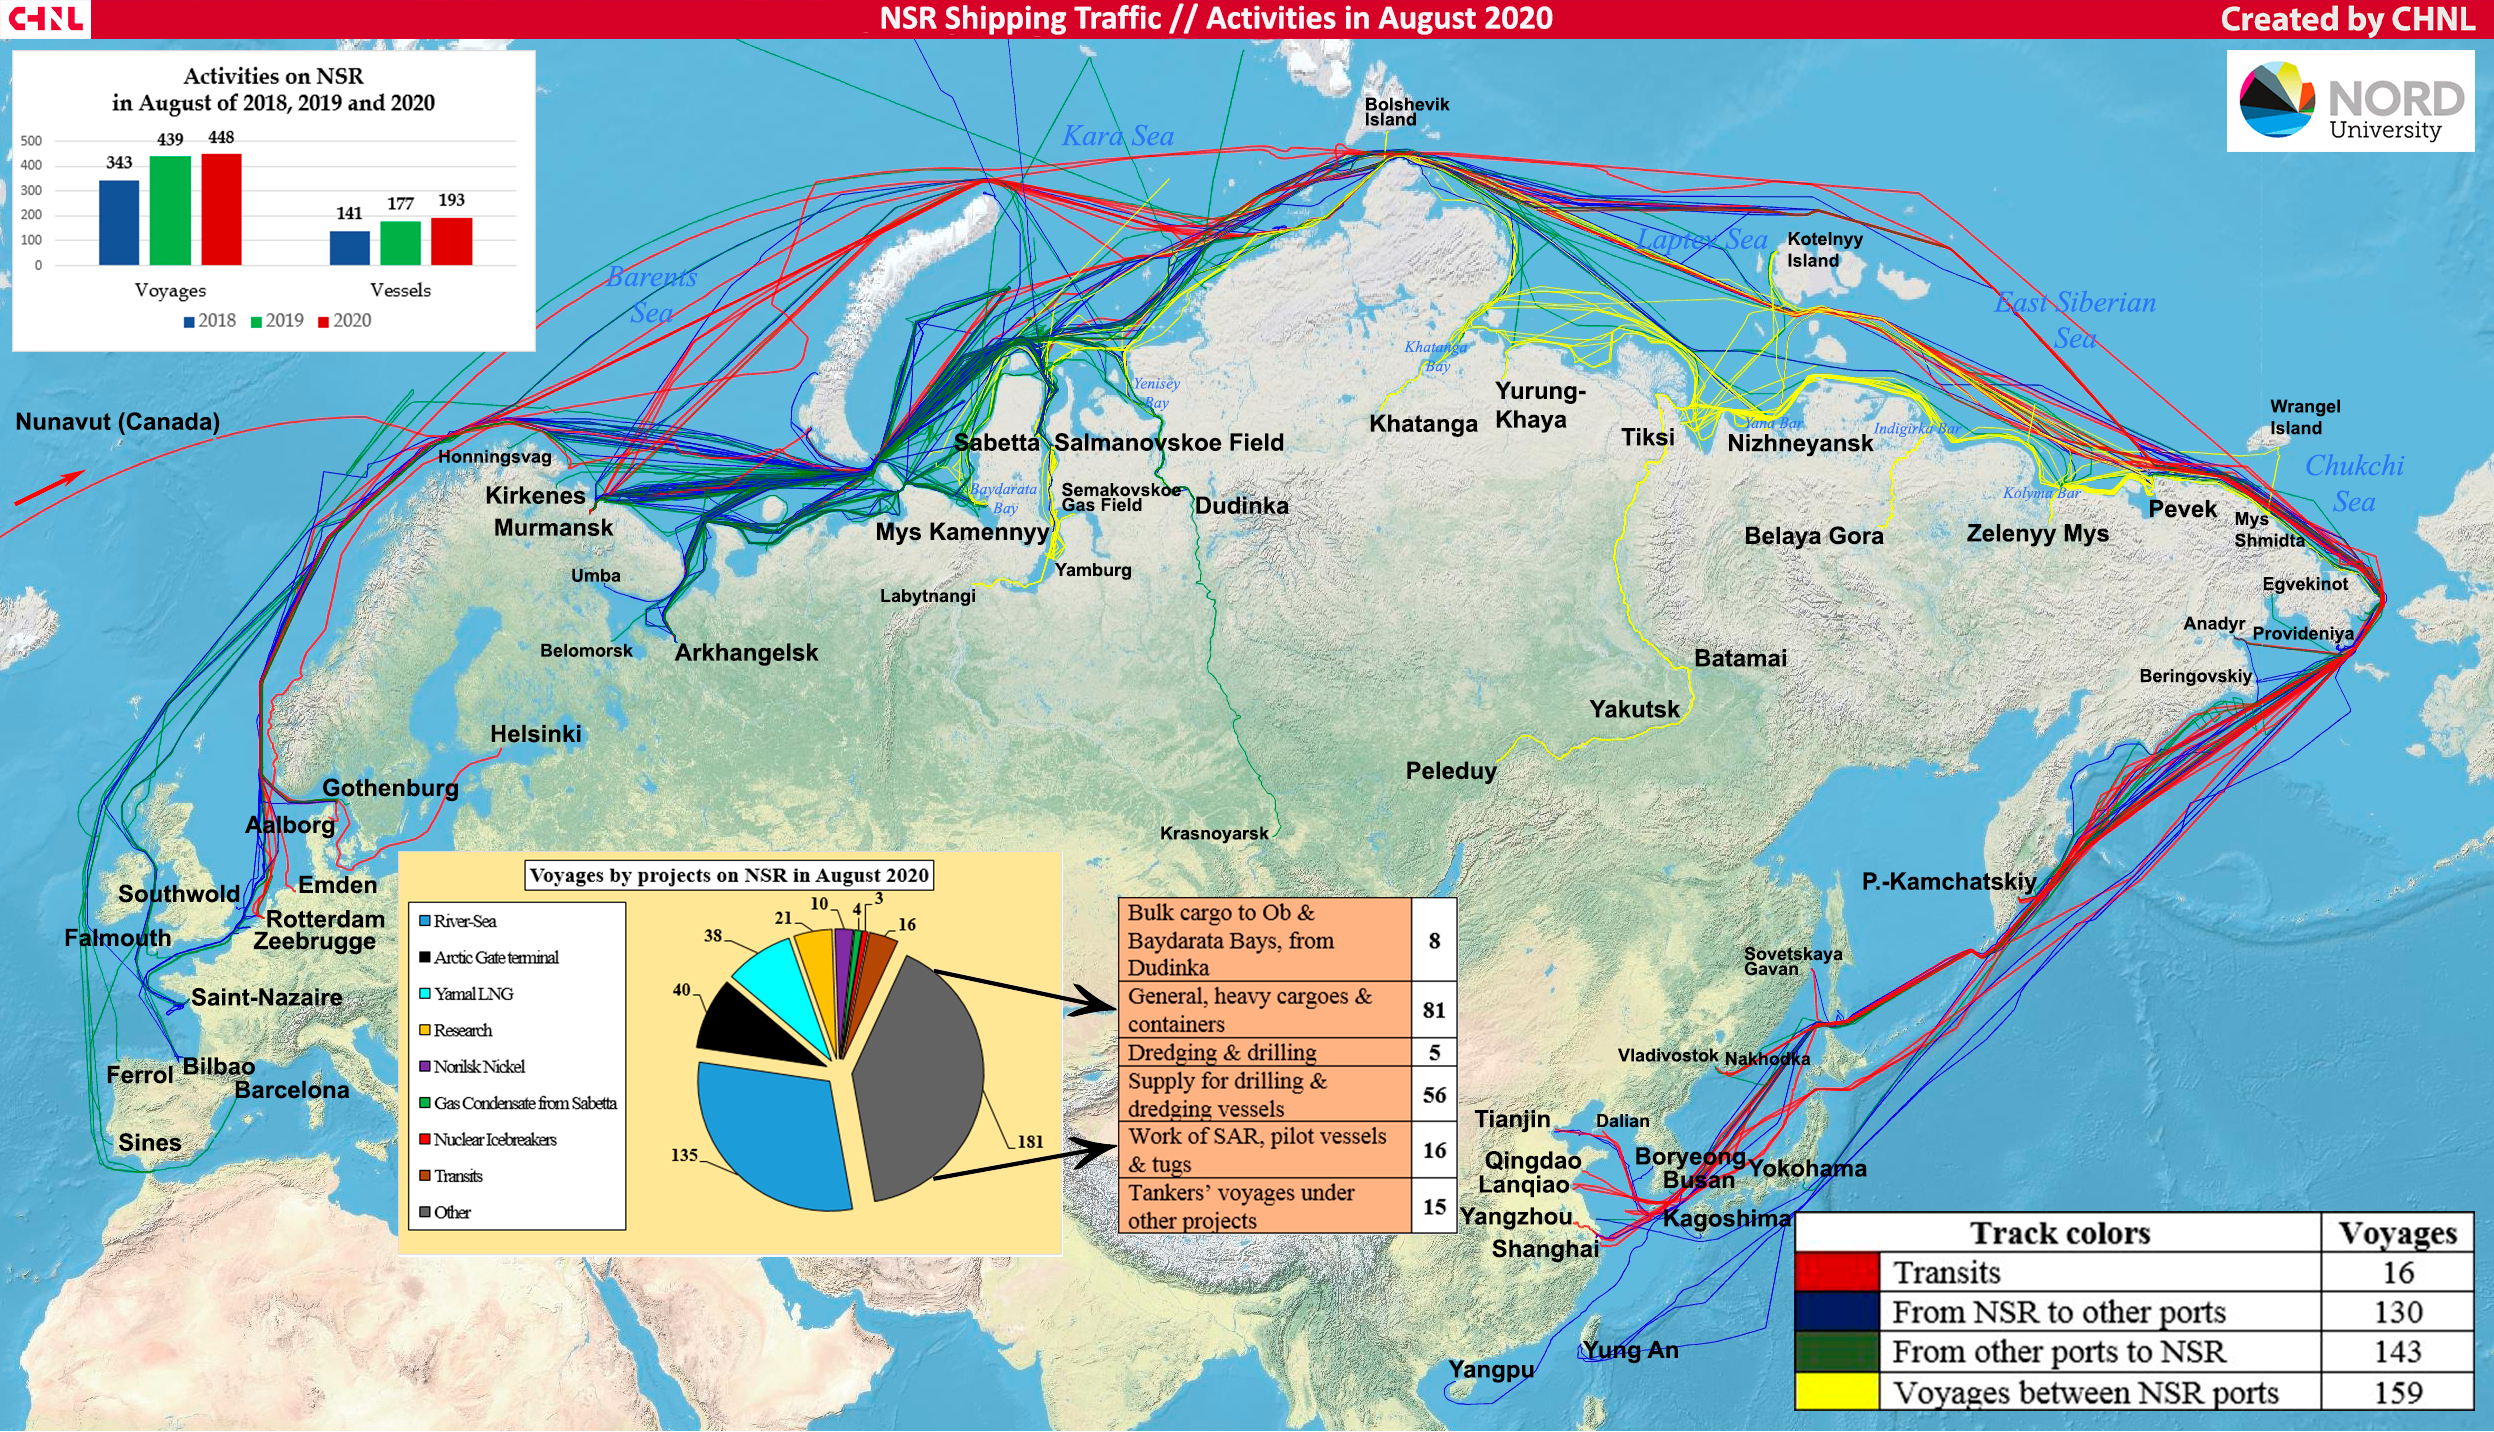
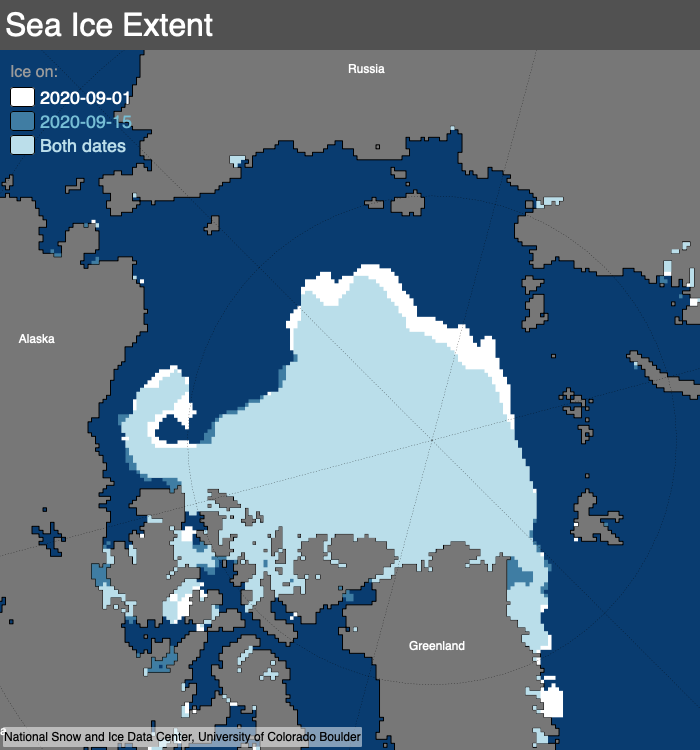
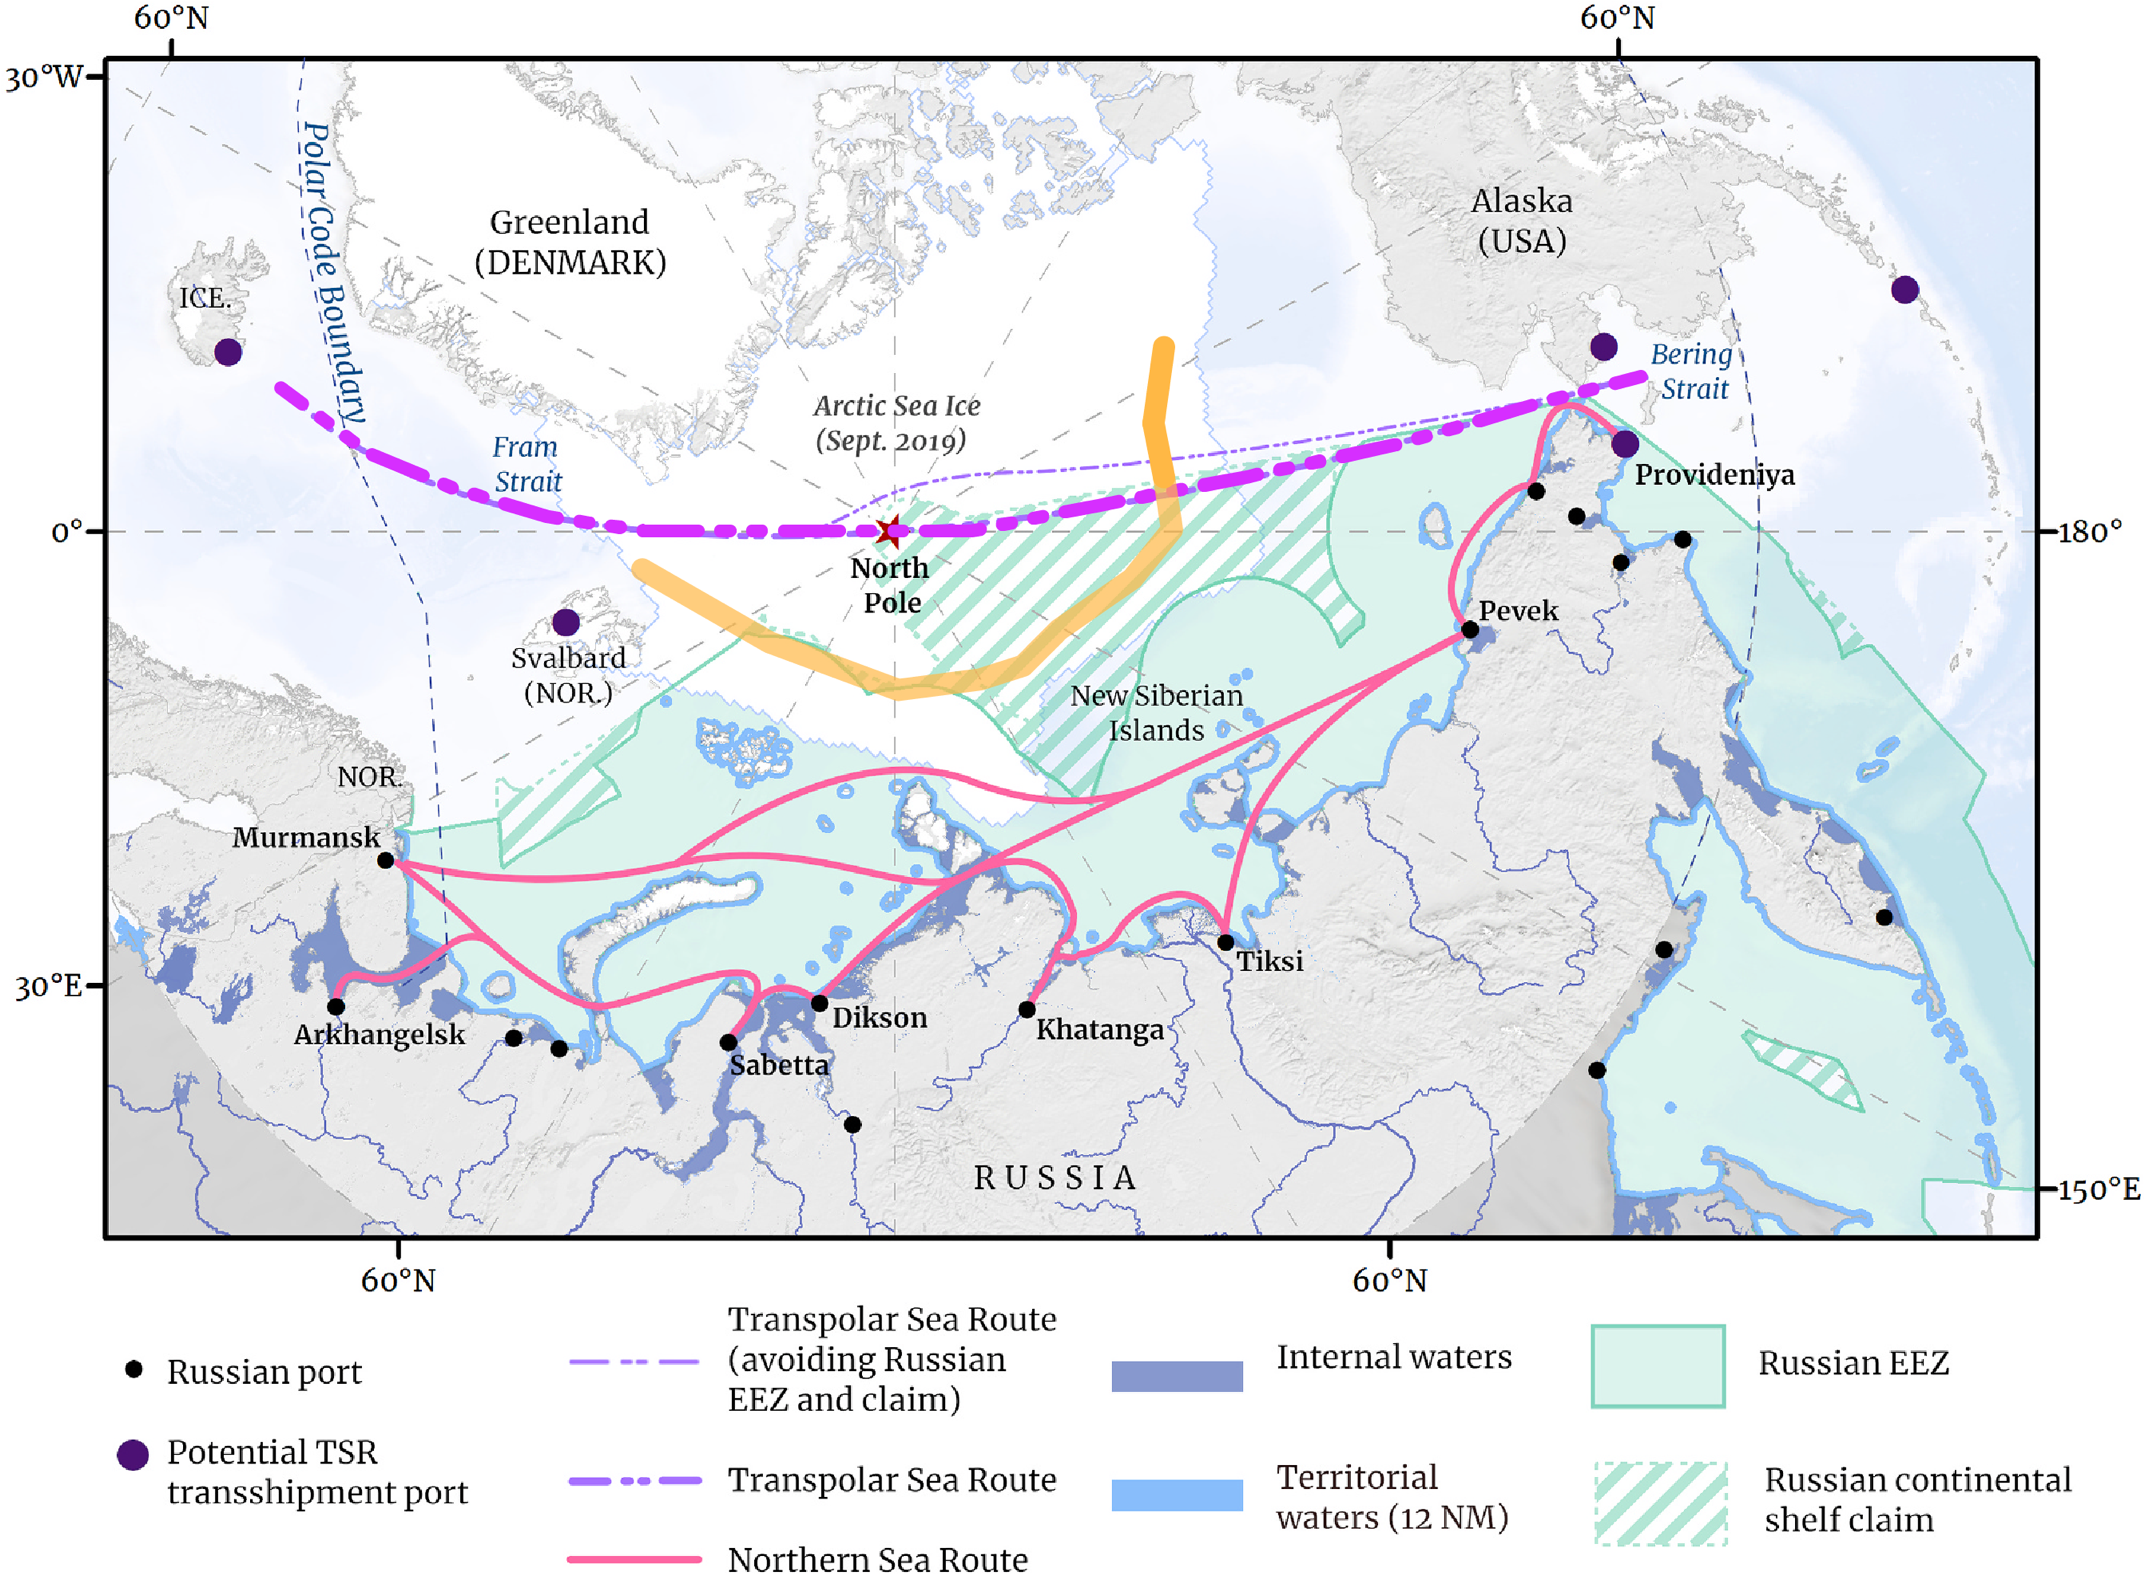
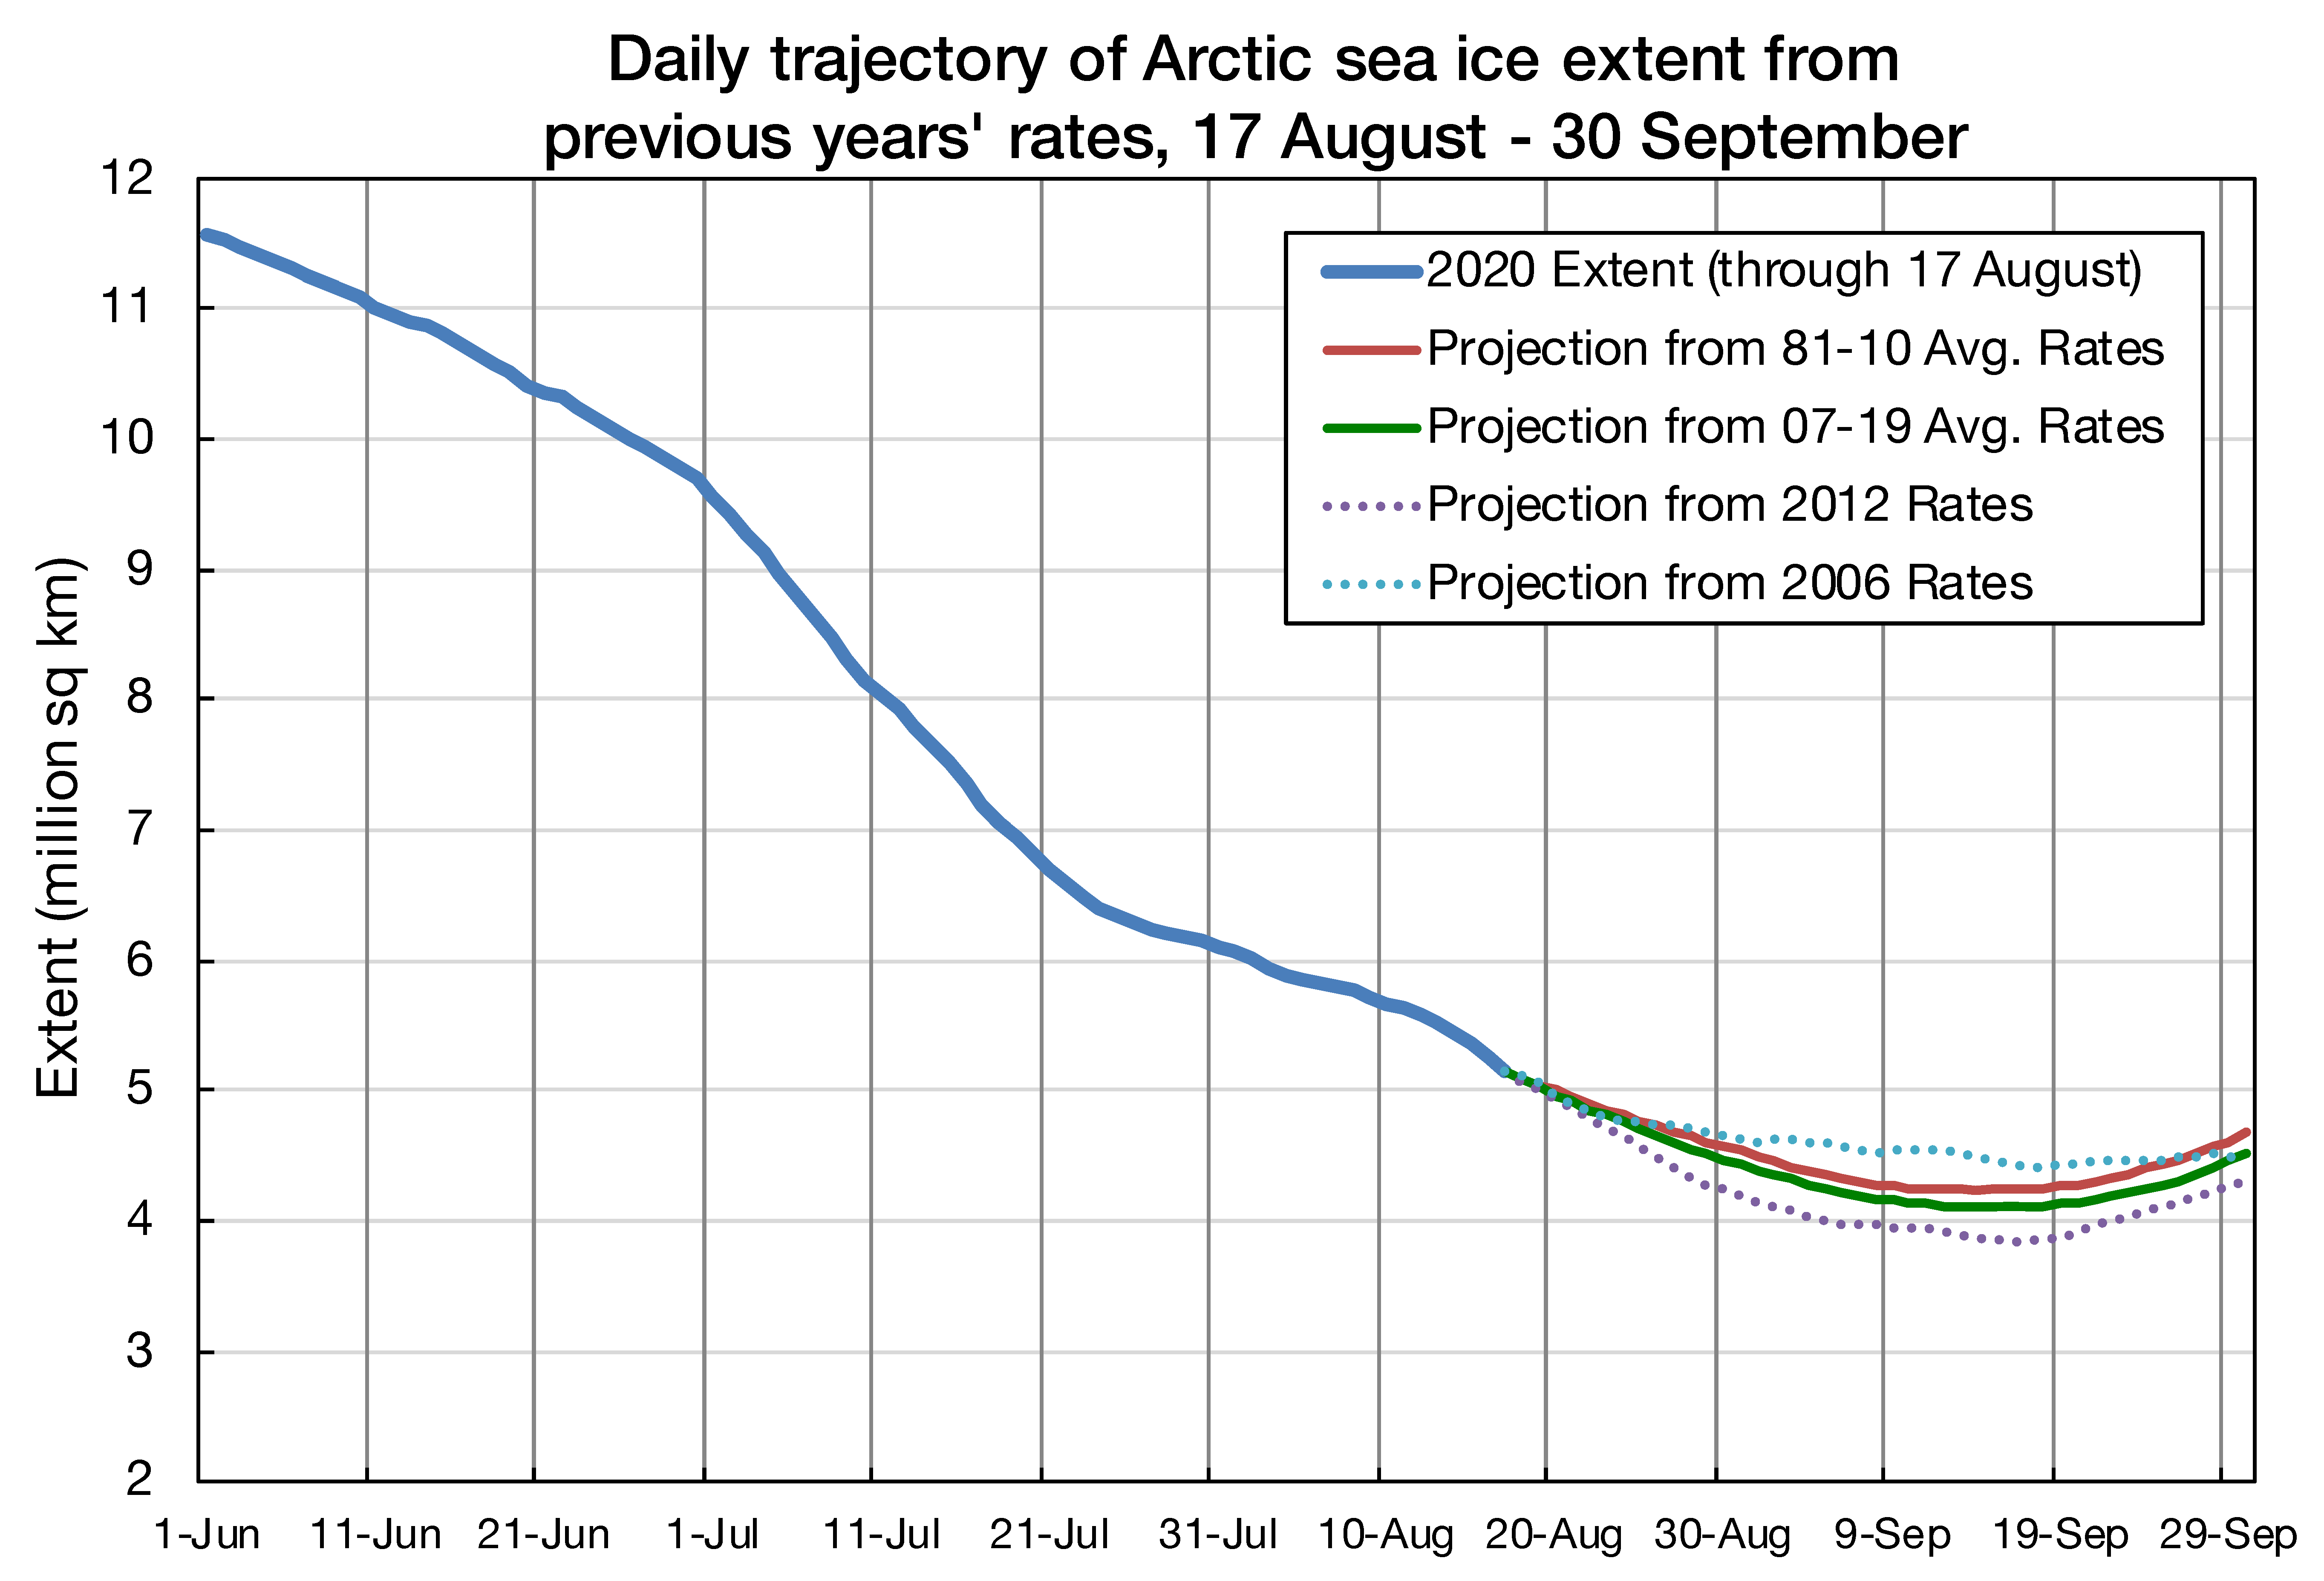
The winter and spring conditions and early sea ice melt onset and retreat led to the second lowest September minimum extent in the satellite record, above only 2012. While Arctic air temperatures ranked as the highest recorded during both July and August, changes in the winds likely prevented extent from falling below the 2012 record low. There was a remarkably long open water shipping season along the Northern Sea Route (NSR) along the Russian coast. The relatively thin winter ice along the Russian coast (relative to the Central Arctic Ocean) allows for Russian icebreakers to maintain a channel for ships to navigate the passage throughout the year. However, as the summer ice extent has decreased, the NSR has become ice free for a longer period of time. In many recent years, the NSR was ice free for several weeks. A recent report indicates that this year’s ice-free season was the longest on record.
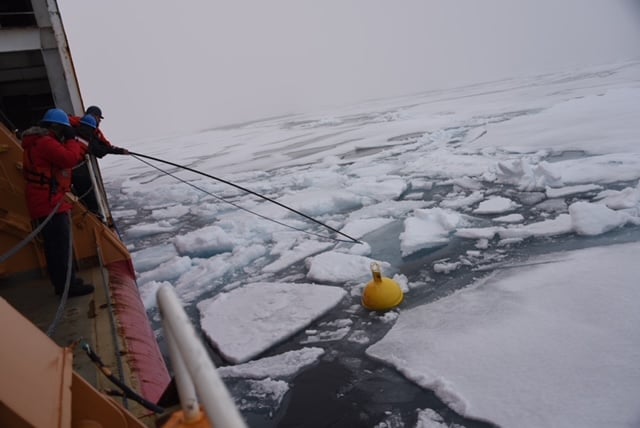
While the Arctic sea ice story largely centered on the Russian side of the Arctic Ocean, eyes also shifted toward the Atlantic in late summer with the retreat of the ice edge towards the pole. During late summer, the ice edge retreated to within about 500 kilometers (300 miles) of the North Pole north of the Barents and Kara Seas. Along that ice edge, the ice was not very compact. This allowed the German icebreaker, R.V. Polarstern, to easily cruise to the pole in early August as part of the Multidisciplinary drifting Observatory for the Study of Arctic Climate (MOSAiC) expedition.
Initial results from MOSAiC
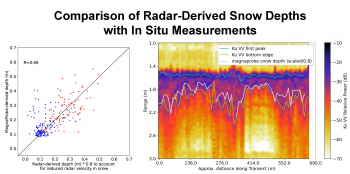
Figure 6. The left side of this figure shows the agreement between snow depth derived from the Ku-Ka radar sensor (x-axis) and in situ measurements (y-axis) by a magnaprobe snow depth instrument across two transects (red and blue dots). The radar measurements have a correlation with the in situ measurements of 0.66, demonstrating the utility of the radar for estimating snow depth. The right side shows the data along a transect across the snow and ice with the radar and the magnaprobe. The colors in the plot correspond to the strength of radar signal and the lines demarcate snow/air and snow/ice boundaries. For further details on the analysis and the figures, see Stroeve et al. (2020).
Credit: R. Willatt, University of College London
High-resolution image
As discussed in earlier posts, the MOSAiC expedition was the most notable scientific Arctic event of 2020. The expedition involved freezing an icebreaker into Arctic sea ice for one year beginning in September 2019. Scientists collected data on all aspects of the Arctic environment, including sea ice, atmosphere, ocean, biology, chemistry, and more. It will take years to fully assess the data, but initial analyses are already being published. This includes a new paper (Stroeve et al., 2020) analyzing data from a ground-mounted radar, an effort led by NSIDC senior research scientist and MOSAiC participant, Julienne Stroeve. This radar has the same frequencies as used on current satellite systems to monitor ice thickness and snow depth. However, satellites do not directly retrieve sea ice thickness; it is inferred based on assumptions as to where the radar return is coming from as well as assumptions on depth of the snowpack, and densities of the ice, snow and water. To better understand how snowpack properties influence radar backscatter at these frequencies, Stroeve and colleagues deployed a fully polarimetric, dual frequency radar with both Ku radar (12 to 18 gigahertz) and Ka radar (27 to 40 gigahertz). The instrument operated in a scanning mode, sweeping above the surface at different azimuth and incidence angles, as well as an altimeter mode, looking straight down while being towed with a skidoo. Observations were supported by detailed snow pit observations, snow depth and ice thickness, as well as laser scans of the surface to provide estimates of surface roughness.
Initial results based on data collected between October 2019 and January 2020 show that a combination of frequencies can provide estimates of snow depth. Further, the data illustrate the radar backscatter sensitivity to snow pack temperature and surface roughness, affecting the retrieved height of the sea ice freeboard, or sea ice thickness calculations.
Further reading
Handcock, M. S. and M. N. Raphael. 2020. Modeling the annual cycle of daily Antarctic sea ice extent. The Cryosphere. doi:10.5194/tc-14-2159-2020.
Rigor, I. G., Wallace, J. M., and R. L. Colony. 2002. Response of Sea Ice to the Arctic Oscillation. Journal of Climate. doi:10.1175/1520-0442(2002)015<2648:ROSITT>2.0.CO;2.
Stroeve, J., Nandan, V., Willatt, R., Tonboe, R., Hendricks, S., Ricker, R., Mead, J., Mallett, R., Huntemann, M., Itkin, P., Schneebeli, M., Krampe, D., Spreen, G., Wilkinson, J., Matero, I., Hoppmann, M., and M. Tsamados. 2020. Surface-based Ku- and Ka-band polarimetric radar for sea ice studies. The Cryosphere. doi:10.5194/tc-14-4405-2020.