The spring decline in Arctic sea ice extent continued at varying rates through the month of April, highlighted by a mid-month pause. Above average air temperatures and low sea level pressure dominated on the Atlantic side of the Arctic, while near average conditions ruled elsewhere.
Overview of conditions
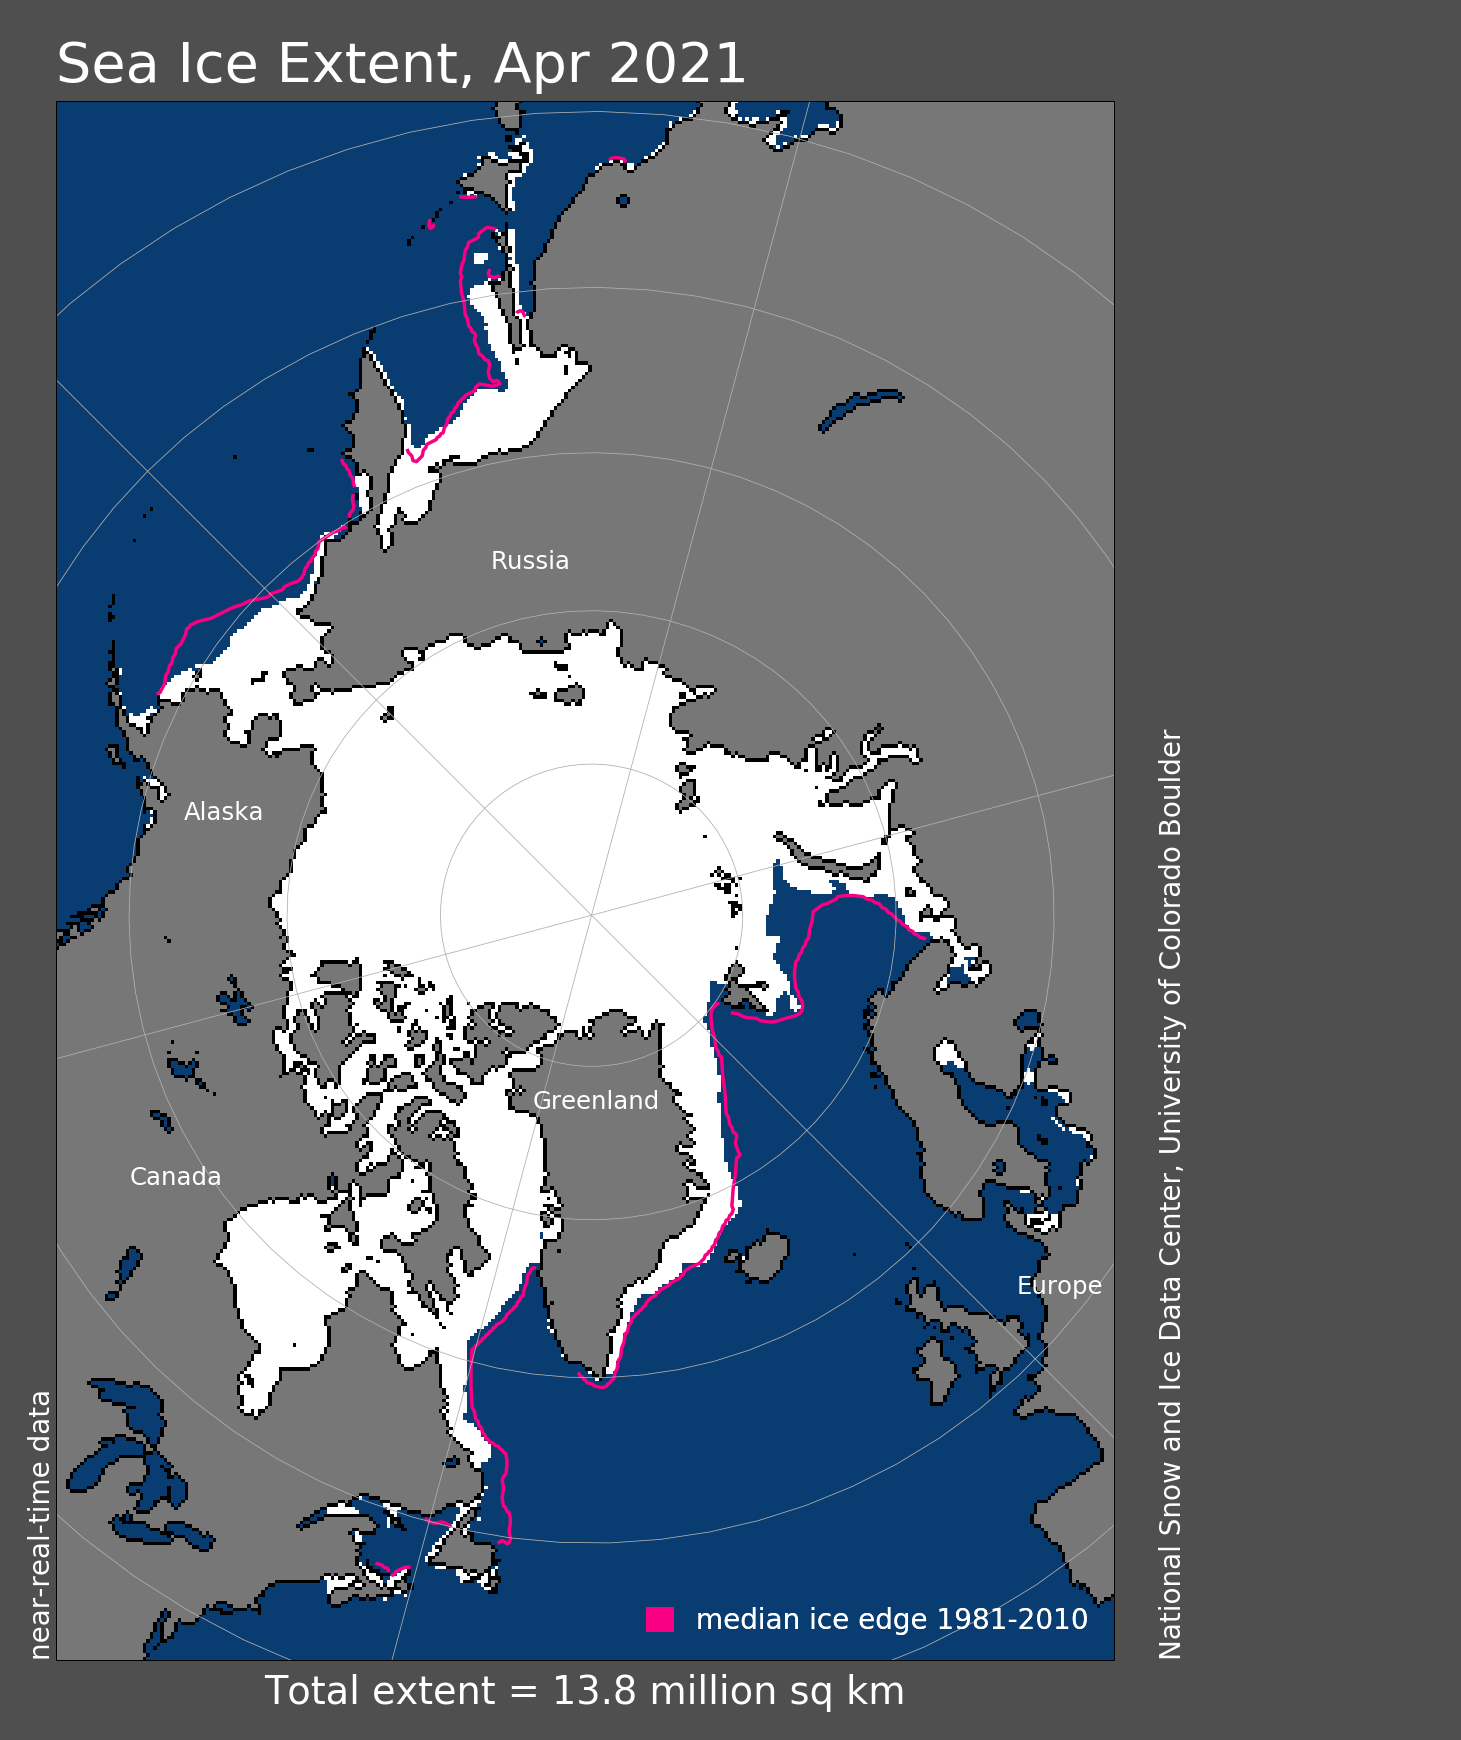
Figure 1. Arctic sea ice extent for April 2021 was 13.84 million square kilometers (5.34 million square miles). The magenta line shows the 1981 to 2010 average extent for that month. Sea Ice Index data. About the data
Credit: National Snow and Ice Data Center
High-resolution image
Arctic sea ice extent averaged for April 2021 was 13.84 million square kilometers (5.34 million square miles). This was 410,000 square kilometers (158,000 square miles) above the record low for the month set in 2019 and 850,000 square kilometers (328,000 square miles) below the 1981 to 2010 average. The average extent for the month ranks sixth lowest in the passive microwave satellite record. Extent was notably low in the Barents and Bering Seas as well as the Labrador Sea. Elsewhere, extent was close to or somewhat below average (Figure 1). The largest ice loss during April was in the Sea of Okhotsk and the Labrador Sea, with smaller losses along the southern edge of the Bering Sea, and in the eastern Barents Sea near the coast of Novaya Zemlya.
Conditions in context
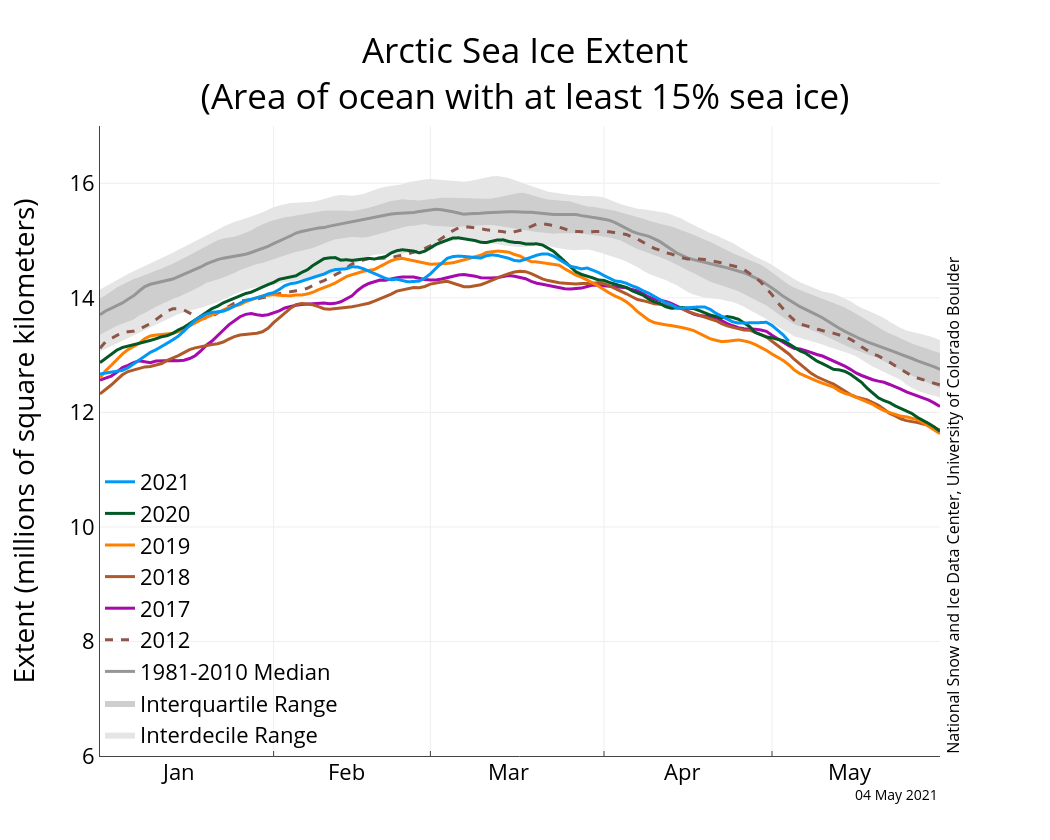
Figure 2a. The graph above shows Arctic sea ice extent as of May 4, 2021, along with daily ice extent data for four previous years and 2012, the record low year. 2021 is shown in blue, 2020 in green, 2019 in orange, 2018 in brown, 2017 in magenta, and 2012 in dashed brown. The 1981 to 2010 median is in dark gray. The gray areas around the median line show the interquartile and interdecile ranges of the data. Sea Ice Index data.
Credit: National Snow and Ice Data Center
High-resolution image
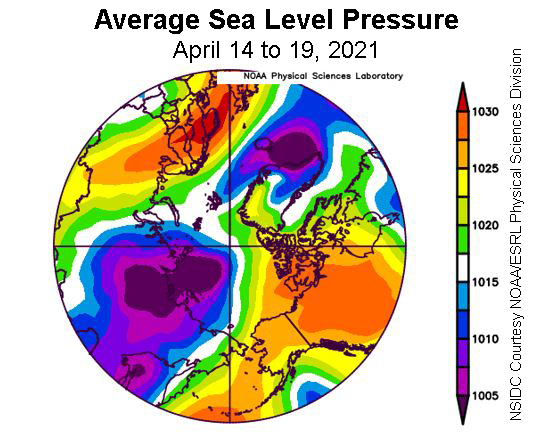
Figure 2b. This plot shows average sea level pressure in the Arctic in millibars from April 14 to 19, 2021. Yellows and reds indicate high air pressure; blues and purples indicate low pressure.
Credit: NSIDC courtesy NOAA Earth System Research Laboratory Physical Sciences Division
High-resolution image
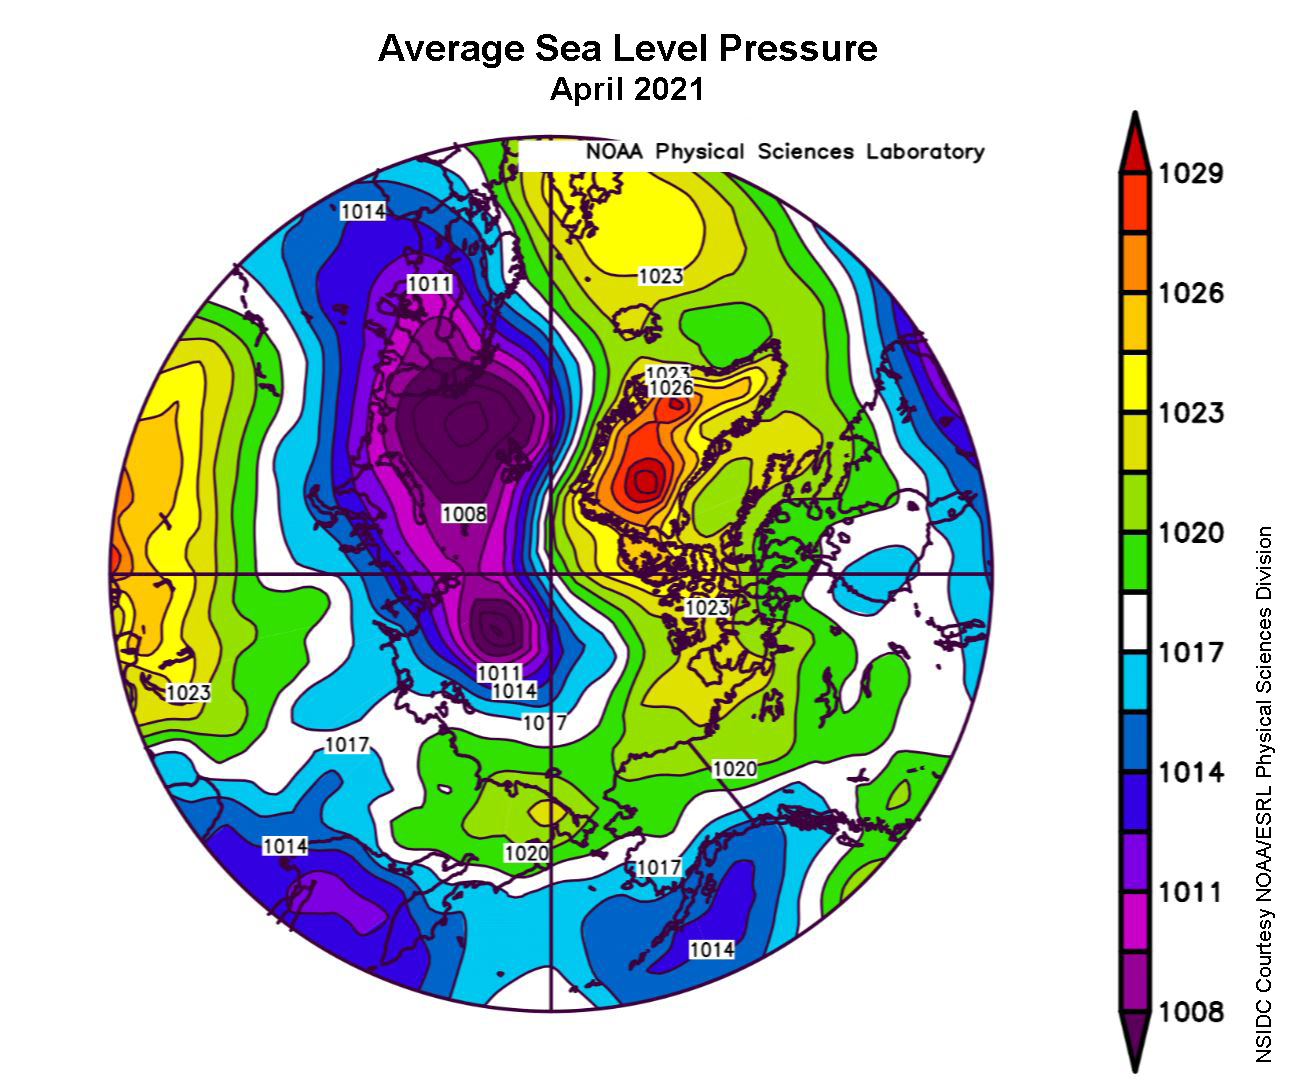
Figure 2c. This plot shows average sea level pressure in the Arctic in millibars for April 2021. Yellows and reds indicate high air pressure; blues and purples indicate low pressure.
Credit: NSIDC courtesy NOAA Earth System Research Laboratory Physical Sciences Division
High-resolution image
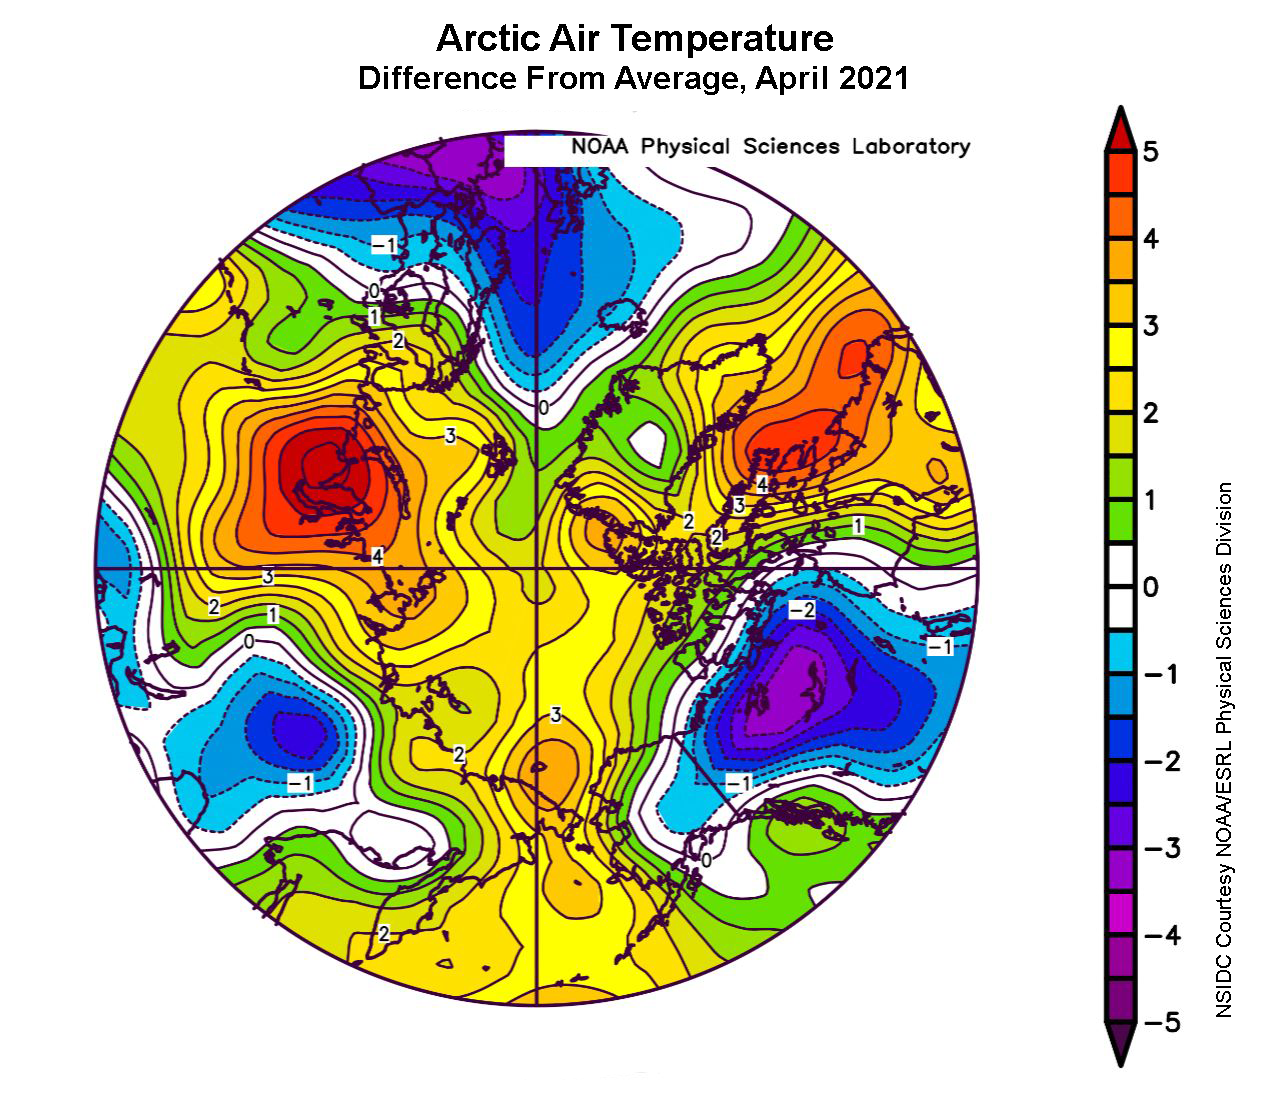
Figure 2d. This plot shows the departure from average air temperature in the Arctic at the 925 hPa level, in degrees Celsius, for April 2021. Yellows and reds indicate higher than average temperatures; blues and purples indicate lower than average temperatures.
Credit: NSIDC courtesy NOAA Earth System Research Laboratory Physical Sciences Division
High-resolution image
Sea ice extent remained below the tenth percentile range throughout the month of April. However, rate of decline was variable. Notably, the decline paused, and extent even slightly increased between April 14 and April 19 (Figure 2a). This was largely because of an increase in sea ice in the northern Barents Sea, particularly off the northwest coast of Novaya Zemlya.
This temporary ice expansion appears to have been primarily driven by low sea level pressure centered over the Laptev Sea (Figure 2b). This led to winds from the north in the northern Barents Sea, pushing ice southward. The sea level pressure pattern for the full month featured low pressure centered in the Barents Sea, north of the Scandinavian coast (Figure 2c); bringing warm winds from the south and above average monthly temperatures in the region. Elsewhere in the Arctic, conditions were more moderate with 925 mb temperatures 1 to 3 degrees Celsius (2 to 5 degrees Fahrenheit) above average and weak high pressure (Figure 2d).
April 2021 compared to previous years
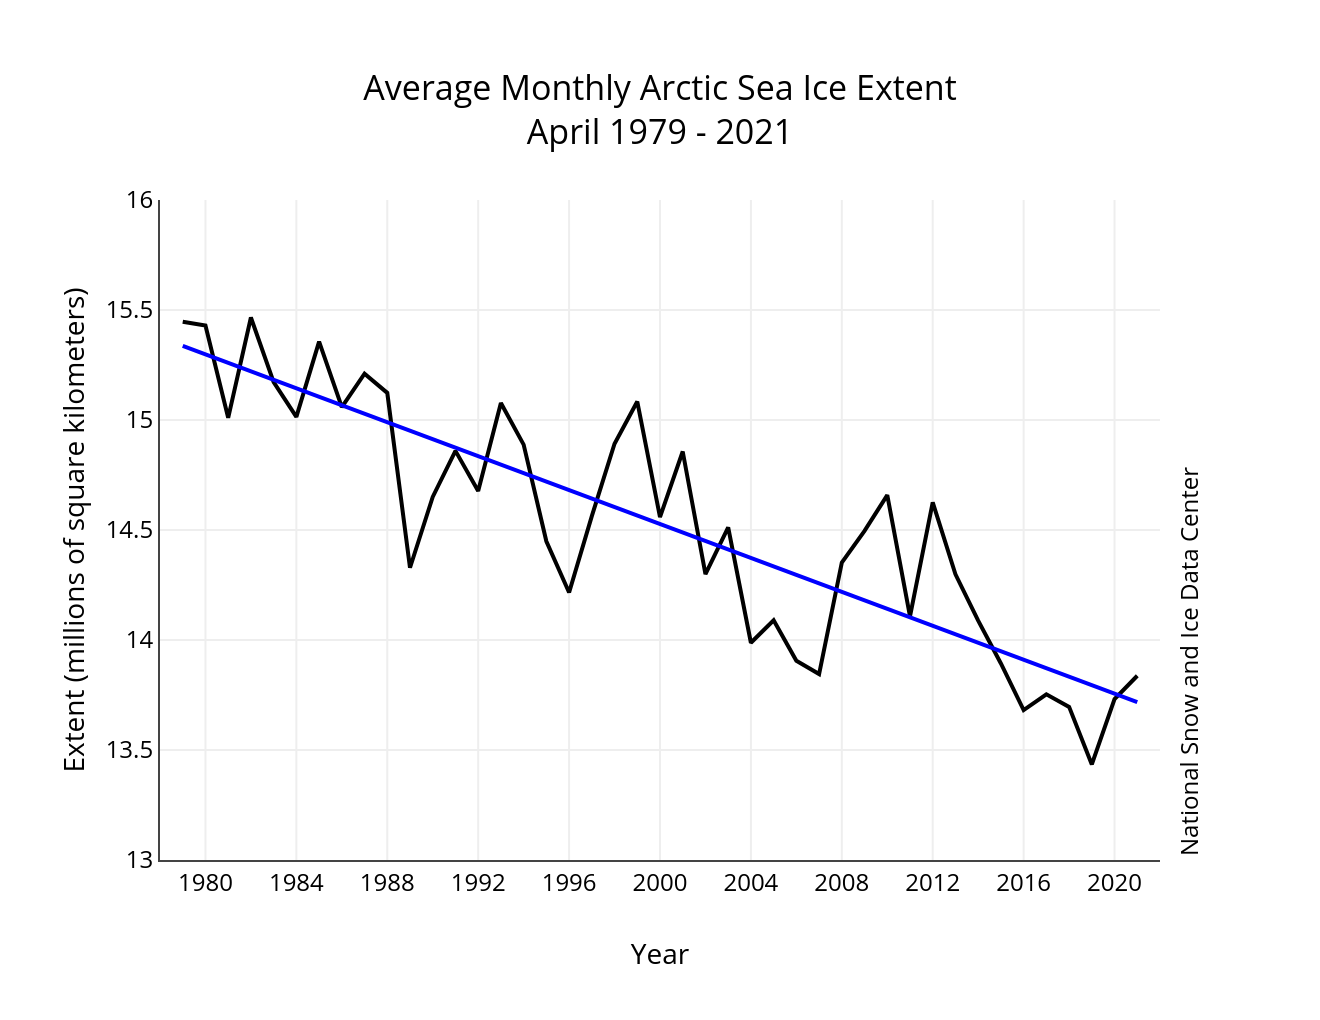
Figure 3. Monthly April ice extent for 1979 to 2021 shows a decline of 2.6 percent per decade.
Credit: National Snow and Ice Data Center
High-resolution image
Through 2021, the linear rate of decline for April sea ice extent, relative to the 1981 to 2010 average extent, is 2.6 percent per decade (Figure 3). This corresponds to 38,600 square kilometers (14,900 square miles) per year, about the size of the US states of New Hampshire and Connecticut combined. The cumulative April ice loss over the 43-year satellite record is 1.62 million square kilometers (625,000 square miles), based on the difference in linear trend values in 2021 and 1979, which is equivalent in size to 2.3 times the size of the state of Texas.
Sea ice age update
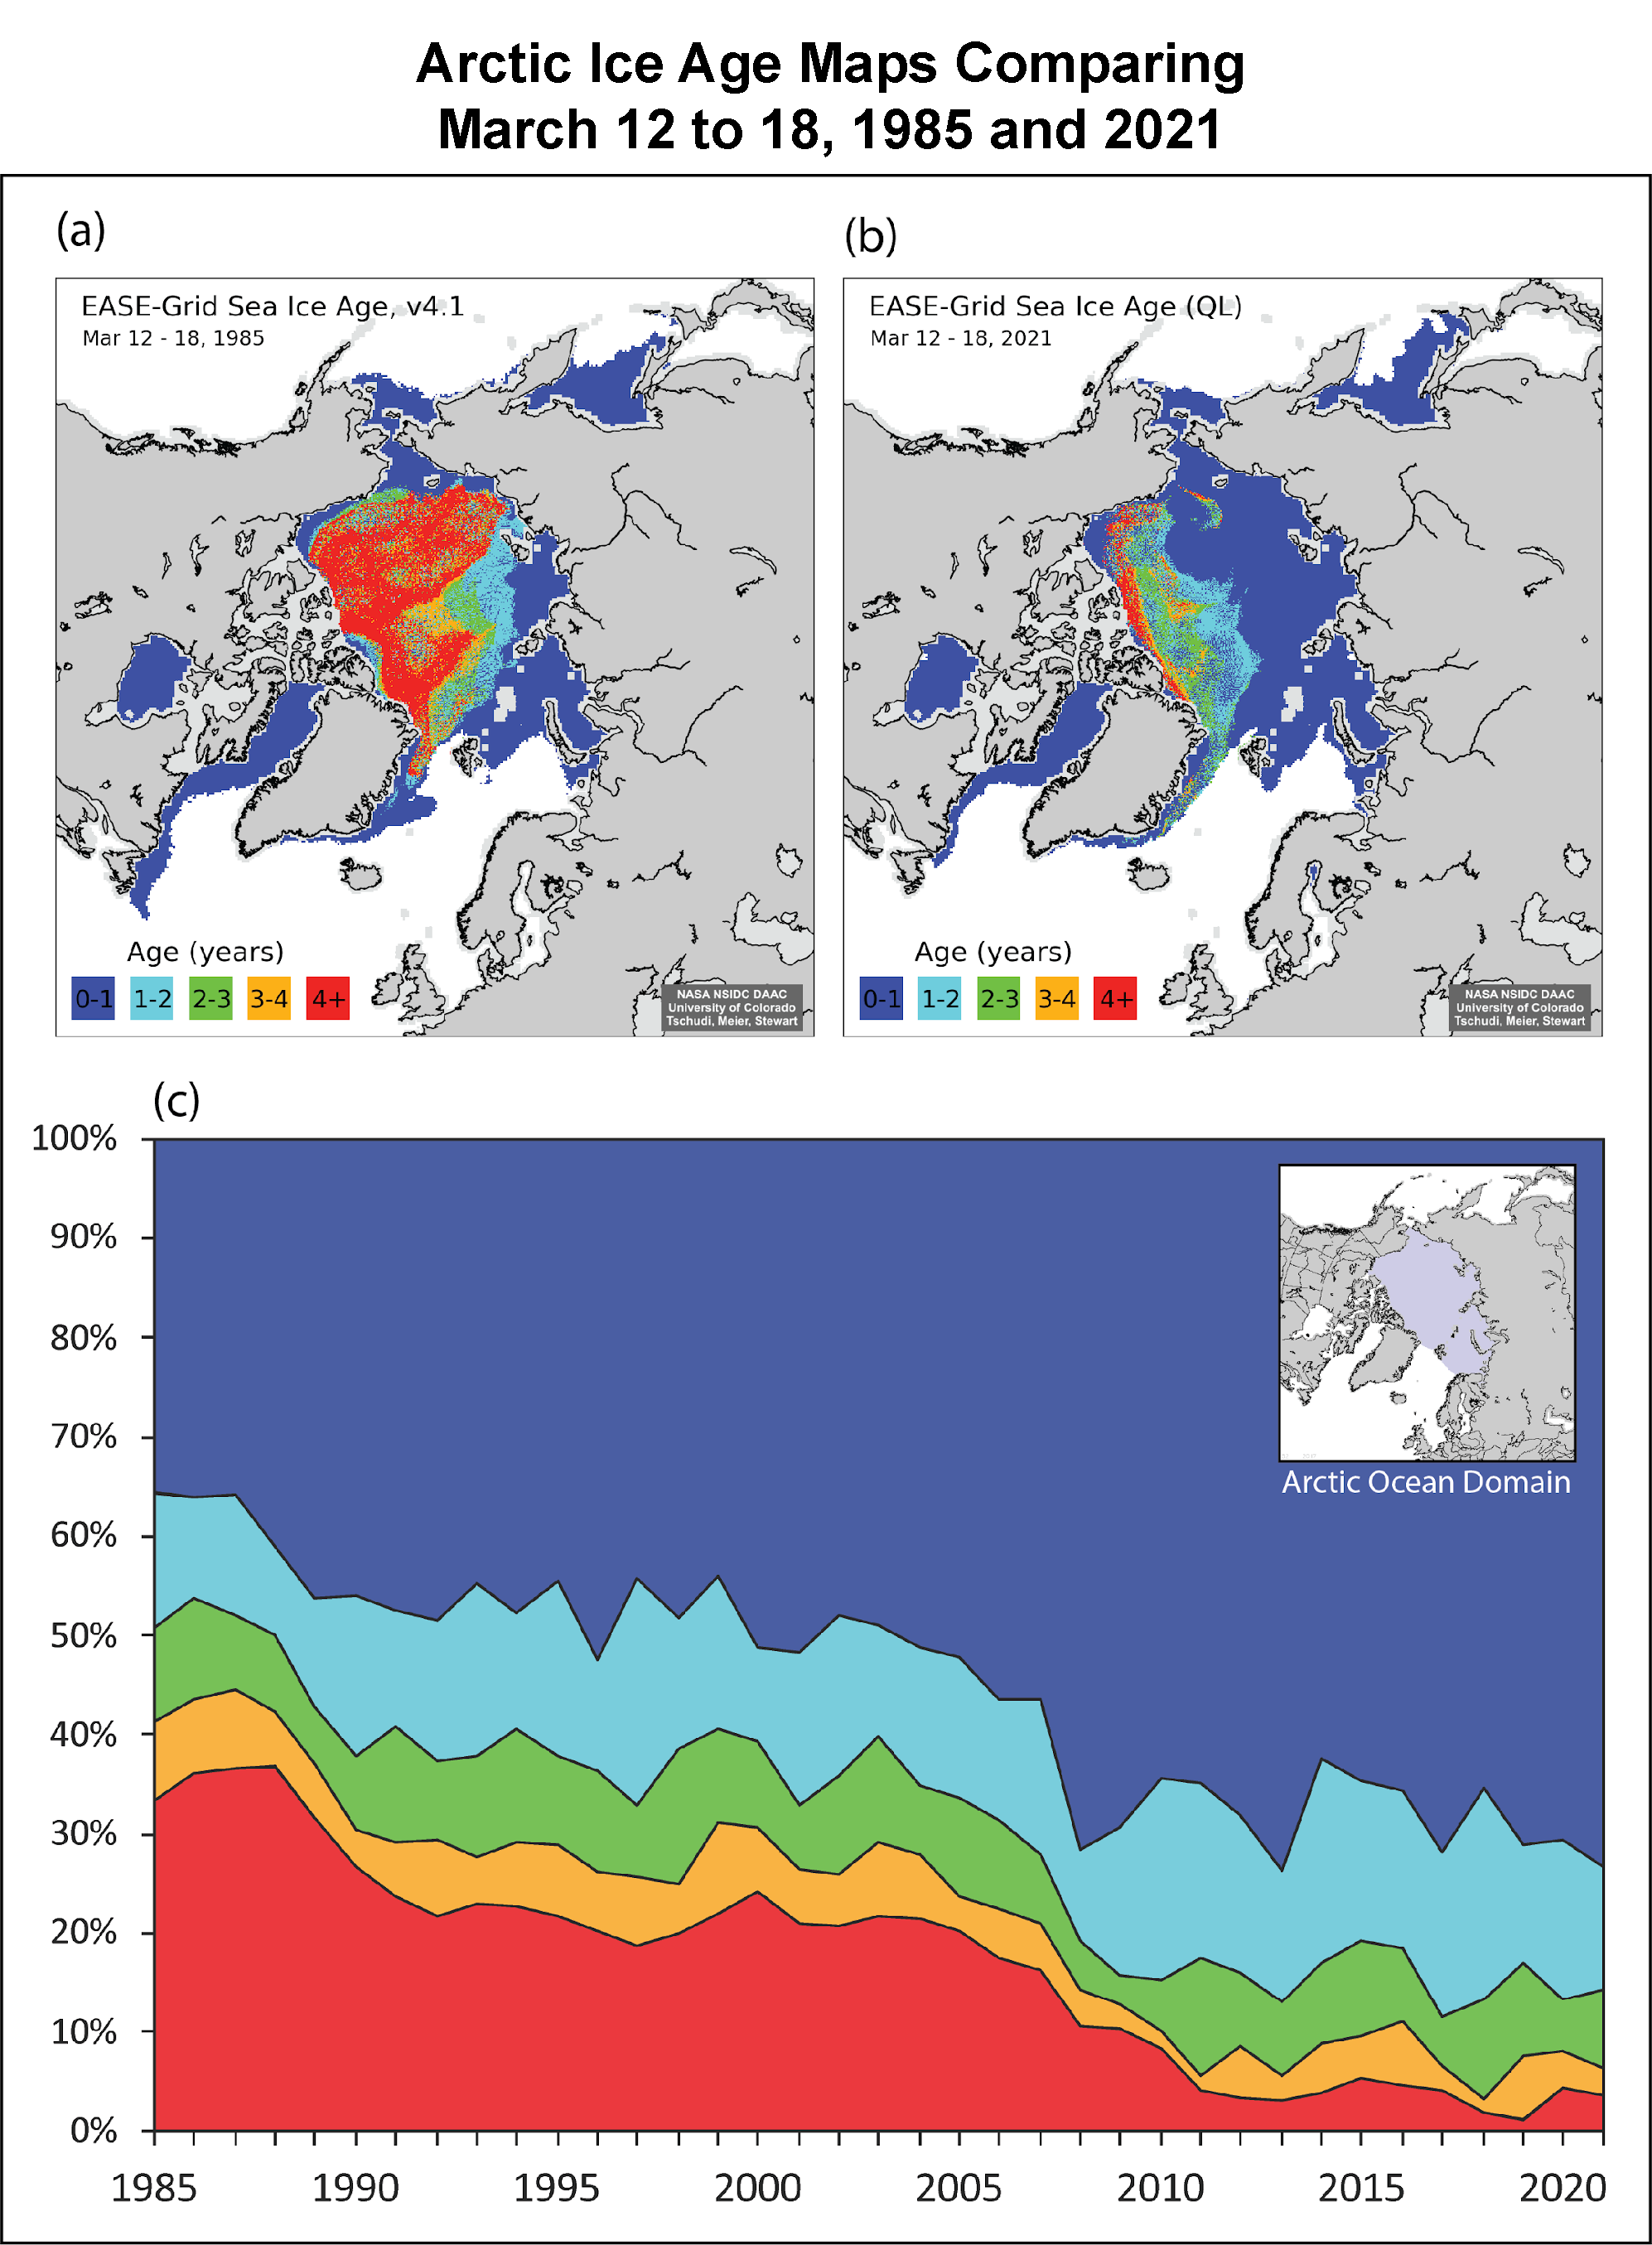
Figure 4. This figure compares sea ice age between March 12 to 18 for the years 1985 (a) and 2021 (b). The bottom graph (c) shows a time series from 1985 to 2021 of percent ice coverage of the Arctic Ocean domain. The Arctic Ocean domain is depicted in the inset map with purple shading.
Credit: M. Tschudi, University of Colorado, and W. Meier and J.S. Stewart, National Snow and Ice Data Center/Image by W. Meier
High-resolution image
The sea ice continues to be far younger, and thus thinner, than in the 1980s. There is little change in the age distribution from last year. At the end of the ice growth season in mid-March, 73.3 percent of the Arctic Ocean domain was covered by first-year ice, while 3.5 percent was covered by ice 4+ years old. This compares to 70.6 percent and 4.4 percent respectively in March 2020. In March 1985, near the beginning of the ice age record, the Arctic Ocean region was comprised of nearly equal amounts of first-year ice (39.3 percent) and 4+ year-old ice (30.6 percent).
In 2021, the extremely high sea level pressure in February over the central Arctic Ocean produced a strong Beaufort Gyre sea ice circulation, as noted in our March post. This pushed a substantial amount of ice, including older ice, onto the northern Alaskan and Canadian coast in the Beaufort Sea. Some of this ice has now moved north and west into the Chukchi Sea–an isolated patch of older ice amidst first-year ice. This will bear watching through the summer to see the fate of that older ice.
Antarctica
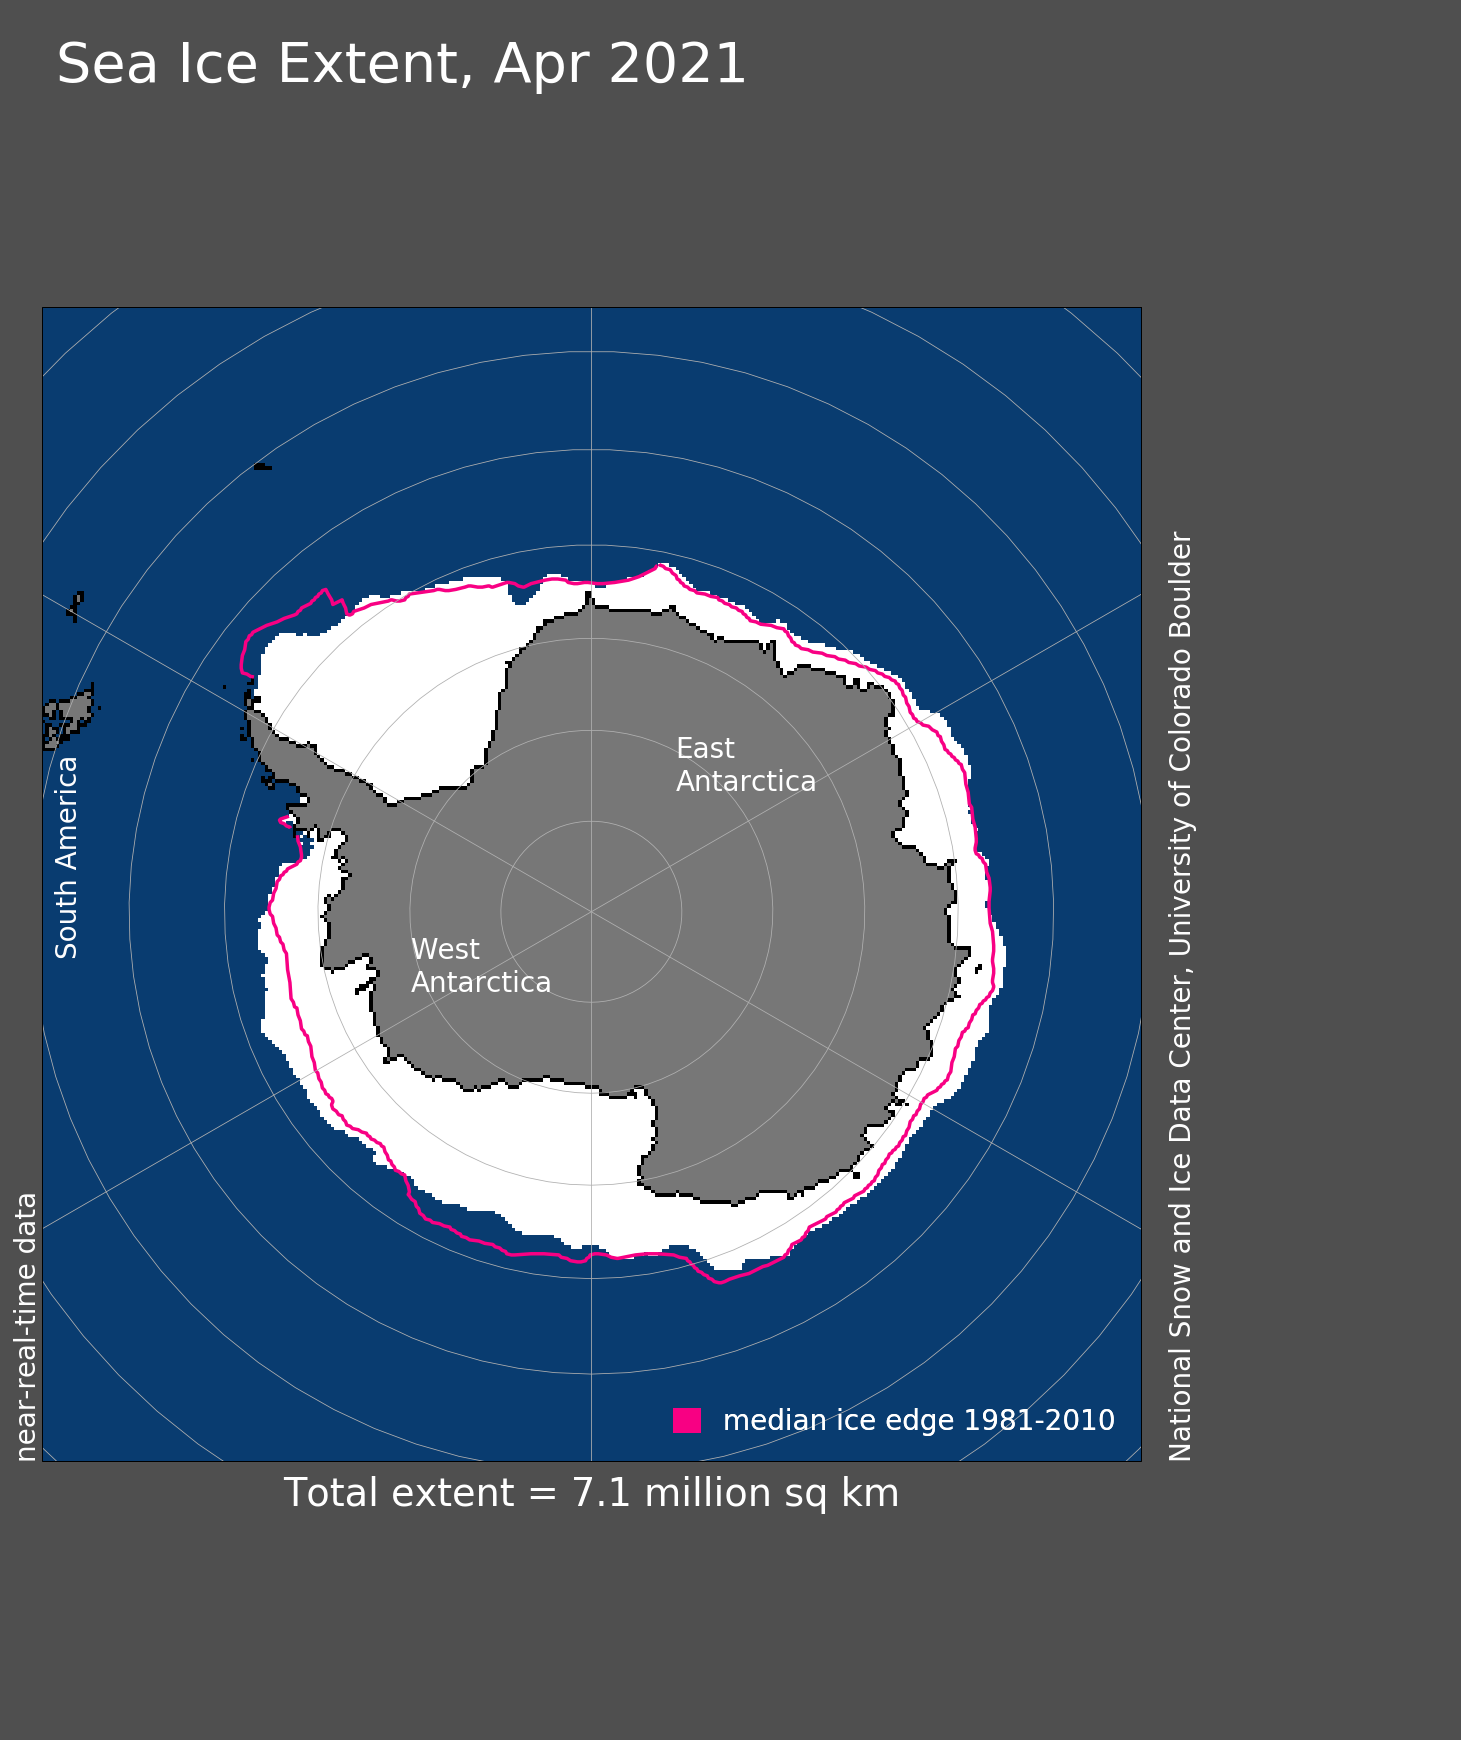
Figure 5: Antarctic sea ice extent for April 2021 was 7.08 million square kilometers (2.73million square miles). The magenta line shows the 1981 to 2010 average extent for that month. Sea Ice Index data. About the data
Credit: National Snow and Ice Data Center
High-resolution image
In the Antarctic, autumn is now in full swing, but ice growth has been somewhat sluggish through the month. At the beginning of the month, extent was between the seventy-fifth and ninetieth percentile range of the 1981 to 2010 climatology. By the end of the month, extent was within the inner quartile range and just above the median.
Antarctic extent for April 2021 was 7.08 million square kilometers (2.73 million square miles), 230,000 square kilometers (88,800 square miles) above the 1981 to 2010 average (Figure 5). Extent was low in the northwestern Weddell Sea region and northern Ross Sea, and both areas had temperatures 3 to 8 degrees Celsius (5 to 14 degrees Fahrenheit) above the reference period. Sea ice extent was generally above average elsewhere, particularly in the Amundsen Sea, where rather cool conditions prevailed for April, at 1 to 3 degrees Celsius (2 to 5 degrees Fahrenheit) below average.
Seasonal predictability of Arctic sea ice from ocean heat transport
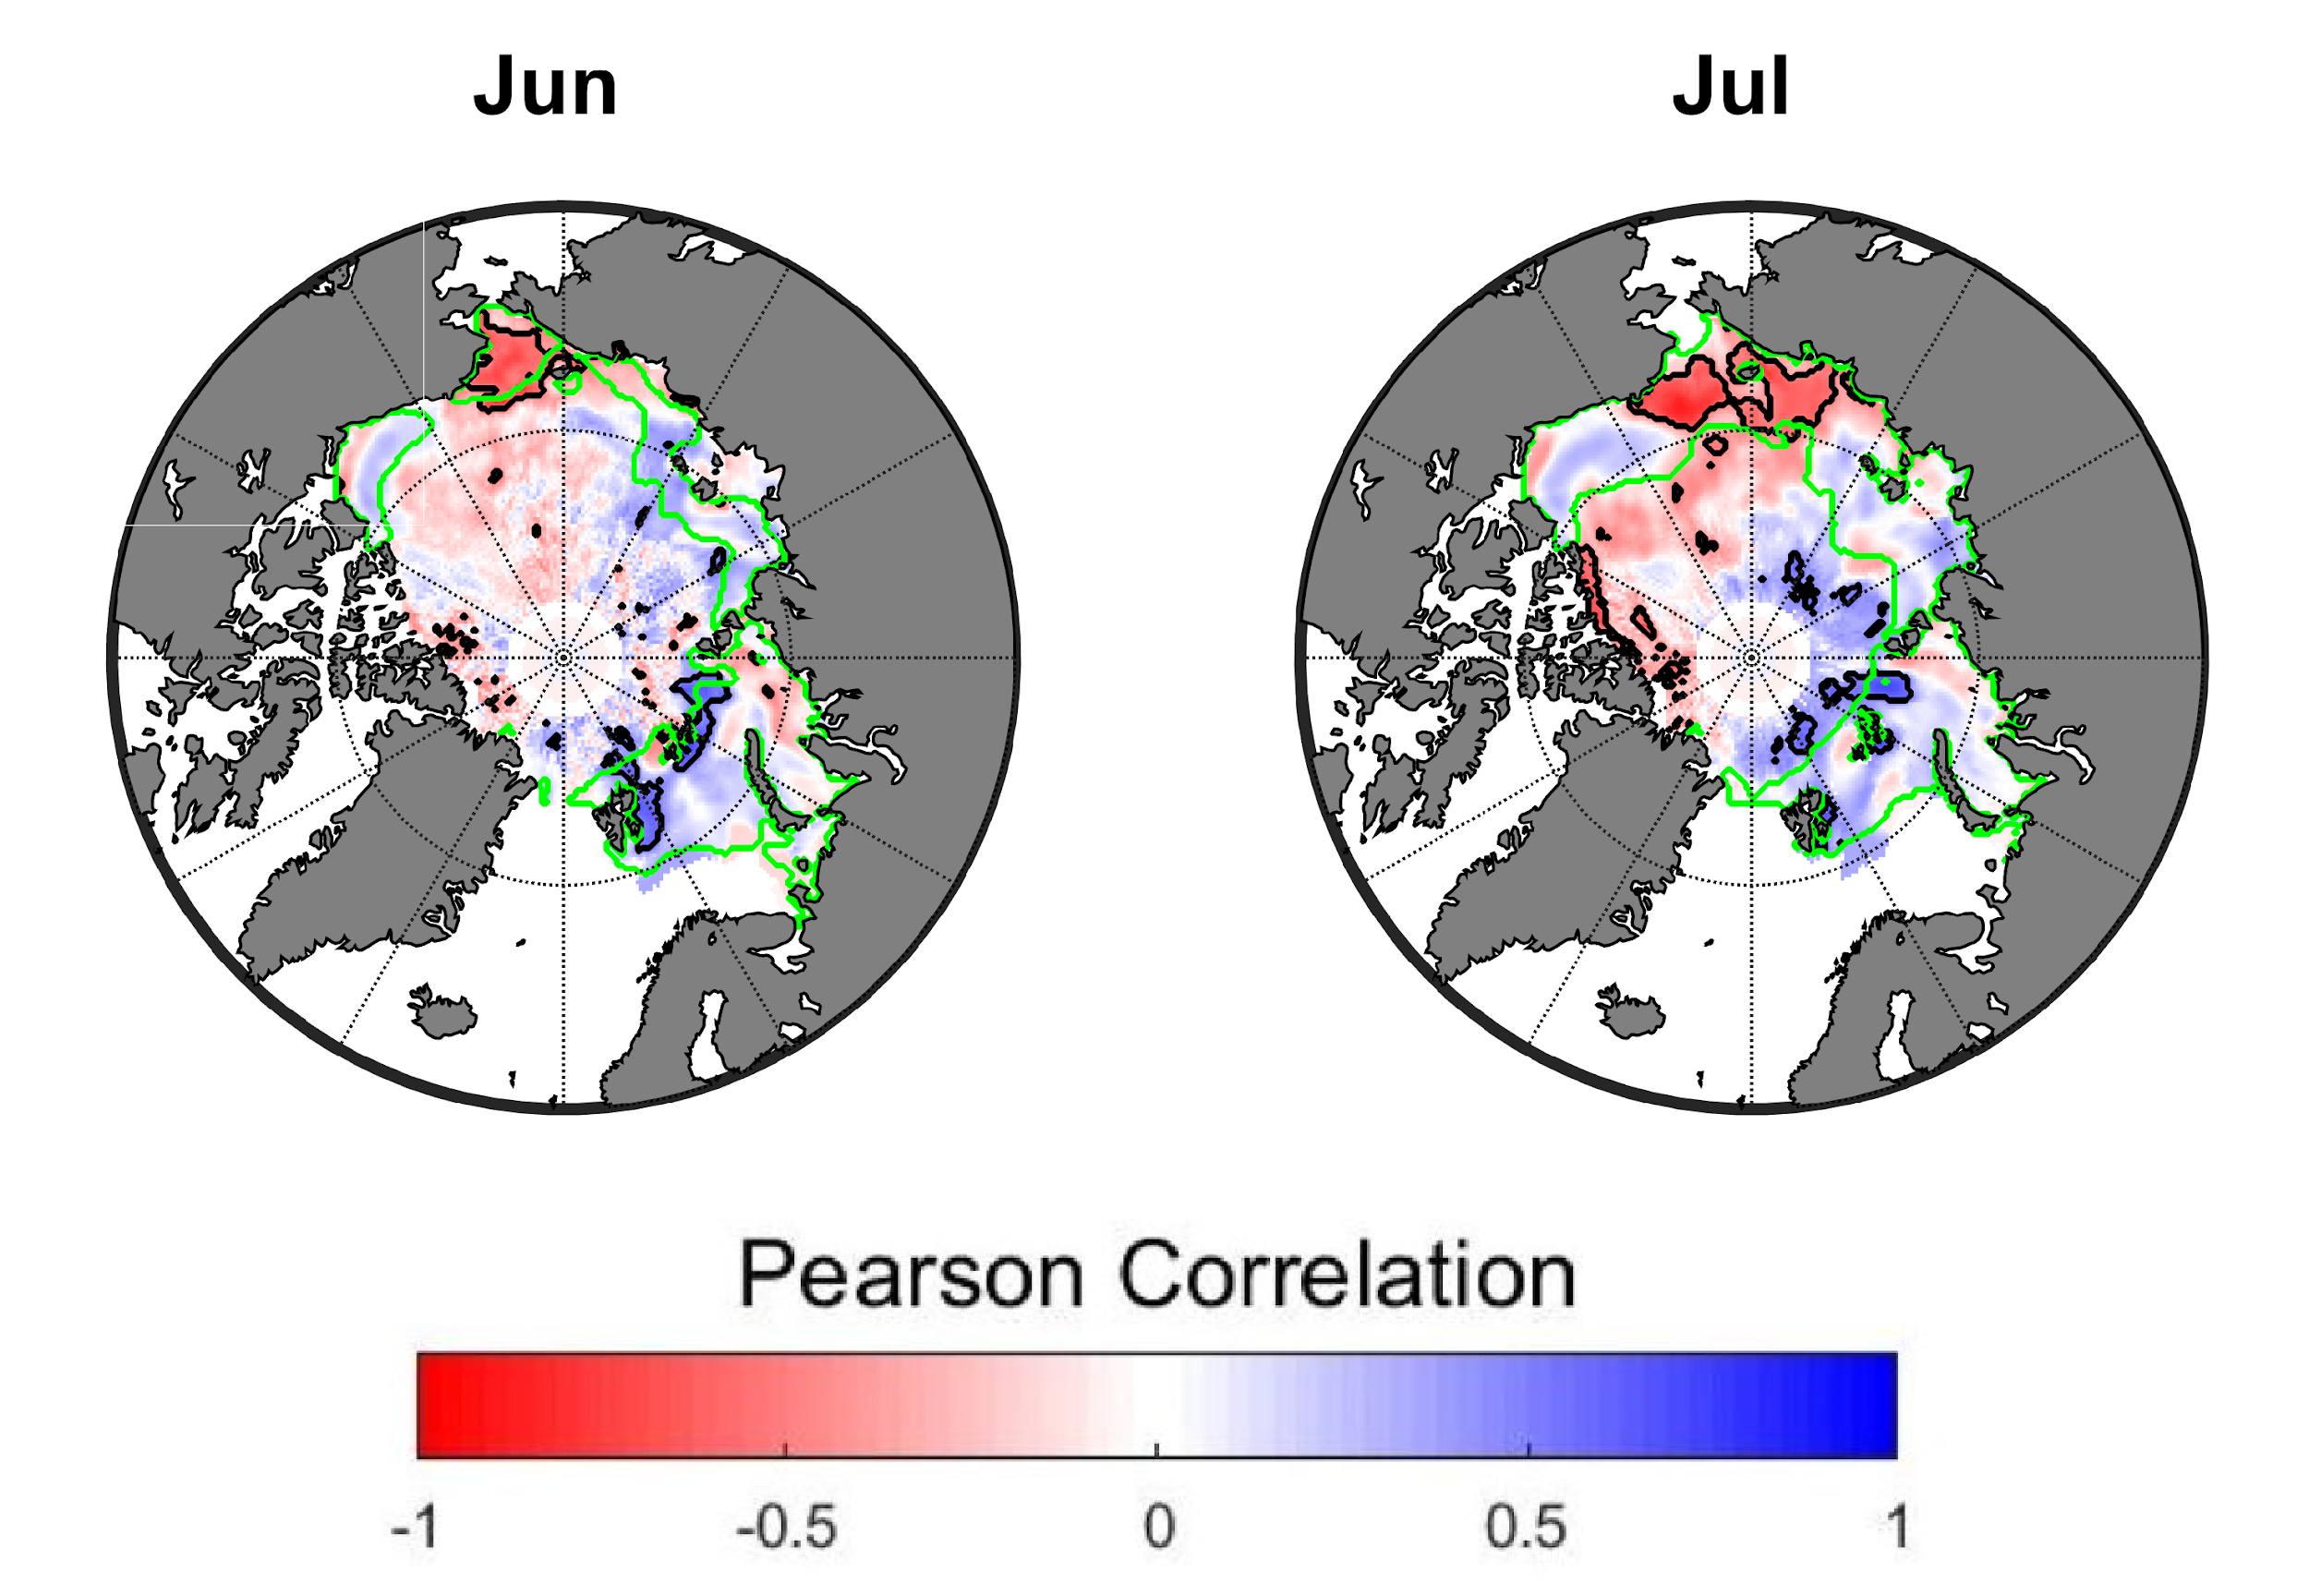
Figure 6. This figure shows correlations between ocean heat transport through the Bering strait and sea ice concentration in the Arctic Ocean. Heat transport anomalies in May are compared to June (left) and July (right) sea ice concentration anomalies. Red areas show regions of the Arctic Ocean where Pacific Ocean heat has the strongest influence on sea ice conditions. Significant correlations at the 95 percent significance level are outlined in black. Regions where the interannual variability in monthly sea ice concentration is larger than 10 percent are outlined in green. An anomaly refers to the deviation of ocean heat transports and sea ice concentrations from their linear trends.
Credit: image adapted from Lenetsky et al. (2021).
High-resolution image
As the Arctic summer nears, the Sea Ice Prediction Network team, which includes NSIDC scientists, is gearing up for another year of the Sea Ice Outlook. Participants in the Outlook and other researchers are investigating ways to better understand and improve seasonal predictability of Arctic September sea ice extent. One factor in sea ice predictability is ocean heat.
A recent study led by University of Colorado master’s student Jed Lenetsky, in collaboration with researchers at McGill University and the Massachusetts Institute of Technology, examined the influence of Pacific Ocean heat on sea ice conditions. Results show that Pacific Ocean heat entering the Arctic Ocean through the Bering Strait has the largest influence on sea ice conditions in the spring and early summer in the Chukchi Sea, fostering early opening of the pack ice and triggering the ice-albedo feedback (Figure 6). From August through October, the summer stratification of the Chukchi Sea reduces the influence of Pacific Ocean heat on sea ice conditions. At the same time, other processes, such as ocean heat uptake and wind-induced sea ice drift, become the dominant drivers of sea ice variability in the region. The influence of the Bering Strait heat transport re-emerges in November as a factor in the timing of freeze onset. These results have important implications for seasonal sea ice prediction in the Chukchi Sea, as predictions using Pacific Ocean heat are more skillful than predictions using more commonly used parameters such as sea ice concentration and sea ice thickness.
Further reading
Lenetsky, J. E., B. Tremblay, C. Brunette, and G. Meneghello. 2021. Subseasonal predictability of Arctic Ocean sea ice conditions: Bering Strait and Ekman-driven ocean heat transport. J. Climate. doi:10.1175/JCLI-D-20-0544.1.

