In the first week of September, sea ice extent took a sharp downward turn, exceeding the pace of decline for any previous year during that period, and placing the 2020 sea ice minimum firmly as second lowest—after 2012—in the 42-year continuous satellite record. Pulses of warm air from north-central Siberia are responsible for the late downward trend. Sea ice decline has slowed in the past few days, and the annual minimum is imminent.
Overview of conditions
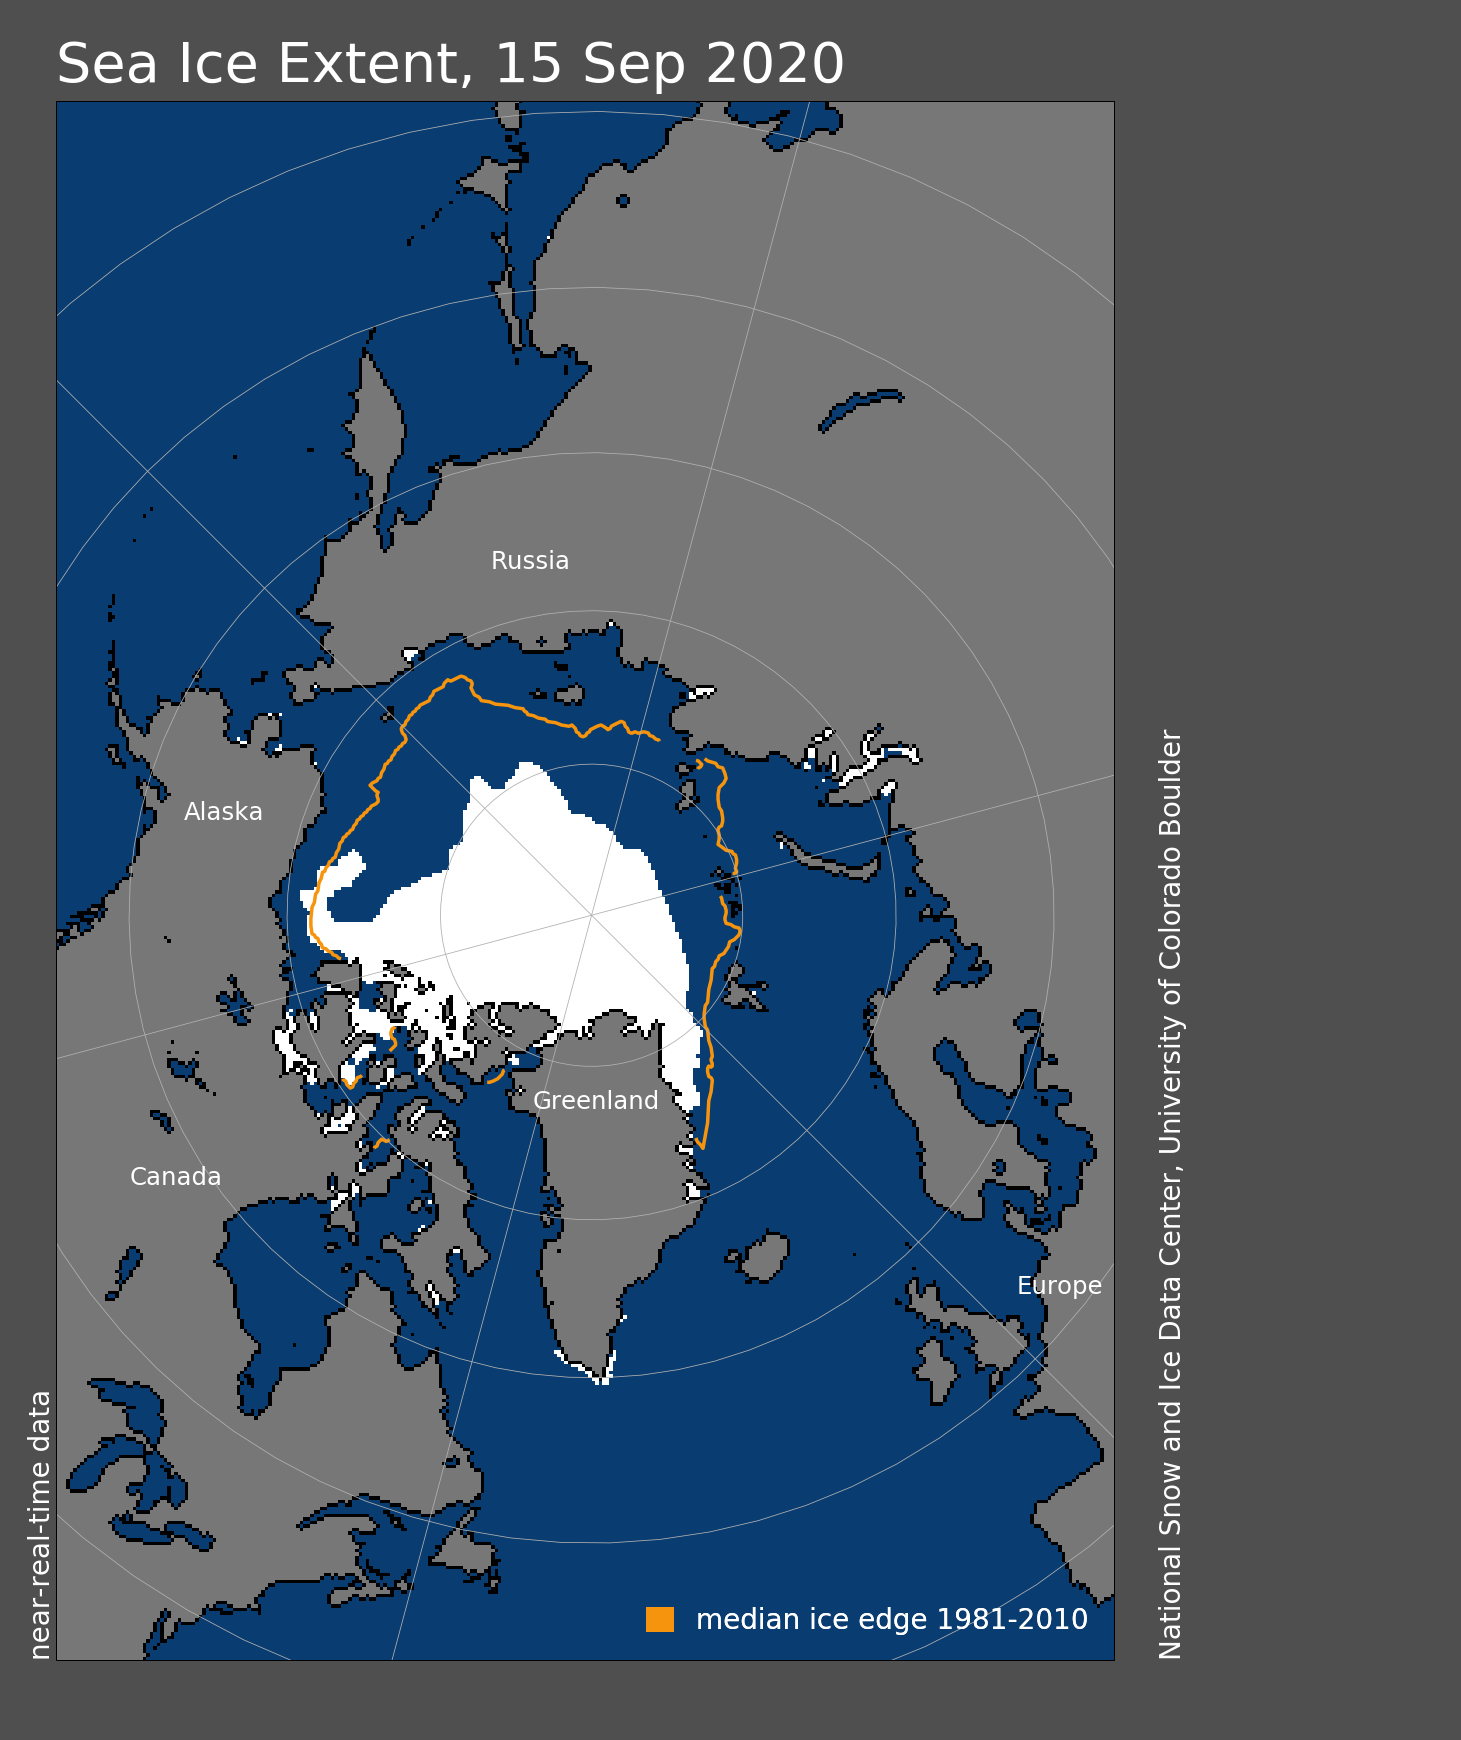
Figure 1a. Arctic sea ice extent for September 15, 2020 was 3.74 million square kilometers (1.44 million square miles). The orange line shows the 1981 to 2010 average extent for that day. Sea Ice Index data. About the data
Credit: National Snow and Ice Data Center
High-resolution image
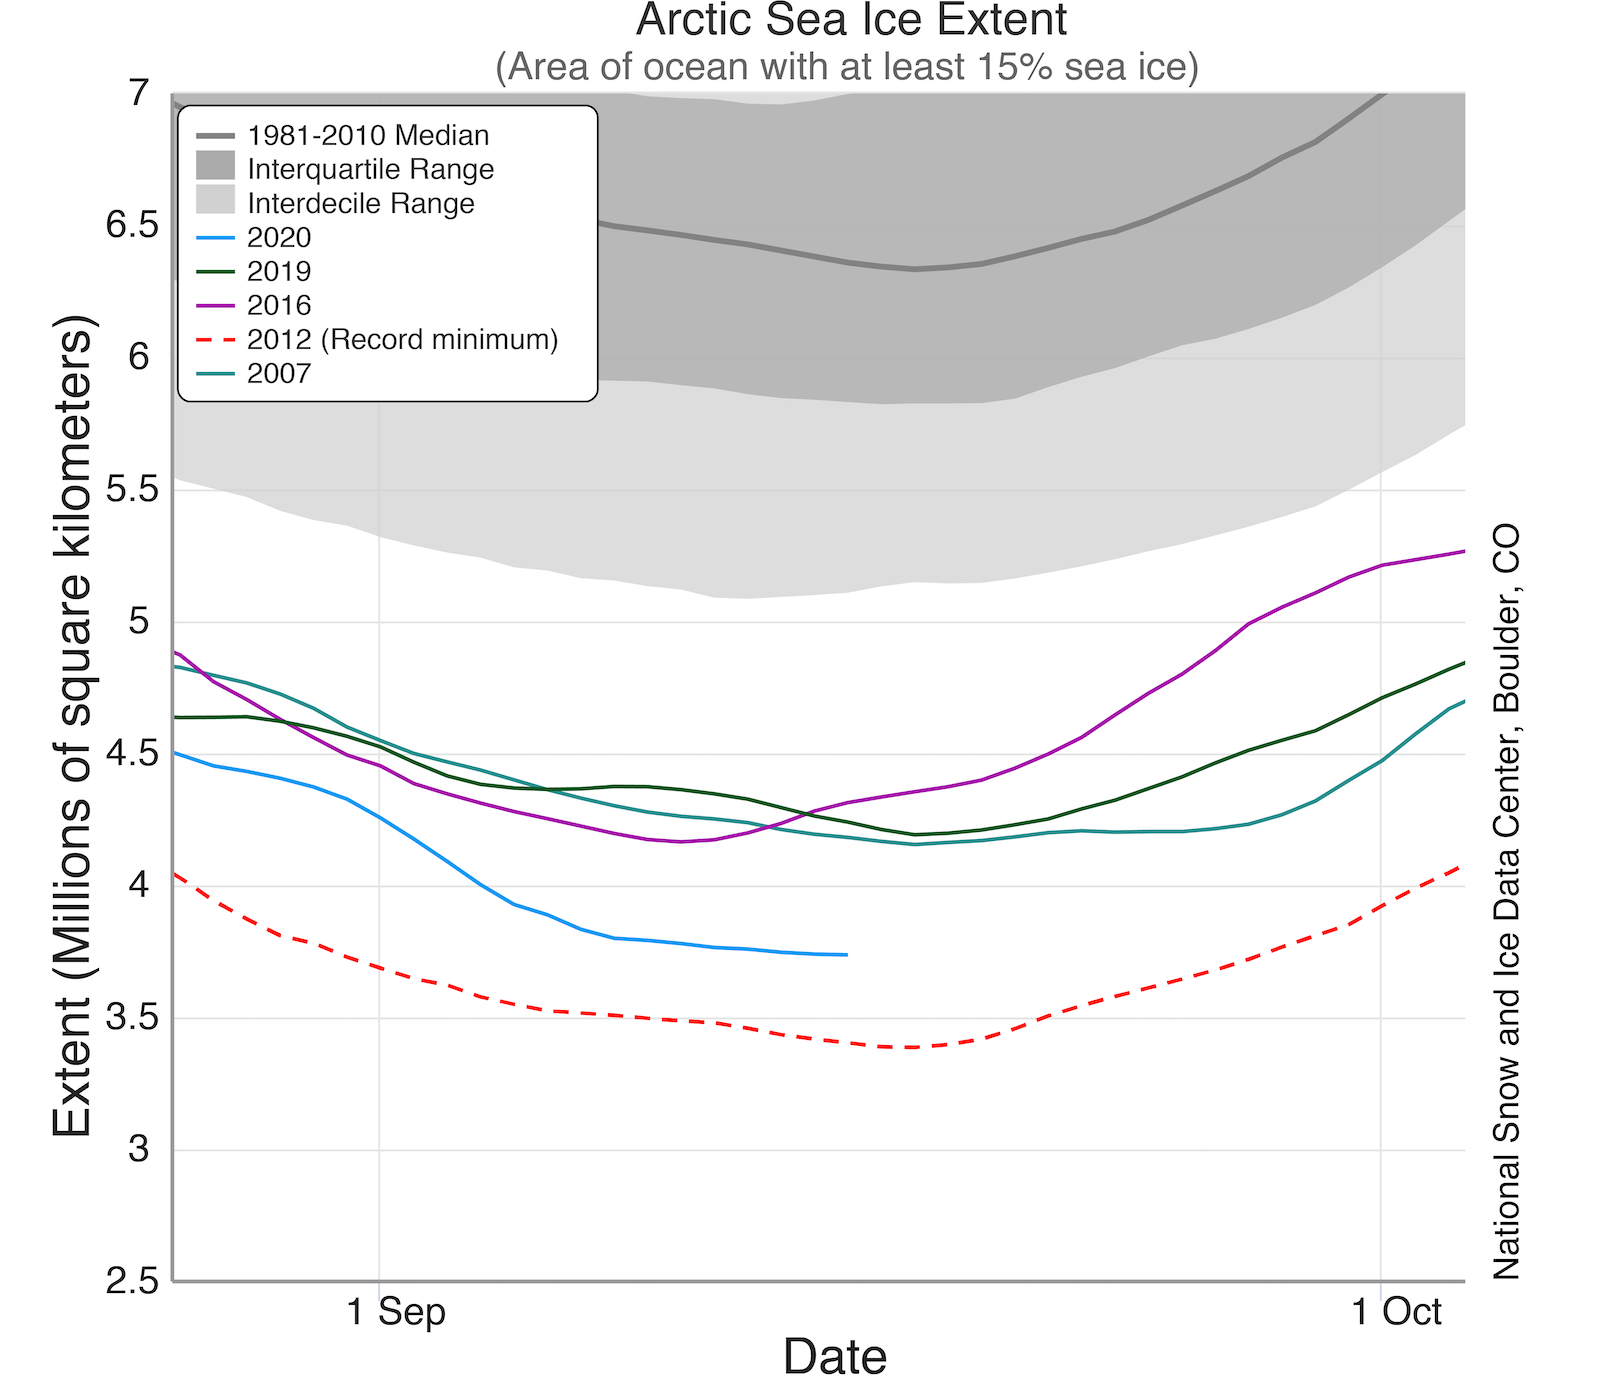
Figure 1b. The graph above shows Arctic sea ice extent as of September 15, 2020, along with daily extent data for several low sea ice extent years and the record low year. 2020 is shown in blue, 2019 in dark green, 2018 in purple, 2007 in light green, and 2012 in dashed red. The 1981 to 2010 median is in dark gray. The gray areas around the median line show the interquartile and interdecile ranges of the data. Sea Ice Index Data
Credit: National Snow and Ice Data Center
High-resolution image
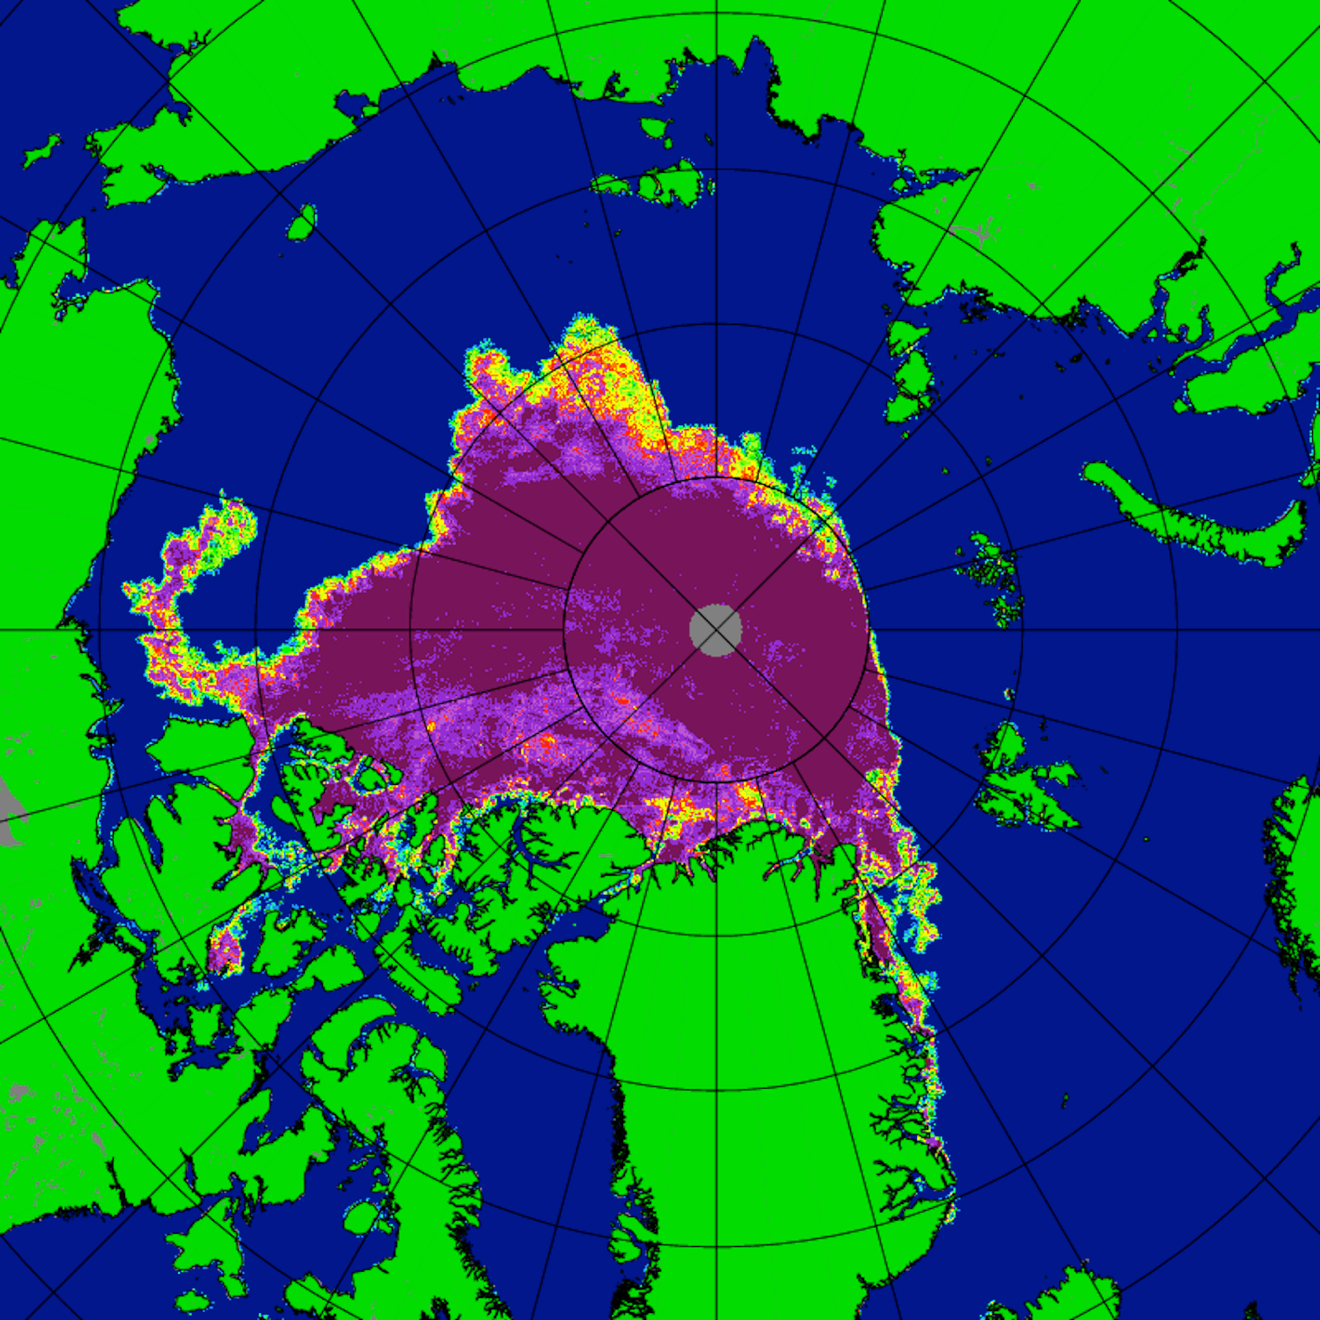
Figure 1c. This map shows sea ice concentration for Arctic sea ice on September 12, 2020, using data collected from the Japanese Aerospace Exploration Agency (JAXA) Advanced Microwave Scanning Radiometer 2 (AMSR2).
Credit: University of Bremen
High-resolution image
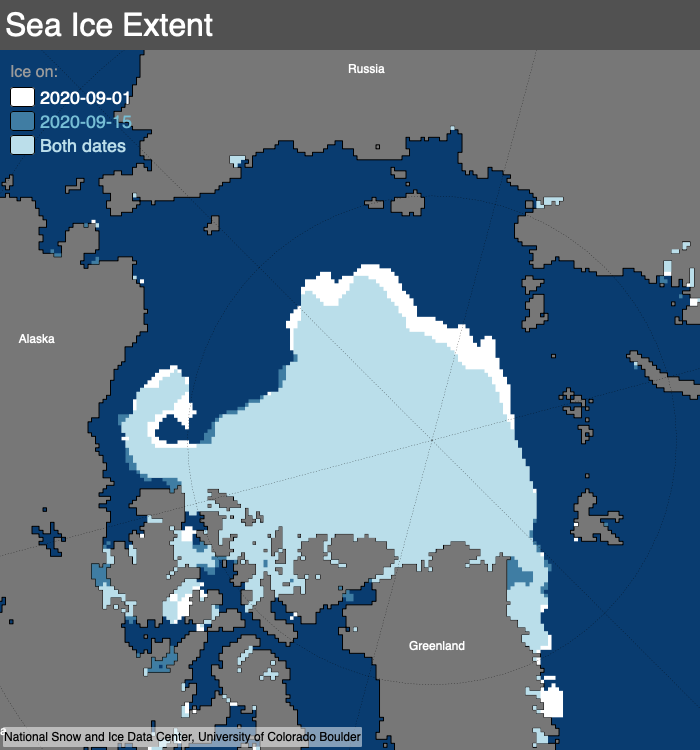
Figure 1d. This figure compares Arctic sea ice extent on September 1, 2020 (in white), and September 14, 2020 (in blue), showing recent areas of retreat.
Credit: National Snow and Ice Data Center
High-resolution image
Sea ice extent stood at 3.74 million square kilometers (1.44 million square miles) on September 15, already well below 2007, 2016, and 2019 and within 400,000 square kilometers (154,400 square miles) of the record low extent set in 2012 (Figure 1a). Sea ice extent has dropped below 4 million square kilometers (1.54 million square miles) only once before, in 2012 (Figure 1b). Between August 31 and September 5, 2020, sea ice extent decreased by an average of 79,800 square kilometers (30,800 square miles) per day. This is a greater loss rate than any other year for these six days in the sea ice record. Ice retreat during this period was along the ice front in the northern Barents, Kara, and Laptev seas. A remaining tail of multiyear ice extends into the southern Beaufort Sea north of the Mackenzie River Delta and the Alaskan North Slope. North of Scandinavia and Russia, a very broad sea-ice-free area exists with the ice edge lying near 85 degrees N, far to the north of Svalbard, Franz Josef Land, and Severnaya Zemlya (Northern Land) (Figure 1c). The sharply defined ice edge in this area, between about 0 degrees and 100 degrees longitude, indicates strong compaction of the ice by winds coming from the south and is the furthest north the ice edge has been in this location over the satellite data record (Figure 1d).
Conditions in context

Figure 2a. This plot shows the departure from average air temperature in the Arctic at the 925 hPa level, in degrees Celsius, from September 1 to 14, 2020. Yellows and reds indicate higher than average temperatures; blues and purples indicate lower than average temperatures.
Credit: NSIDC courtesy NOAA Earth System Research Laboratory Physical Sciences Division
High-resolution image
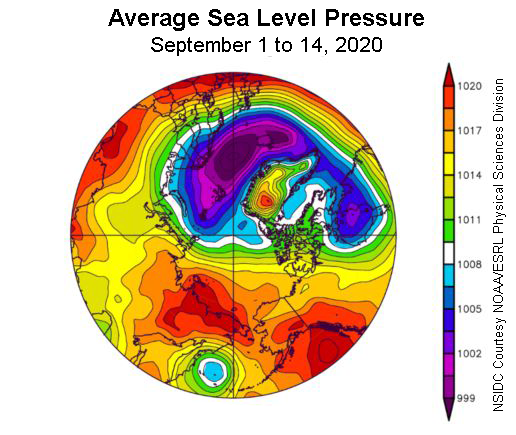
Figure 2b. This plot shows average sea level pressure in the Arctic in millibars (hPa) from September 1 to 14, 2020. Yellows and reds indicate high air pressure; blues and purples indicate low pressure.
Credit: NSIDC courtesy NOAA Earth System Research Laboratory Physical Sciences Division
High-resolution image
As assessed over the first two weeks of September, air temperatures at the 925 mb level (about 2,500 feet above sea level) were above average over much of the Eurasian side of the Arctic Ocean. Air temperatures were up to 6 degrees Celsius (11 degrees Fahrenheit) above the 1981 to 2010 average near the Taymyr Peninsula of north-central Siberia. Temperatures were 1 to 2 degrees Celsius (2 to 4 degrees Fahrenheit) below average in easternmost Siberia and western Alaska, 4 degrees Celsius (7 degrees Fahrenheit) below average in central Canada, and 5 degrees Celsius (9 degrees Fahrenheit) below average in northern Greenland (Figure 2a). The atmospheric circulation over the first two weeks of the month was characterized by generally high pressure in eastern Siberia and low pressure over the Atlantic side of the Arctic, driving winds from the south over much of the Eurasian side of the Arctic Ocean (Figure 2b). The Arctic Oscillation index has cycled between slightly negative and moderately positive values. Pulses of warm air have been observed to migrate across the Arctic Ocean and then break down over a scale of several days.
Late summer sea ice drift and sea surface temperature
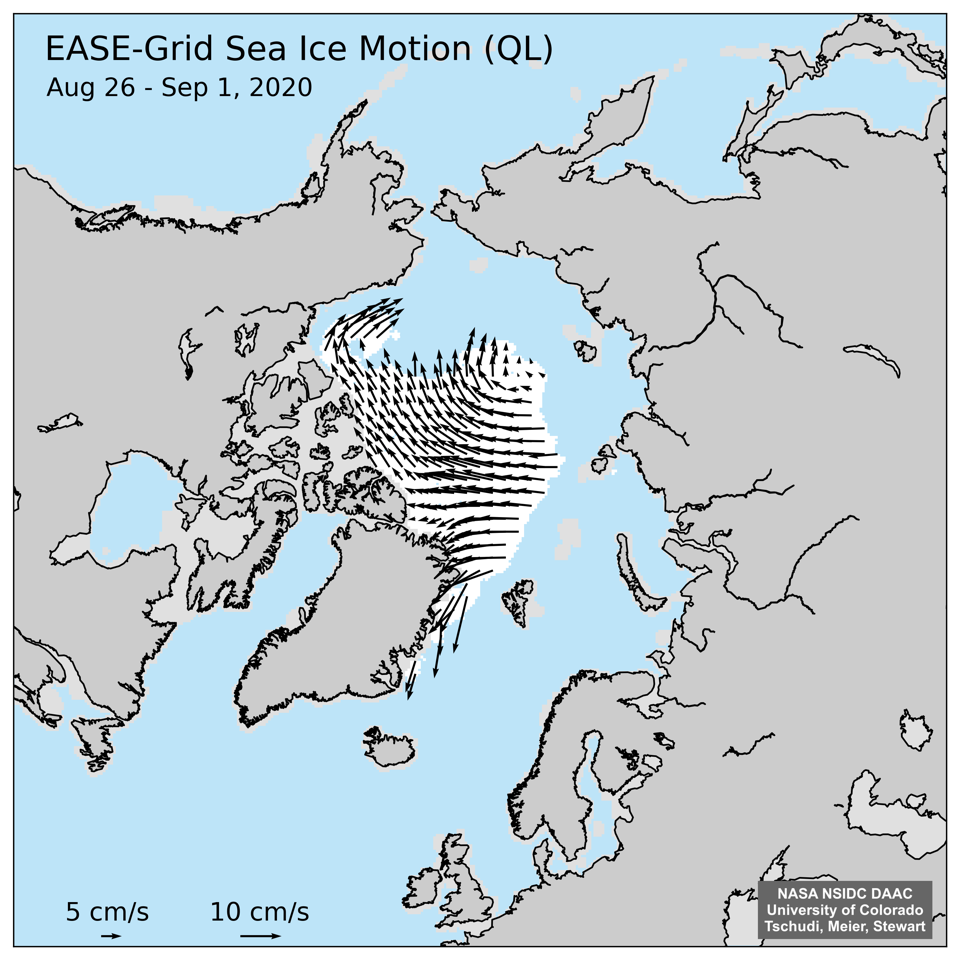
Figure 3a. This figure shows sea ice motion determined from National Snow and Ice Data Center EASE-Grid passive microwave data from August 26 to September 1, 2020.
Credit: National Snow and Ice Data Center
High-resolution image
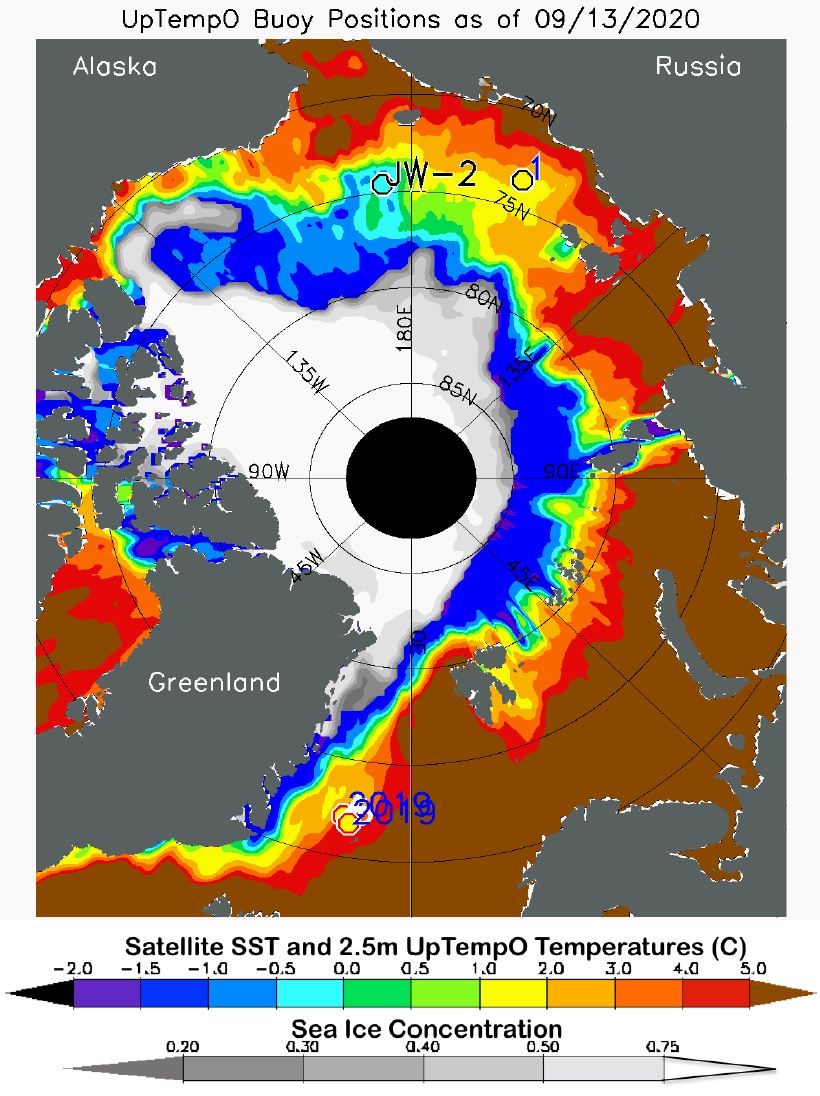
Figure 3b. This map shows sea surface temperature (SST) in degrees Celsius and ice concentration for September 13, 2020. SST data are from the University of Washington Polar Science Center Upper layer Temperature of the Polar Oceans (UptempO) buoys and satellite-derived values from the National Oceanic and Atmospheric Administration (NOAA), and ice concentration is from the NSIDC Sea Ice Index.
Credit: University of Washington
High-resolution image
Ice motion in late August drifted northward along the Eurasian side of the Arctic Ocean, while the multiyear sea ice region north of western Canada and Alaska drifted rapidly westward toward the Chukchi Sea (Figure 3a). Ice motion was determined by tracking patterns in the sea ice using passive microwave and other data. Both the motion and the compaction of the loose sea ice pack are responsible for the strong decline in ice extent seen in this period and the following week. Warm waters in the Chukchi Sea may induce some late melting of the multiyear ice from the heat in the ocean, but much of the water in the region is already near freezing from more recent ice loss (Figure 3b).
Sailing across the top of the world in a “new Arctic” soon
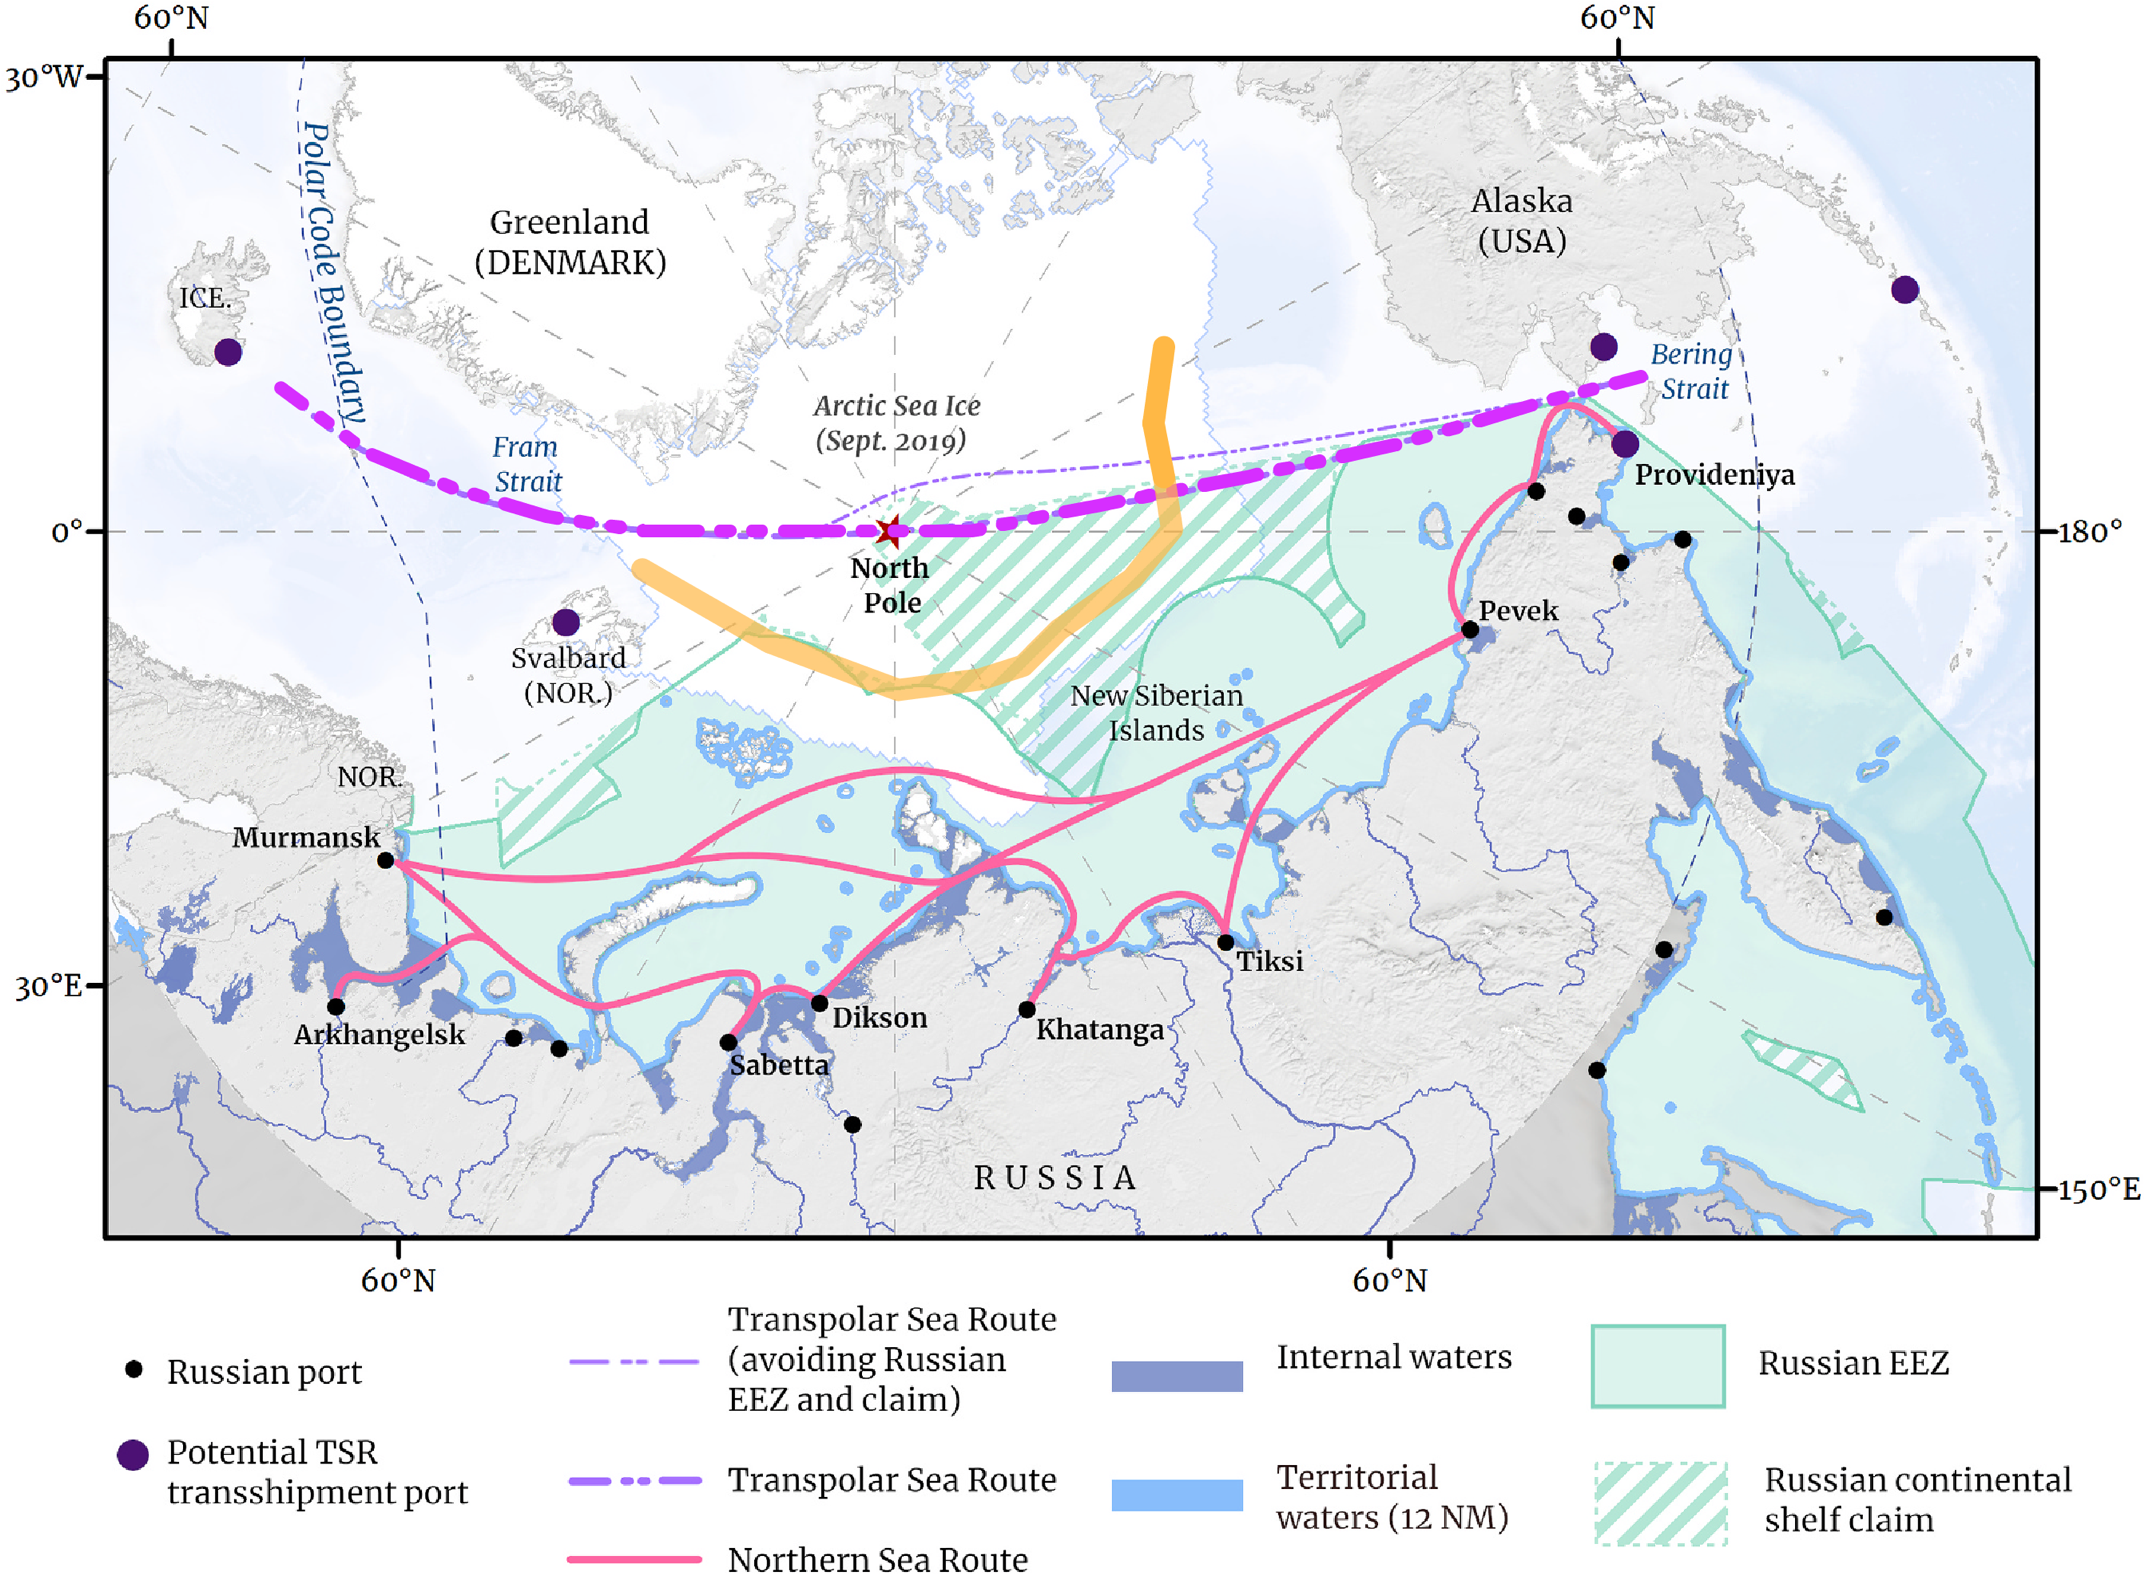
Figure 4. This map shows the potential transpolar shipping route discussed in Bennett et al., 2020. The orange line shows the approximate September 2020 ice edge overlaid on the September 2019 Arctic sea ice extent.
Credit: Bennett et al., 2020
High-resolution image
A recent paper by an international group led by political geographer Mia Bennett at the University of Hong Kong discusses the potential impacts of the near-future emergence of a transpolar shipping route as sea ice retreat continues to open a very wide shipping lane along the Eurasian side of the Arctic Ocean (as it has this year). The route would pass over the North Pole as a way of avoiding an extensive Russian exclusive economic zone (EEZ) and still-contended continental shelf claim.
This emerging transpolar route reflects a fundamentally changed Arctic environment. Another recent paper by researchers Laura Landrum and Marika Holland at the National Center for Atmospheric Research found that the Arctic has indeed entered into a “new Arctic climate” state. This new climate is one characterized by warmer temperatures, more open water, less sea ice, more rain, and less snow. In the Arctic, weather that used to be considered extreme is becoming the norm. The summer of 2020 is clearly representative of this new Arctic.
Further reading
Bennett, M. M. et al. 2020. The opening of the Transpolar Sea Route: Logistical, geopolitical, environmental, and socioeconomic impacts. Marine Policy. doi.10.1016/j.marpol.2020.104178.
Landrum, L., and Holland, M. M. 2020. Extremes become routine in an emerging new Arctic. Nature Climate Change. doi.10.1038/s41558-020-0892-z.

