The seasonal maximum extent of Arctic sea ice has passed, and with the passing of the vernal equinox, the sun has risen at the north pole. While there are plenty of cold days ahead, the long polar night is over. Arctic sea ice extent averaged for March 2021 was the ninth lowest in the satellite record. With little ice in the Gulf of St. Lawrence, harp seal pups are struggling. At month’s end, Antarctic sea ice extent was slightly above average.
Overview of conditions
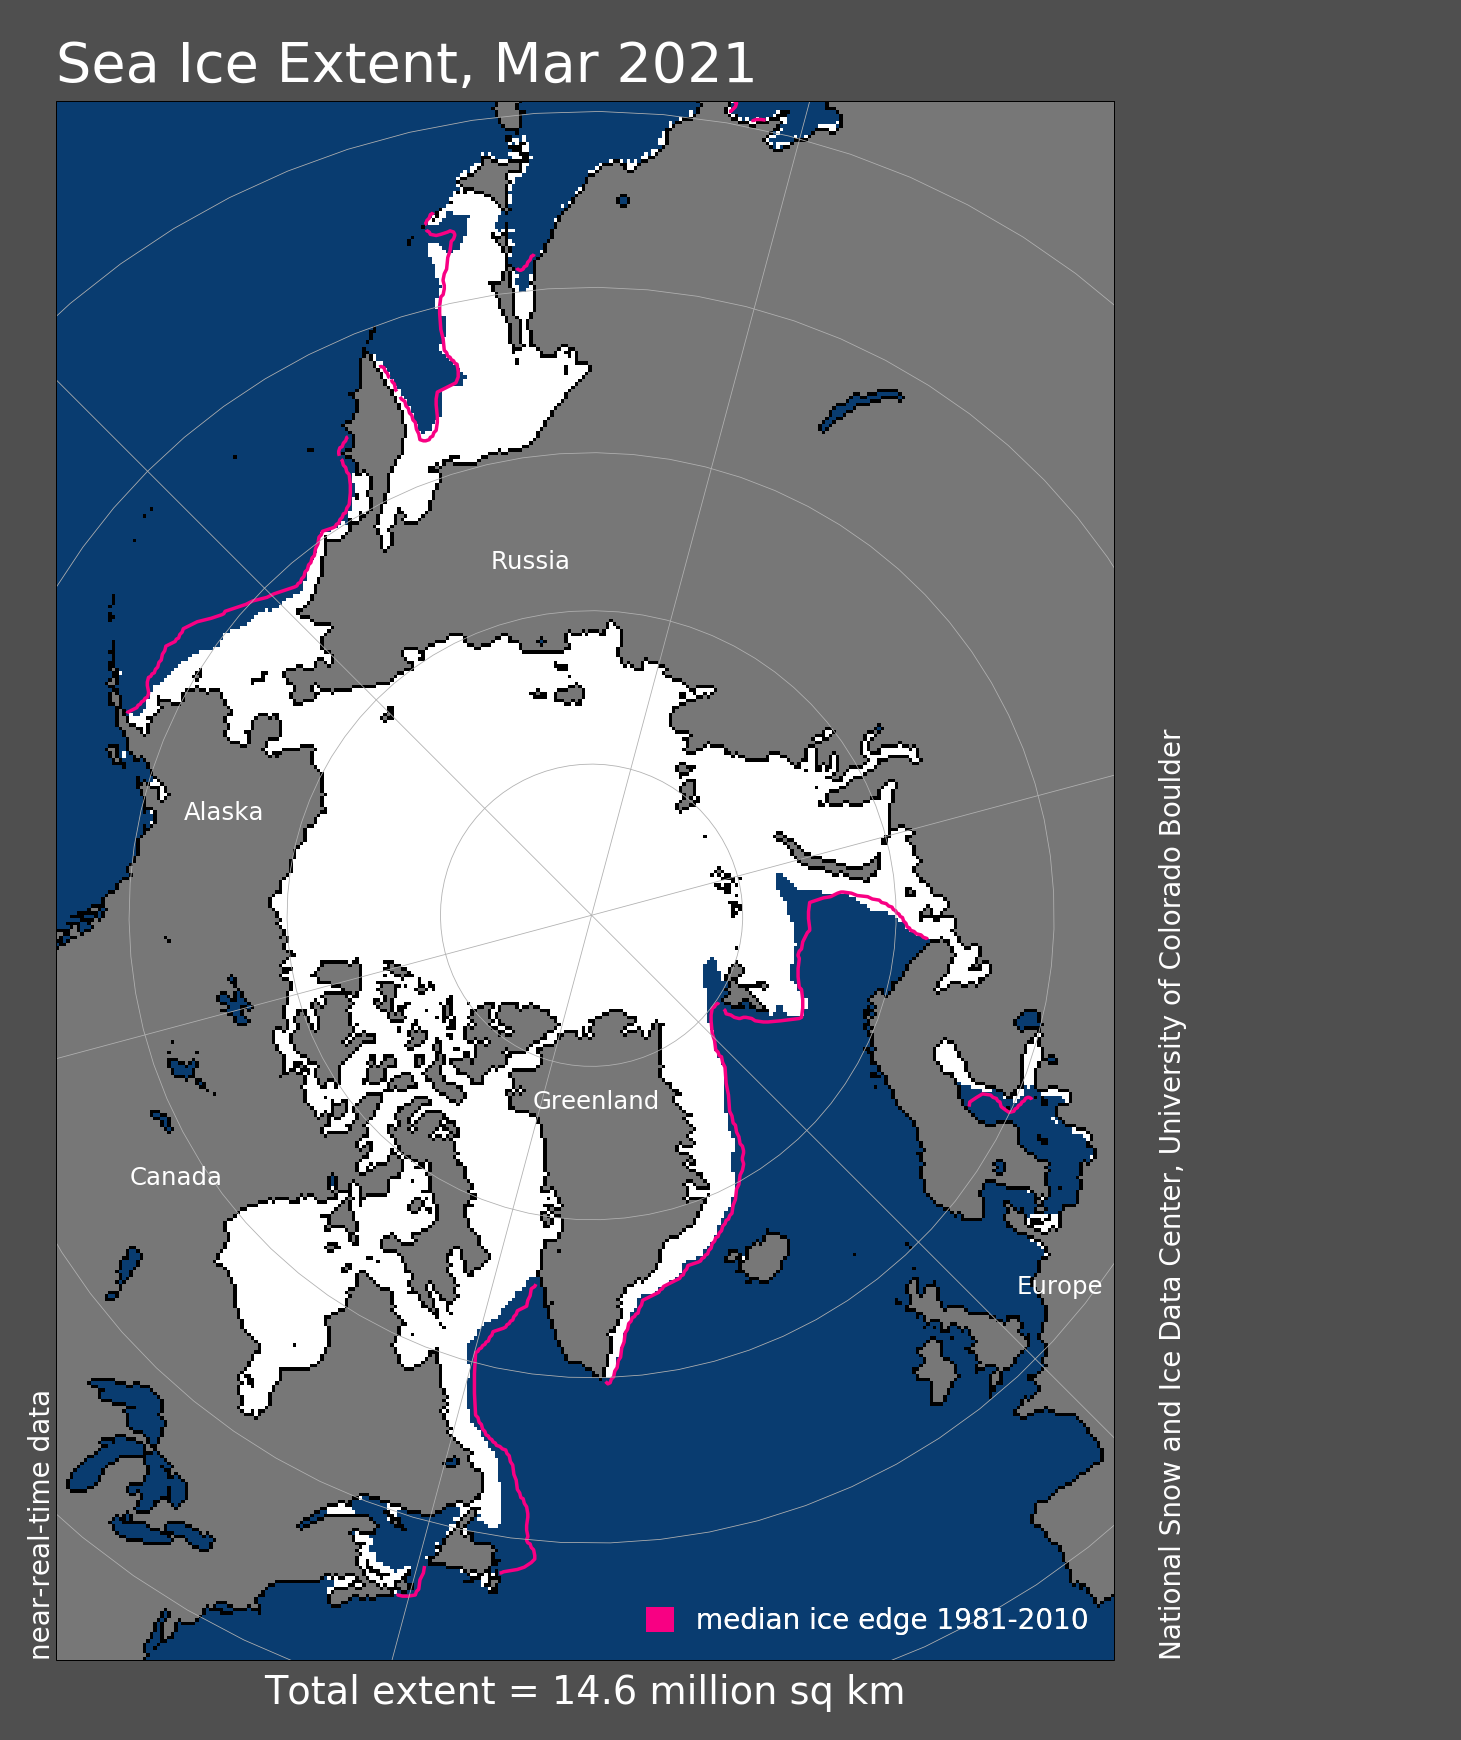
Figure 1. Arctic sea ice extent for March 2021 was 14.64 million square kilometers (5.65 million square miles). The magenta line shows the 1981 to 2010 average extent for that month. Sea Ice Index data. About the data
Credit: National Snow and Ice Data Center
High-resolution image
Arctic sea ice extent averaged for March 2021 was 14.64 million square kilometers (5.65 million square miles). This was 350,000 square kilometers (135,000 square miles) above the record minimum set in 2017 and 790,000 square kilometers (305,000 square miles) below the 1981 to 2010 average. The average extent ranks ninth lowest in the satellite record, which began in 1979. Regionally, extent at the end of the month was below average on the Pacific side in the Bering sea and on the Atlantic side in the northern Barents Sea and well south of the Arctic in the Gulf of St. Lawrence. Elsewhere, extent was close to the average, though generally somewhat lower. Ice loss during March was primarily in the Sea of Okhotsk, the southern edge of the Bering Sea, east of Svalbard, and in the northern part of the East Greenland Sea. The ice edge expanded in the southern part of the East Greenland Sea and to the north of Svalbard.
Conditions in context
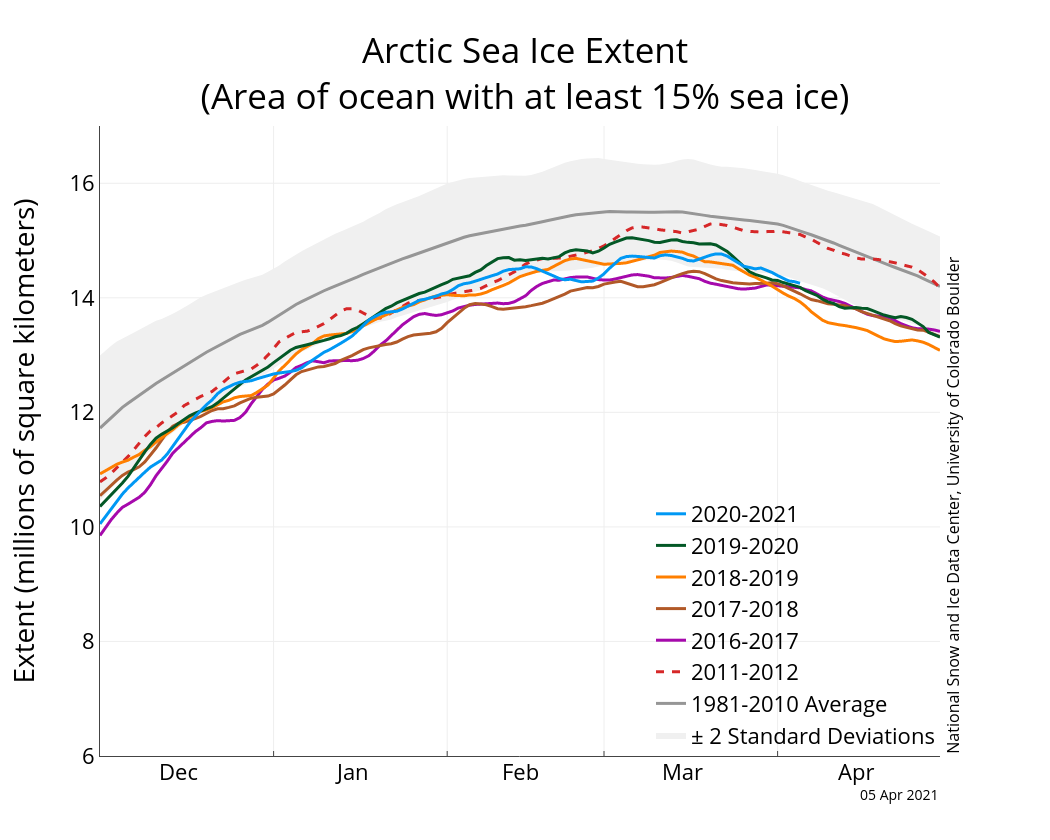
Figure 2a. The graph above shows Arctic sea ice extent as of April 5, 2021, along with daily ice extent data for four previous years and the 2012 record low. 2020 to 2021 is shown in blue, 2019 to 2020 in green, 2018 to 2019 in orange, 2017 to 2018 in brown, 2016 to 2017 in magenta, and 2011 to 2012 in dashed brown. The 1981 to 2010 median is in dark gray. The gray areas around the median line show the interquartile and interdecile ranges of the data. Sea Ice Index data.
Credit: National Snow and Ice Data Center
High-resolution image
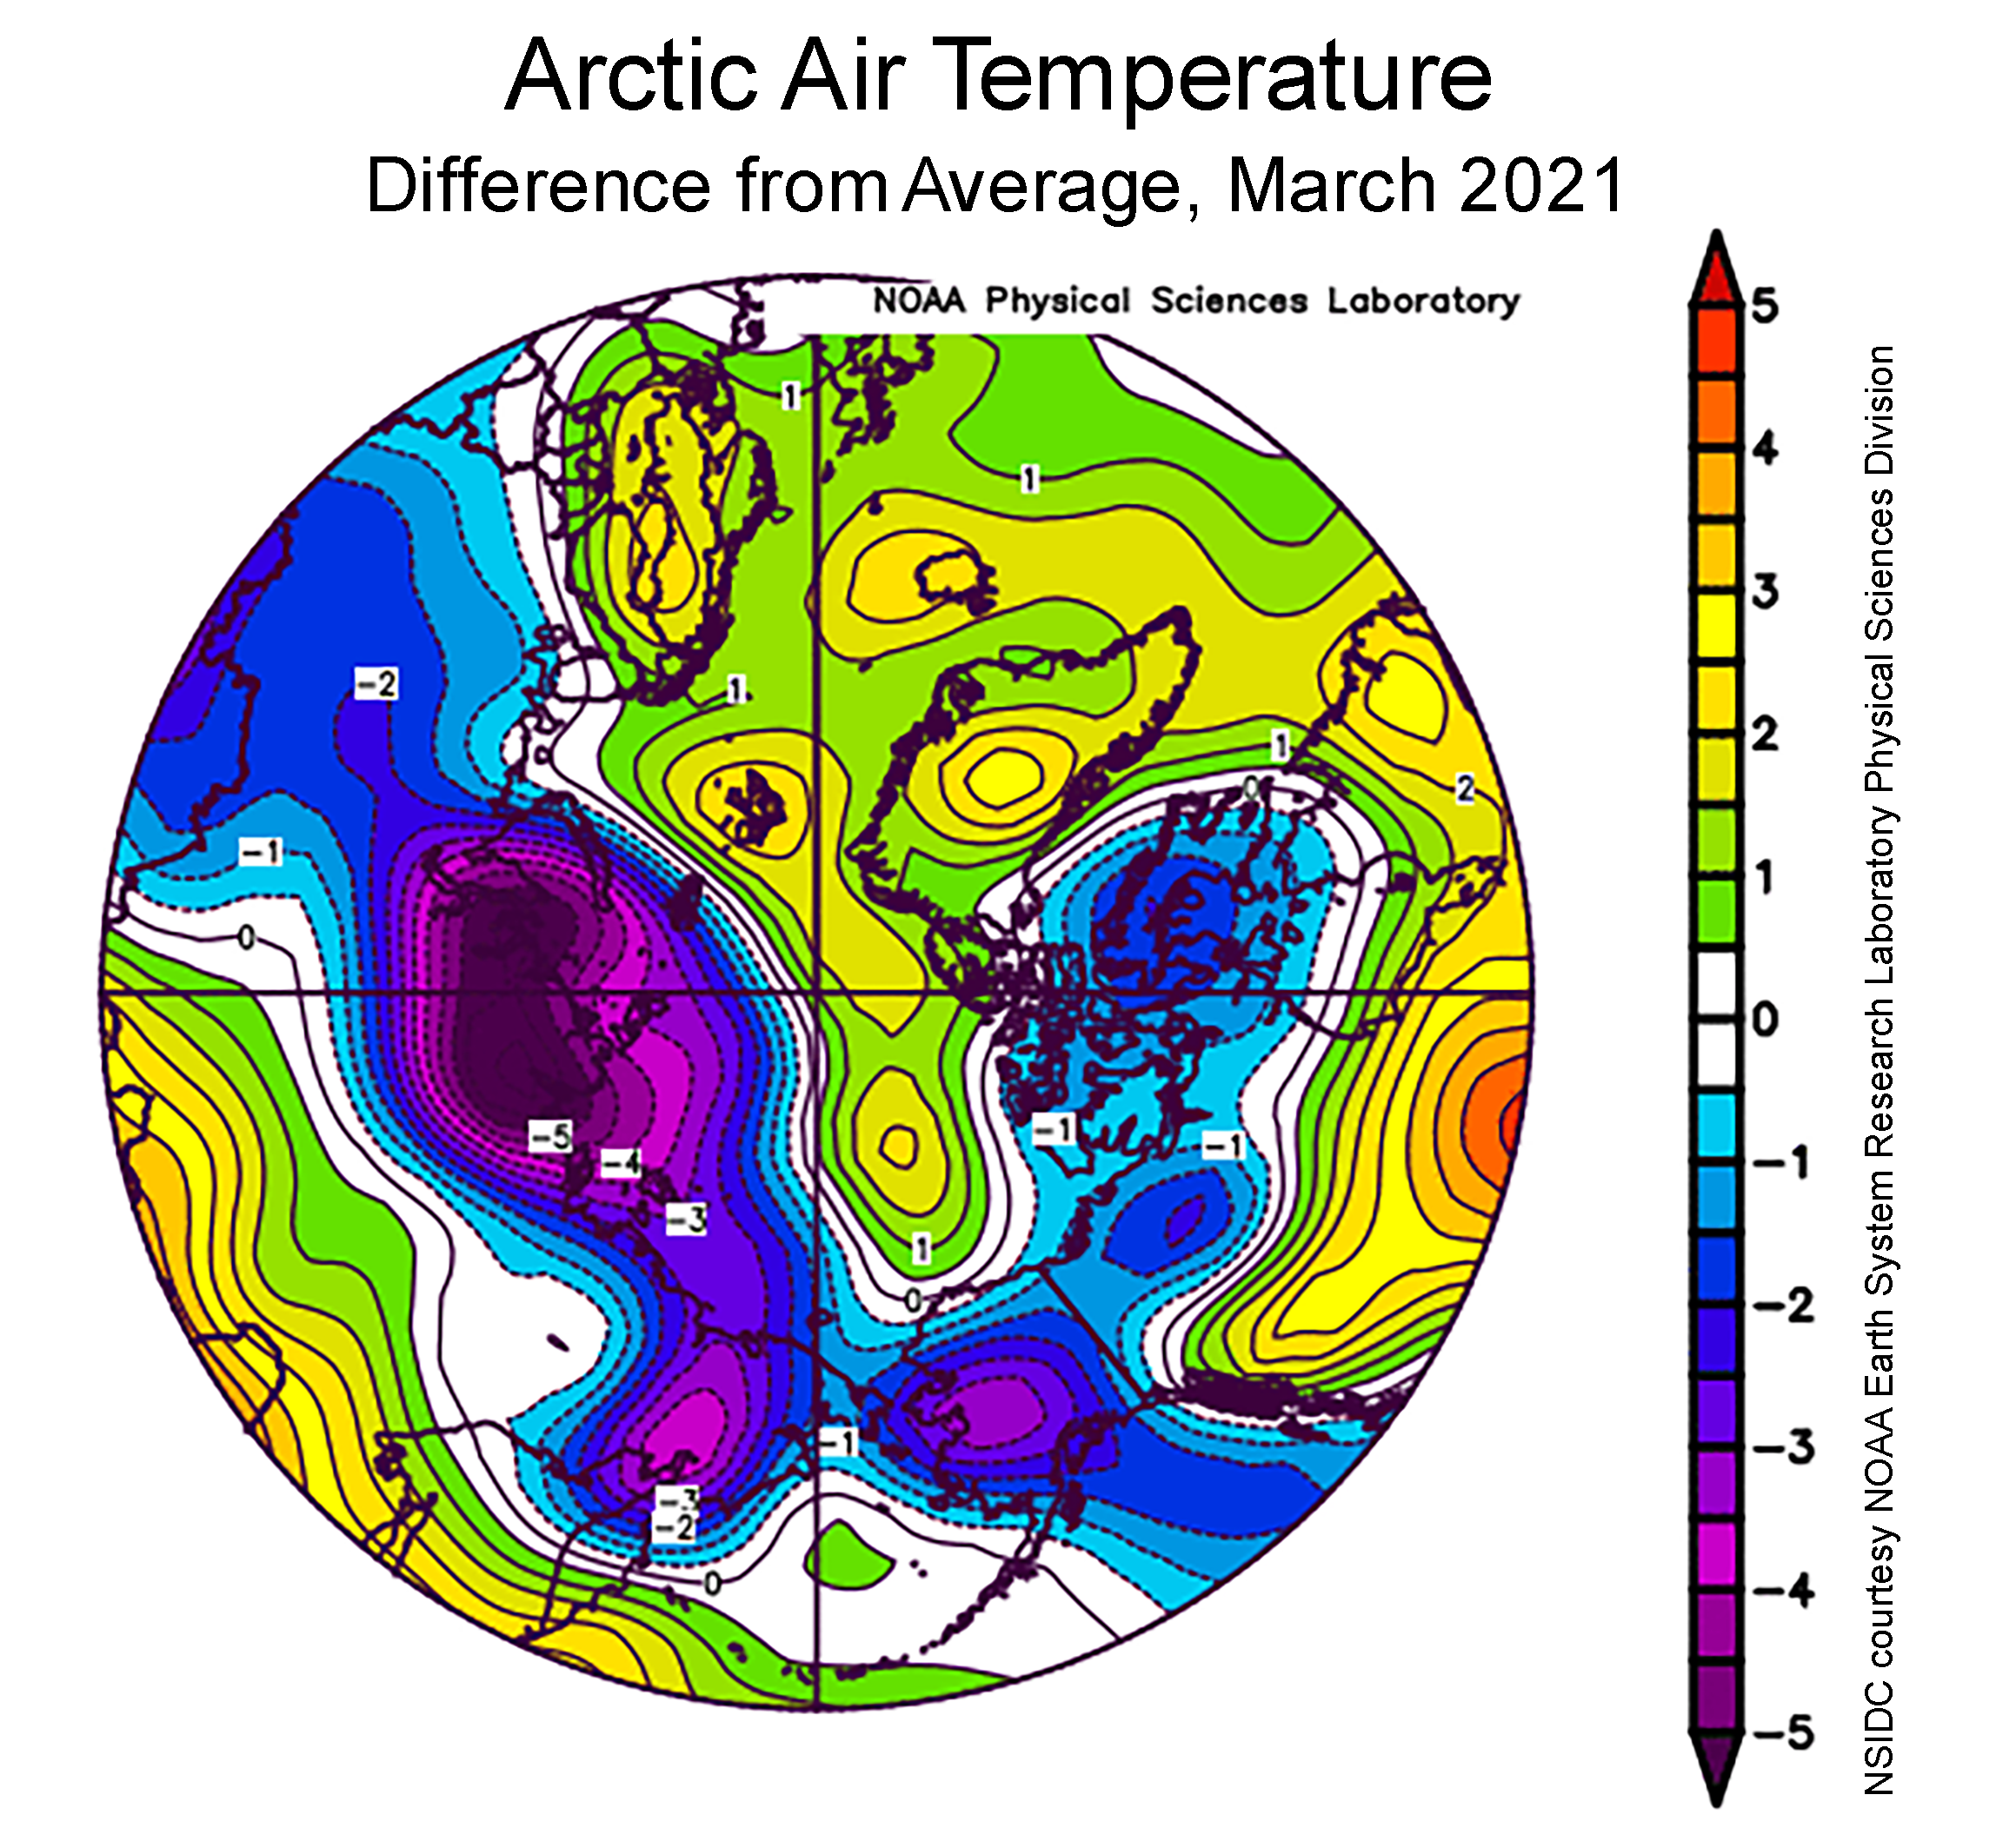
Figure 2b. This plot shows the departure from average air temperature in the Arctic at the 925 hPa level, in degrees Celsius, for March 2021. Yellows and reds indicate higher than average temperatures; blues and purples indicate lower than average temperatures.
Credit: NSIDC courtesy NOAA Earth System Research Laboratory Physical Sciences Division
High-resolution image
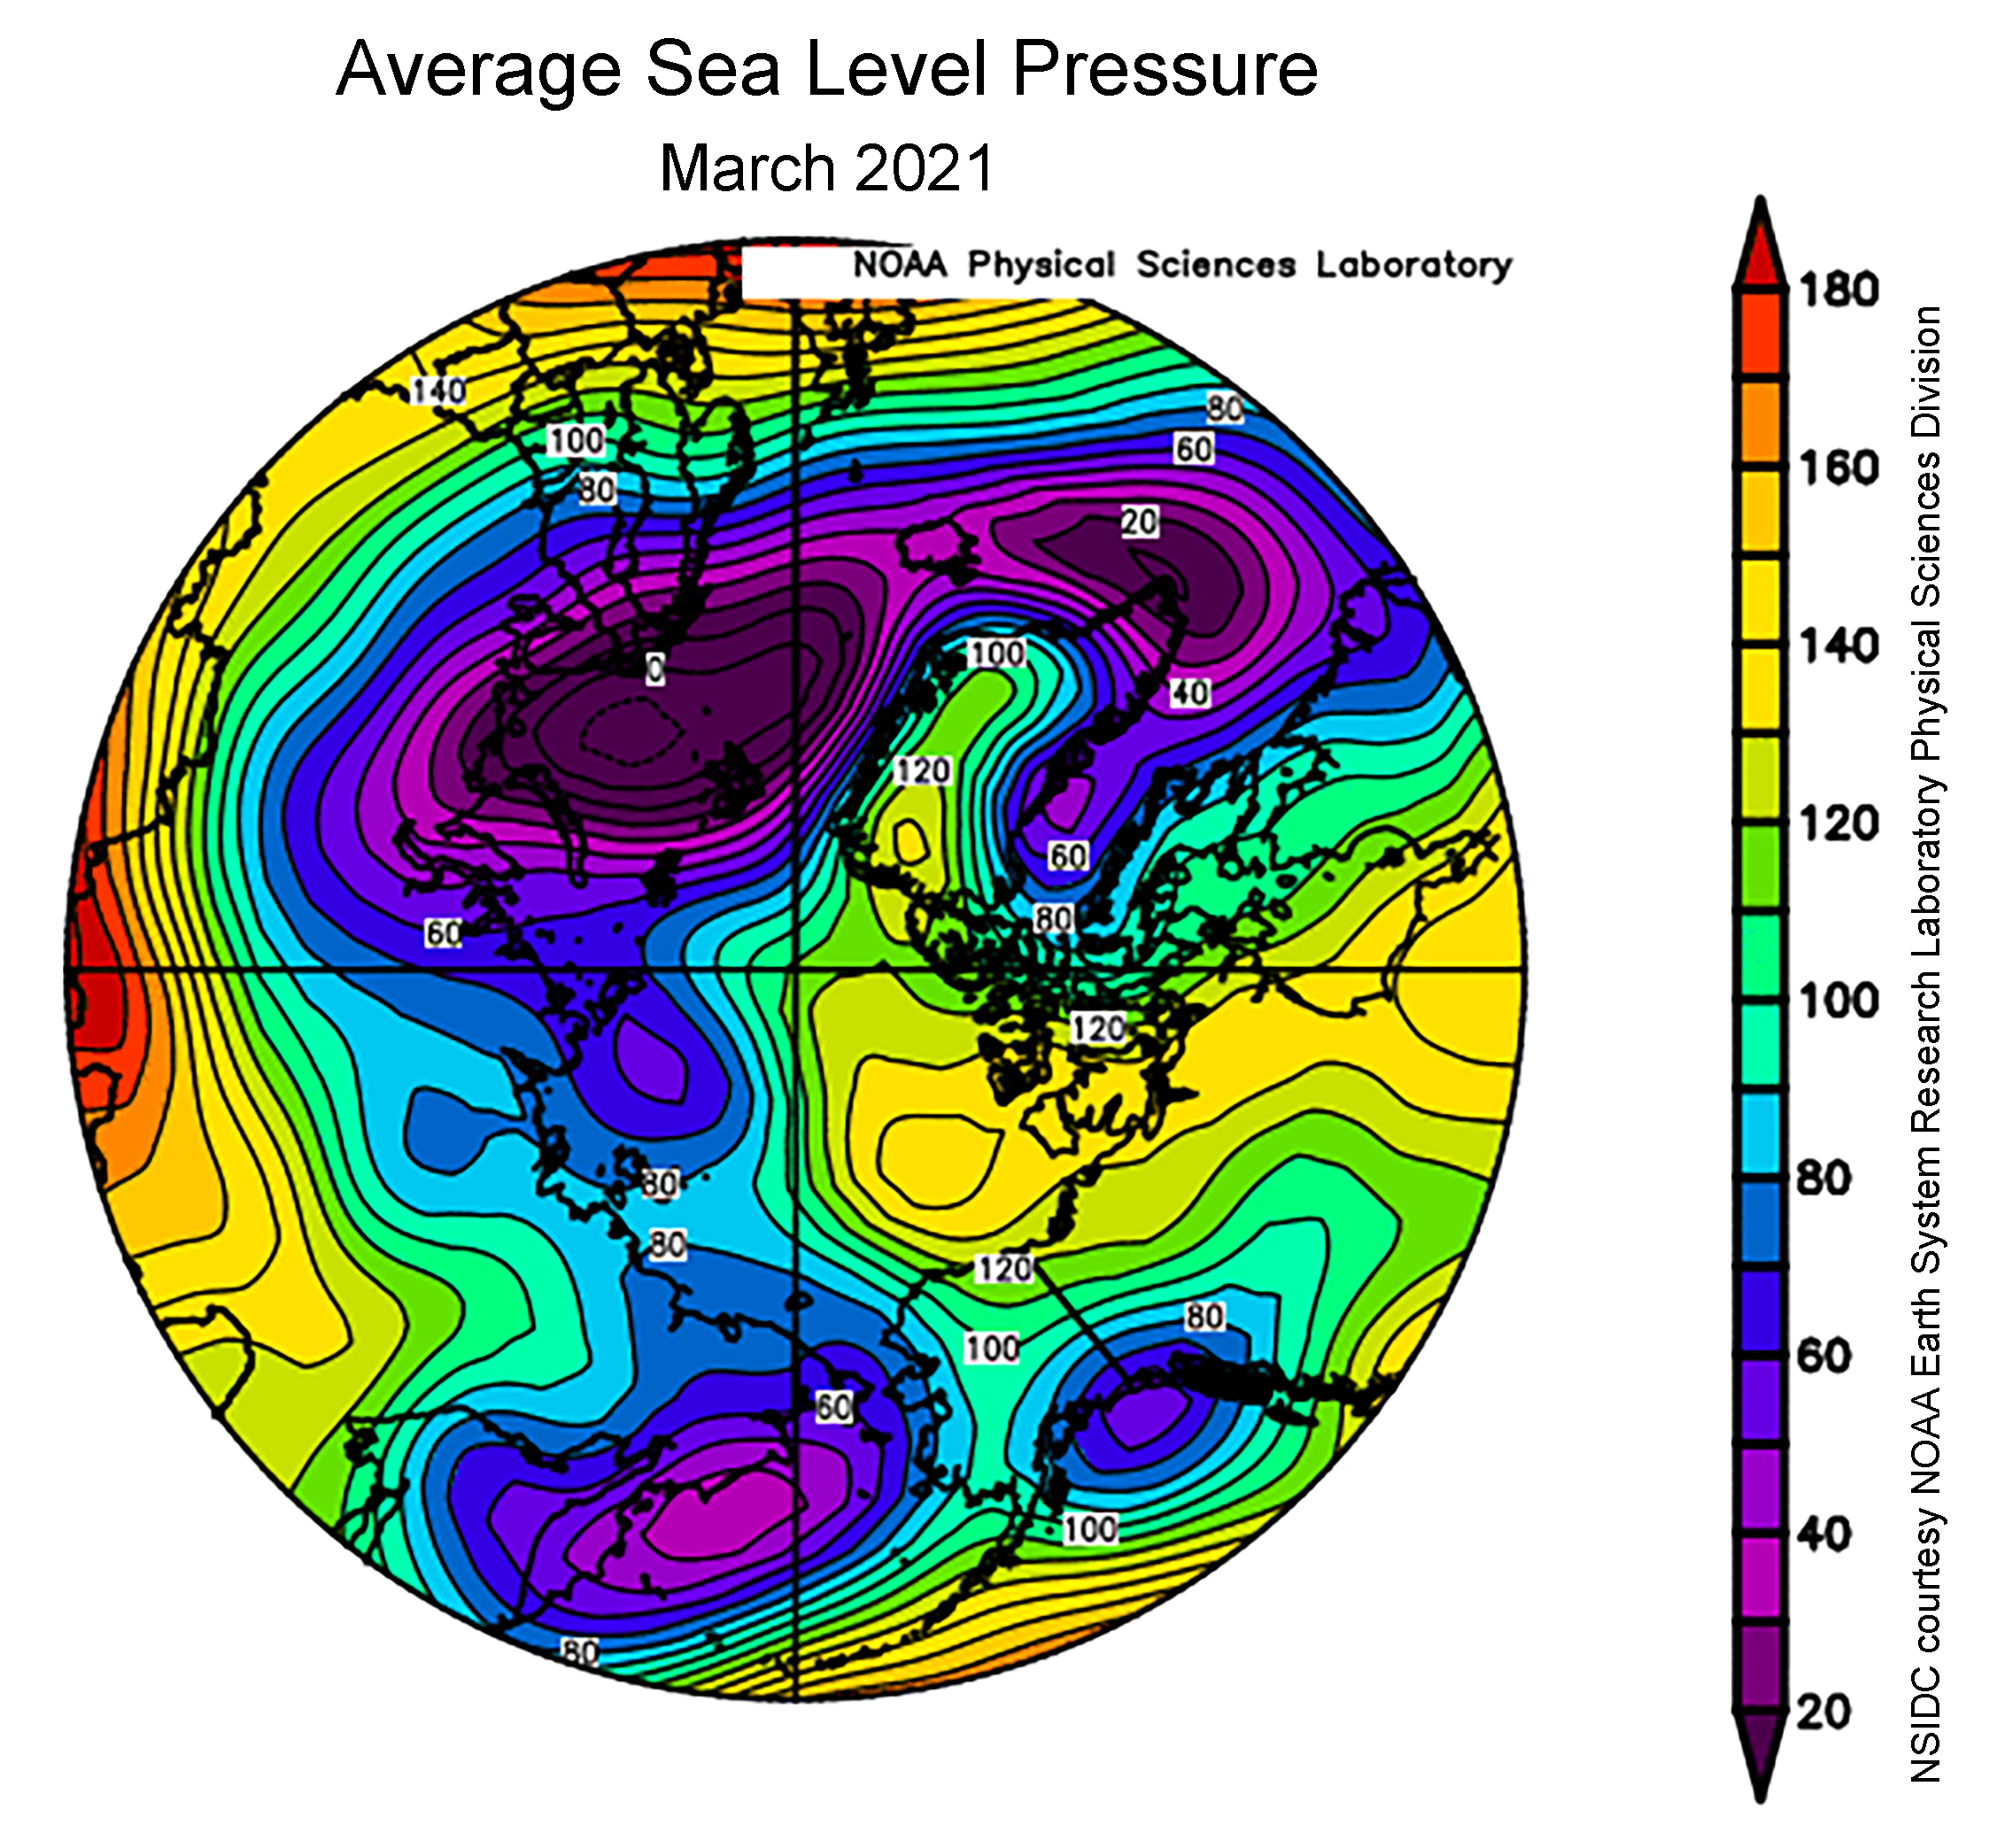
Figure 2c. This plot shows average sea level pressure in the Arctic in millibars March 2021. Yellows and reds indicate high air pressure; blues and purples indicate low pressure.
Credit: NSIDC courtesy NOAA Earth System Research Laboratory Physical Sciences Division
High-resolution image
During March, sea ice extent tracked well below average, but as noted in our previous post, the seasonal maximum in extent, reached on March 21, one day after the vernal equinox, was only the seventh lowest in the passive microwave satellite record. Since ice extent in March increases through the first part of the month and then decreases thereafter, the daily average growth rate is not a very meaningful statistic.
Air temperatures at the 925 mb level (about 2,500 feet above sea level) in March were up to 5 degrees Celsius (9 degrees Fahrenheit) below average across northern Eurasia and extending east over Alaska. Temperatures were 1 to 3 degrees Celsius (2 to 5 degrees) Celsius above average over the Atlantic side of the Arctic, with a tongue of above-average temperatures extending into the Beaufort Sea (Figure 2b). The associated atmospheric circulation for March features low pressure over the northern North Atlantic, with the lowest pressure focused over the Barents Sea (Figure 2c). After remaining in a fairly persistent negative phase for much of the past winter, the Arctic Oscillation index in March was mostly positive, but with large fluctuations.
March 2021 compared to previous years
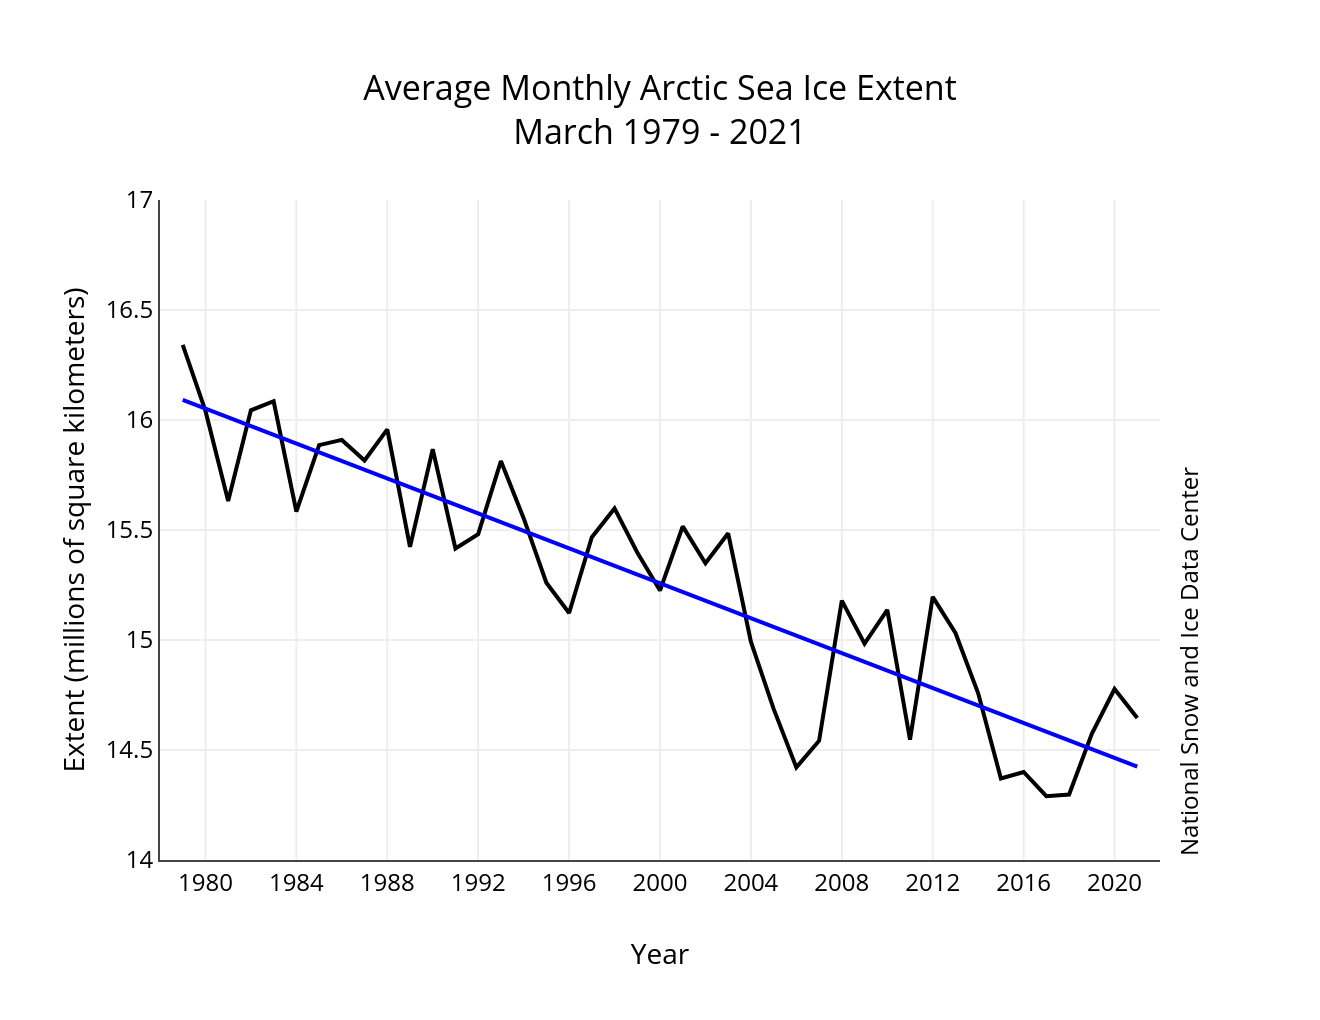
Figure 3. Monthly March ice extent for 1979 to 2021 shows a decline of 2.6 percent per decade.
Credit: National Snow and Ice Data Center
High-resolution image
Through 2021, the linear rate of decline for March sea ice extent, relative to the 1981 to 2010 average extent, is 2.6 percent per decade, which corresponds to 39,700 square kilometers (15,300 square miles) per year, about the size of the US states of Maryland and Delaware combined or the country of Switzerland. The cumulative March ice loss over the 43-year satellite record is 1.67 million square kilometers (645,000 square miles), based on the difference in linear trend values in 2021 and 1979, which is equivalent in size to the state of Alaska.
Troubles in the Gulf of St. Lawrence
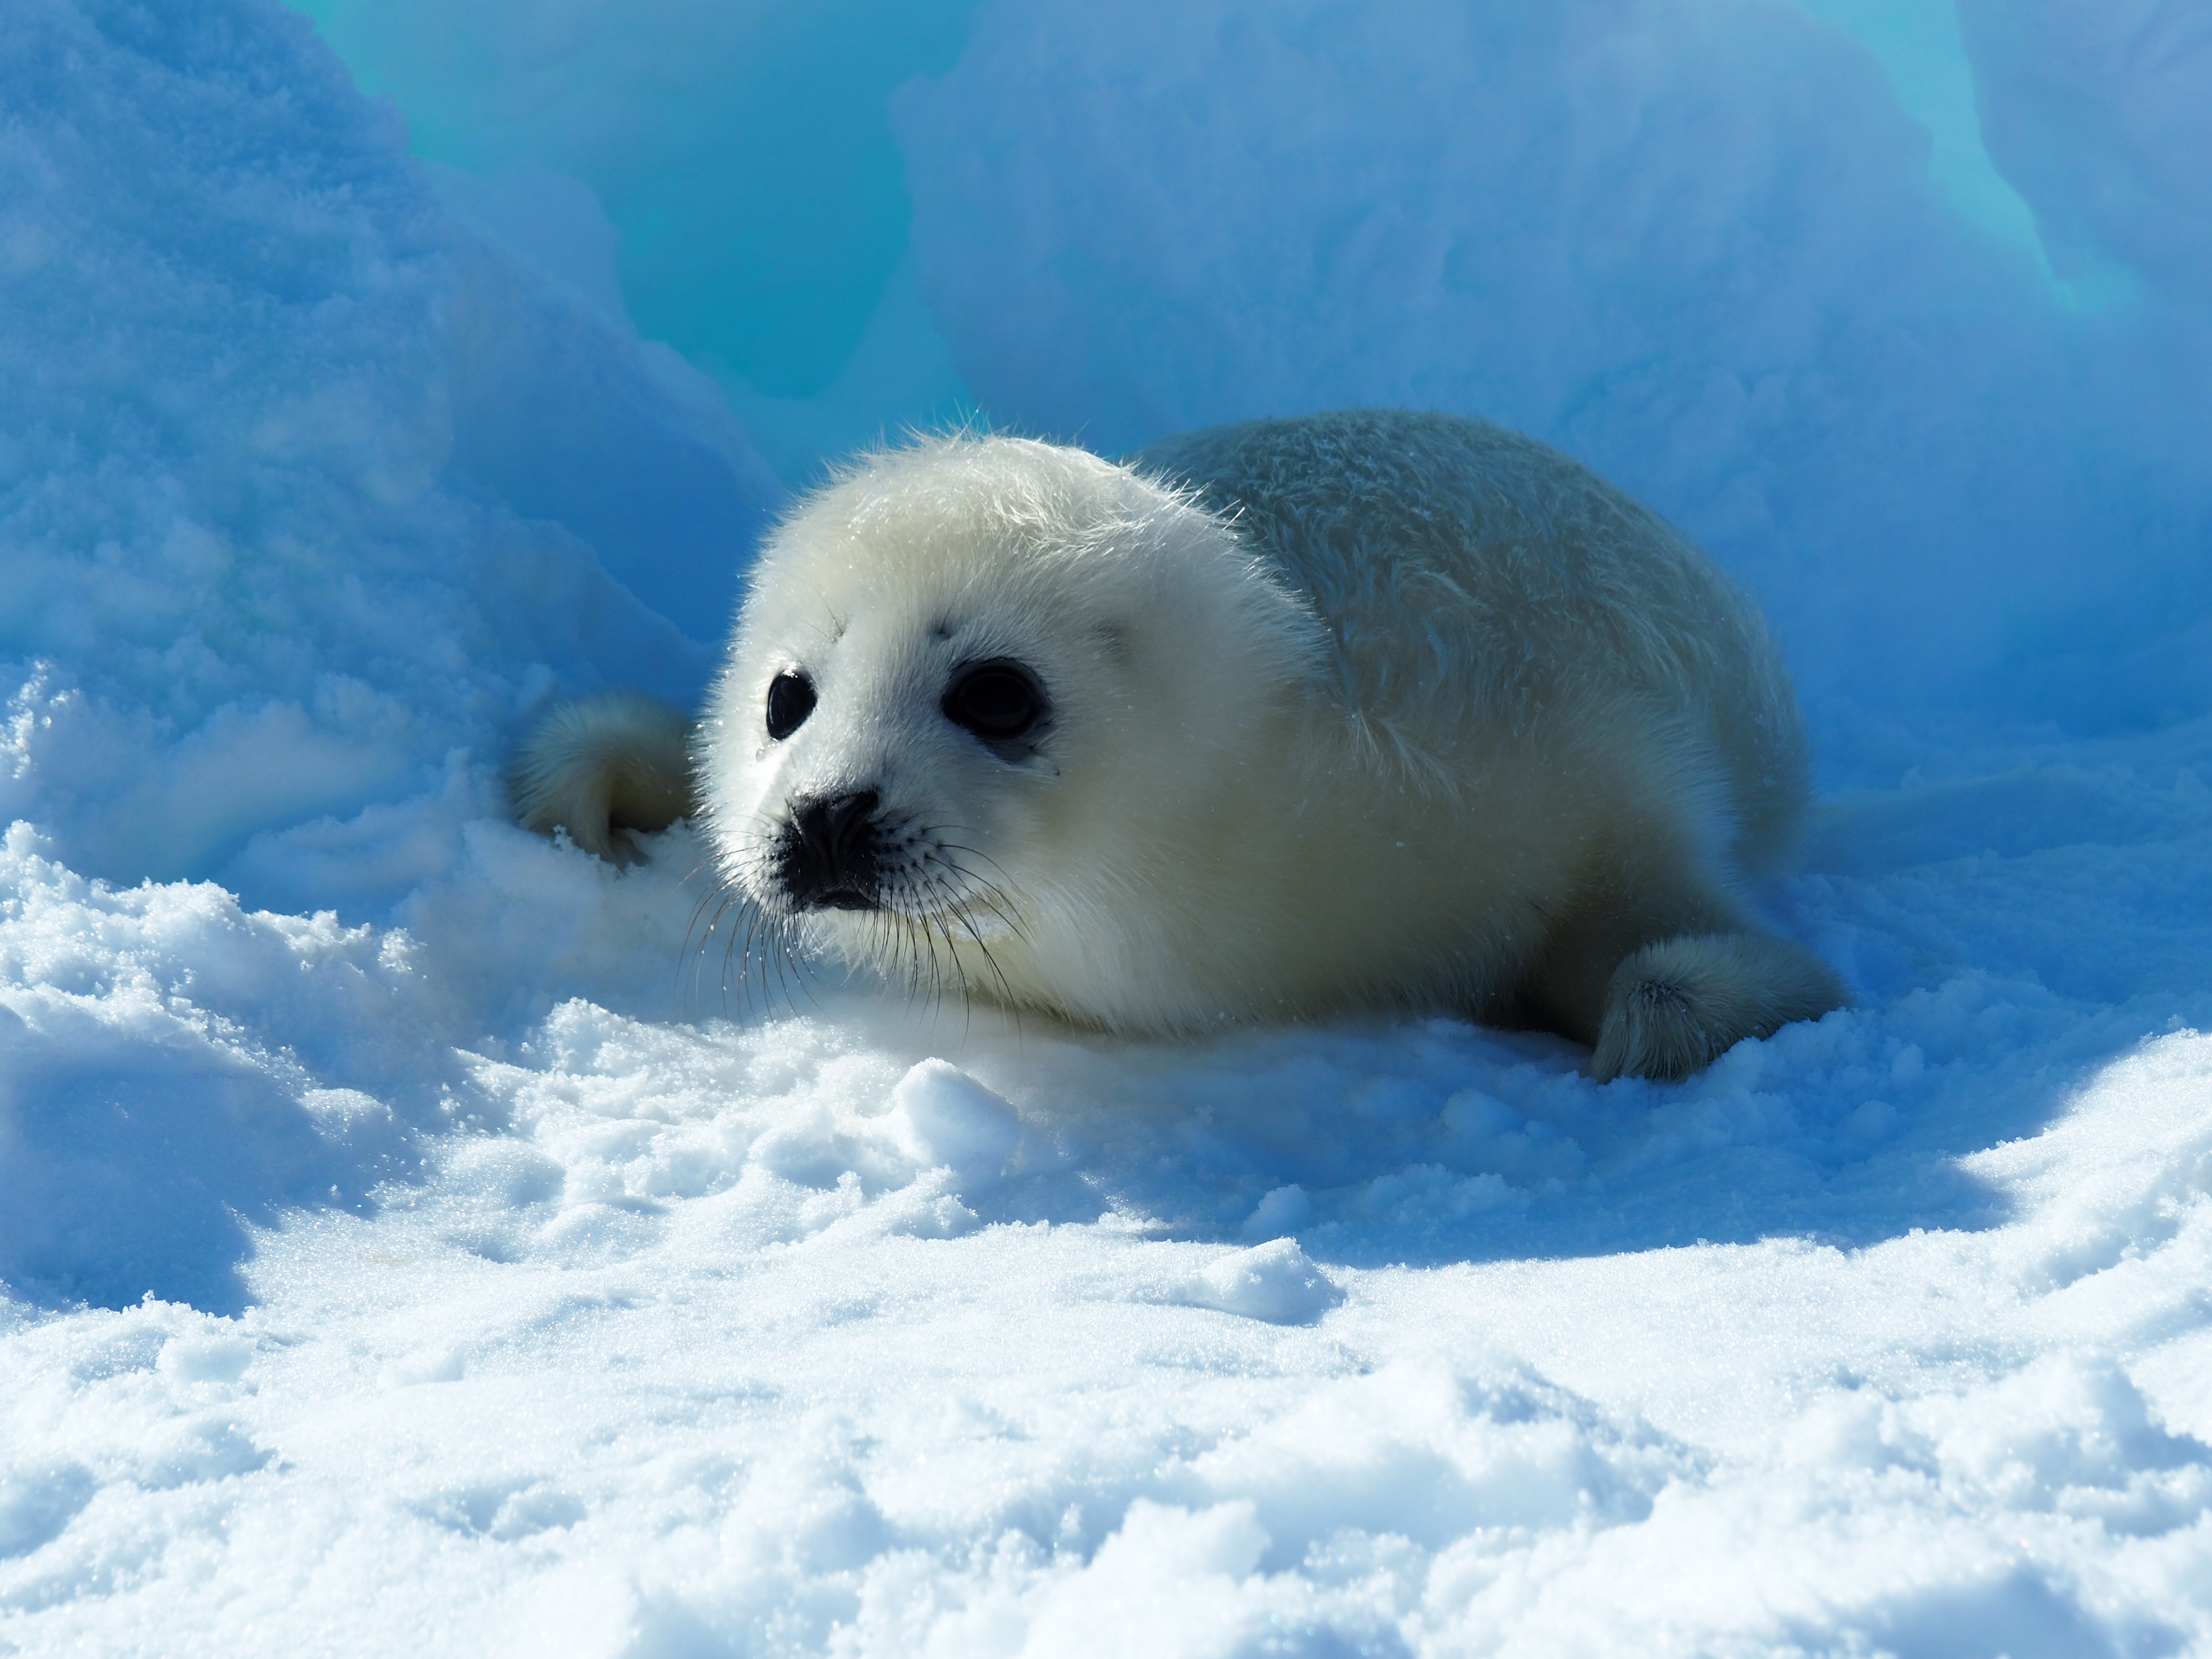
Figure 4. A harp seal pup rests on sea ice. Harp seal pups are born with long white fur that helps them absorb sunlight and stay warm while they develop blubber. Pups shed their white fur after about three to four weeks old.
Credit: Flickr/laika_ac
High-resolution image
This winter ice extent was far below average in the Gulf of St. Lawrence, which is an outlet for the US Great Lakes located northeast of New Brunswick. The unusually low sea ice extent is leading to the death of many harp seal pups. In December, harp seals arrive at the Gulf of St. Lawrence from the Canadian Arctic and Greenland, and then give birth to pups under snow on the ice cover. With so little sea ice, many pups were forced to cluster on shore where they are vulnerable to predators, leading to high pup mortality. It is widely viewed that with continued warming and loss of sea ice, harp seal populations will decline.
Antarctic sea ice on the rise
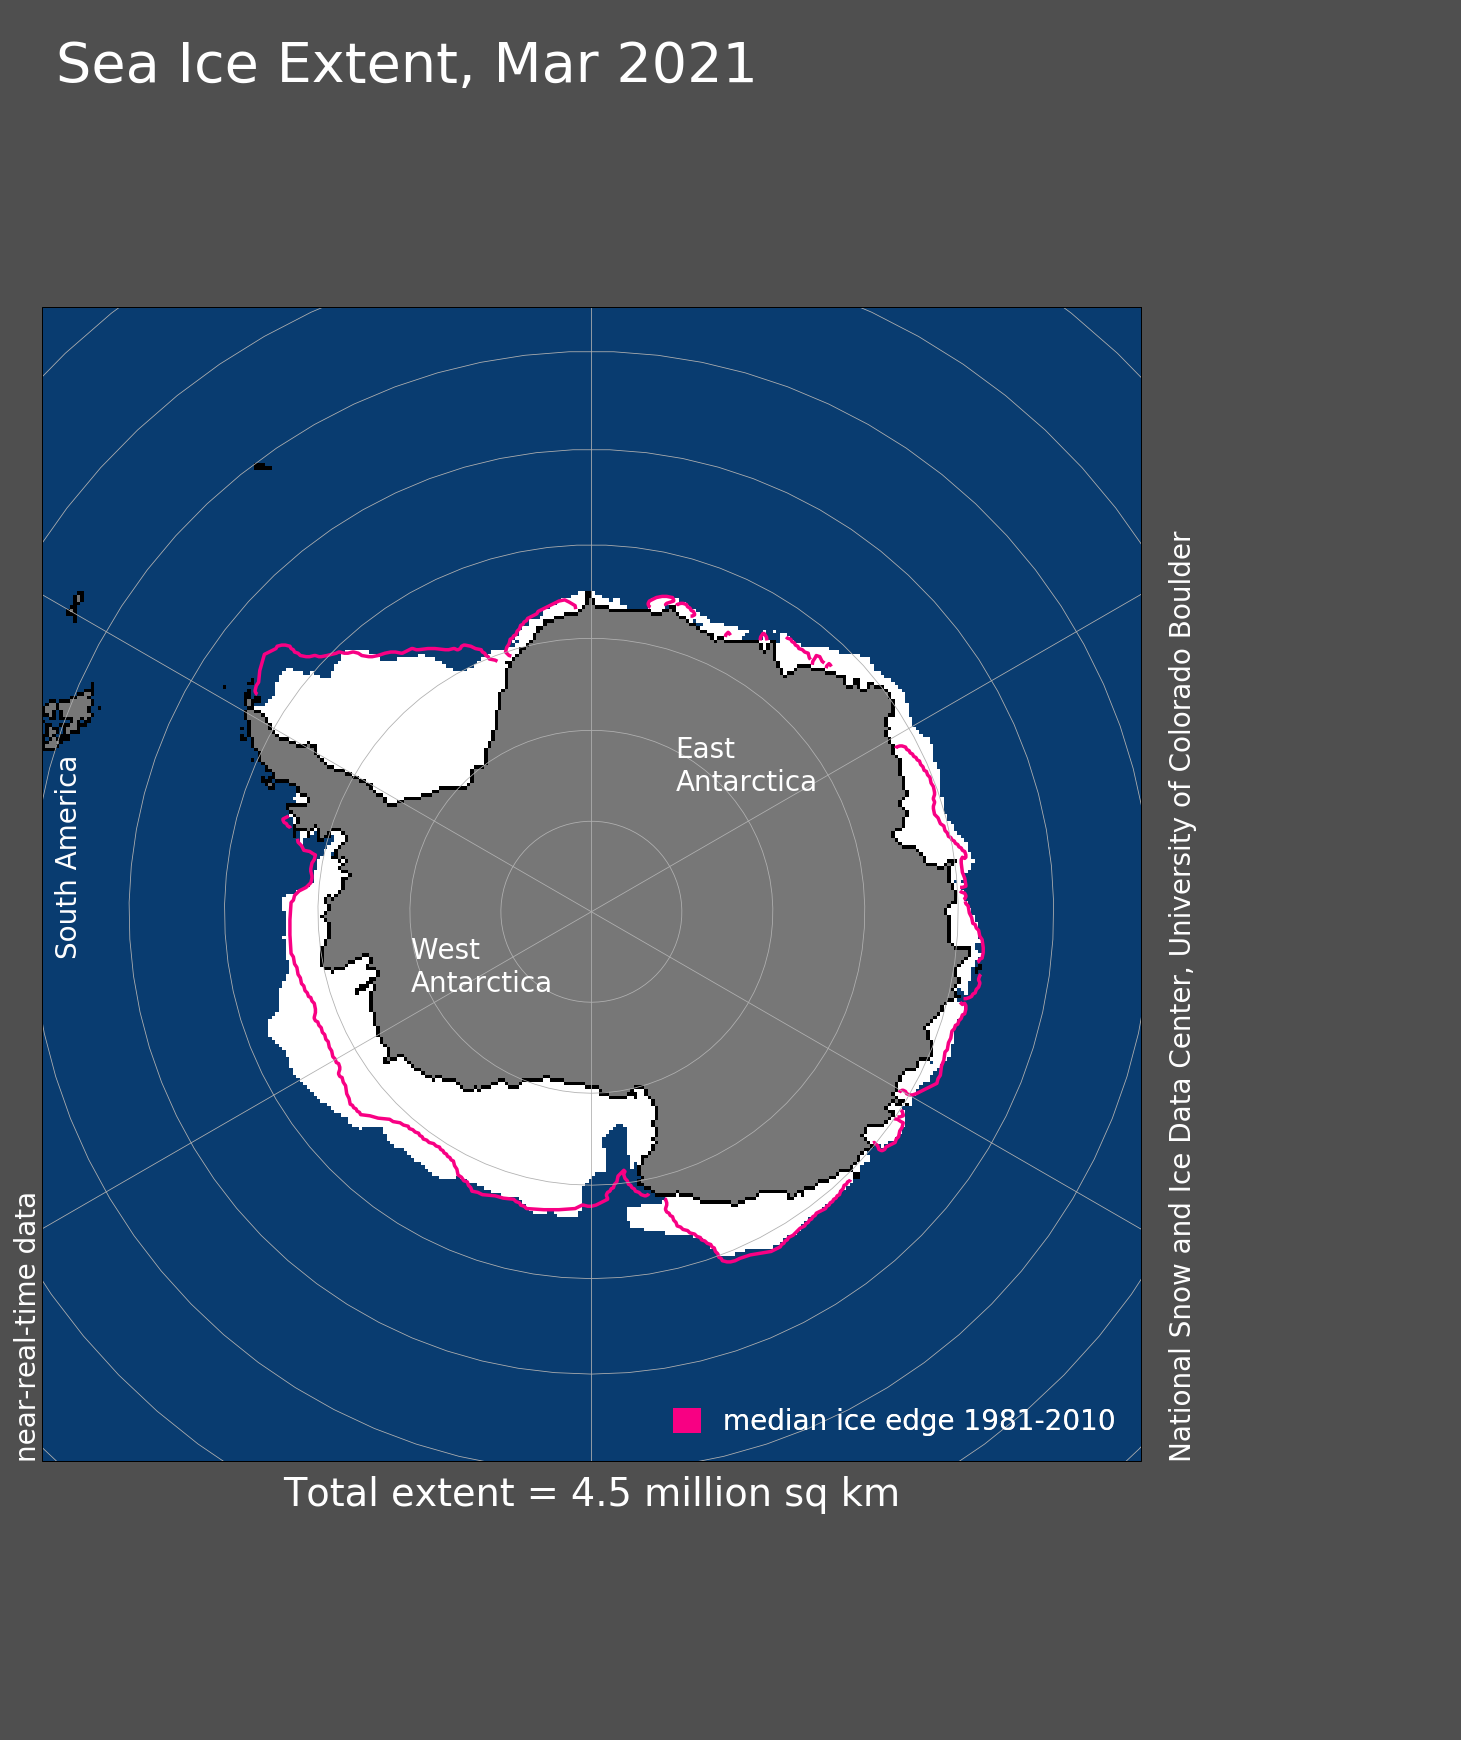
Figure 5. Antarctic sea ice extent for March 2021 was 4.45 million square kilometers (1.72 million square miles). The magenta line shows the 1981 to 2010 average extent for that month. Sea Ice Index data. About the data
Credit: National Snow and Ice Data Center
High-resolution image
After reaching its seasonal minimum extent on February 21, Antarctic sea ice extent climbed rapidly, passing the long-term average daily extent on March 1. The rate of growth was very rapid between February 25 and March 8, expanding by over one million square kilometers (386,000 square miles) in the 12-day period. This is the fastest expansion in the four-decade record of sea ice extent for this time of year, and was caused by a rapid refreezing of the western Amundsen Sea and eastern Ross Sea areas. Since early March, growth has slowed to a more typical, slightly below-average pace. The Amundsen and eastern Ross Seas remain well above the average extent for the season. Sea ice extent in the Bellingshausen Sea and Weddell Sea are slightly below average. At the end of the month, Antarctic ice extent neared 5.5 million square kilometers (2.1 million square miles).

