Arctic sea ice extent appears to have reached its maximum extent on March 13, marking the beginning of the sea ice melt season. Since the maximum, sea ice extent has been tracking at record low levels. In the Bering Sea, extent increased through the middle of March after setting record lows—only to drop sharply again.
Overview of conditions
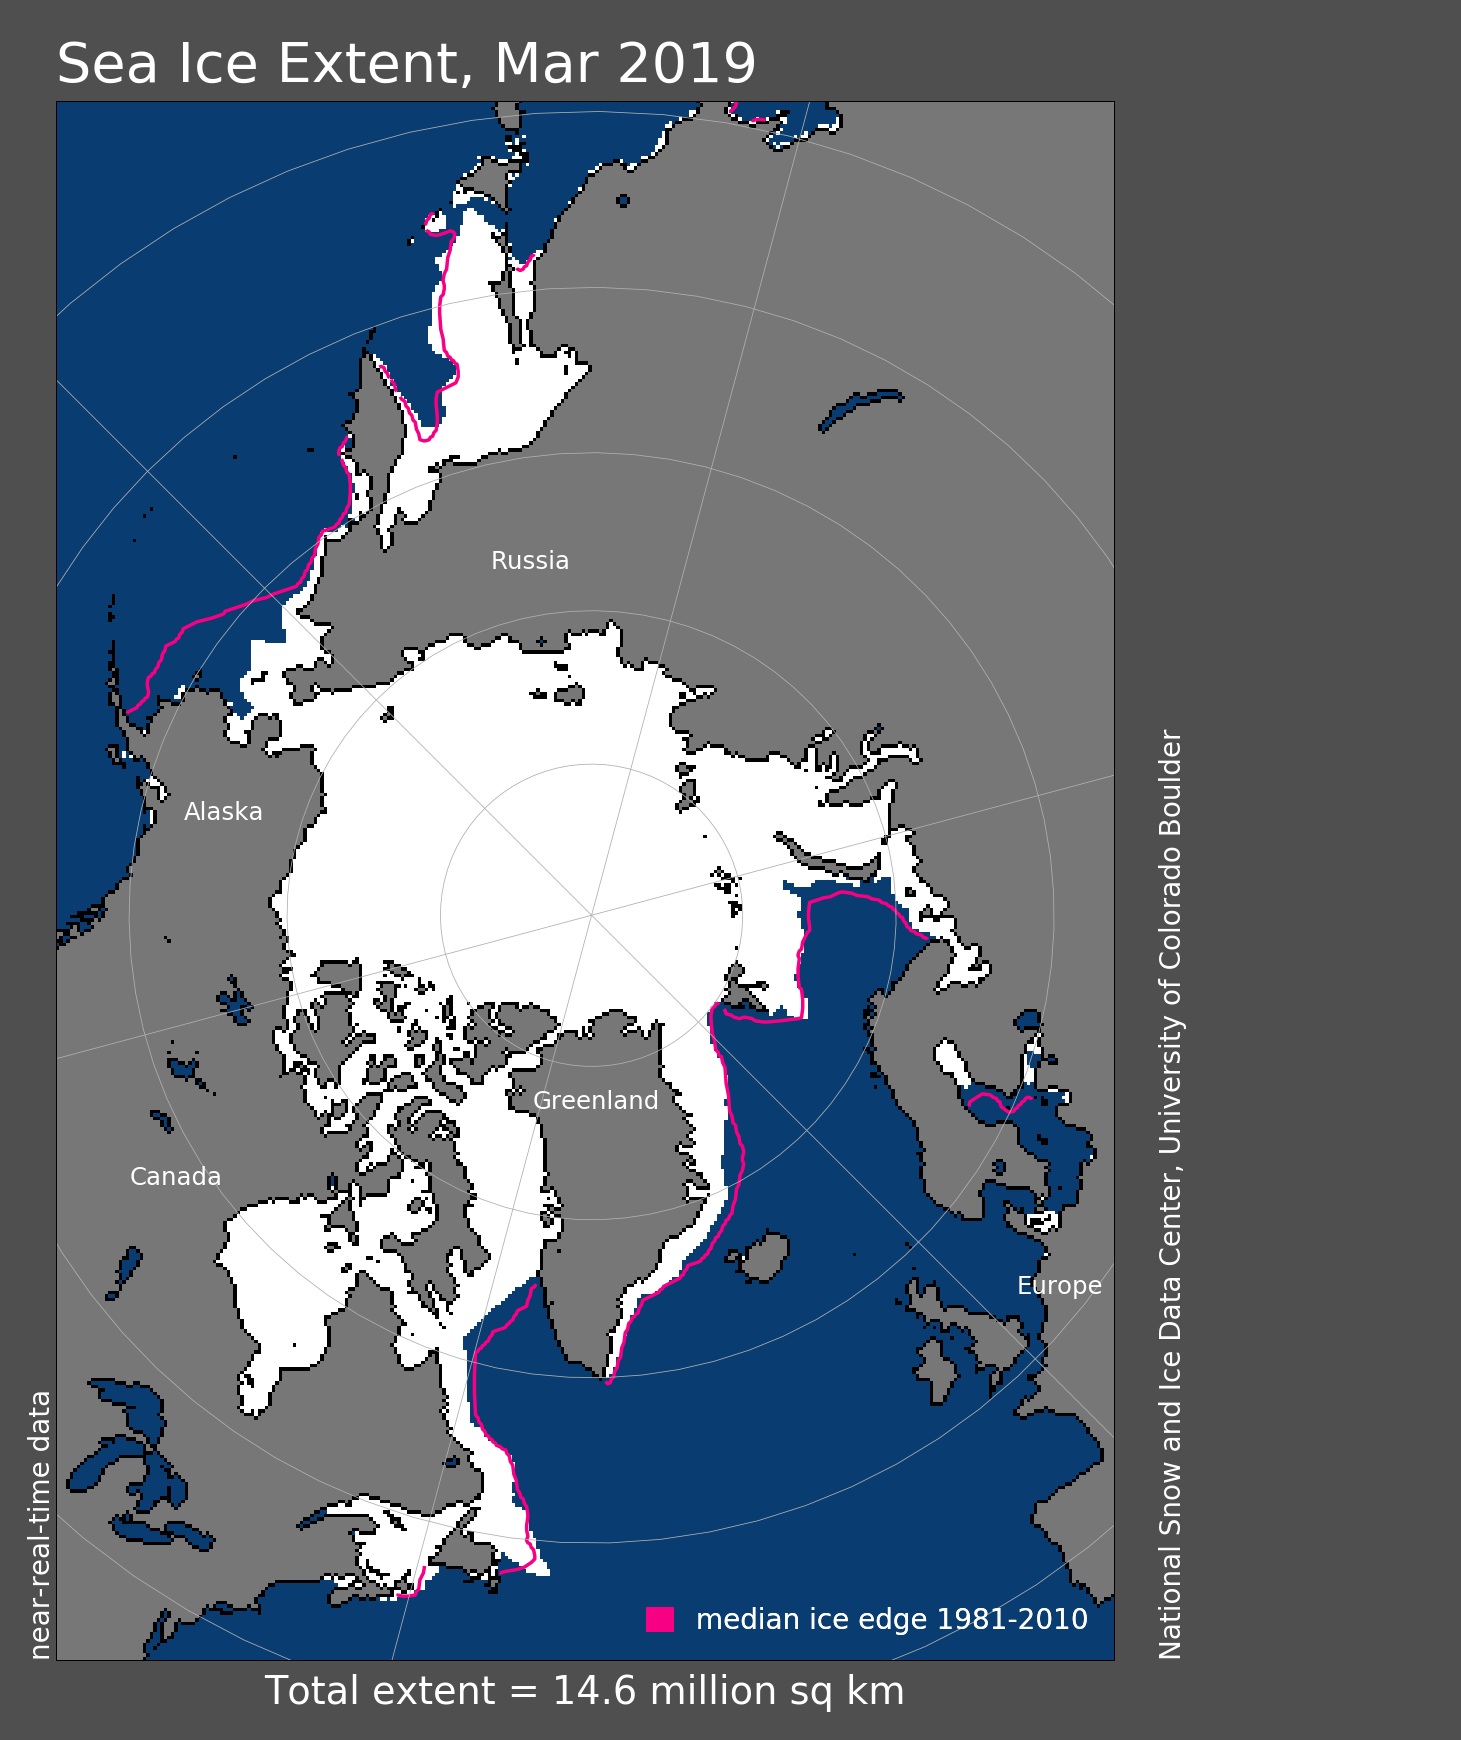
Figure 1. Arctic sea ice extent for March 2019 was 14.55 million square kilometers (5.62 million square miles). The magenta line shows the 1981 to 2010 average extent for that month. Sea Ice Index data. About the data
Credit: National Snow and Ice Data Center
High-resolution image
Arctic sea ice extent for March averaged 14.55 million square kilometers (5.62 million square miles), tying with 2011 for the seventh lowest extent in the 40-year satellite record. This is 880,000 square kilometers (340,000 square miles) below the 1981 to 2010 average and 260,000 square kilometers (100,400 square miles) above the lowest March average, which occurred in 2017.
The Bering Sea, which had been nearly ice free at the beginning of March, saw gains in extent through the middle of the month. However, those gains were short lived as extent dropped sharply during the last week of March. The Bering Sea typically reaches its maximum ice extent in late March or early April. This year, the maximum occurred in late January and was 34.5 percent below the 1981 to 2010 average maximum. These late-March sea ice extent losses in the Bering Sea accelerated the decline of total Arctic sea ice extent. By April 1, Arctic extent was at a record low for that date.
Other signs of spring are emerging. A substantial amount of ice retreated in the Gulf of St. Lawrence and the Sea of Okhotsk, as well as in the Barents Sea. Late in the month, small areas of open water were observed in sea ice fields from the University of Bremen, particularly near the shores of the Laptev and Kara Seas, the Sea of Okhotsk, and off of northwestern Alaska.
Conditions in context
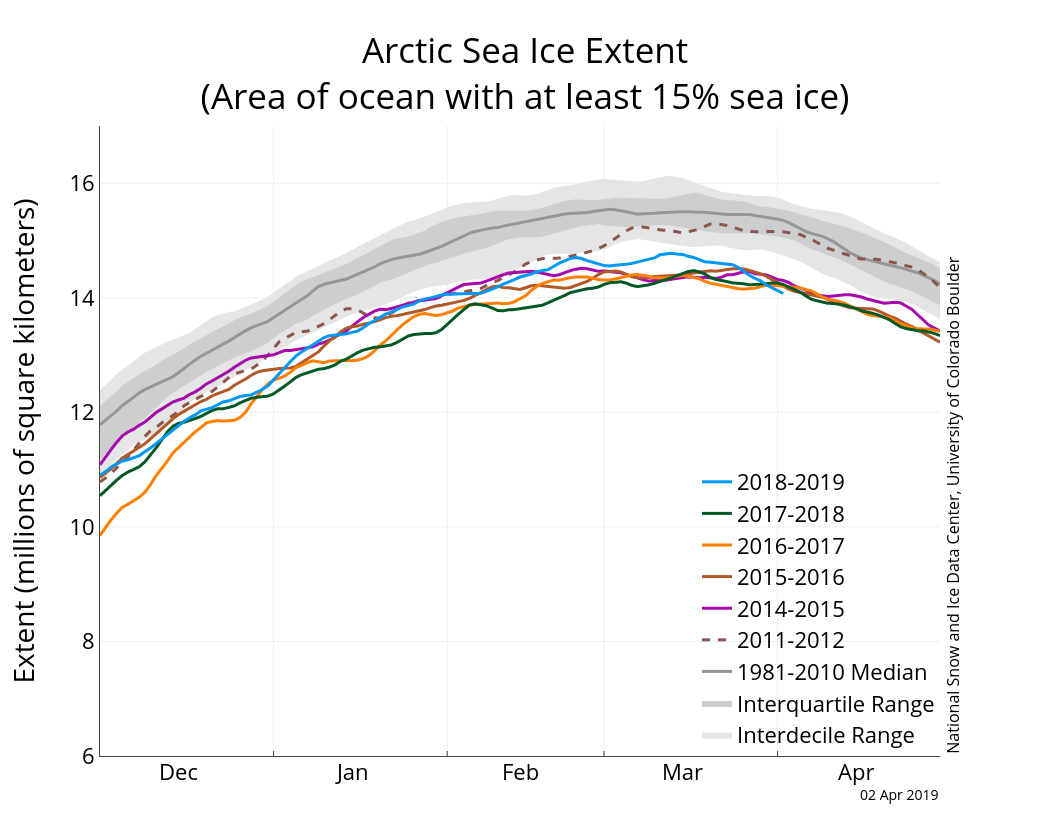
Figure 2a. The graph above shows Arctic sea ice extent as of April 2, 2019, along with daily ice extent data for four previous years and the record low year. 2018 to 2019 is shown in blue, 2017 to 2018 in green, 2016 to 2017 in orange, 2015 to 2016 in brown, 2014 to 2015 in purple, and 2011 to 2012 in dotted brown. The 1981 to 2010 median is in dark gray. The gray areas around the median line show the interquartile and interdecile ranges of the data. Sea Ice Index data.
Credit: National Snow and Ice Data Center
High-resolution image
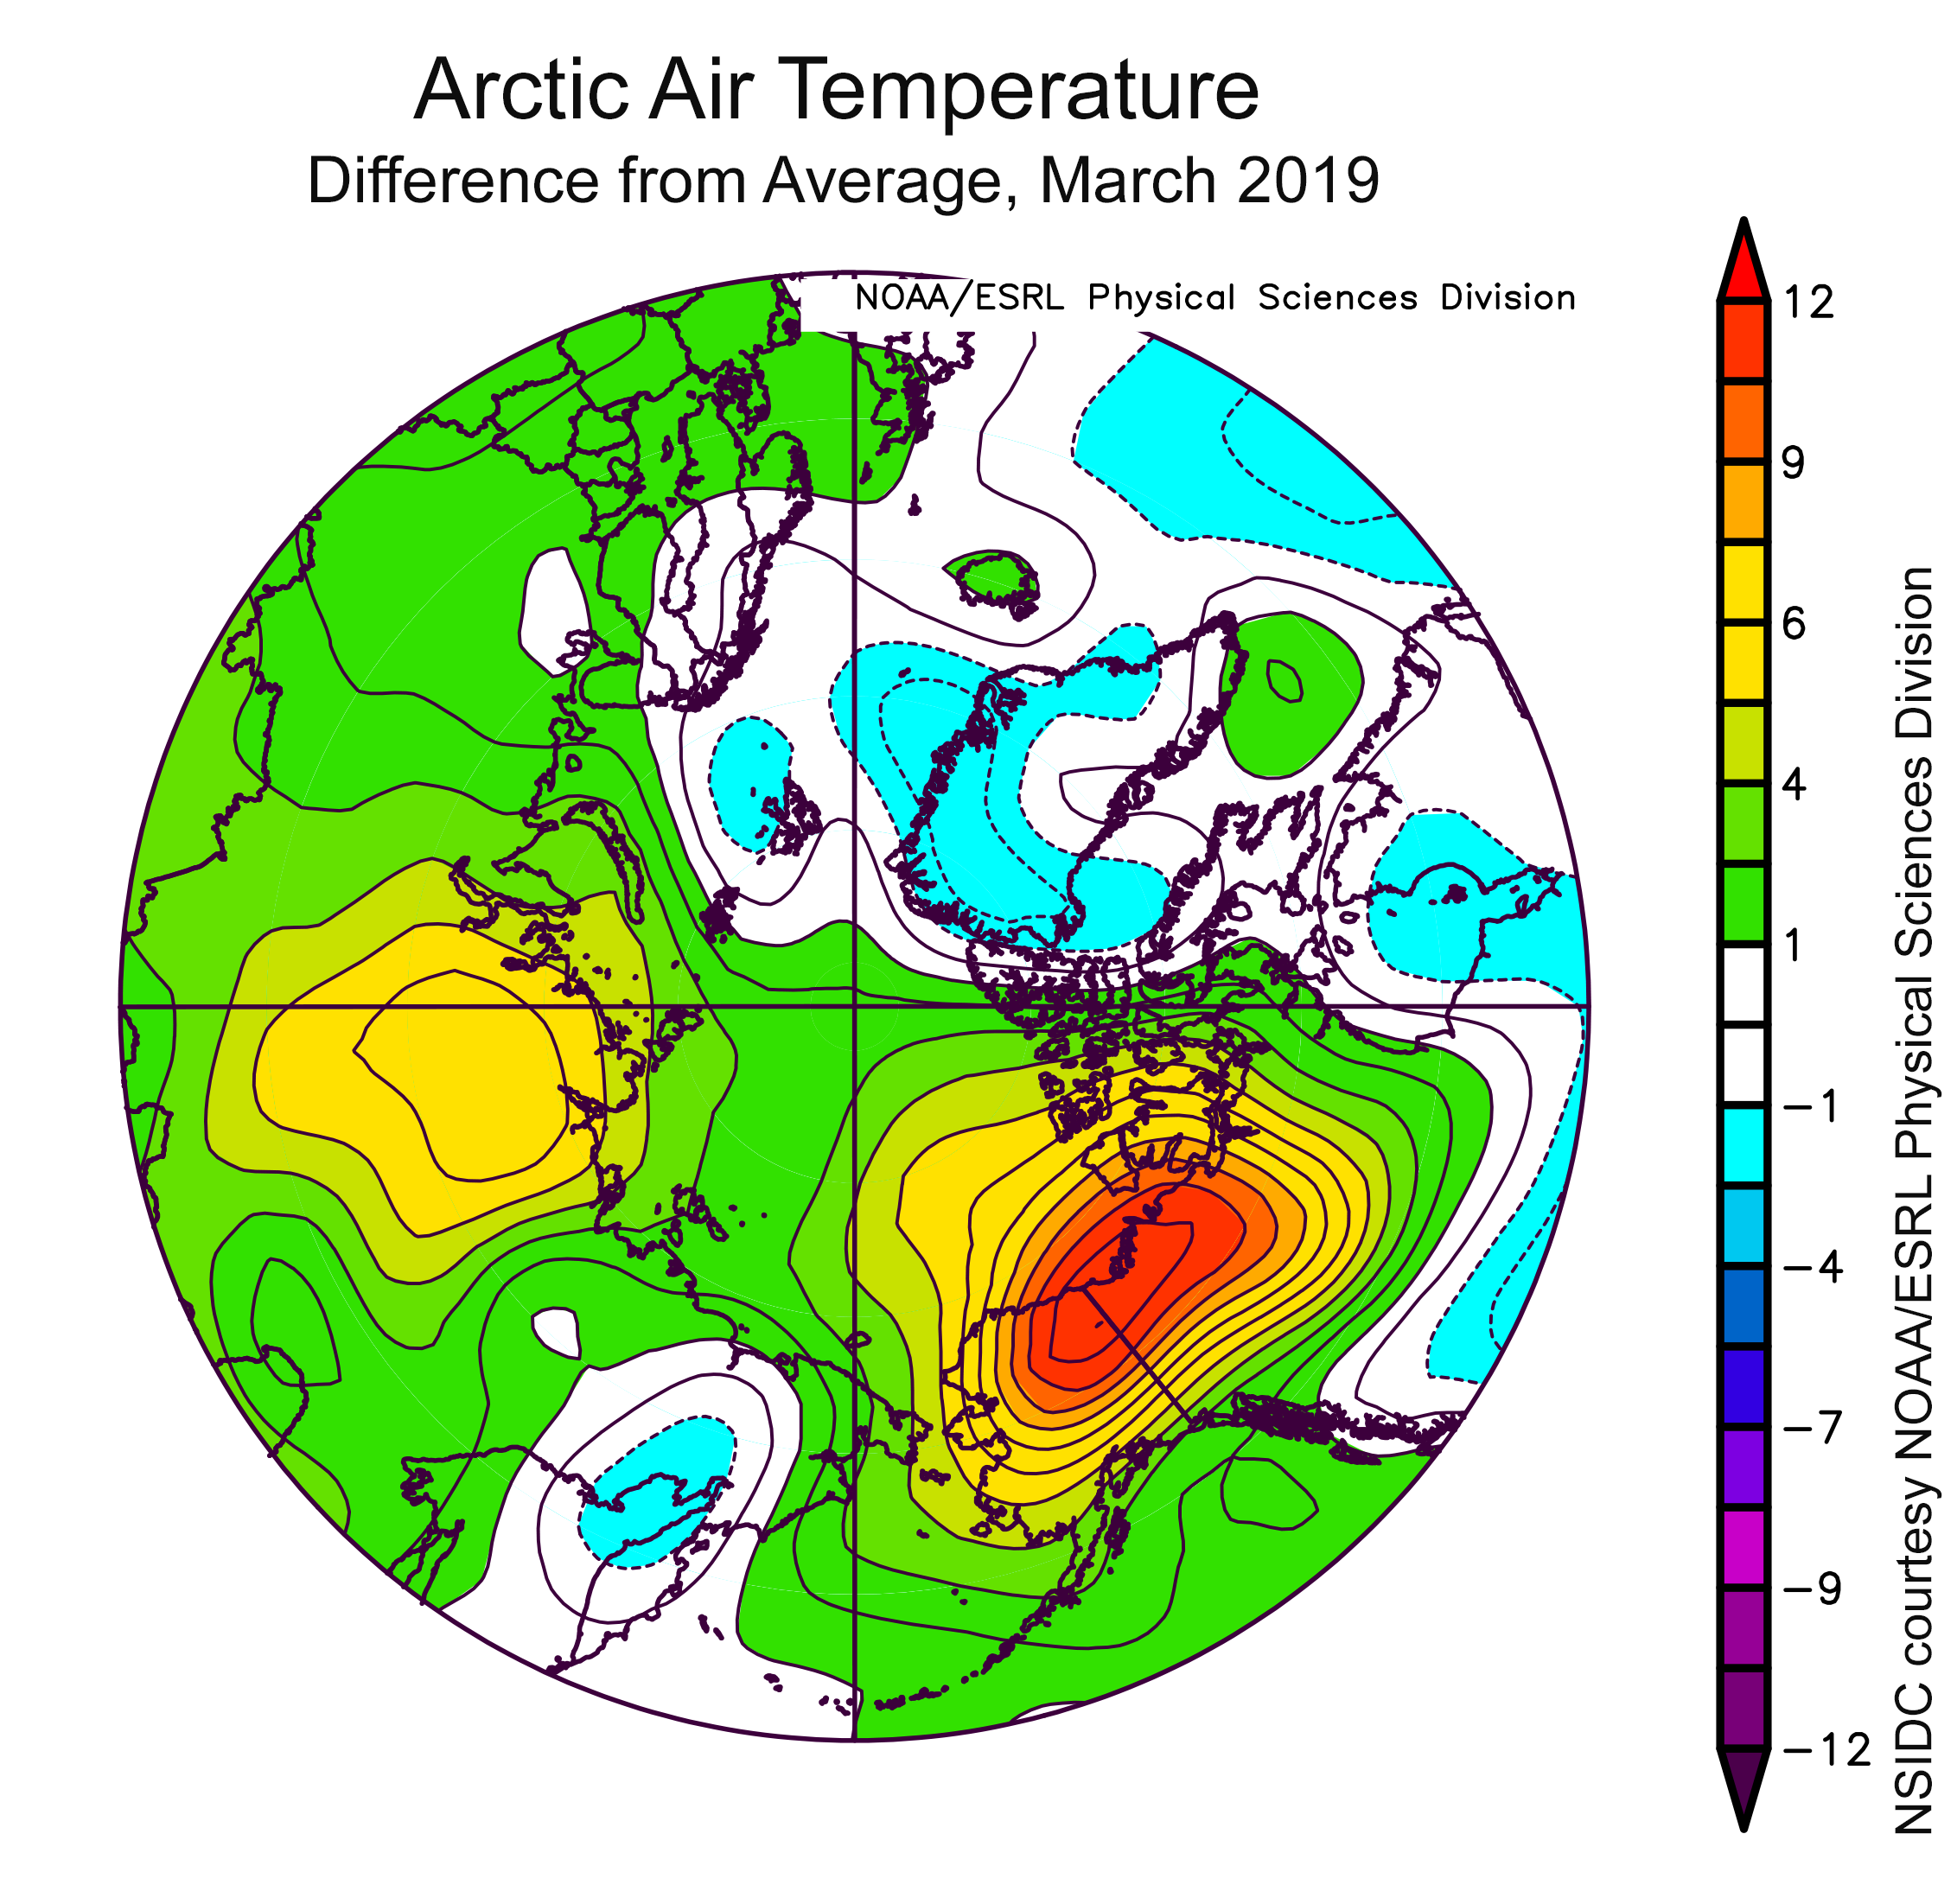
Figure 2b. This plot shows the departure from average air temperature in the Arctic at the 925 hPa level, in degrees Celsius, for March 2019. Yellows and reds indicate higher than average temperatures; blues and purples indicate lower than average temperatures.
Credit: NSIDC courtesy NOAA Earth System Research Laboratory Physical Sciences Division
High-resolution image
Overall, Arctic weather in March featured low pressure and above average temperatures. Two low pressure centers at sea level, one over the Bering Sea and the other over the Barents Sea, dominated the atmospheric circulation pattern. Low pressure over the Barents Sea brought cloudy and cool conditions to the immediate region, but also funneled warm air into the central Arctic Ocean. Air temperatures at the 925 mb level (about 2500 feet above sea level) were above average over most of the Arctic region, with the exception in the Atlantic sector of the Arctic Ocean. Temperatures were far above average, locally exceeding 10 degrees Celsius (18 degrees Fahrenheit), over the Beaufort Sea, northeast Alaska, and northwest Canada.
The pattern of overall low pressure across the Arctic in March was manifested as a persistent positive phase of the Arctic Oscillation (AO), a pattern that started during the second week of February. A positive AO in winter has in the past favored low September ice extent. This is in part due to a wind pattern tending to advect older, thicker ice out of the Arctic through the Fram Strait. The wind pattern associated with the positive AO also tends to pull ice away from the Siberian coast, resulting in thinner ice in the region that readily melts out during summer. However, with the overall thinning of the Arctic ice cover, the relationship between winter AO phase and September sea ice extent is not as clear as it used to be.
March 2019 compared to previous years
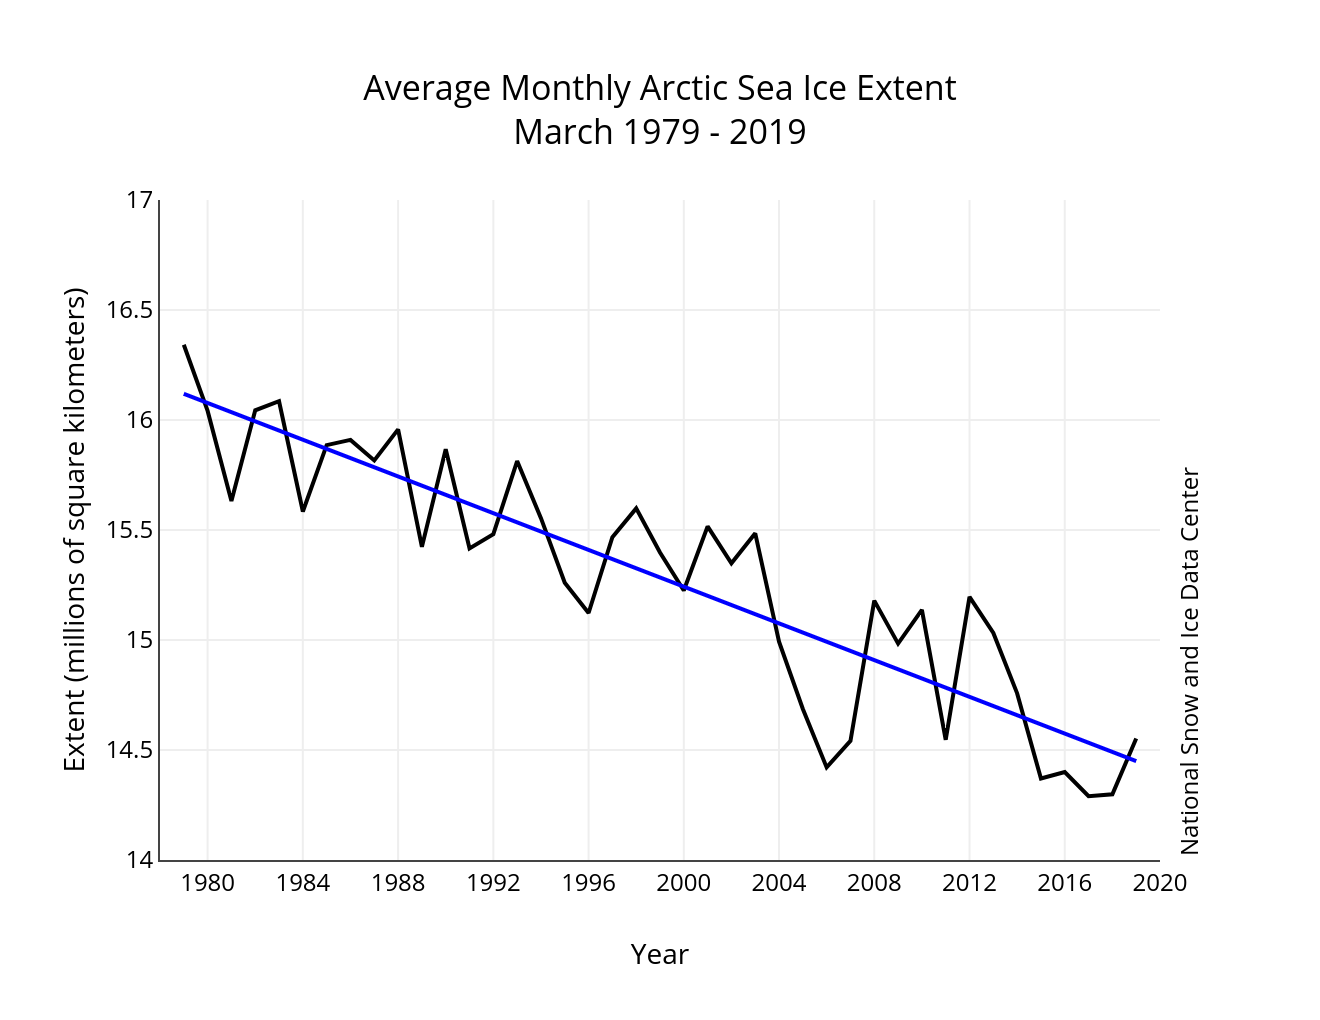
Figure 3. Monthly March ice extent for 1979 to 2019 shows a decline of 2.7 percent per decade.
Credit: National Snow and Ice Data Center
High-resolution image
The net change in sea ice extent between the beginning and end of March was small, which is typical for the month. Sea ice extent increased during the first part of the month to the annual maximum on March 13 and then declined through the remainder of the month.
The 1979 to 2019 linear rate of decline for March ice extent is 41,700 square kilometers (16,100 square miles) per year, or 2.7 percent per decade relative to the 1981 to 2010 average.
Winter recap
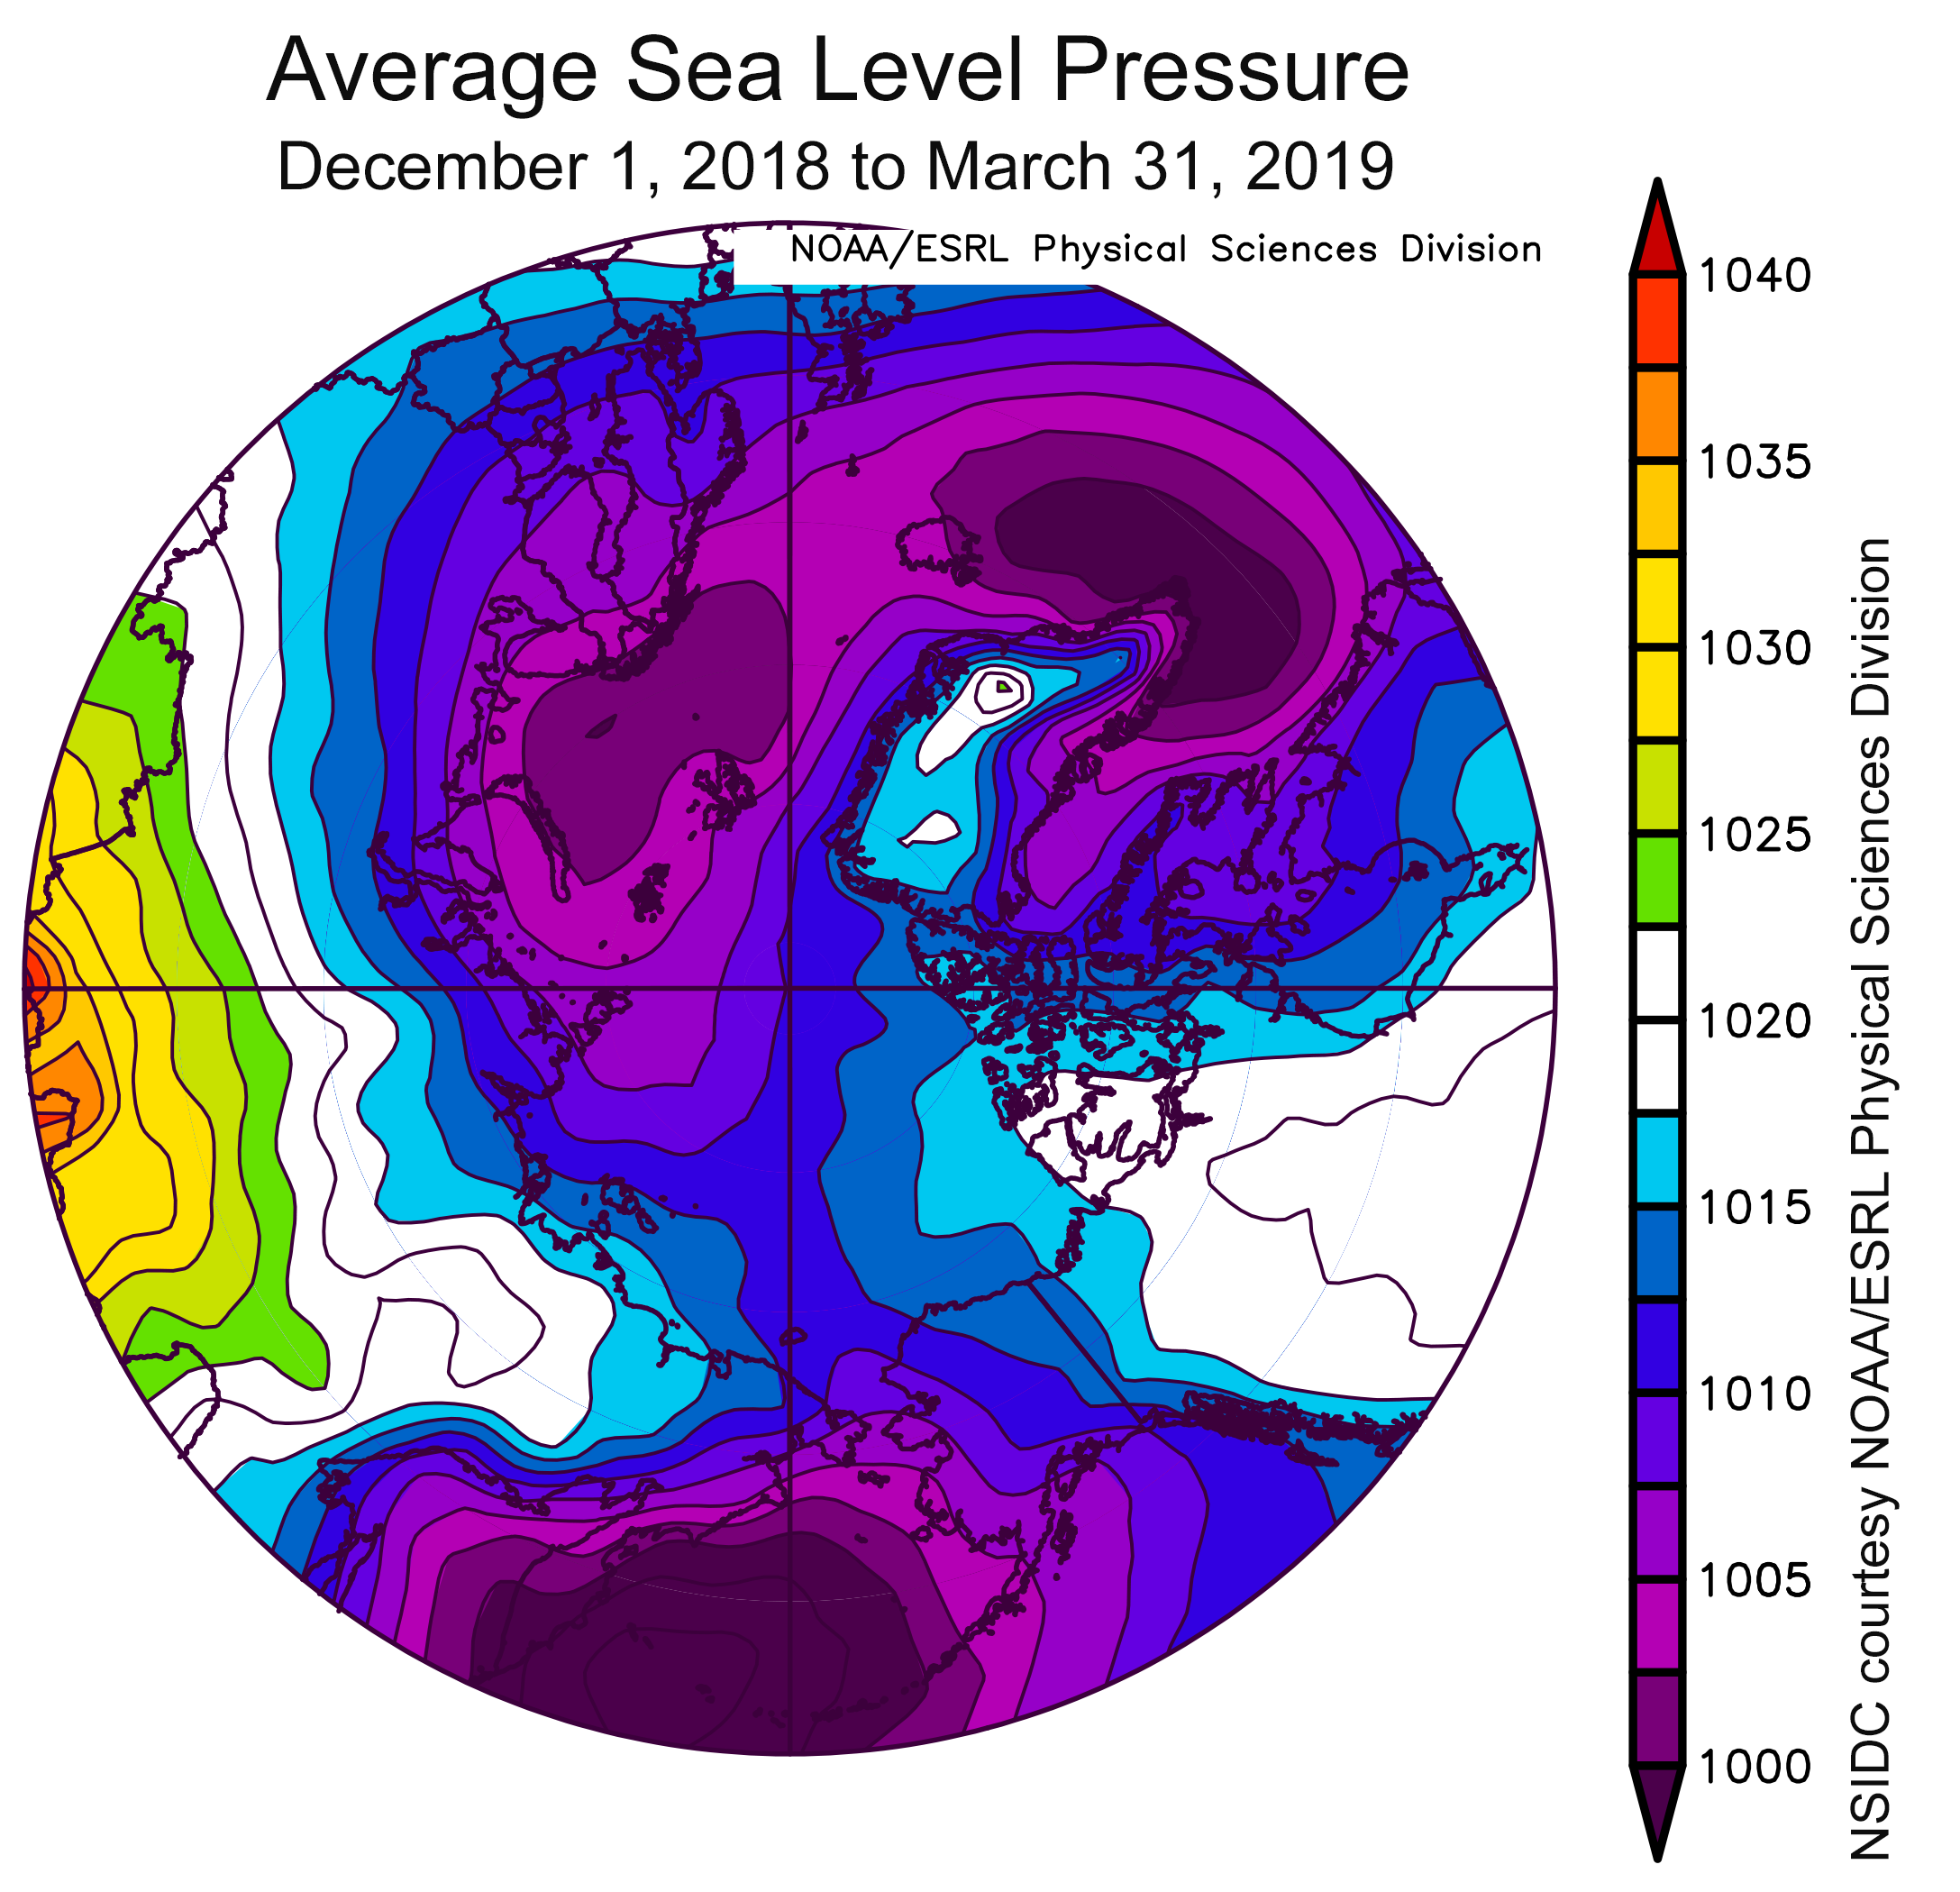
Figure 4. This plot shows average sea level pressure in the Arctic in millibars (hPa) from December 1, 2018 to March 31, 2019. Yellows and reds indicate high air pressure; blues and purples indicate low pressure.
Credit: NSIDC courtesy NOAA Earth System Research Laboratory Physical Sciences Division
High-resolution image
Moderation marked the 2018 to 2019 winter. Air temperatures at the 925 mb level were average to slightly above average over most of the Arctic Ocean, with only the southern Beaufort Sea being especially warm with temperatures 5 degrees Celsius (9 degrees Fahrenheit) higher than average.
Below average pressures at sea level dominated over the Bering Sea and much of the Eurasian side of the Arctic Ocean (Figure 4). Circulation patterns, however, were not especially unusual and there were no pronounced short-term heat waves of the type observed in recent winters. For much of the Arctic, sea ice extent was near average through most of the winter. As noted in a previous post, the most compelling feature of the winter was the substantial ice loss during February and early March in the Bering Sea, leading to nearly ice-free conditions.
Snow on sea ice
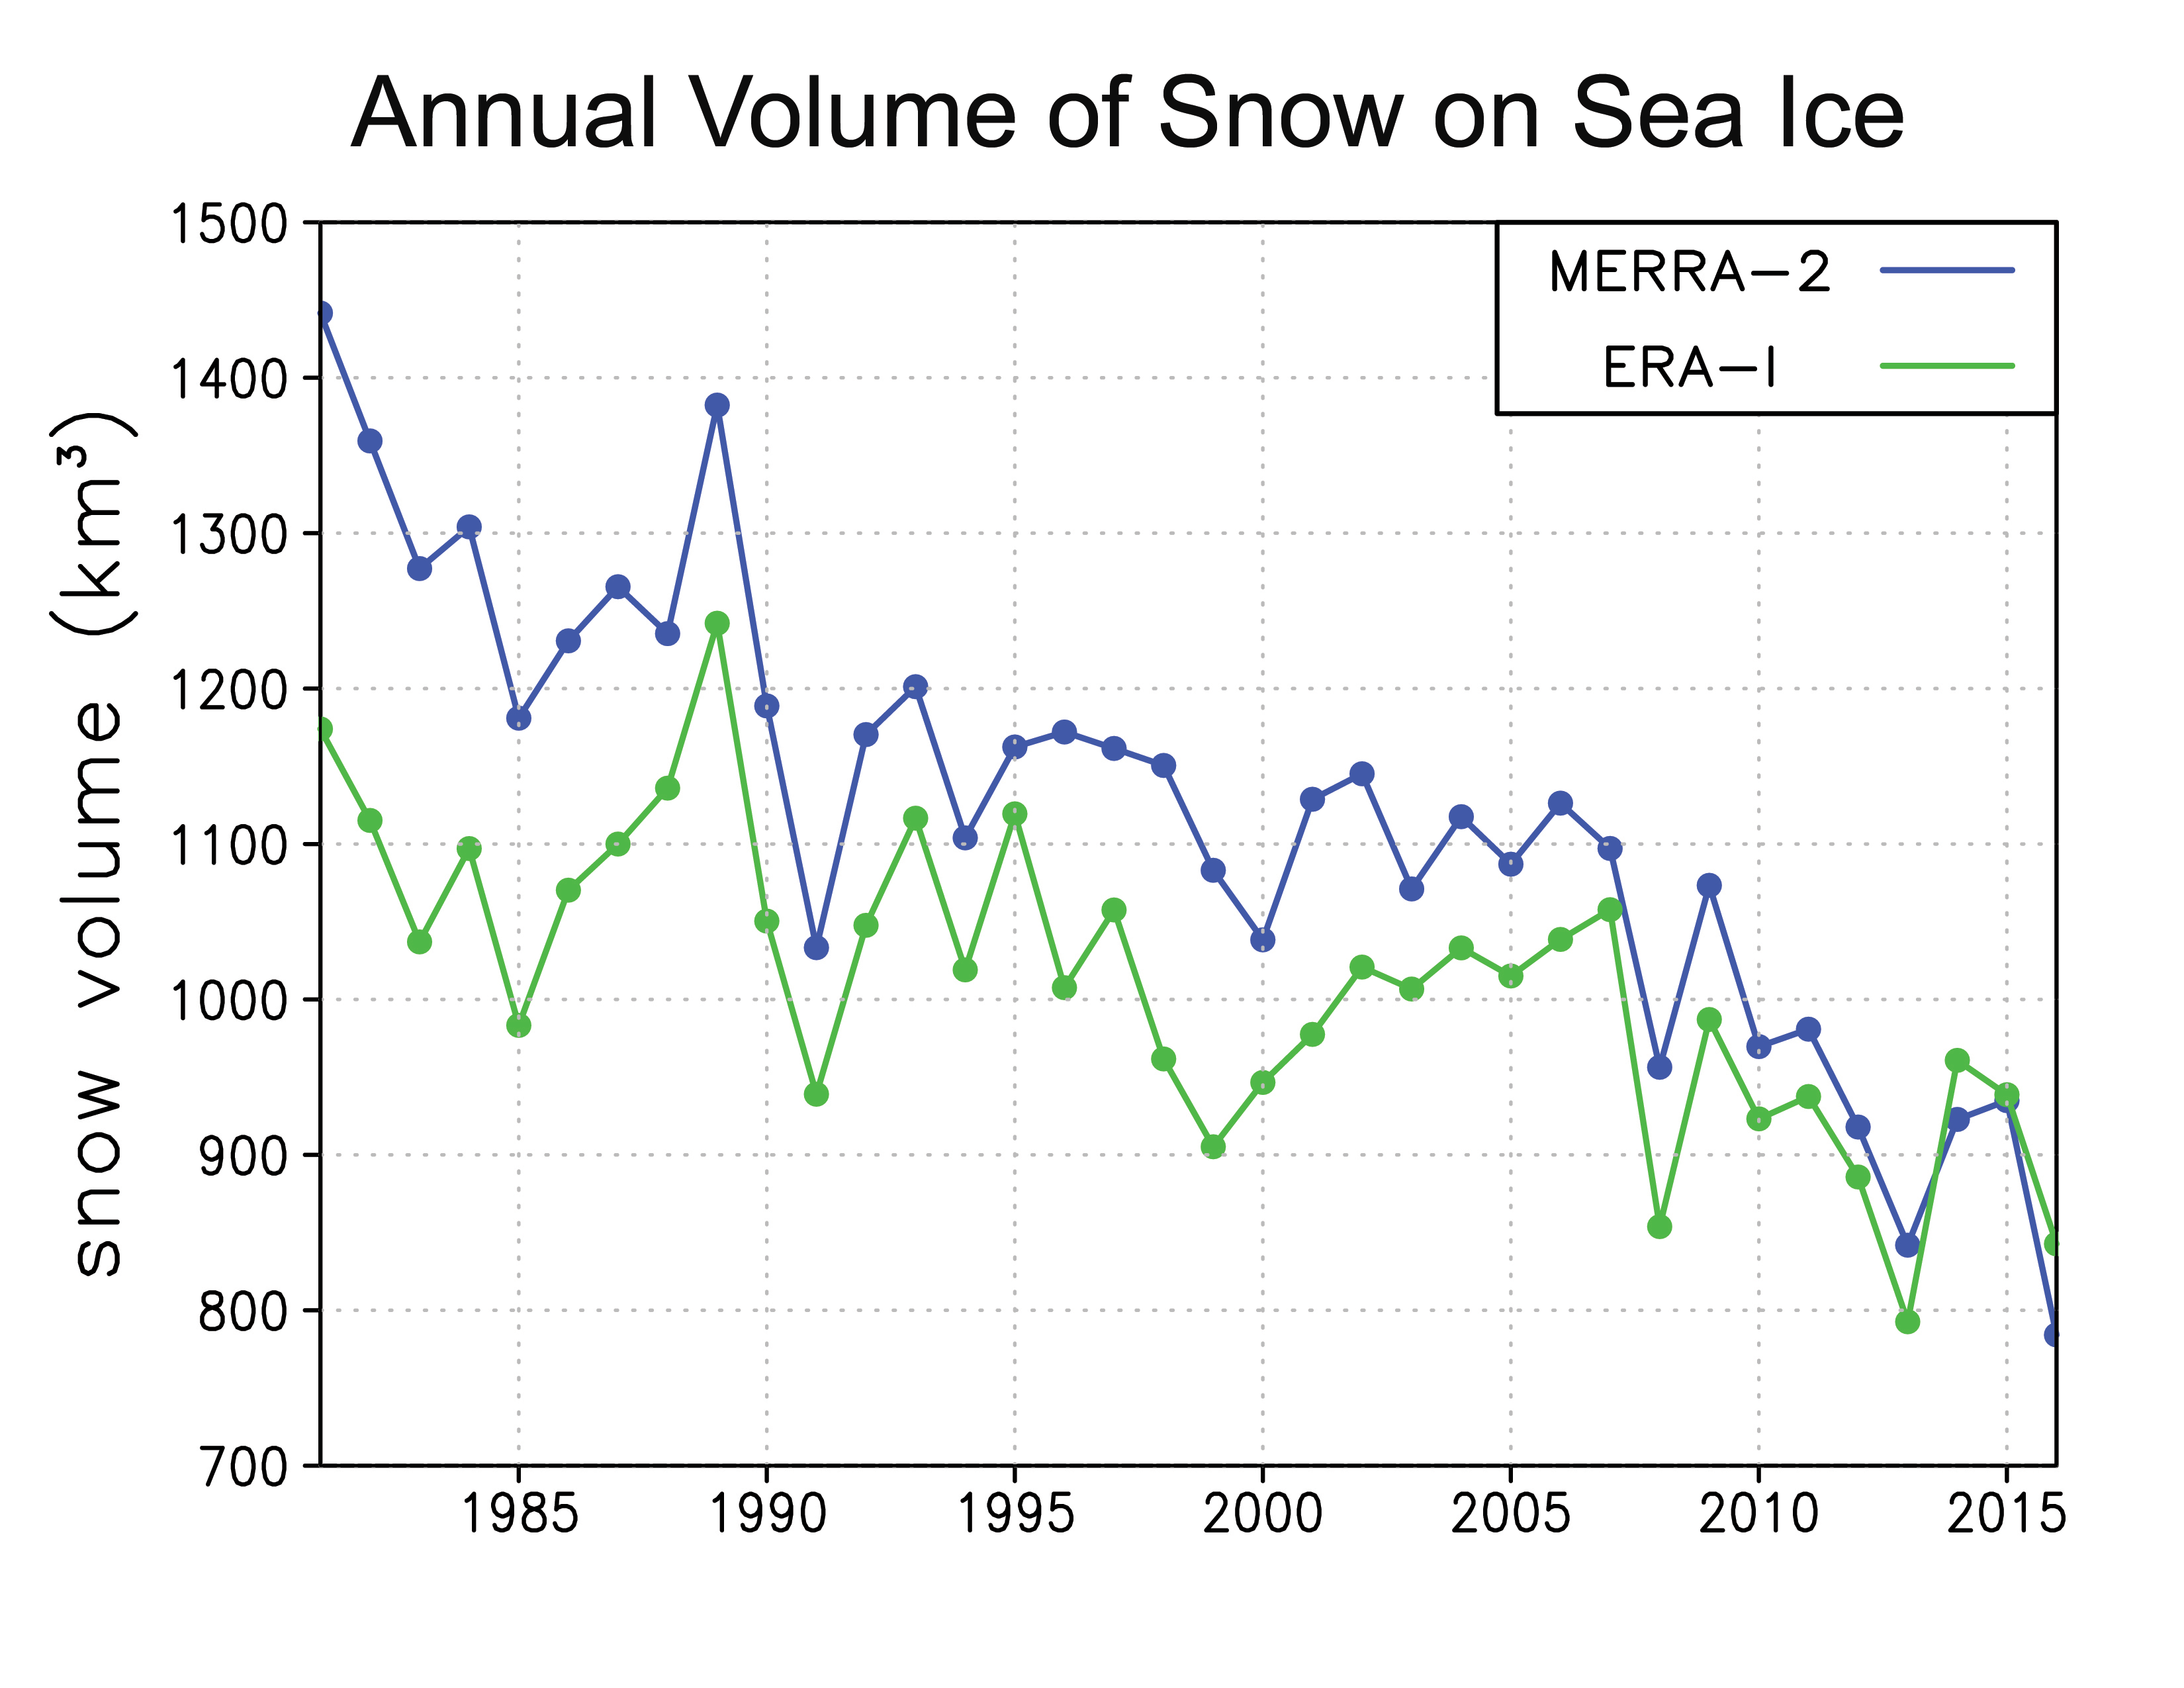
Figure 5a. This graph shows the annual volume of snow on sea ice from 1981 to 2016 based on reanalysis fields from NASA Modern-Era Retrospective analysis for Research and Applications-2 (MERRA-2) in blue and the European Centre for Medium-Range Weather Forecasts (ECMWF) ERA-Intermin (ERA-I) in green.
Credit: J. Stroeve, NSIDC
High-resolution image
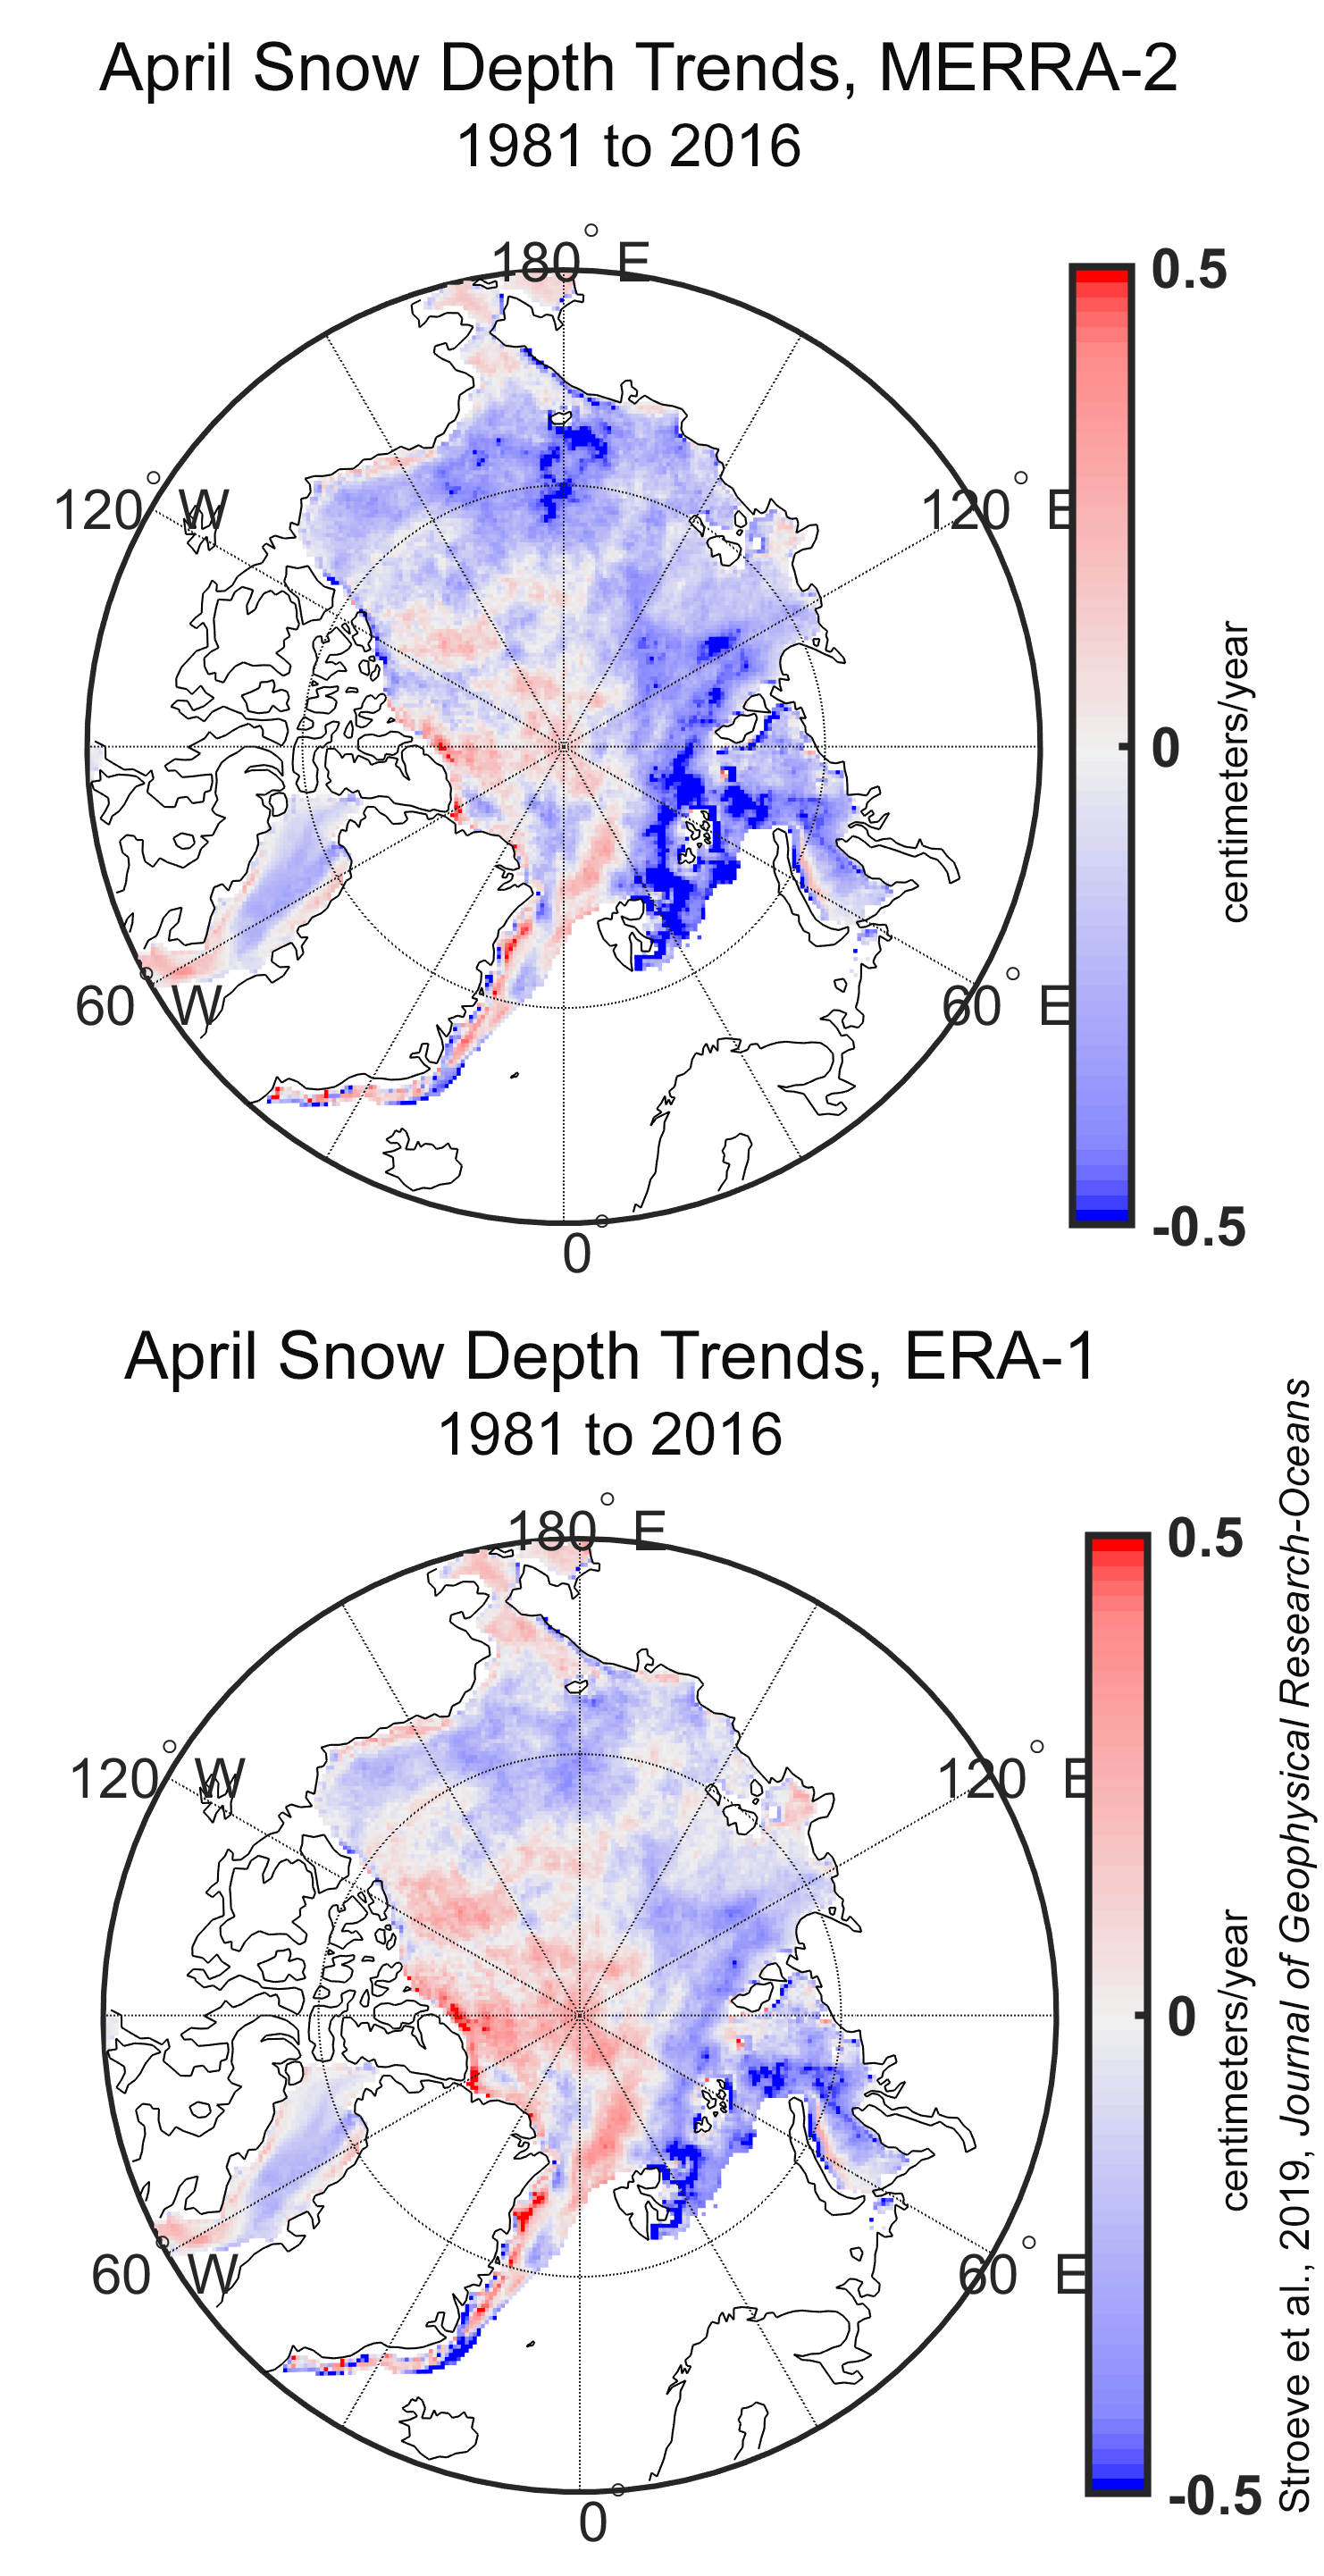
Figure 5b. The top map of the Arctic shows April trends in snow depth (in centimeters/year) from 1981 to 2016 based on NASA Modern-Era Retrospective analysis for Research and Applications-2 (MERRA-2). The bottom map of the Arctic shows April trends in snow depth (in centimeters/year) from 1981 to 2016 based on the European Centre for Medium-Range Weather Forecasts (ECMWF) ERA-Interim (ERA-I). The total volume of accumulation is measured from August through July, starting in the 1980 to 1981 winter.
Credit: Stroeve et al., 2019, Journal of Geophysical Research-Oceans
High-resolution image
With a general trend toward later sea ice formation in autumn and winter and earlier melt in spring and summer, the time period for snow accumulation on the sea ice is changing. However, snow on sea ice is something that satellites do not measure well. As a result, several different approaches have been used to assess snow on sea ice, ranging from using atmospheric reanalysis precipitation forecasts and applying simple temperature thresholds to simulating physical processes impacting snow on sea ice (e.g., wind redistribution, melt, snow compaction) using sophisticated models. A new model (SnowModel) was recently developed for sea ice applications by colleagues at Colorado State University, and is now providing daily snow depth and density estimates from 1980 onwards. A key challenge is that different atmospheric reanalyses, which are used as input to the model, depict different amounts of precipitation. However, regardless of which reanalysis is used, from newer systems such as the NASA Modern-Era Retrospective analysis for Research and Applications-2 (MERRA-2) to older systems, such as the European Centre for Medium-Range Weather Forecasts (ECMWF) ERA-Interim (ERA-I), the increasing open water season has reduced the amount of annual snow being accumulated on the sea ice (Figure 5a and 5b). However, there is a lot of spatial variability in trends. There are trends toward shallower April snow depth over the coastal seas and trends toward deeper snow over the central Arctic Ocean. Snow on sea ice plays several important roles such as influencing rates of thermodynamic ice growth each winter, melt pond development in summer, and melt water input to the upper ocean. Snow on sea ice also has important biological consequences by changing the amount of sunlight able to penetrate the ice.
Antarctic autumn—slow rise
As noted in last month’s post, Antarctica’s annual minimum extent occurred on March 1, the seventh lowest in the satellite record. Since the minimum, ice extent has increased at a slower-than-average pace, remaining well below the inter-decile (10 to 90 percent) range of past early autumn extents. Sea ice growth during March 2019 has been greatest in the central Ross Sea and northeastern Weddell Seas, with significant ice retreat continuing in the southern Bellingshausen Sea. In keeping with the relatively slow ice growth, air temperatures at the 925 mb level have been 2 to 4 degrees Celsius (4 to 7 degrees Fahrenheit) above the 1981 to 2010 average along much of the Antarctica coast from Wilkes Land eastward to the Ross, Amundsen, Bellingshausen, and Peninsula regions. Temperatures along the Dronning Maud Land coast have been 1 to 2 degrees Celsius (2 to 4 degrees Fahrenheit) below average. The atmospheric circulation at sea level has been characterized by three regions of higher than average pressure interspersed with areas of lower than average pressure, termed a wave-3 pattern by climate scientists. In particular, low pressure in the Amundsen Sea area and high pressure in the Drake Passage (between South American and the Antarctic Peninsula) produced strong winds from the northwest along the southern Peninsula, driving sea ice retreat there while other regions generally saw growth in sea ice extent.
Further reading
Stroeve, J., G. E. Liston, S. Buzzard, A. Barrett, M. Tschudi, M. Tsamados and J. S. Stewart. 2019. A lagrangian snow-evolution system for sea ice applications. Journal Geophysical Research-Oceans, submitted.
Liston, G. E., C. Polashenski, A. Roesel, P. Itkin, J. King, I. Merkouriadi and J. Haapala. 2018. A distributed snow-evolution model for sea-ice applications (SnowModel). Journal Geophysical Research-Oceans. doi.org/10.1002/2017JC013706.

