April reached a new record Arctic low sea ice extent. Sea ice loss was rapid in the beginning of the month because of declines in the Sea of Okhotsk. The rate of ice loss slowed after early April, due in part to gains in extent in the Bering and Barents Seas. However, daily ice extent remained at record low levels throughout the month.
Overview of conditions
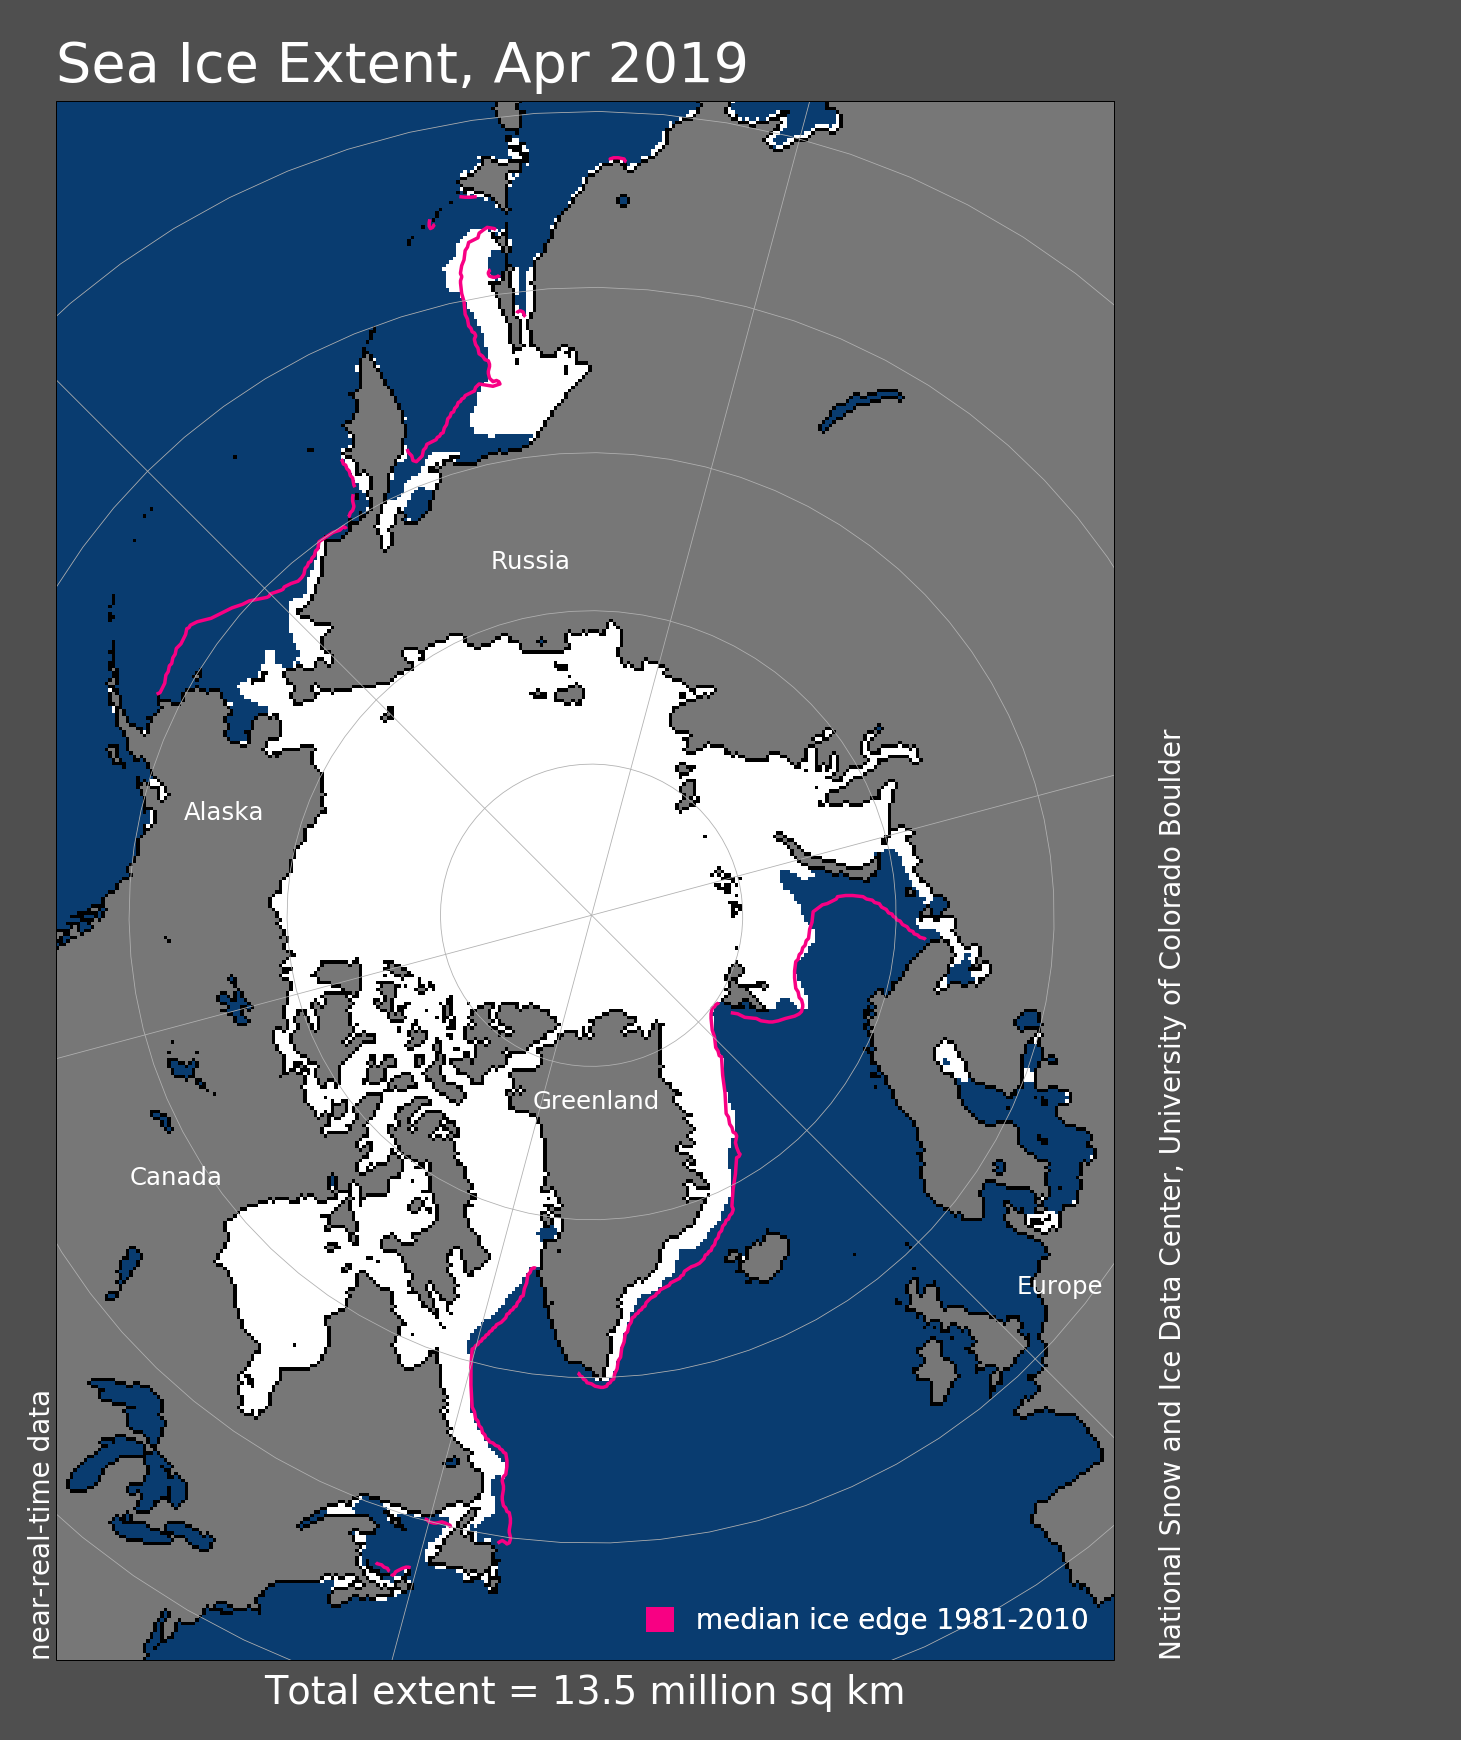
Figure 1. Arctic sea ice extent for April 2019 was 13.45 million square kilometers (5.19 million square miles). The magenta line shows the 1981 to 2010 average extent for that month. Sea Ice Index data. About the data
Credit: National Snow and Ice Data Center
High-resolution image
Arctic sea ice extent for April 2019 averaged 13.45 million square kilometers (5.19 million square miles). This was 1.24 million square kilometers (479,000 square miles) below the 1981 to 2010 long-term average extent and 230,000 square kilometers (89,000 square miles) below the previous record low set in April 2016.
Rapid ice loss occurred in the Sea of Okhotsk during the first half of April; the region lost almost 50 percent of its ice by April 18. Although sea ice was tracking at record low levels in the Bering Sea from April 1 to 12, the ice cover expanded later in the month. Elsewhere, there was little change except for small losses in the Gulf of St. Lawrence, the southern part of the East Greenland Sea, and southeast of Svalbard. In addition, open water areas developed along coastal regions of the Barents Sea. The ice edge expanded slightly east of Novaya Zemlya.
Conditions in context
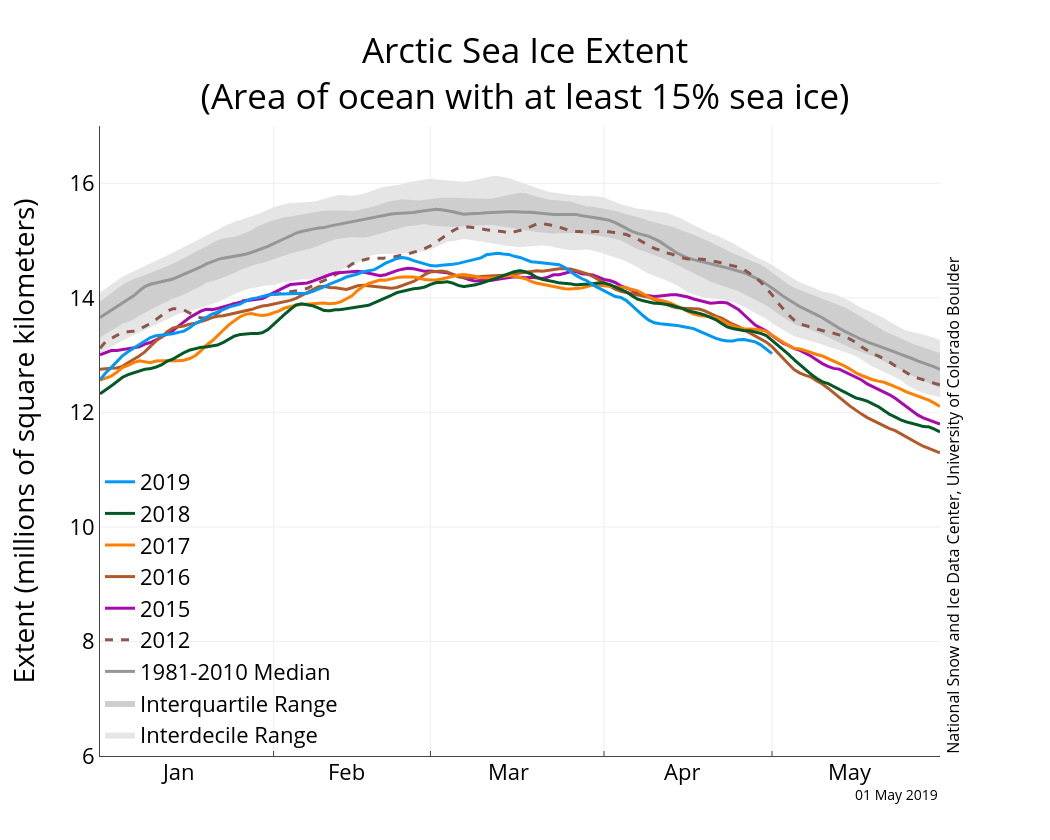
Figure 2a. The graph above shows Arctic sea ice extent as of May 1, 2019, along with daily ice extent data for four previous years and 2012. 2019 is shown in blue, 2018 in green, 2017 in orange, 2016 in brown, 2015 in purple, and 2012 in dotted brown. The 1981 to 2010 median is in dark gray. The gray areas around the median line show the interquartile and interdecile ranges of the data. Sea Ice Index data.
Credit: National Snow and Ice Data Center
High-resolution image
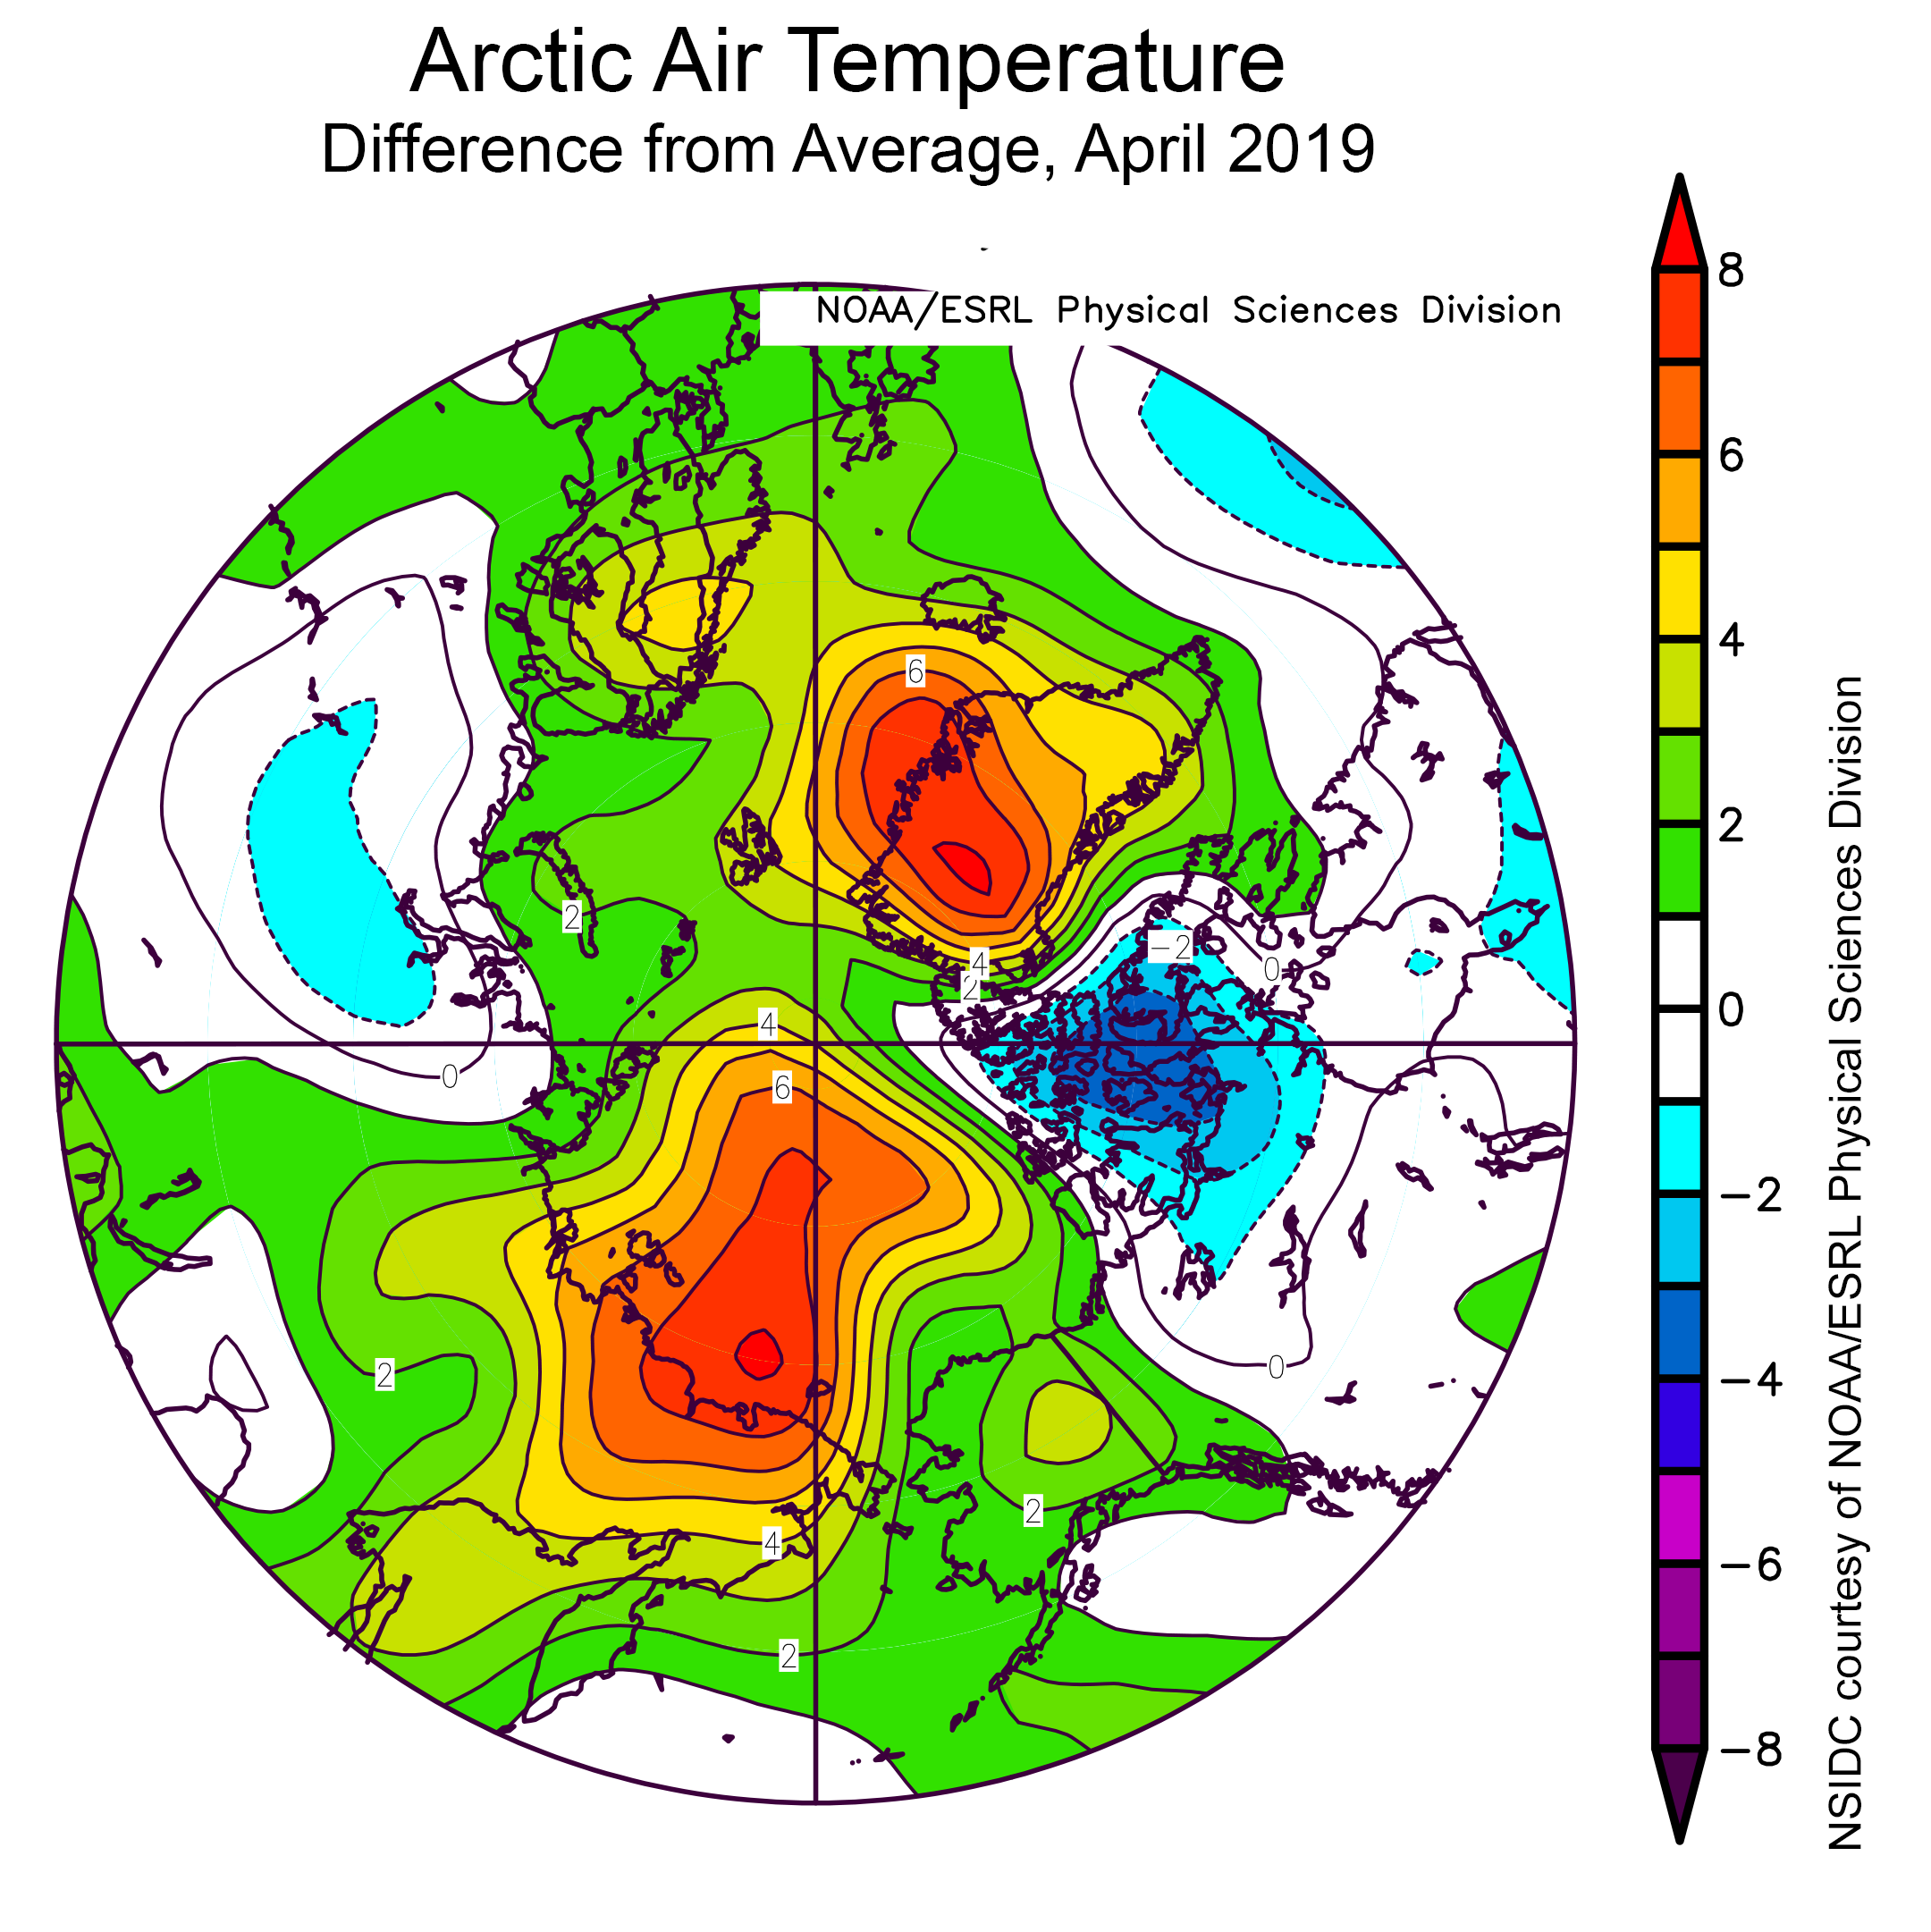
Figure 2b. This plot shows the departure from average air temperature in the Arctic at the 925 hPa level, in degrees Celsius, for April 2019. Yellows and reds indicate higher than average temperatures; blues and purples indicate lower than average temperatures.
Credit: NSIDC courtesy NOAA Earth System Research Laboratory Physical Sciences Division
High-resolution image
Air temperatures at the 925 hPa level (approximately 2,500 feet above the surface) were above average across the Arctic during the first two weeks of April, especially over the East Siberian Sea and the Greenland Ice Sheet where air temperatures were as much as 9 degrees Celsius (16 degrees Fahrenheit) above average (Figure 2b). Elsewhere, 925 hPa temperatures were between 3 to 5 degrees Celsius (5 to 9 degrees Fahrenheit) above average, including the Sea of Okhotsk where ice loss early in the month was especially prominent. These relatively warm conditions were linked to a pattern of high sea level pressure over the Beaufort Sea paired with low sea level pressure over Alaska, Siberia, and the Kara and Barents Seas. This drove warm air from the south over the East Siberian Sea. Similarly, high pressure over Greenland and the North Atlantic, coupled with low sea level pressure within Baffin Bay, helped usher in warm air over southern Greenland from the southeast.
During the second half of the month, temperatures remained above average over most of the Arctic Ocean, and up to 8 degrees Celsius (14 degrees Fahrenheit) above average over the East Greenland Sea. However, temperatures were 1 to 5 degrees Celsius (2 to 9 degrees Fahrenheit) below average over the Bering Sea, and up to 8 degrees Celsius (14 degrees Fahrenheit) below average over the Canadian Arctic Archipelago. Air temperatures were slightly below average in the Kara Sea.
April 2019 compared to previous years
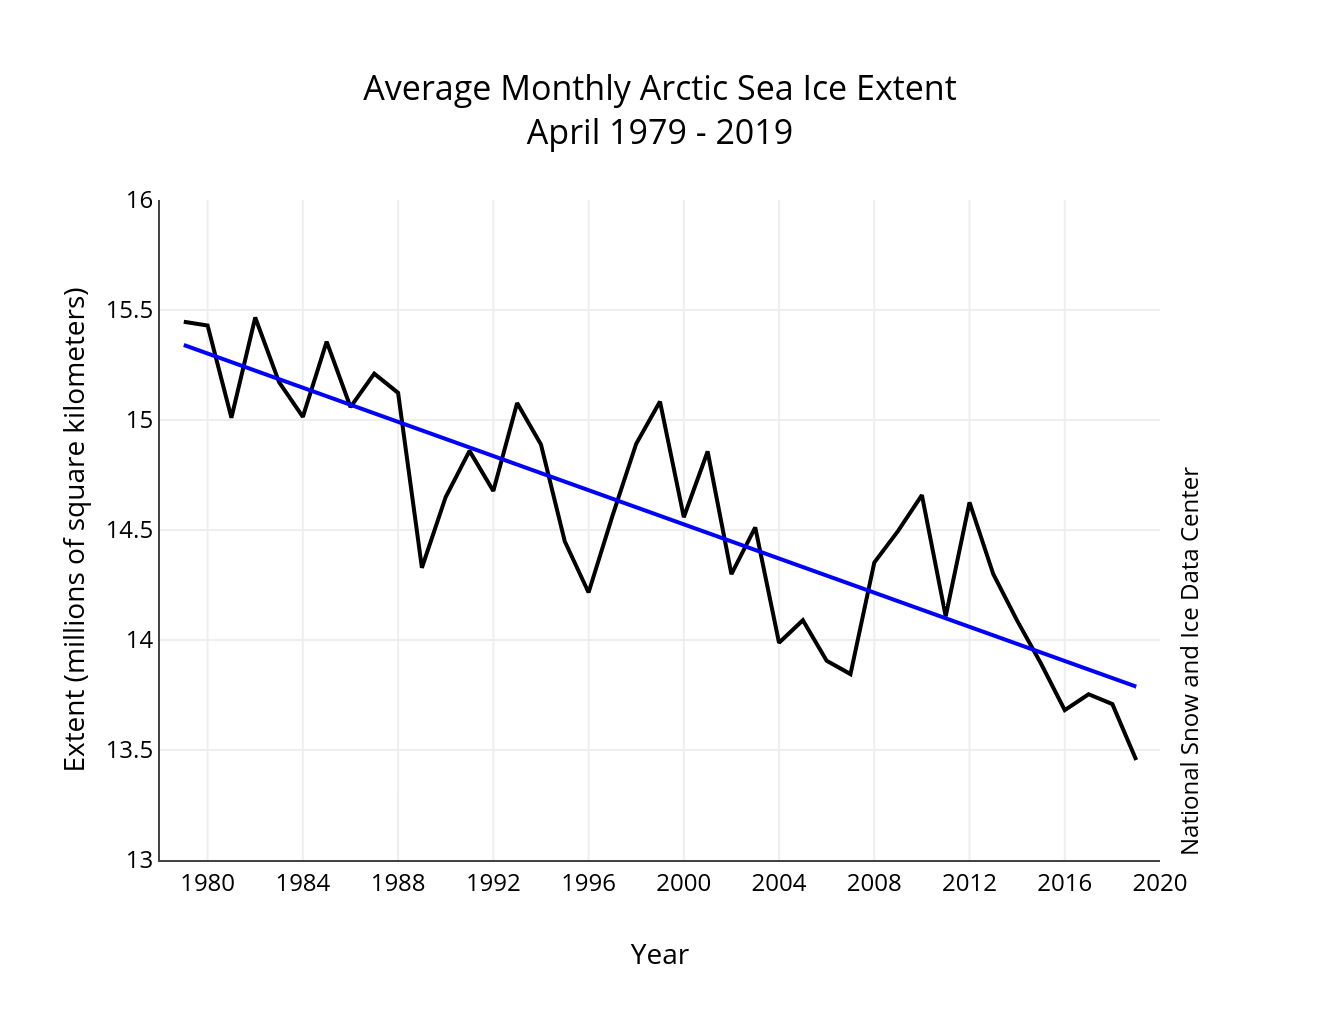
Figure 3. Monthly April ice extent for 1979 to 2019 shows a decline of 2.64 percent per decade.
Credit: National Snow and Ice Data Center
High-resolution image
The 1979 to 2019 linear rate of decline for April ice extent is 38,800 square kilometers (15,000 square miles) per year, or 2.64 percent per decade relative to the 1981 to 2010 average.
Sea ice age update
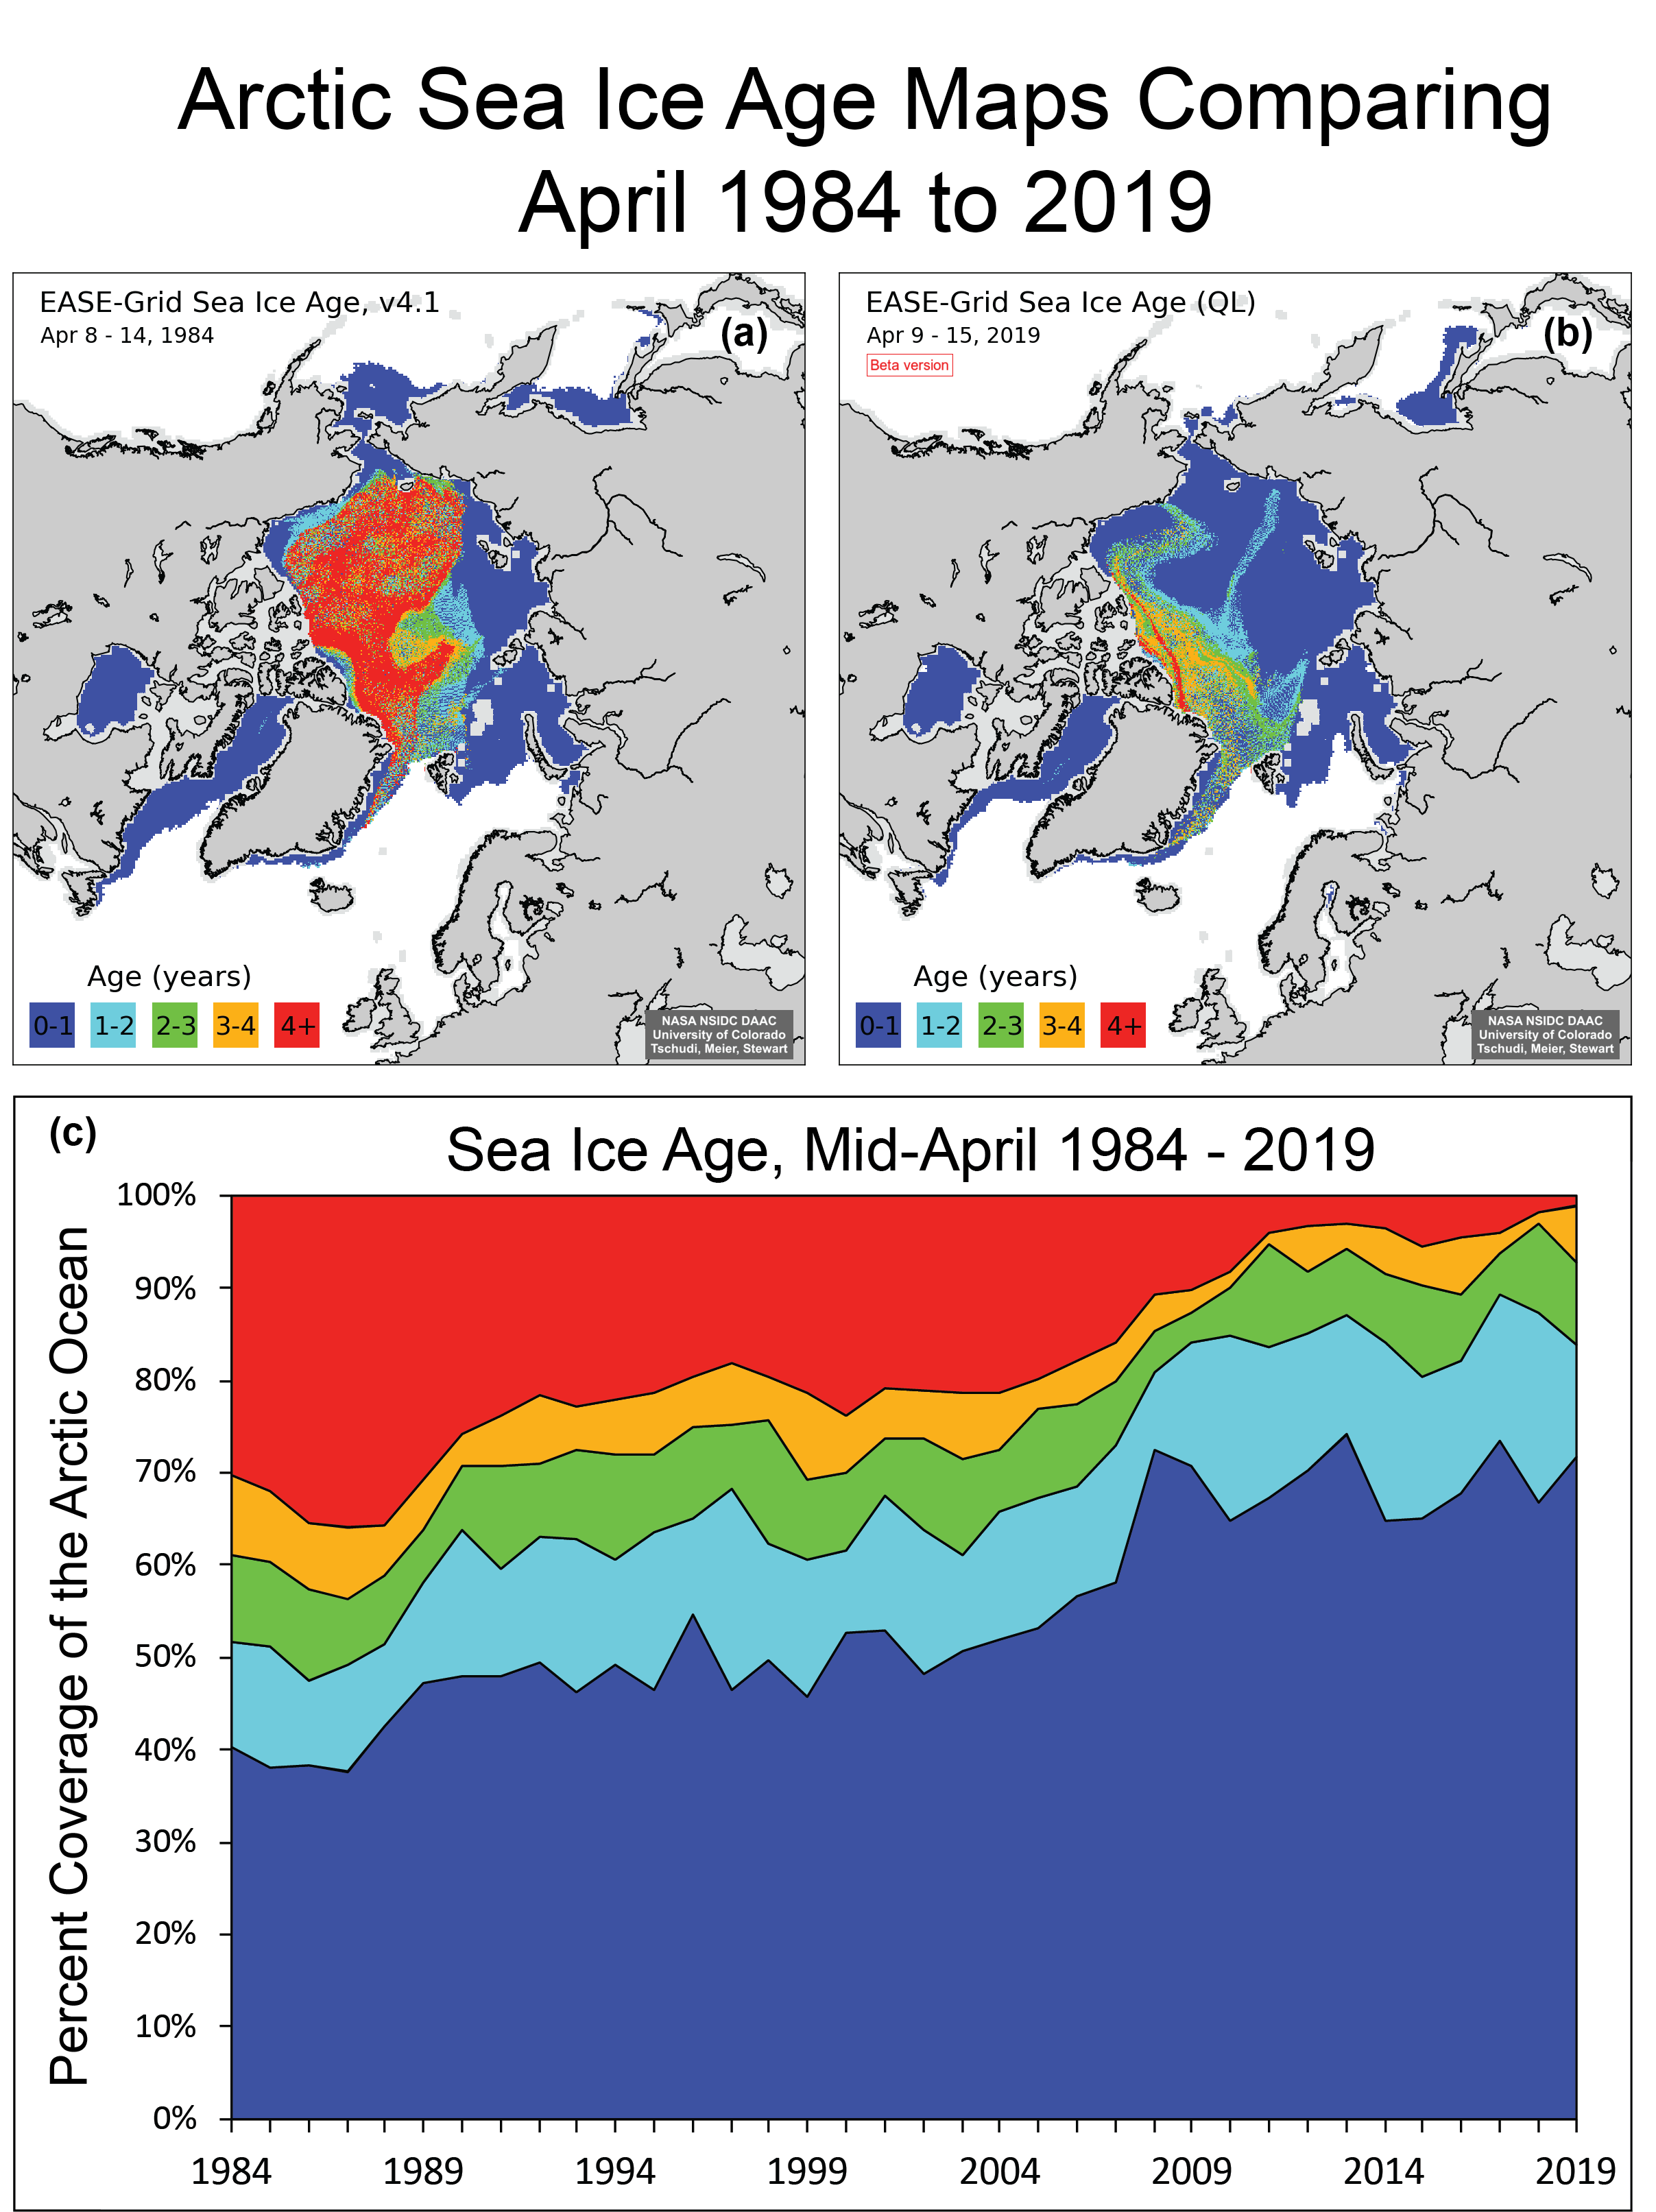
Figure 4. The top maps compare Arctic sea ice age for (a) April 8 to 14, 1984, and (b) April 9 to 15, 2019. The time series (c) of mid-April sea ice age as a percentage of Arctic Ocean coverage from 1984 to 2019 shows the nearly complete loss of 4+ year old ice; note the that age time series is for ice within the Arctic Ocean and does not include peripheral regions where only first-year (0 to 1 year old) ice occurs, such as the Bering Sea, Baffin Bay, Hudson Bay, and the Sea of Okhotsk.
Credit: W. Meier, NSIDC
High-resolution image
Younger sea ice tends to be thinner than older ice. Therefore, sea ice age provides an early assessment of the areas most susceptible to melting out during the coming summer. The Arctic sea ice cover continues to become younger (Figure 4), and therefore, on average, thinner. Nearly all of the oldest ice (4+ year old), which once made up around 30 percent of the sea ice within the Arctic Ocean, is gone. As of mid-April 2019, the 4+ year-old ice made up only 1.2 percent of the ice cover (Figure 4c). However, 3 to 4-year-old ice increased slightly, jumping from 1.1 percent in 2018 to 6.1 percent this year. If that ice survives the summer melt season, it will somewhat replenish the 4+ year old category going into the 2019 to 2020 winter. However, there has been little such replenishment in recent years.
The sea ice age data products were recently updated through 2018 (Version 4, Tschudi et al., 2019). Data is available here. In addition, an interim QuickLook product that will provide preliminary updates every month is in development.
Changing ice and sediment transport

Figure 5a. This map shows the main sea ice drift patterns.
Figure 5b. This illustration shows how sediments can be ingrained into the newly forming sea ice.
Figure 5c. This graph shows the probability that newly formed ice in the winter will survive the summer.
Credit: T. Krumpen
High-resolution image
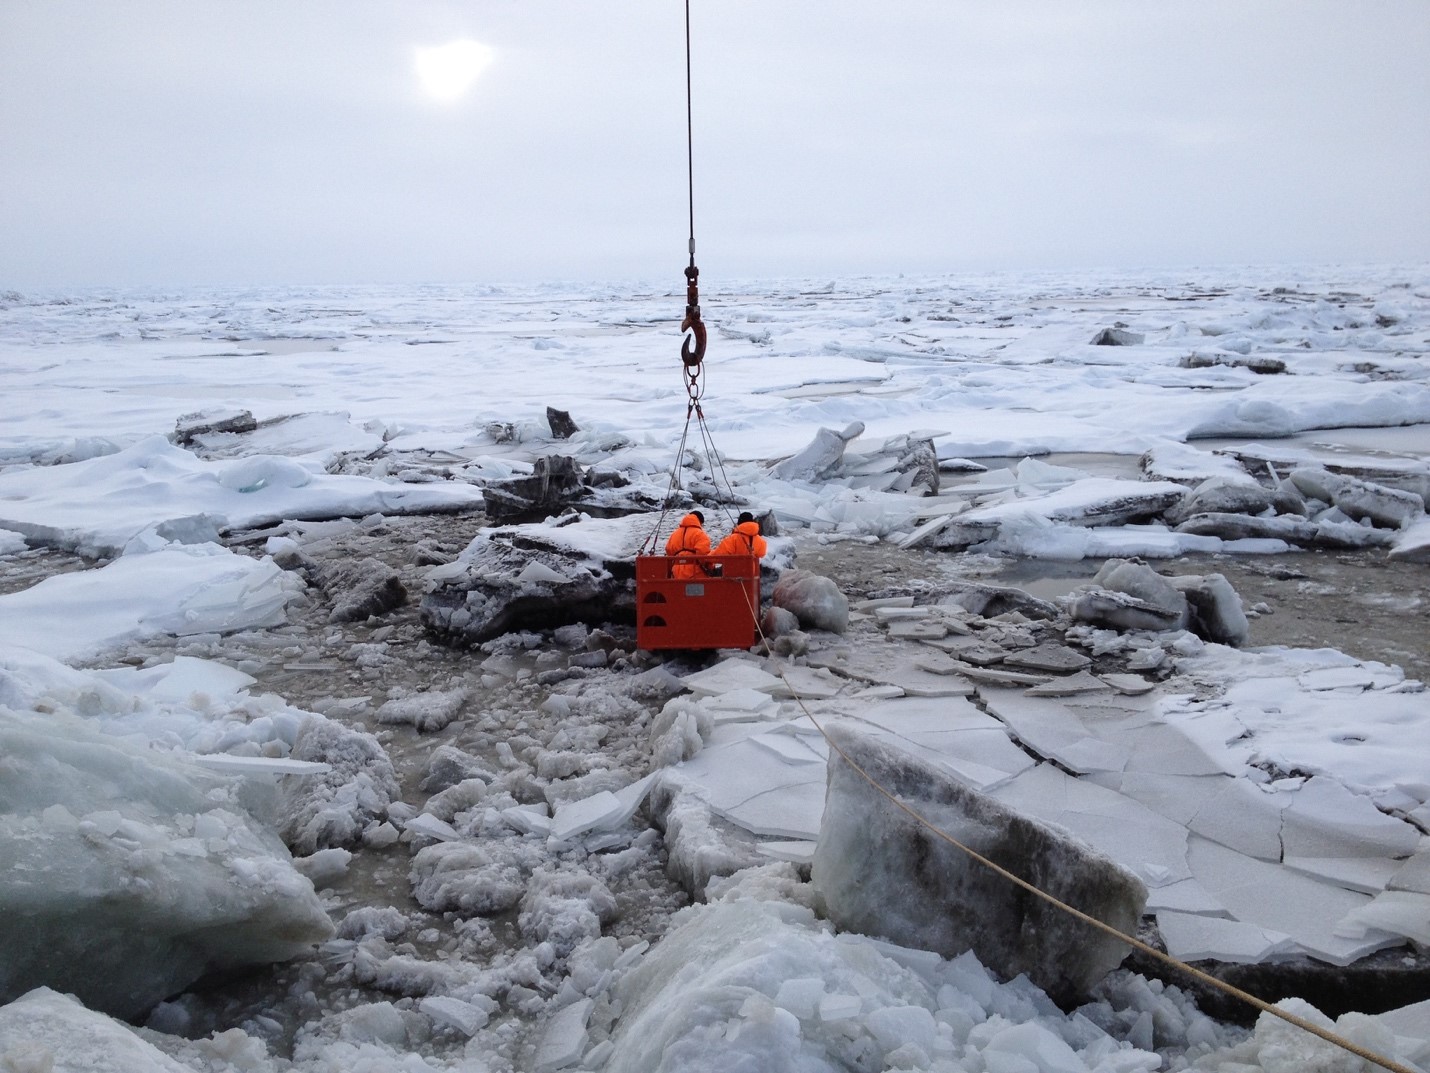
Figure 5d. This image shows sediment-rich sea ice in the Transpolar Drift Stream. A crane lowers two researchers from the decks of the icebreaker RV Polarstern to the surface of the ice to collect samples.
Photo Credit: R. Stein, Alfred Wegener Institut
High-resolution image
Scientists from the Alfred Wegener Institut (AWI) monitored and analyzed sea ice motion using satellite data from 1998 to 2017 and concluded that only 20 percent of the sea ice that forms in the shallow Russian seas of the Arctic Ocean now reaches the central Arctic Ocean to join the Transpolar Drift Stream (Figures 5a and b). The Russian seas, including the Kara, Laptev, and East Siberian Seas, are considered the ice nursery of the Arctic. The remaining 80 percent of this first-year ice melts before it has a chance to leave this nursery. Prior to the year 2000, that number was about 50 percent (Figure 5c).
These conclusions find support from sea ice thickness observations in Fram Strait, which is fed by the Transpolar Drift Stream. AWI scientists regularly gather ice thickness data in Fram Strait as part of their IceBird program. The ice now leaving the Arctic Ocean through the Fram Strait is, on average, 30 percent thinner than it was 15 years ago. There are two reasons for this. First, winters are warmer and the melt season now begins much earlier than it used to. Second, much of this ice no longer forms in the shallow seas, but much farther north. As a result, it has less time to thicken from winter growth and/or ridging as it drifts across the Arctic Ocean.
These changes in transport and melt affect biogeochemical fluxes and ecological processes in the central Arctic Ocean. For example, in the past, the sea ice that formed along the shallow Russian seas transported mineral material, including dust from the tundra and steppe, to the Fram Strait (Figure 5d). Today, the melting floes release this material en route to the central Arctic Ocean. Far less material now reaches the Fram Strait and it is different in composition. This finding is based on two decades of data sourced from sediment traps maintained in the Fram Strait by AWI biologists. Instead of Siberian minerals, sediment traps now contain remains of dead algae and microorganisms that grew within the ice as it drifted.
Putting current changes into longer-term perspective
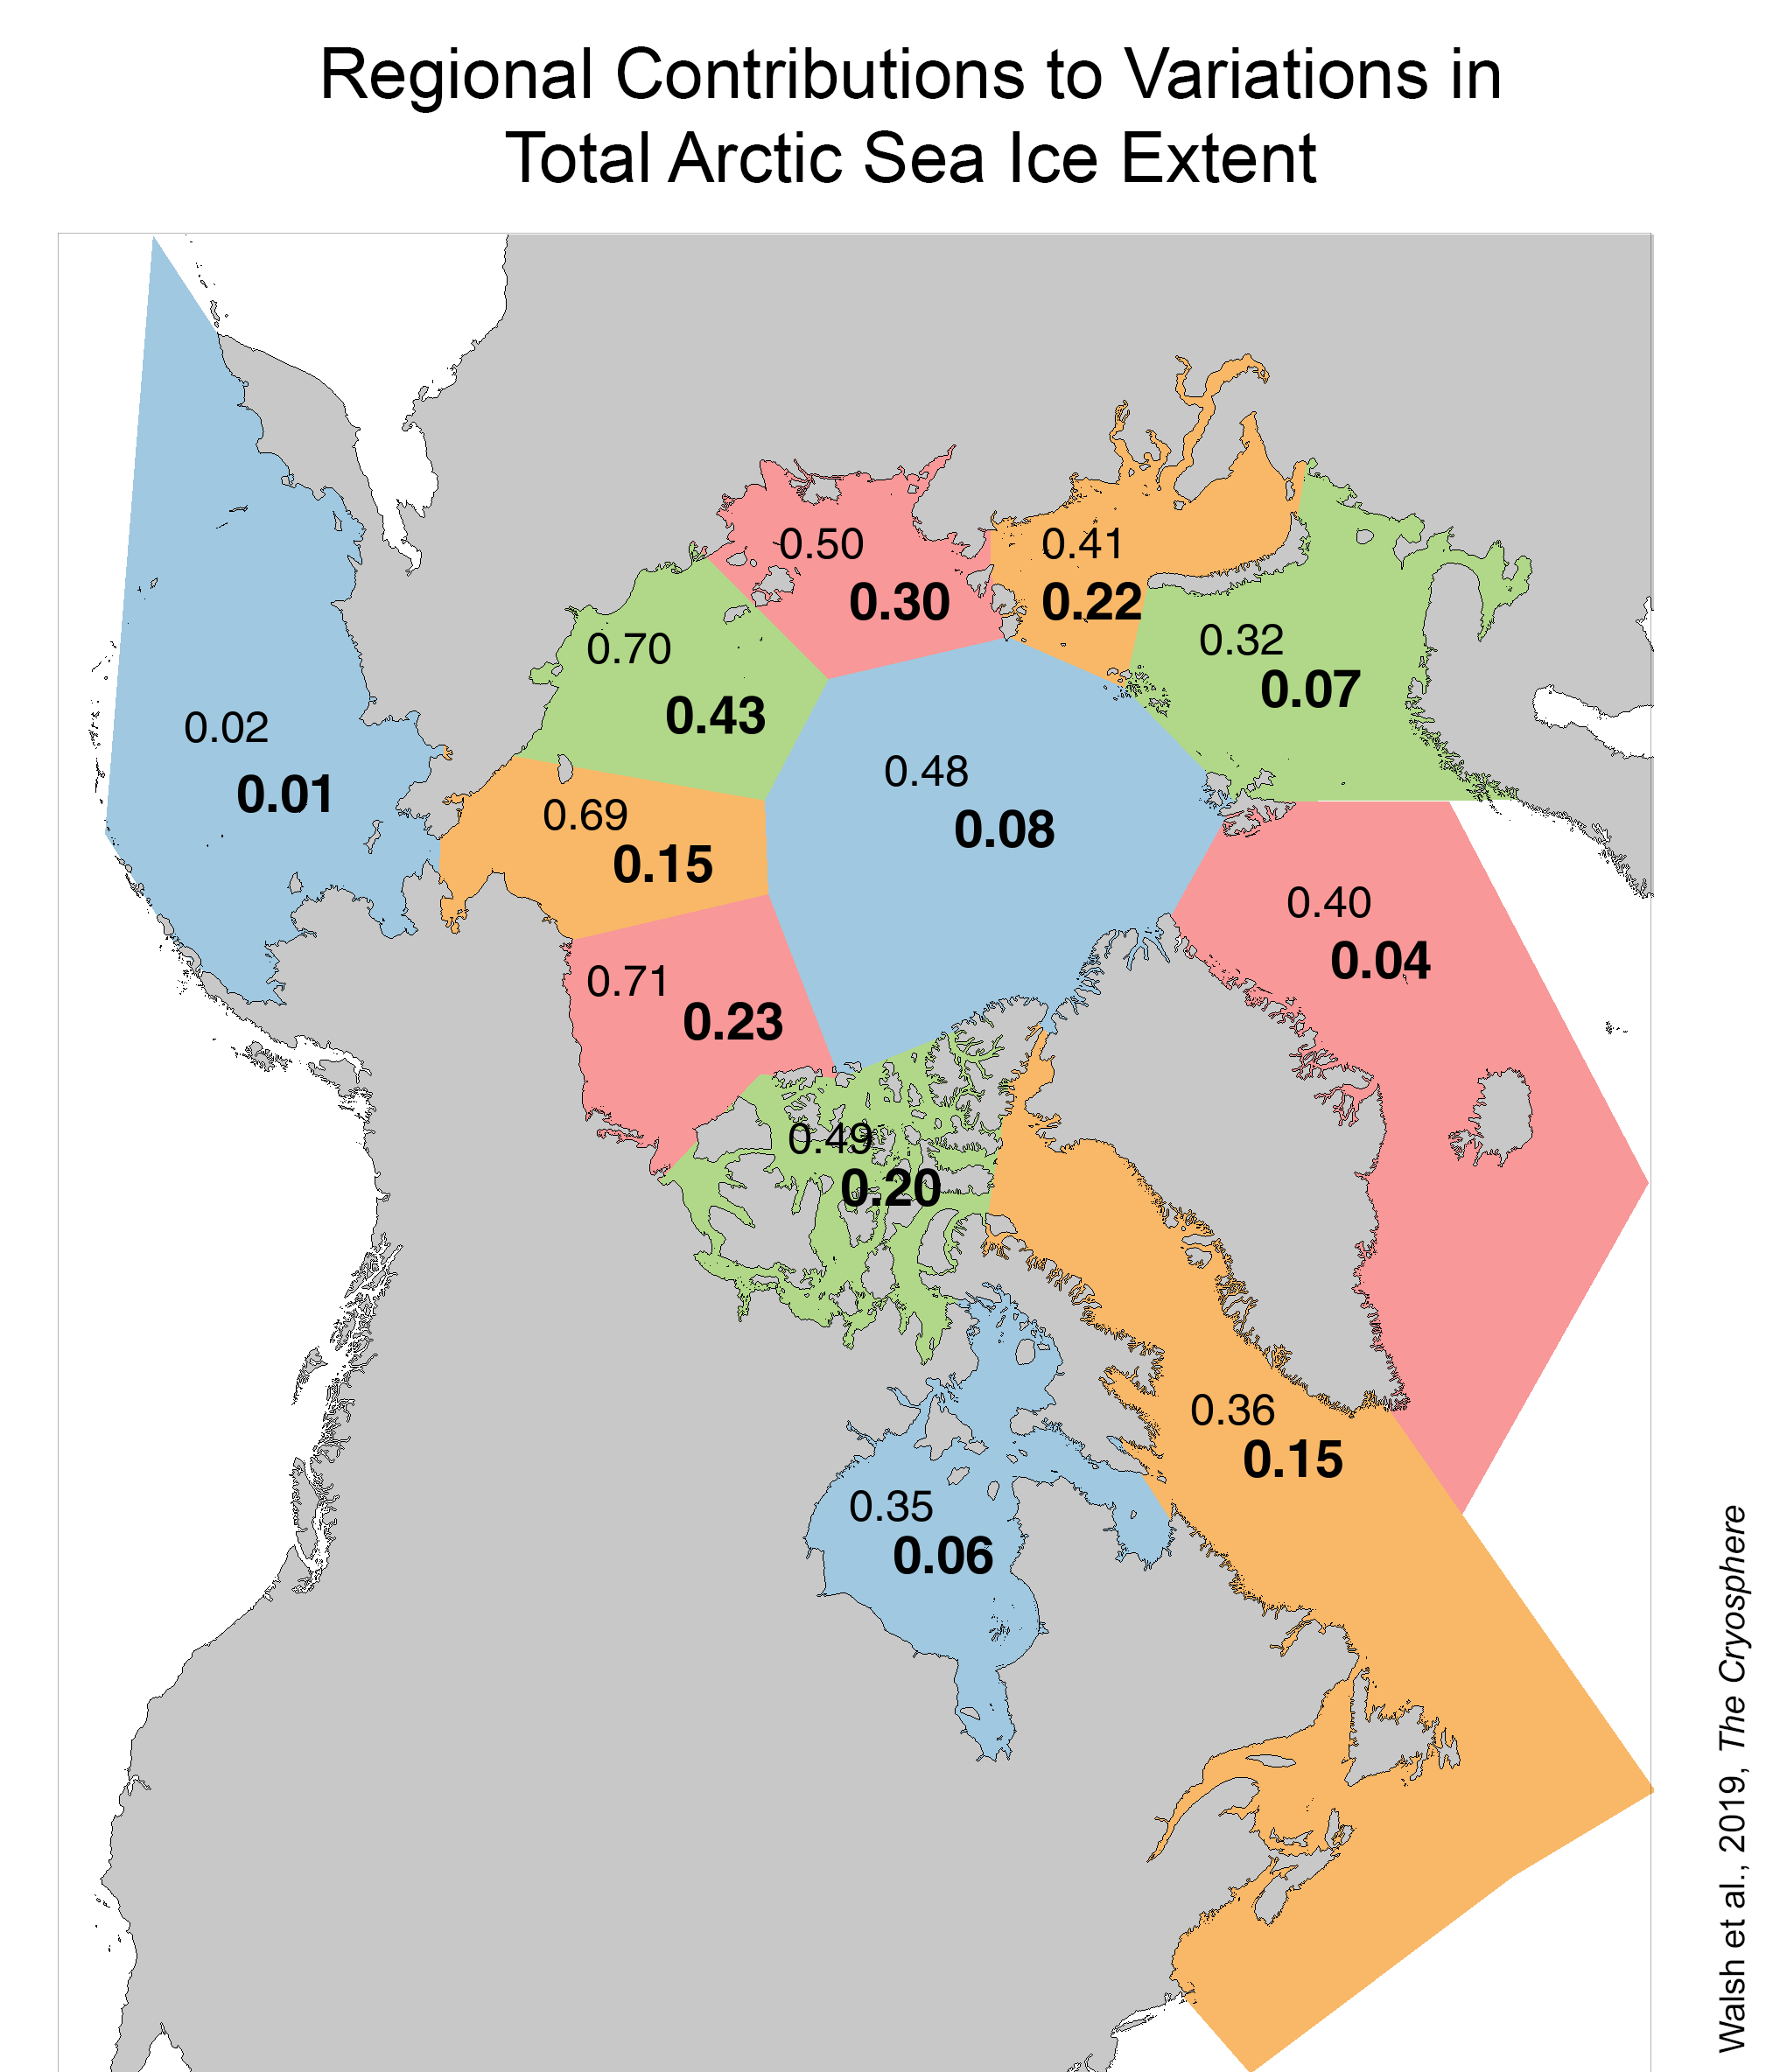
Figure 6. This map shows Arctic regions used in the Walsh et al. study and how much each area’s September extent contributes to the total September sea ice extent. The top number gives the percentage (as squares of correlations, or R2) when the raw 1953 to 2013 ice extent time series is used. The bottom number (bold) gives what the percentage drops to after the time series data have been detrended. For example, about 70 percent of the September Arctic-wide extent number is explained by the September extent in the seas north of Alaska, but that drops to about 20 percent once the trends have been removed.
Credit: Walsh et al., 2019, The Cryosphere
High-resolution image
While changes in sea ice extent over the past several decades are usually shown as linear trends, they can mask important variations and changes. A recent study led by John Walsh at University Alaska Fairbanks compared various trend-line fits to sea ice extent time series back to 1953, for the Arctic as a whole and various sub-regions. This data set extends the satellite record by using operational ice charts and other historical sources (Walsh et al., 2016). They found that a two-piece linear fit with a break point in the 1990s provides a more meaningful basis for calculations of sea ice departures from average conditions and their persistence, rather than a single trend line computed over the period 1953 to the present. Persistence of sea ice departures from average conditions represents the memory of the system, which can be used to forecast sea ice conditions a few months in advance. September Arctic-wide ice extent can also be predicted with some limited skill when the data include the trend. However, this apparent skill largely vanishes when the trend is removed from the data using the two-piece linear fit. This finding is consistent with the notion of a springtime predictability barrier, such that springtime sea ice conditions are usually not a strong predictor of the summer ice cover because atmospheric circulation patterns in summer erode this memory in the system. For example, despite the extensive coverage of fairly young—and hence thin—ice this spring, cool summer weather conditions may limit melt, leading to a higher September ice extent than might otherwise be expected.
April snow melt in Greenland—notable but not unusual
Temperatures were well above average over Greenland for much of April but were still below freezing except near the coast. Satellite data indicate that there was a small area surface melt on the southeastern coastal part of the ice sheet early in the month. In the last week of April, melt became more extensive, spreading further north on the east coast and starting on the west coast. While interesting, this is not especially unusual. Most years of the past decade have some surface melt in April. In 2012 and 2016, strong melt events occurred in April that covered a much larger area than in 2019. NSIDC is now tracking Greenland surface melt for 2019 on a daily basis.
Further reading
Krumpen, T., H. J. Belter, A. Boetius, E. Damm, C. Haas, S. Hendricks, M. Nicolaus, E.-M. Nöthig, S. Paul, I. Peeken, R. Ricker, and R. Stein. 2019. Arctic warming interrupts the Transpolar Drift and affects long range transport of sea ice and ice-rafted matter. Scientific Reports. doi:10.1038/s41598-019-41456-y.
Tschudi, M. A., W. N. Meier, and J. S. Stewart. 2019. An enhancement to sea ice motion and age products. The Cryosphere Discussion, in review. doi:10.5194/tc-2019-40.
Walsh, J. E., W. L. Chapman, and F. Fetterer. 2015, updated 2016. Gridded Monthly Sea Ice Extent and Concentration, 1850 Onward, Version 1. Boulder, Colorado USA. NSIDC: National Snow and Ice Data Center. doi:10.7265/N5833PZ5.
Walsh, J. E., J. S. Stewart, and F. Fetterer. 2019. Benchmark seasonal prediction skill estimates based on regional indices. The Cryosphere. doi:10.5194/tc-13-1073-2019.

