Arctic sea ice continued the fast retreat that was observed in July through August 10, followed by a brief slowdown, only to pick up pace again. During the first half of August, the ice primarily retreated in the northern Beaufort Sea and in the East Siberian Sea. The ice also mostly cleared out of the Northwest Passage, whereas ice remained in the Chukchi Sea, along the Northern Sea Route. In the Southern Ocean, sea ice began to expand rapidly after a slow growth from May through July, but remains at the second lowest daily extent as of this post.
Overview of conditions
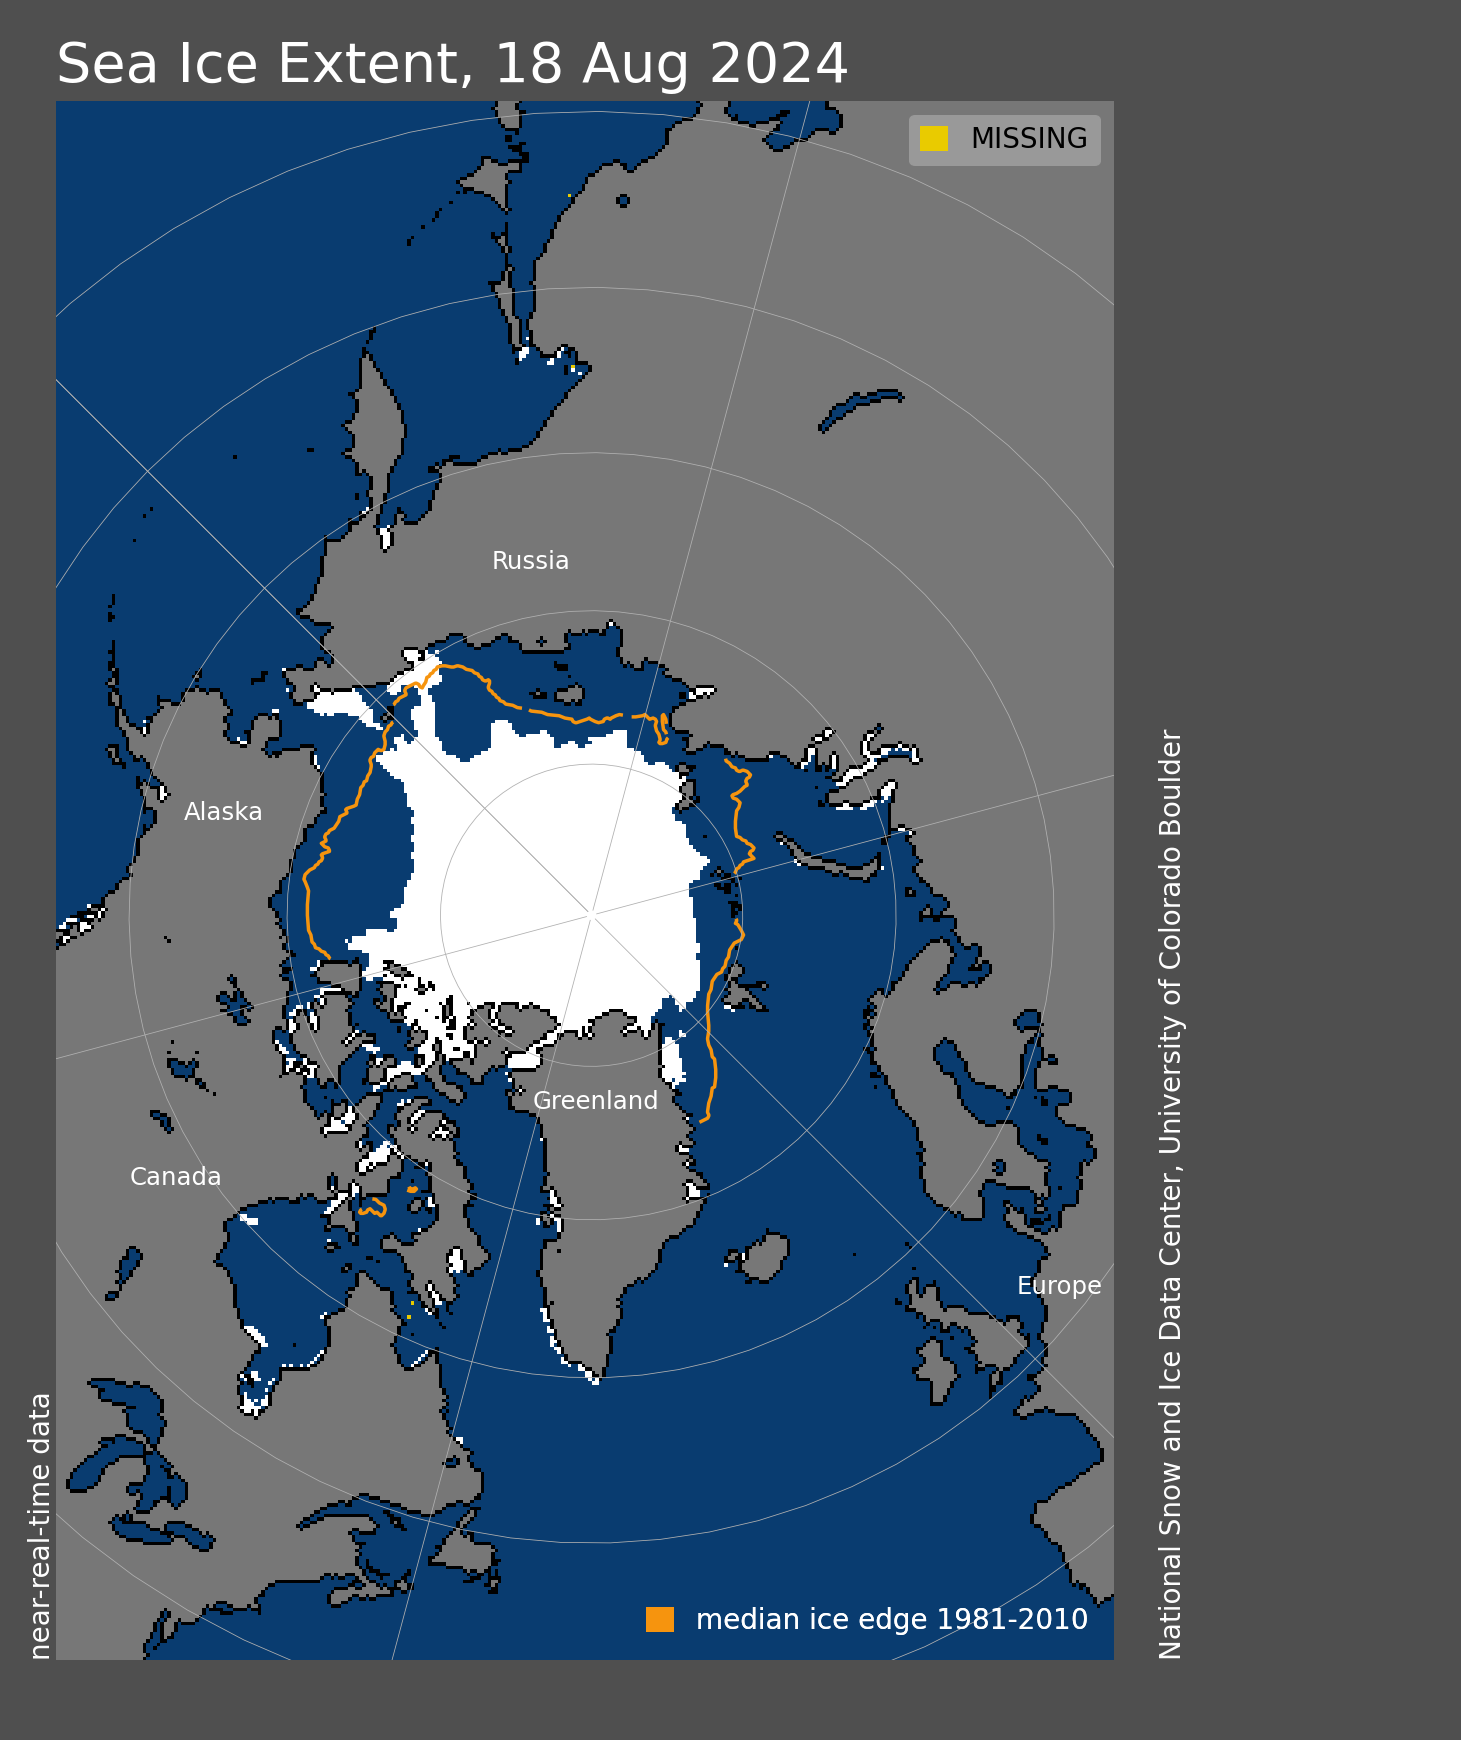
Figure 1a. Arctic sea ice extent for August 18, 2024, was 5.20 million square kilometers (2.01 million square miles). The orange line shows the 1981 to 2010 average extent for that day. Sea Ice Index data. About the data
Credit: National Snow and Ice Data Center
High-resolution image
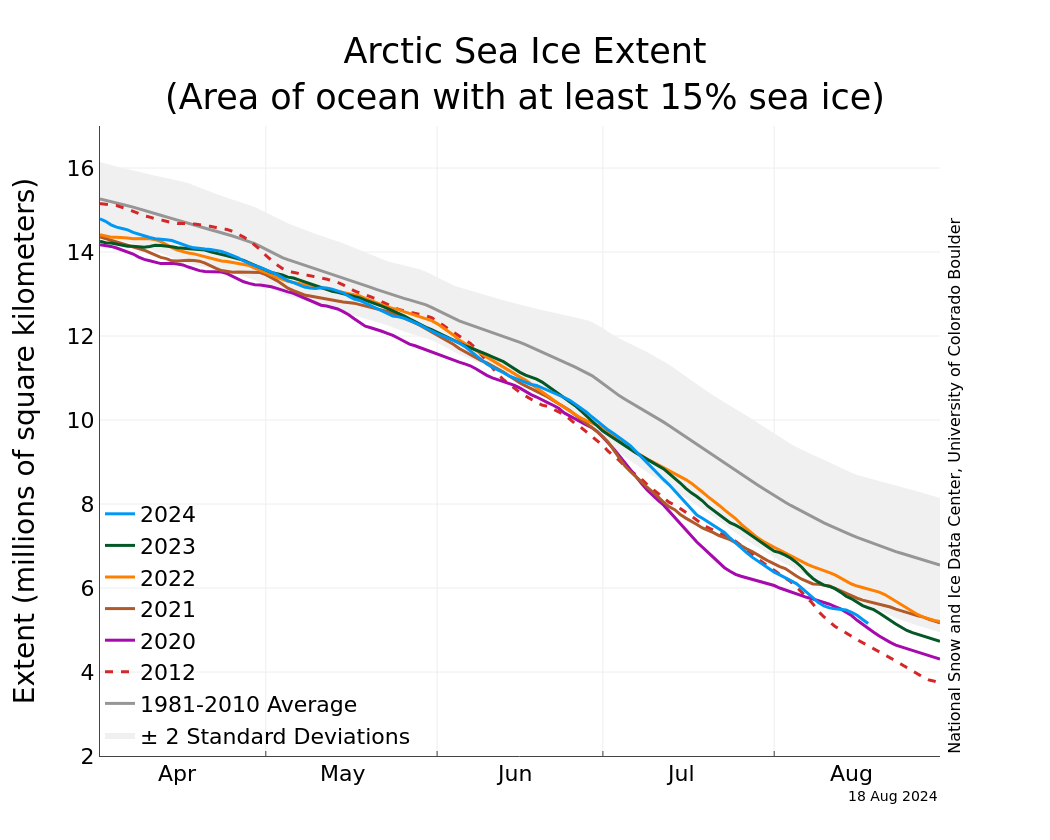
Figure 1b. The graph above shows Arctic sea ice extent as of August 18, 2024, along with daily ice extent data for four previous years and the record low year. 2024 is shown in blue, 2023 in green, 2022 in orange, 2021 in brown, 2020 in magenta, and 2012 in dashed red. The 1981 to 2010 median is in dark gray. The gray areas around the median line show the interquartile and interdecile ranges of the data. Sea Ice Index data.
Credit: National Snow and Ice Data Center
High-resolution image
Arctic sea ice extent as of August 18 was 5.20 million square kilometers (2.01 million square miles) (Figure 1a). The first week of August continued to have the rapid pace of ice loss observed in July (Figure 1b). However, afterwards the pace slowed for several days but picked up again. Extent approaches 2007 levels, while tracking above the record 2012 minimum. Sea ice extent is currently fourth lowest, behind 2012, 2019, and 2020.
Ice loss has primarily occurred in the northern part of the Beaufort Sea and to a lesser extent in the East Siberian Sea as well as in the Canadian Archipelago, where the Northwest Passage is nearly ice free. Elsewhere, there has been little northward retreat of the sea ice edge. The high-concentration area of ice south and east of Wrangel Island has remained, though some openings started to emerge off the coast of Siberia as southerly winds drove this packed ice northwards. Most of the remaining ice is of low ice concentration. As of August 18, the sea ice extent was 1.98 million square kilometers (764,000 square miles) below the 1981 to 2010 average and 540,000 square kilometers (208,000 square miles) above 2012, the record low for this time of year.
Conditions in context
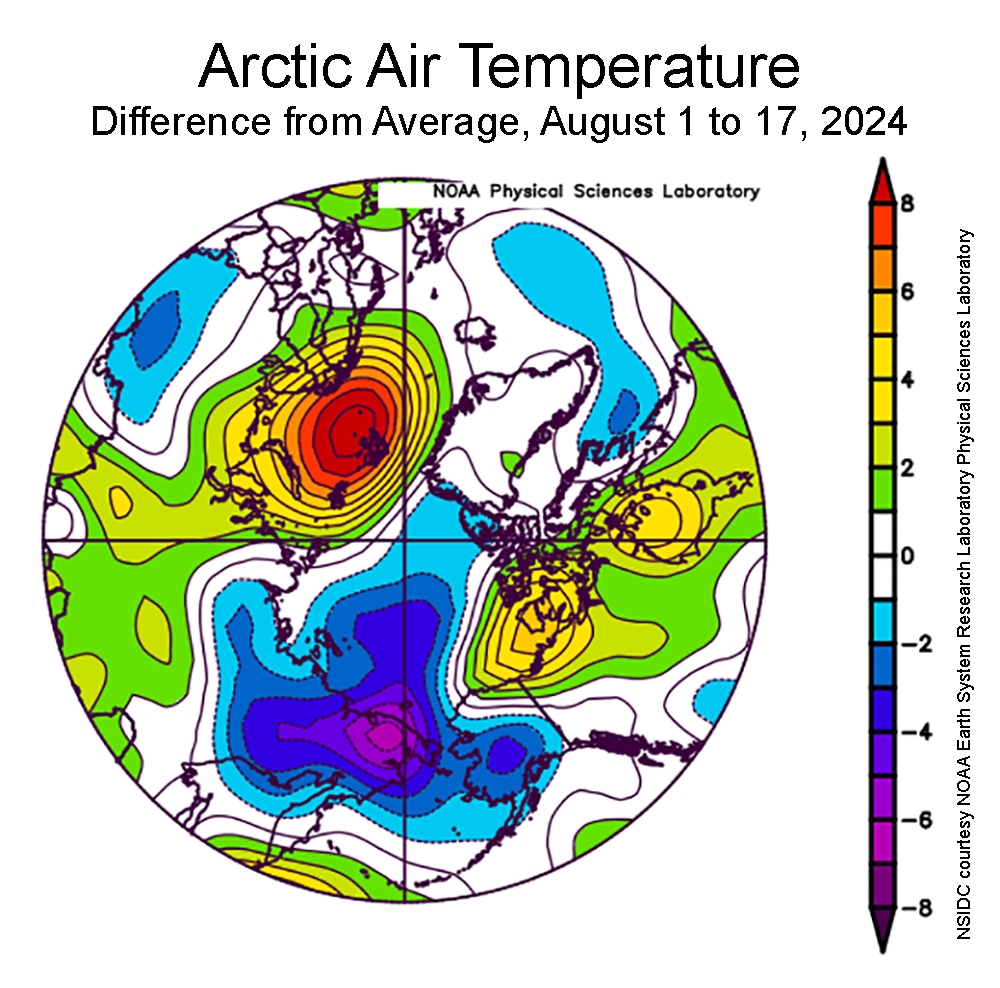
Figure 2a. This plot shows the departure from the 1991-to-2020 average air temperature in the Arctic at the 925 hPa level, in degrees Celsius, from August 1 to 17, 2024. Yellows and reds indicate above average temperatures; blues and purples indicate below average temperatures.
Credit: NSIDC courtesy NOAA Earth System Research Laboratory Physical Sciences Laboratory
High-resolution image
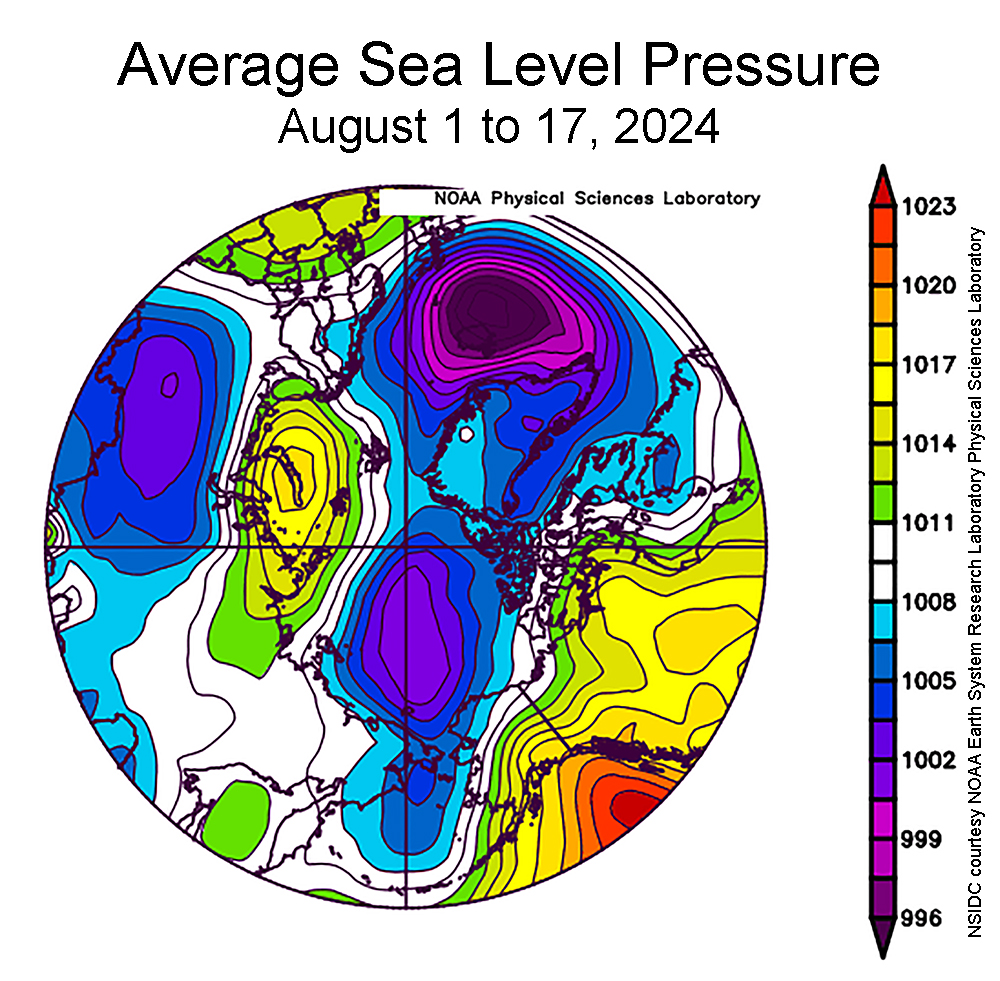
Figure 2b. This plot shows average sea level pressure in the Arctic in millibars from August 1 to 17, 2024. Yellows and reds indicate high air pressure; blues and purples indicate low pressure.
Credit: NSIDC courtesy NOAA Earth System Research Laboratory Physical Sciences Laboratory
High-resolution image
Although ice loss during the first half of August was faster than average, air temperatures at the 925 hPa level (approximately 2,500 feet above the surface) were 2 to 4 degrees Celsius (4 to 7 degrees Fahrenheit) below average over much of the Arctic Ocean, stretching from the coast of Siberia across the pole towards northern Greenland (Figure 2a). Above average air temperatures were mostly recorded in the East Greenland, Barents, and Kara Seas, as well as in the southern Beaufort Sea and the Canadian Arctic Archipelago. Air temperatures in the Barents Sea near Franz Joseph Land were as much as 8 degrees Celsius (14 degrees Fahrenheit) above average where a strong anticyclone (high sea level pressure) was located (Figure 2b). Low sea level pressure dominated the Chukchi and East Siberian Seas. Coupled with the high pressure over eastern North America, warm winds from the south moved into the Beaufort Sea while cold air from the Arctic Ocean moved into the Chukchi Sea.
Summer came early to the Arctic
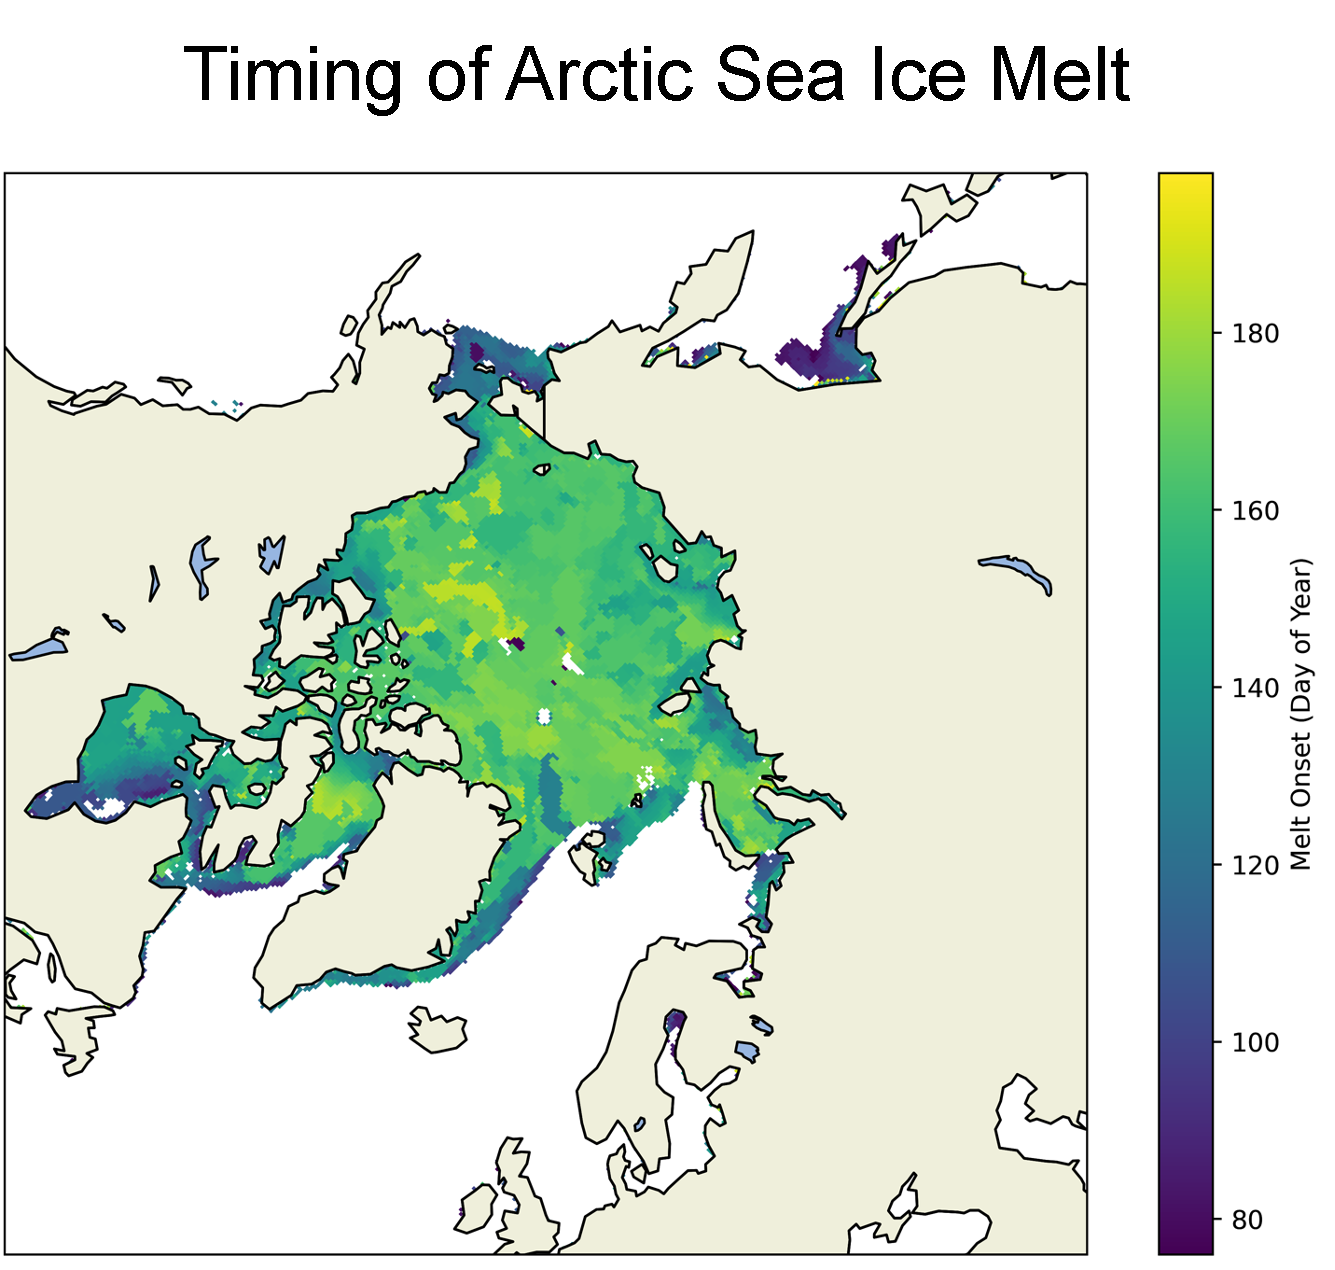
Figure 3a. This map shows the date of sea ice melt onset in the Arctic for the 2024 melt season. Shades in purple depict early melt, while shades in yellow depict melt later in the season.
Credit: J. Strove, NSIDC; data courtesy J. Miller and L. Boisvert, NASA Goddard
High-resolution image
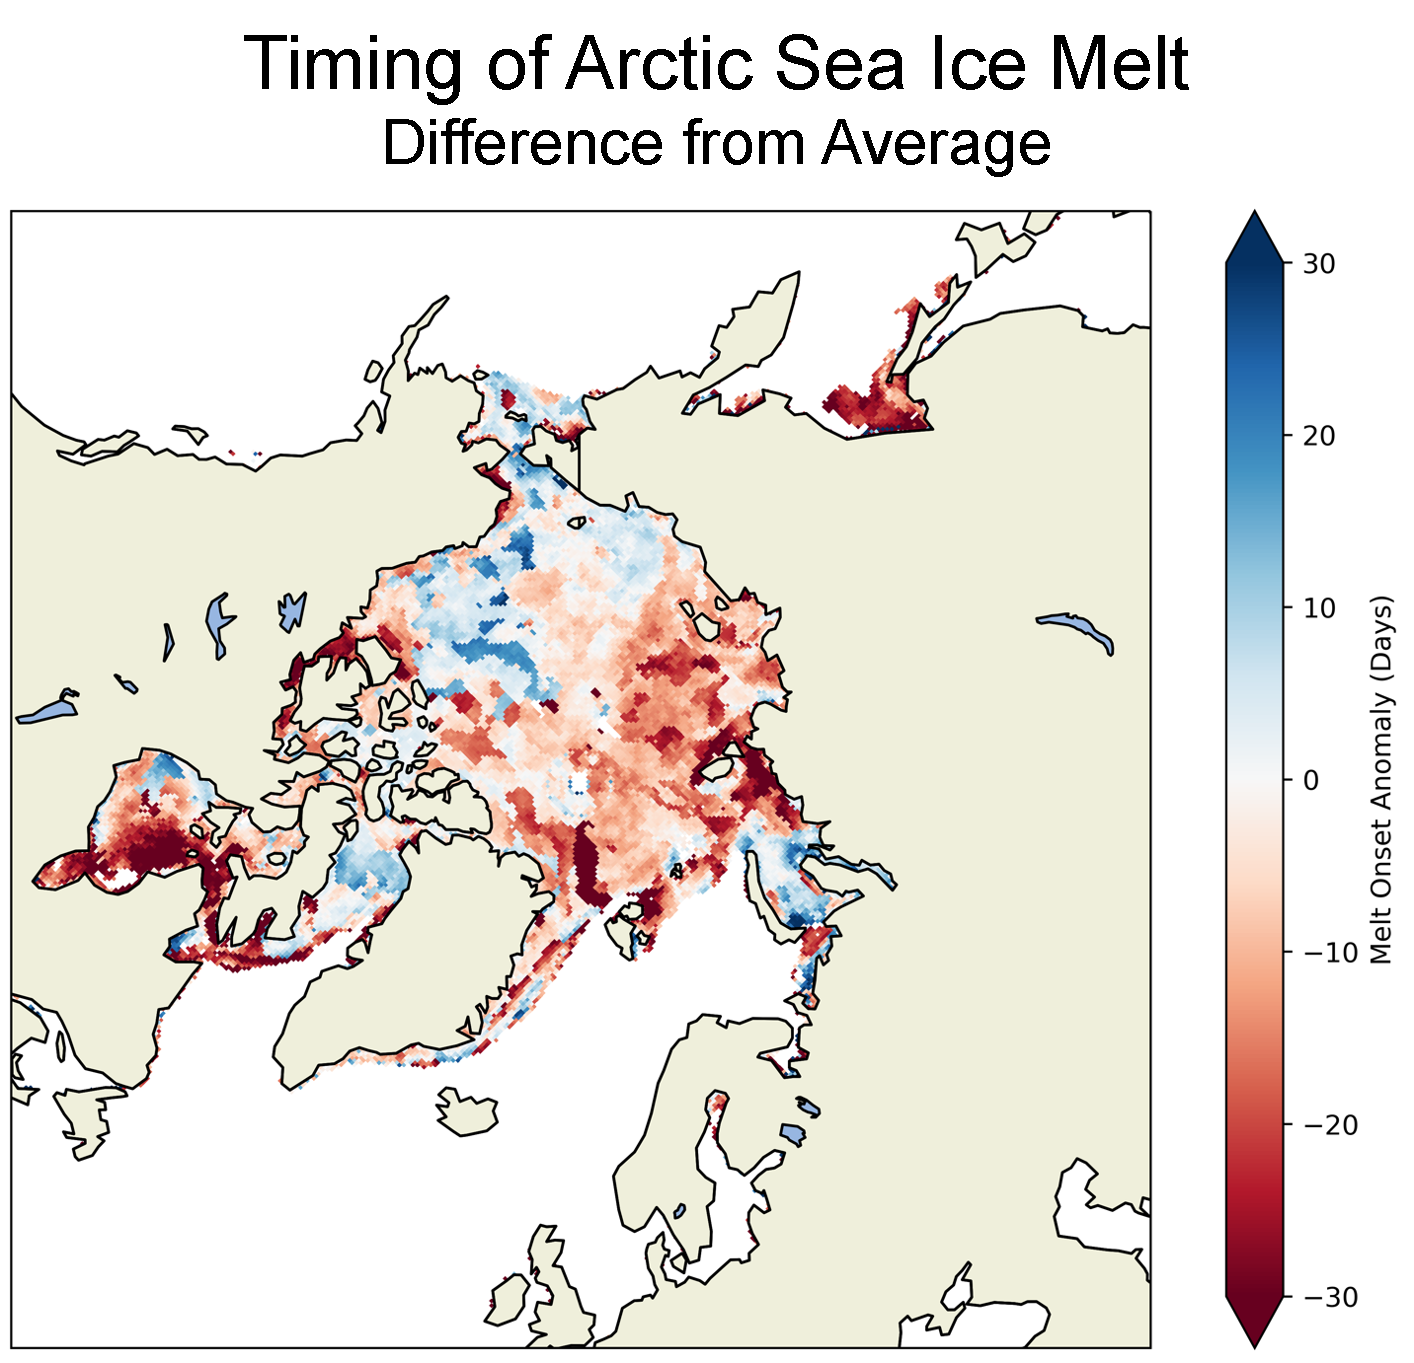
Figure 3b. This map shows the date of sea ice melt onset in the Arctic for the 2024 melt season compared to the 1981 to 2010 average. Shades in red depict sea ice melt up to 30 days earlier than average, while shades in blue depict melt up to 30 days later than average.
Credit: J. Stroeve, NSIDC; data courtesy J. Miller and L. Boisvert, NASA Goddard
High-resolution image
When snow starts to melt on sea ice, it can be easily detected using the same passive microwave sensors used to measure ice concentration. This is because liquid water in the snowpack results in a strong increase in the passive microwave emission compared to a cold, dry snowpack. This year the melt began particularly early in southeastern Hudson Bay, beginning in April (Figure 3a), more than a month ahead of the 1981 to 2010 average (Figure 3b). This contrasted sharply with later melt onset in the northwestern part of Hudson Bay, where some ice still remains today. Elsewhere, melt onset was 10 to 30 days earlier in the eastern Arctic Ocean, whereas melt was mostly 10 to 30 days later than average in the western Arctic Ocean. Melt was also 15 days later than average in northern Baffin Bay and around 5 days later in the East Siberian Sea. The coastal region of the Kara Sea was also slow to melt this spring, starting around the end of June. As a result, the sea ice remained in the coastal areas of the Kara Sea well into July.
Little sea ice in the Northwest Passage routes
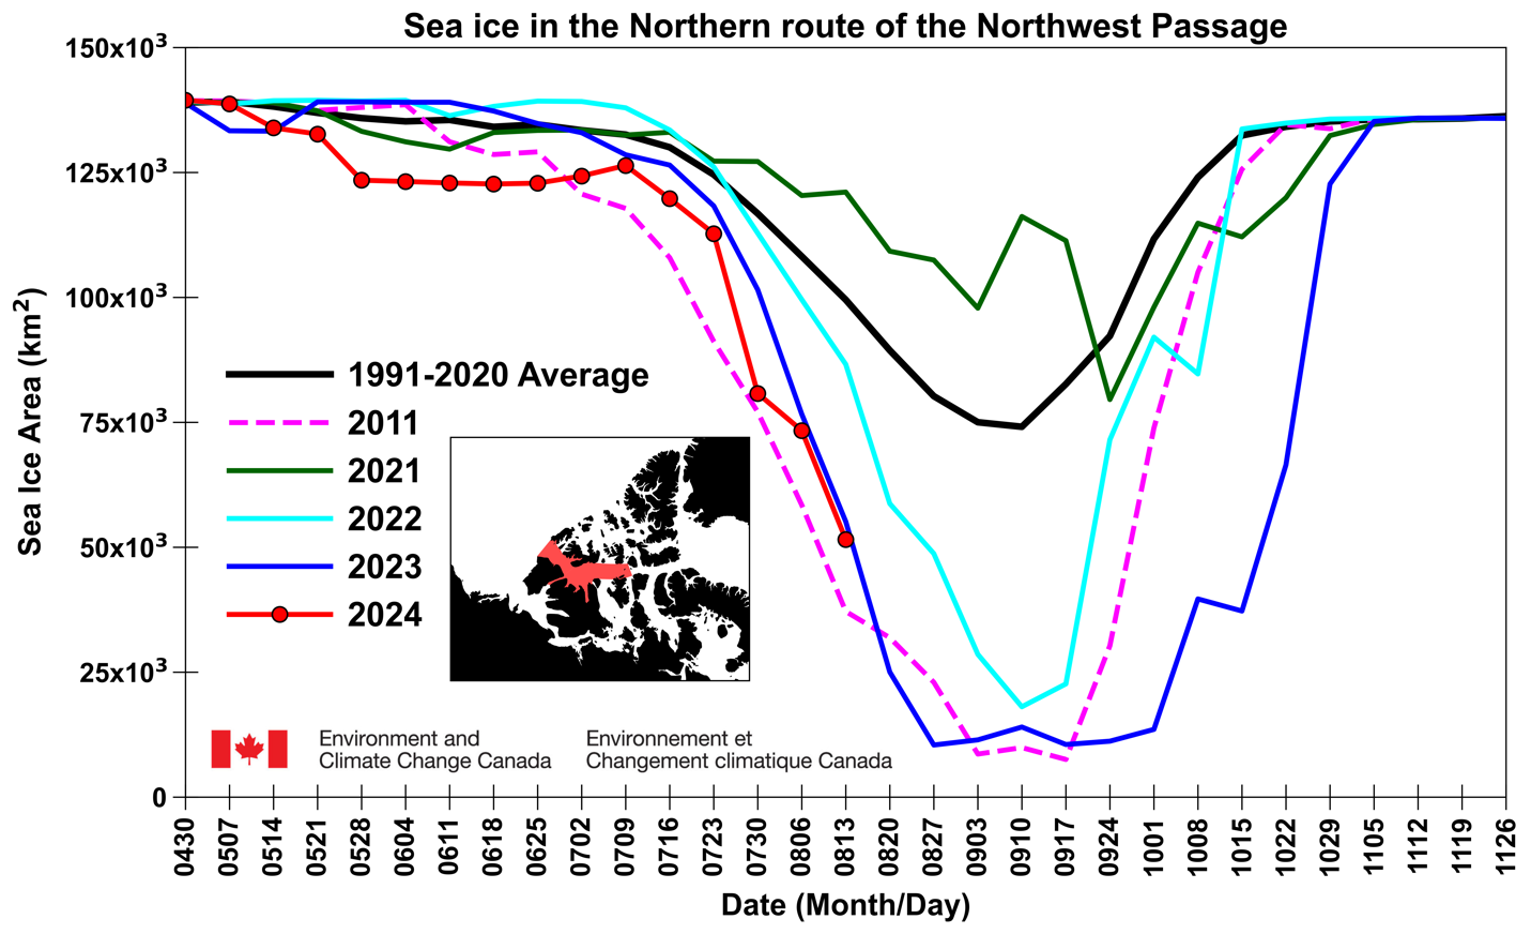
Figure 4a. This time series shows total sea ice area for 2024, 2023, 2022, 2021, 2011, and the 1991 to 2020 average within the northern route of the Northwest Passage. Data are from the Canadian Ice Service.
Credit: S. Howell, Environment and Climate Change Canada
High-resolution image
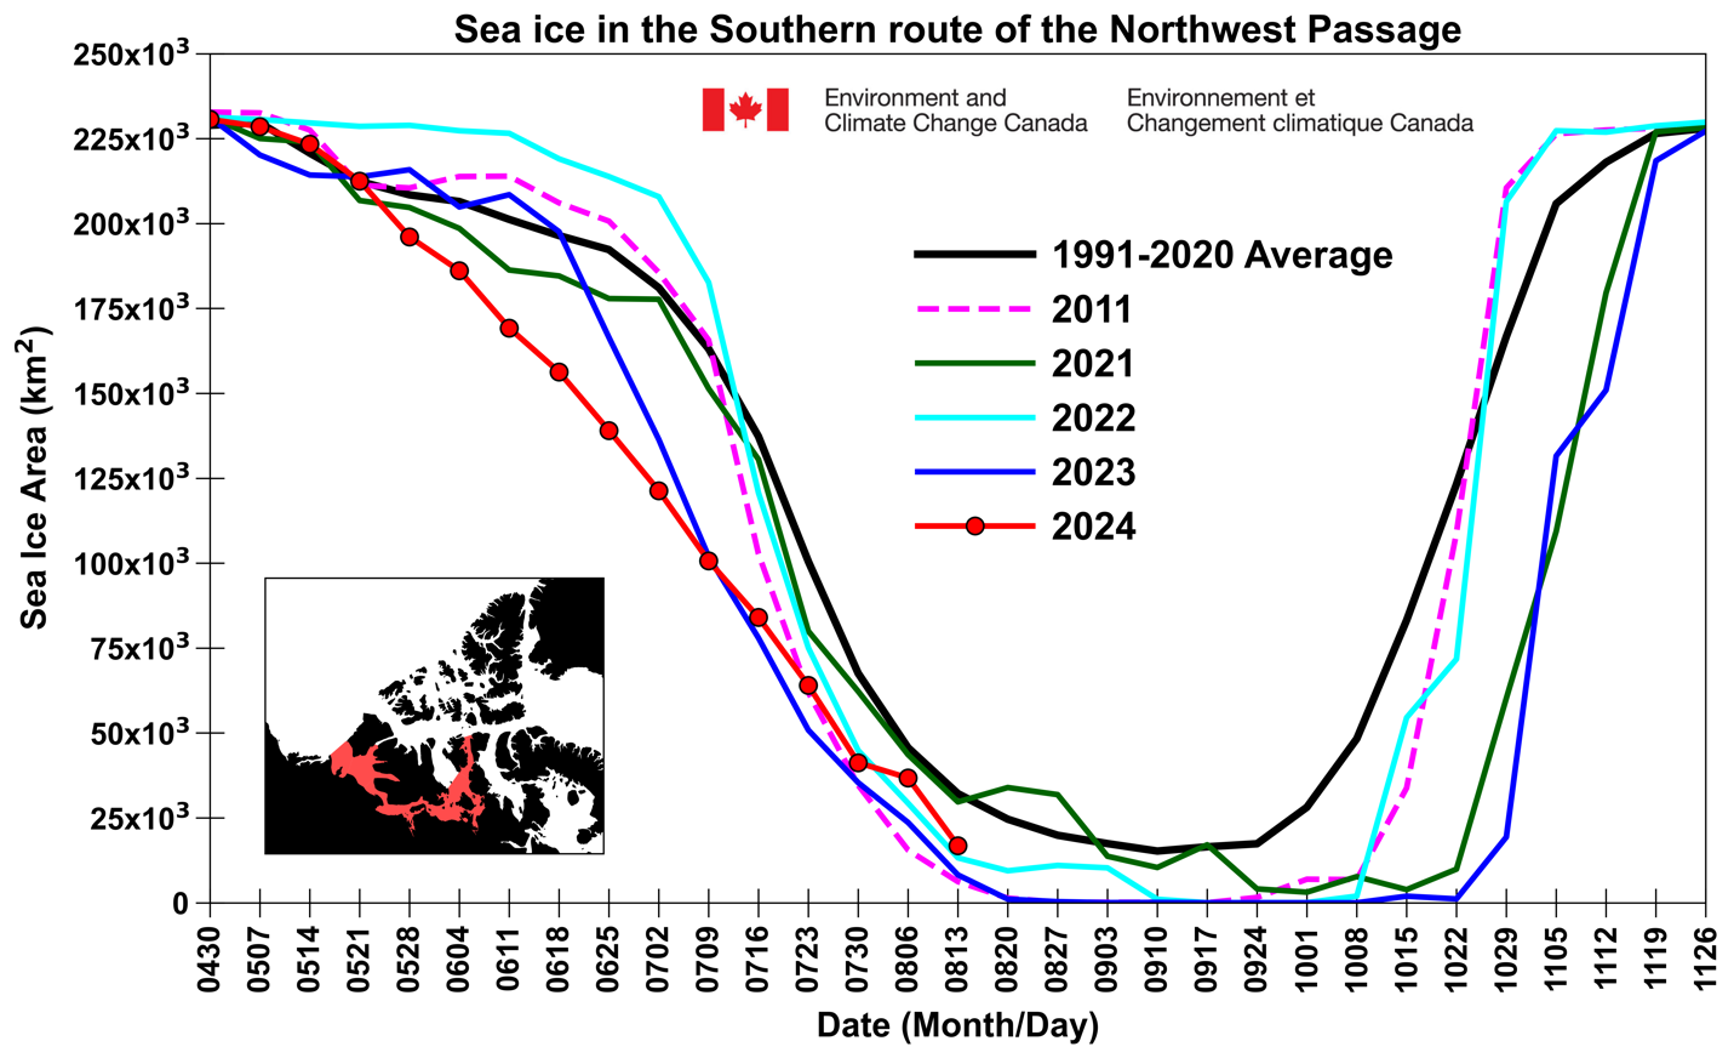
Figure 4b. The time series shows total sea ice area for 2024, 2023, 2022, 2021, 2011, and the 1991 to 2020 average within the southern route of the Northwest Passage. Data is from the Canadian Ice Service.
Credit: S. Howell, Environment and Climate Change Canada
High-resolution image
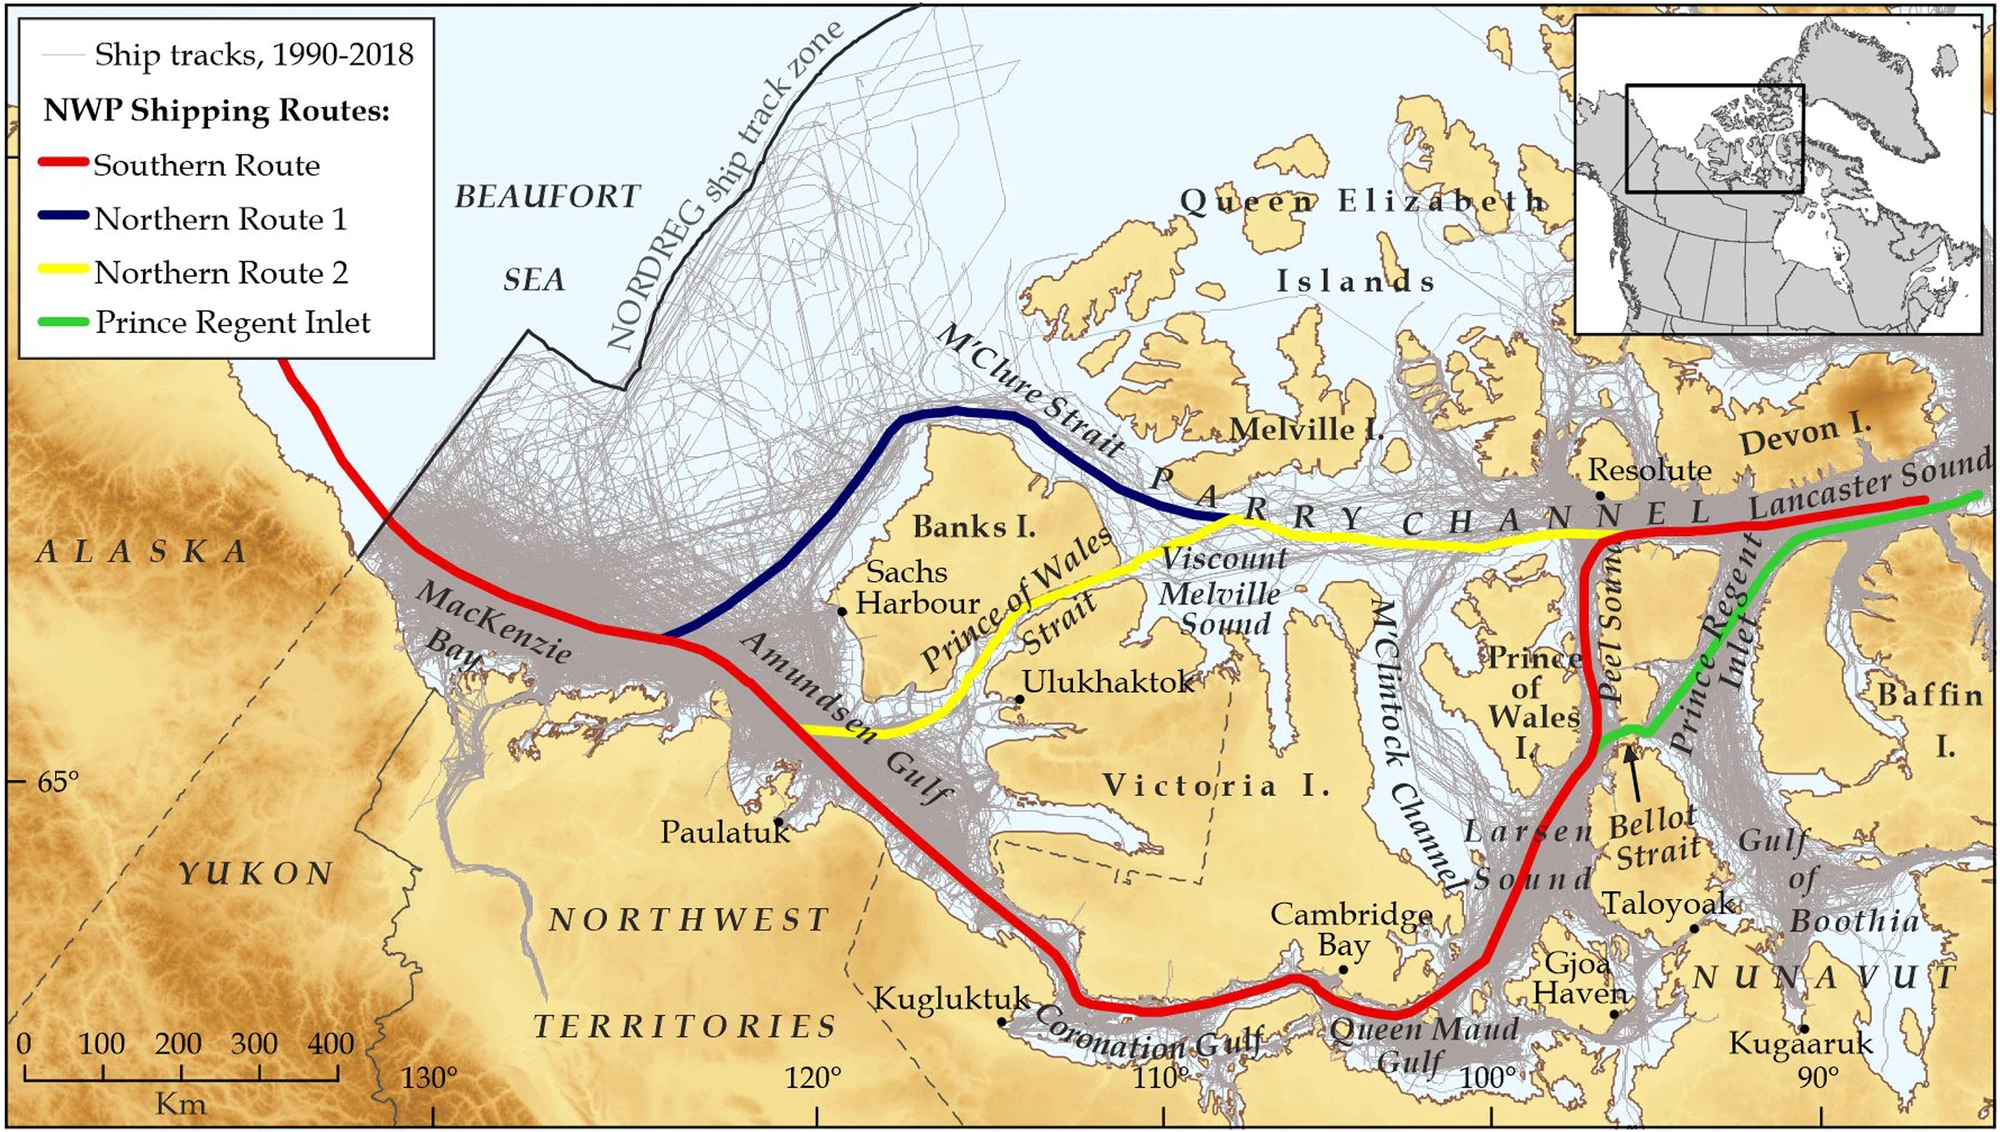
Figure 4c. This map shows all ship tracks from 1990 to 2018 as grey lines, and shipping routes in four different line colors along the Northwest Passage (NWP).
Credit: Cook et al., 2024
High-resolution image
The Northwest Passage (NWP) is a sea route that connects the Atlantic Ocean with the Pacific Ocean through the channels of the Canadian Archipelago. It has been long imagined as a potential future economic backbone for global trade. There are several routes through these channels. In 2007, the northern deepwater route of the NWP, entered from the west through M’Clure Strait, was ice free for the first time during the satellite data record and has been open several years since. As of August 15, the sea ice area in the northern route is currently tracking just above the 2011 record low (Figure 4a). The southern route, known as Amundsen’s Route, is tracking below the 1991 to 2020 average, but above the record low with ice still present in Victoria Strait (Figure 4b). Although ice conditions have been very light in recent years, challenges to navigation still exist. For instance, the processes of Arctic Ocean sea ice export and seasonal first-year ice aging create choke points in the NWP.
Historically, the presence of multiyear sea ice has stymied visions of the NWP becoming a trade route, but recent reductions in sea ice caused by climate change are reinvigorating these visions. A recent study by Alison Cook and colleagues reviewed four possible routes through the NWP and considered ships with different levels of ice strengthening over the past 15 years (Figure 4c). The study found that sea ice frequently obstructed some areas of the NWP leading to consistently shortened shipping seasons over the past 15 years. Despite the shipping season length becoming longer in several other sections of the NWP, the viability of full passage is actually lessening as a consequence of climate change. This finding is linked to sea ice melting in the Arctic Ocean between northern Greenland and the Canadian Archipelago, often referred to as the Last Ice Area, which is breaking up and migrating south, clogging narrow channels in the NWP and hampering route reliability for ships operating in the region. These results support those from an earlier study this year by Stephen Howell and colleagues.
Wildfires in the north
Figure 5. Click to animate. This NASA Worldview image shows how smoke from Canadian wildfires moved through the Arctic from August 6 to 18, 2024.
Credit: NASA Worldview
High-resolution image
The impacts of wildfires are increasing as climate changes and human development encroaches farther into forested areas. Wildfires even occur in the far north during the summer period. Recently, there was an outbreak of new fires in northern Canada near Great Bear Lake. The smoke from these fires has drifted east and north over the Canadian Arctic Archipelago and as far as northwest Greenland (Figure 5). Smoke from the fires reduce the incoming solar energy, slowing ice melt, but when the smoke particles fall onto the ice, they lower the albedo, which increases the amount of energy absorbed at the surface and increases ice melt. However, at this time of the year, the sun is already low on the horizon, so smoke most likely won’t have much affect on ice melt.
Arctic minimum projection
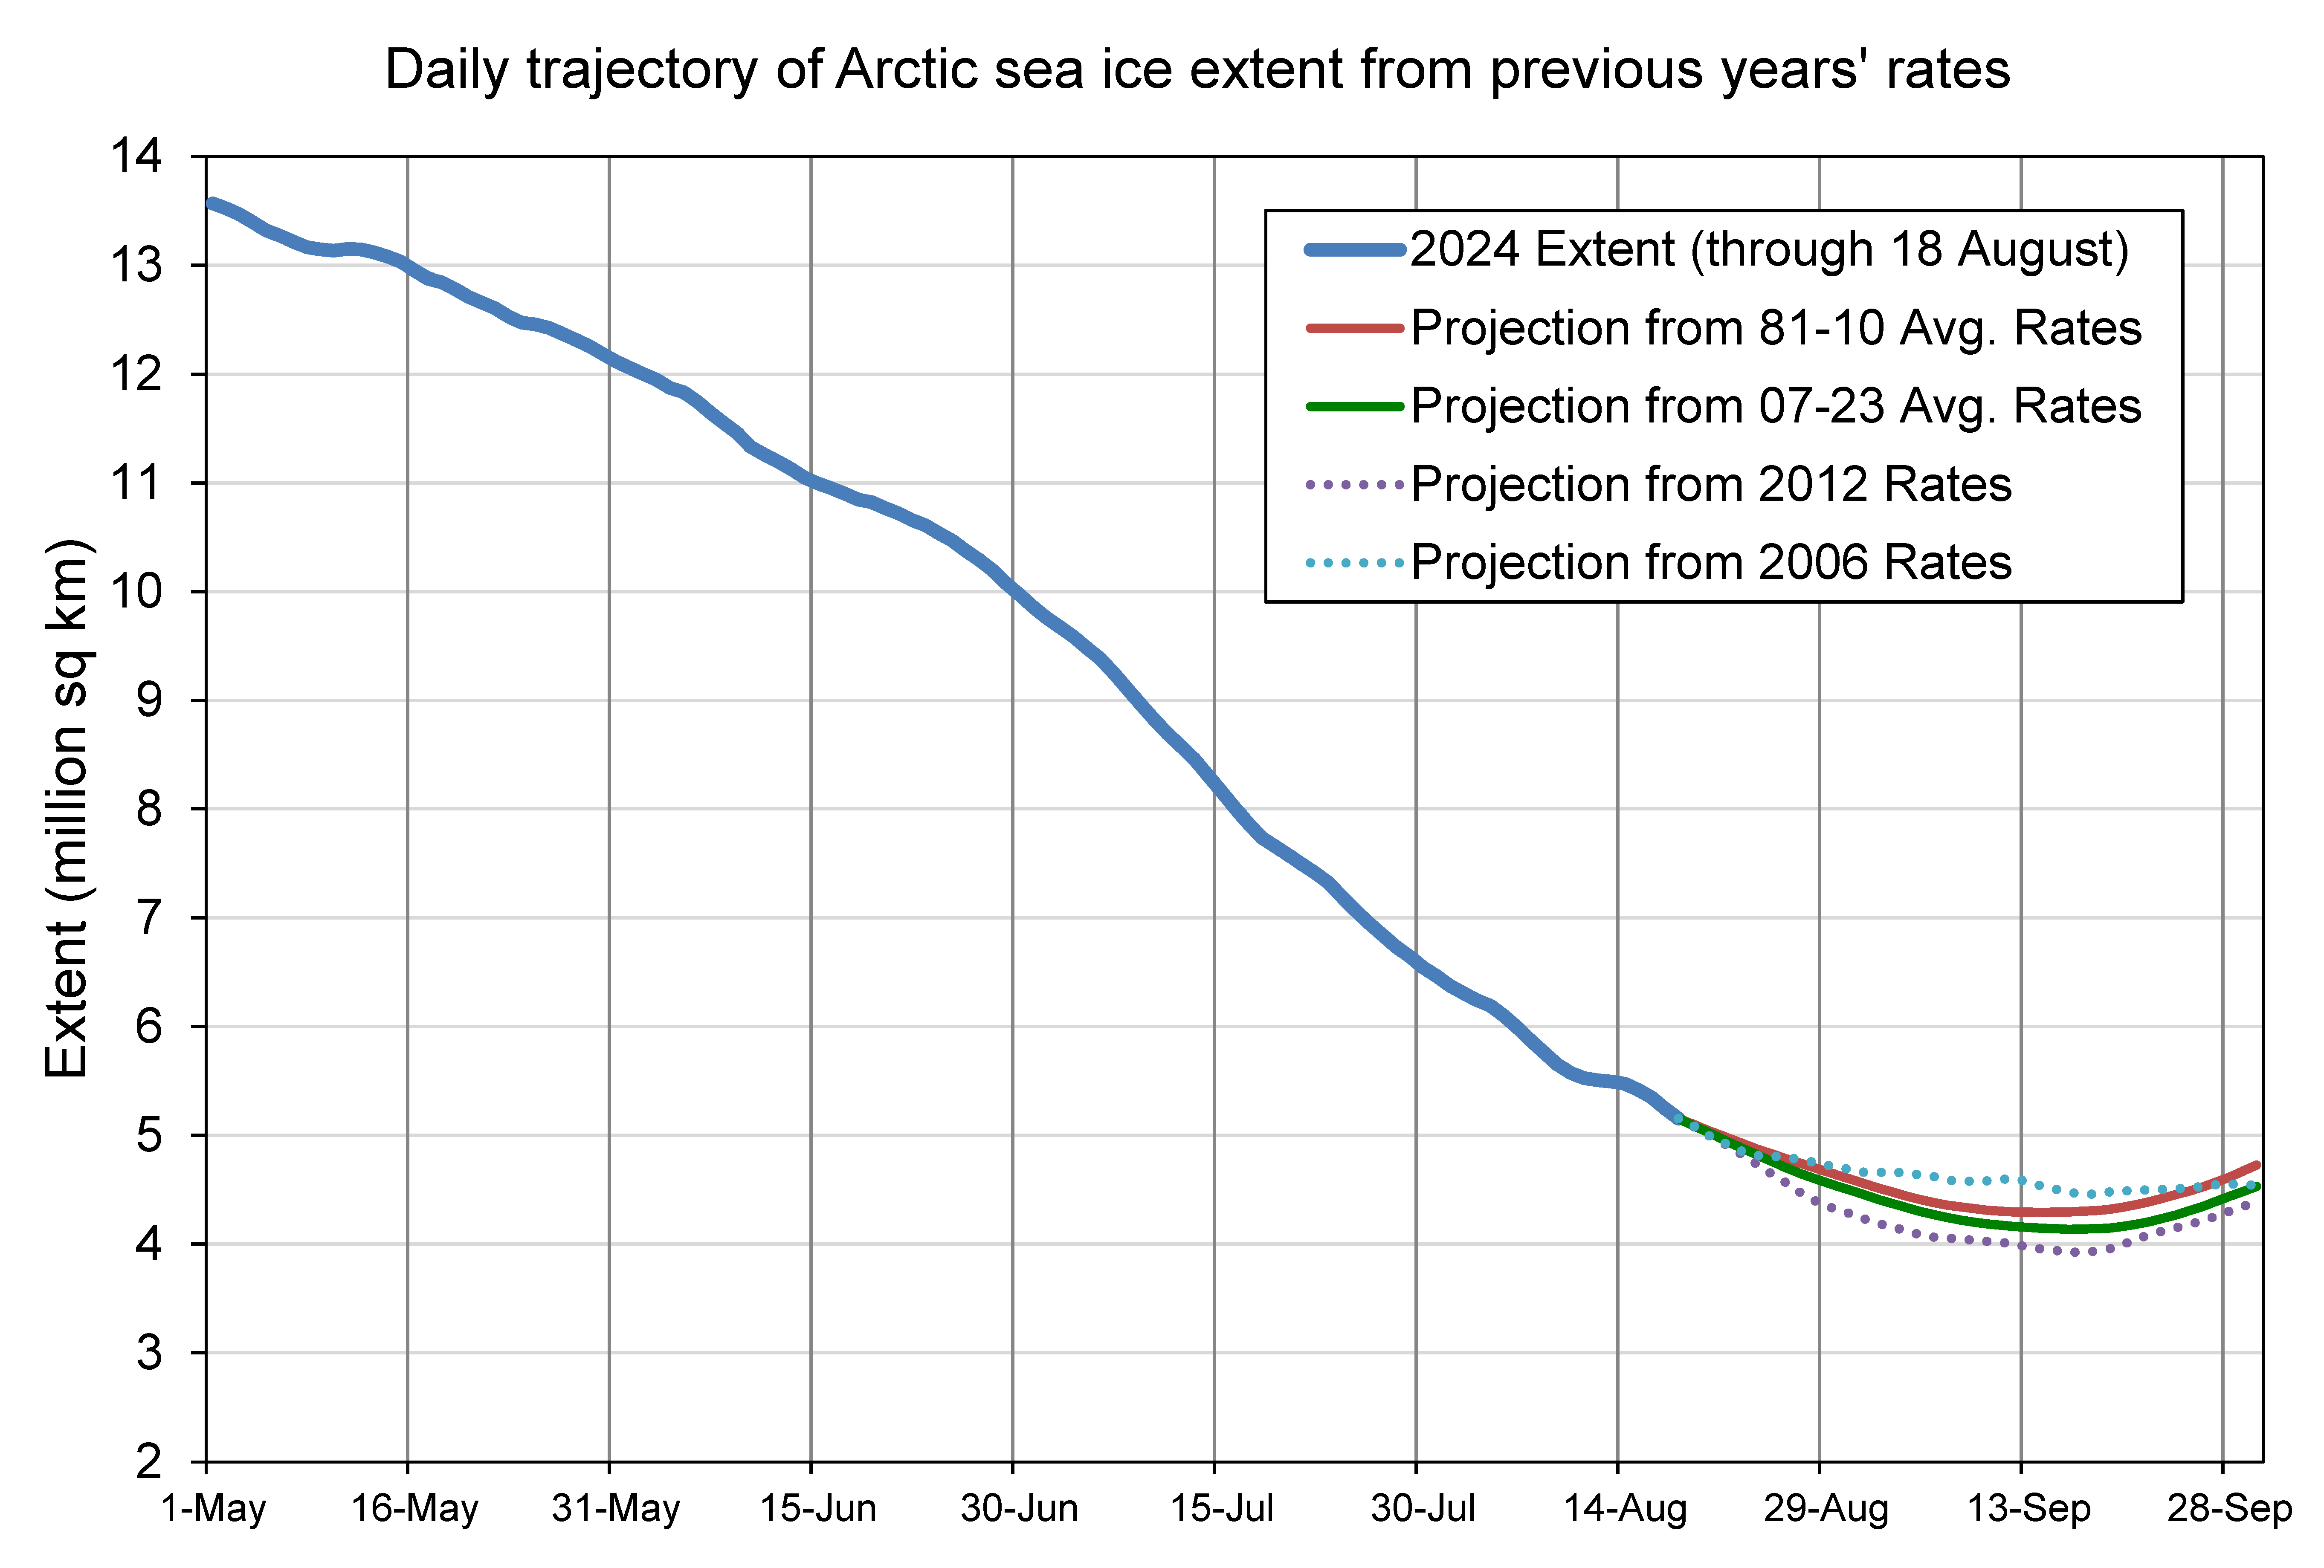
Figure 6. The graph above shows projections of sea ice extent from August 18 through September 30 based on previous years’ observed retreat rates appended to the August 18, 2024, ice extent. Sea Ice Index data.
Credit: Walt Meier, National Snow and Ice Data Center
High-resolution image
As noted above, currently, the sea ice extent stands at fourth lowest for this time of year. We can estimate the extent through the end of the summer using the daily ice loss rates from previous years to project the September minimum extent. This method, which has been regularly contributed to the Sea Ice Outlook, provides a reasonable range of the minimum extent. This year, using the average daily loss rates from 2007 to 2023, the projection starting from August 18 results in a projected minimum of 4.14 million square kilometers (1.60 million square miles), with a range of 3.93 to 4.35 million square kilometers (1.52 to 1.68 million square miles) (Figure 6). This suggests that this year’s minimum will potentially be the third lowest in the satellite record and likely to fall somewhere between the second and eighth lowest. It indicates that a new record low surpassing 2012 is very unlikely.
Rapid autumn ice growth down under
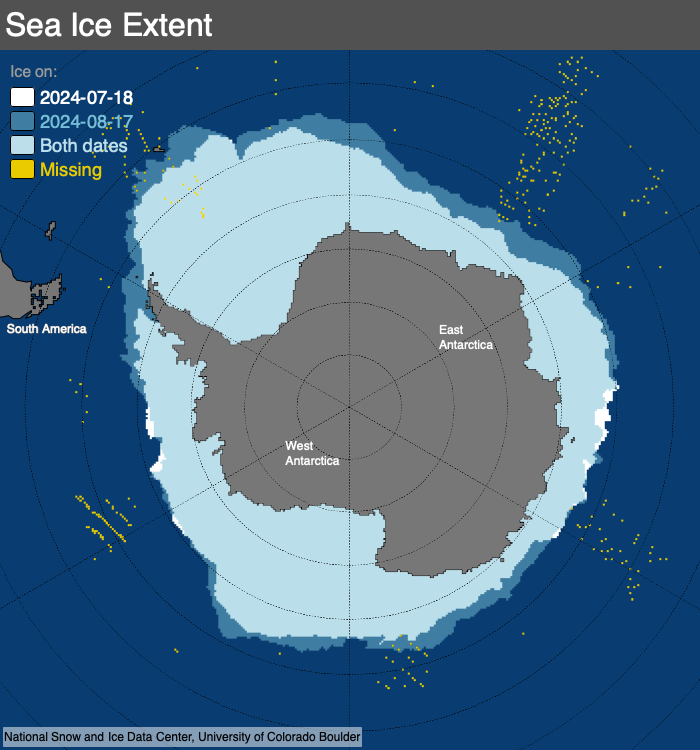
Figure 7. This map compares Antarctic sea ice extents between July, 18, 2024, in white, and August 17, 2024, in blue, using the NSIDC sea ice comparison tool.
Credit: National Snow and Ice Data Center
High-resolution image
After slow growth from May through July, Antarctic sea ice has started to rapidly expand since the beginning of August. The growth has primarily occurred in the Weddell Sea and to a lesser extent in the Indian and Pacific Oceans (Figure 7). Ice growth for the first two weeks of August was 1.5 million square kilometers (580,000 square miles) per day, among the fastest ice growth rates seen in the 46-year record for this time of year. Nevertheless, the total extent remained the second lowest in the satellite data record. As of August 18, the extent was 1.27 million square kilometers (490,000 square miles) below the 1981 to 2010 average, and 1.07 million square kilometers (413,000 square miles) above 2023.
Further reading
Cook, A. J., J. Dawson, S. E. L. Howell, J. E. Halloway, and M. Brady. 2024. Sea ice choke points reduce the length of the shipping season in the Northwest Passage, Communications Earth & Environment, 5, 362, doi.org:10.1038/s43247-024-01477-6.
Howell, S. E. L., D. G. Babb, J. C. Landy, I. A. Glissenaar, K. McNeil, B. Montpetit, and M. Brady. 2024. Sea ice transport and replenishment across and within the Canadian Arctic Archipelago, 2016–2022. The Cryosphere, 18, 2321–2333, doi.10.5194/tc-18-2321-2024.

