Arctic sea ice was at a satellite-record low for the second month in a row. The first three weeks of February saw little ice growth, but extent rose during the last week of the month. Arctic sea ice typically reaches its maximum extent for the year in mid to late March.
Overview of conditions
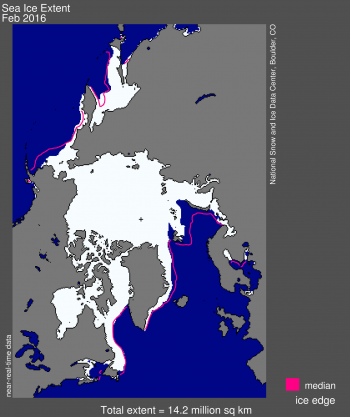
Figure 1. Arctic sea ice extent for February 2016 was 14.22 million square kilometers (5.48 million square miles). The magenta line shows the 1981 to 2010 median extent for that month. The black cross indicates the geographic North Pole. Sea Ice Index data. About the data
Credit: National Snow and Ice Data Center
High-resolution image
Arctic sea ice extent for February averaged 14.22 million square kilometers (5.48 million square miles), the lowest February extent in the satellite record. It is 1.16 million square kilometers (448,000 square miles) below the 1981 to 2010 long-term average of 15.4 million square kilometers (5.94 million square miles) and is 200,000 square kilometers (77,000 square miles) below the previous record low for the month recorded in 2005.
The first three weeks of February saw little ice growth, but extent rose during the last week of the month primarily due to growth in the Sea of Okhotsk (180,000 square kilometers or 70,000 square miles) and to a lesser extent in Baffin Bay (35,000 square kilometers or 13,500 square miles). Extent is presently below average in the Barents and Kara seas, as well as the Bering Sea and the East Greenland Sea. Extent decreased in the Barents and East Greenland seas during the month of February. In other regions, such as the Sea of Okhotsk, Baffin Bay, and the Labrador Sea, ice conditions are near average to slightly above average for this time of year. An exception is the Gulf of St. Lawrence, which remains largely ice free.
In the Antarctic, sea ice reached its minimum extent for the year on February 19, averaging 2.6 million square kilometers (1 million square miles). It is the ninth lowest Antarctic sea ice minimum extent in the satellite record.
Conditions in context
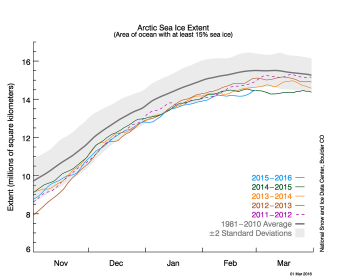
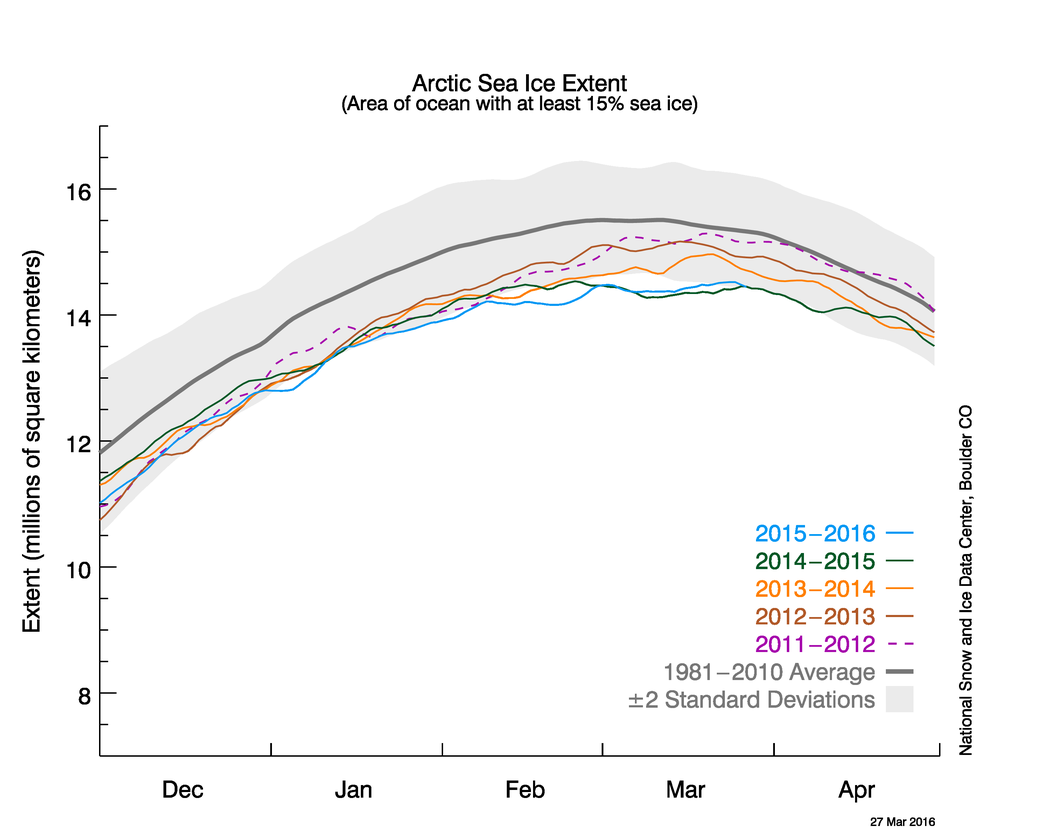
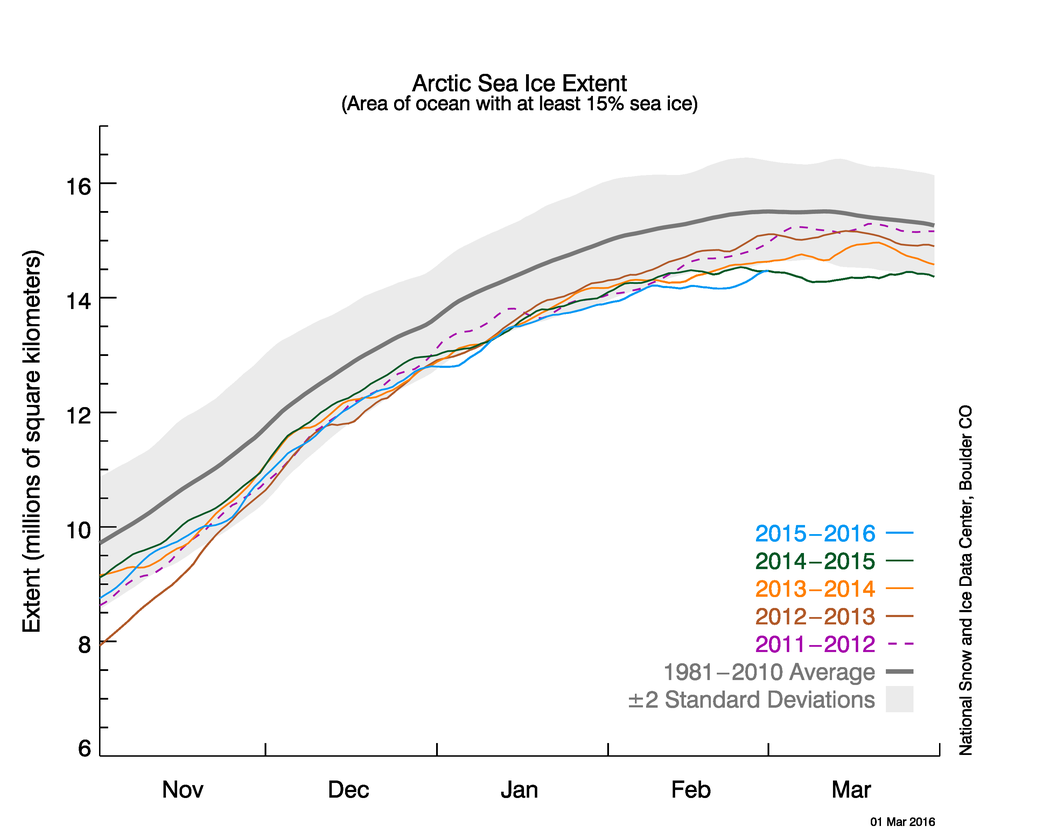
Figure 2a. The graph above shows Arctic sea ice extent as of March 1, 2016, along with daily ice extent data for four previous years. 2015 to 2016 is shown in blue, 2014 to 2015 in green, 2013 to 2014 in orange, 2012 to 2013 in brown, and 2011 to 2012 in purple. The 1981 to 2010 average is in dark gray. The gray area around the average line shows the two standard deviation range of the data. Sea Ice Index data.
Credit: National Snow and Ice Data Center
High-resolution image
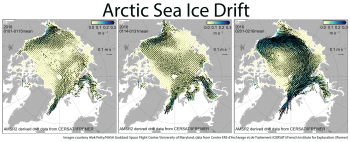
Figure 2b. These three images show two-week average Arctic sea ice drift data from January through mid-February derived from the Advanced Microwave Scanning Radiometer 2 (AMSR-2). The image on the left shows the period January 1 to 15, the middle image shows January 14 to 31, and the image on the right shows February 1 to 16.
Credit: Alek Petty/NASA Goddard Space Flight Center/University of Maryland, data from Centre ERS d’Archivage et de Traitement (CERSAT)/French Institute for Exploration (Ifremer)
High-resolution image
NASA and NOAA announced that January 2016 was the ninth straight month of record-breaking high surface temperatures for the globe. In terms of regional patterns, the Arctic stands out, with surface temperatures more than 4 degrees Celsius (7.2 degrees Fahrenheit) above the 1951 to 1980 average. These high temperatures were in part responsible for the record low sea ice extent observed for January. Persistent warmth has continued into February; air temperatures at the 925 hPa level were 6 to 8 degrees Celsius (11 to 14 degrees Fahrenheit) above the 1981 to 2010 average over the central Arctic Ocean near the pole. The rate of ice growth for February was near average at 19,700 square kilometers (7,600 square miles) per day, compared to 20,200 square kilometers (7,800 square miles) per day for the 1981 to 2010 average.
Atmospheric circulation patterns have also favored low sea ice extent, particularly in the Barents and Kara seas. Ice motion drift data derived from the Advanced Microwave Scanning Radiometer 2 (AMSR2) satellite and provided by the Centre ERS d’Archivage et de Traitement (CERSAT) show that since January 1, there has been cyclonic, or counterclockwise, sea ice motion in the Barents Sea helping to keep sea ice from advancing south. During the second half of January, an anti-cyclonic, or clockwise, circulation pattern developed in the Beaufort Sea, which subsequently strengthened and expanded to include most of the Arctic Ocean. This, combined with high pressure over Greenland and low pressure over Spitsbergen, has favored enhanced ice export out of Fram Strait, helping to flush old, thick ice out of the Arctic Ocean, leaving behind thinner ice that is more apt to melt away in summer. Whether this circulation pattern will continue and set the stage for very low September sea ice extent remains to be seen.
February 2016 compared to previous years
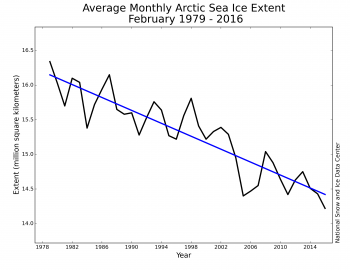
Figure 3. Monthly February sea ice extent for 1979 to 2016 shows a decline of 3.0 percent per decade.
Credit: National Snow and Ice Data Center
High-resolution image
February 2016 sea ice extent was the lowest in the satellite record at 14.22 million square kilometers (5.48 million square miles). The linear rate of decline for February is now 3.0 percent per decade.
Record warmth revealed by the AIRS instrument
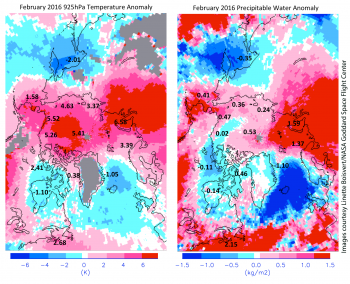
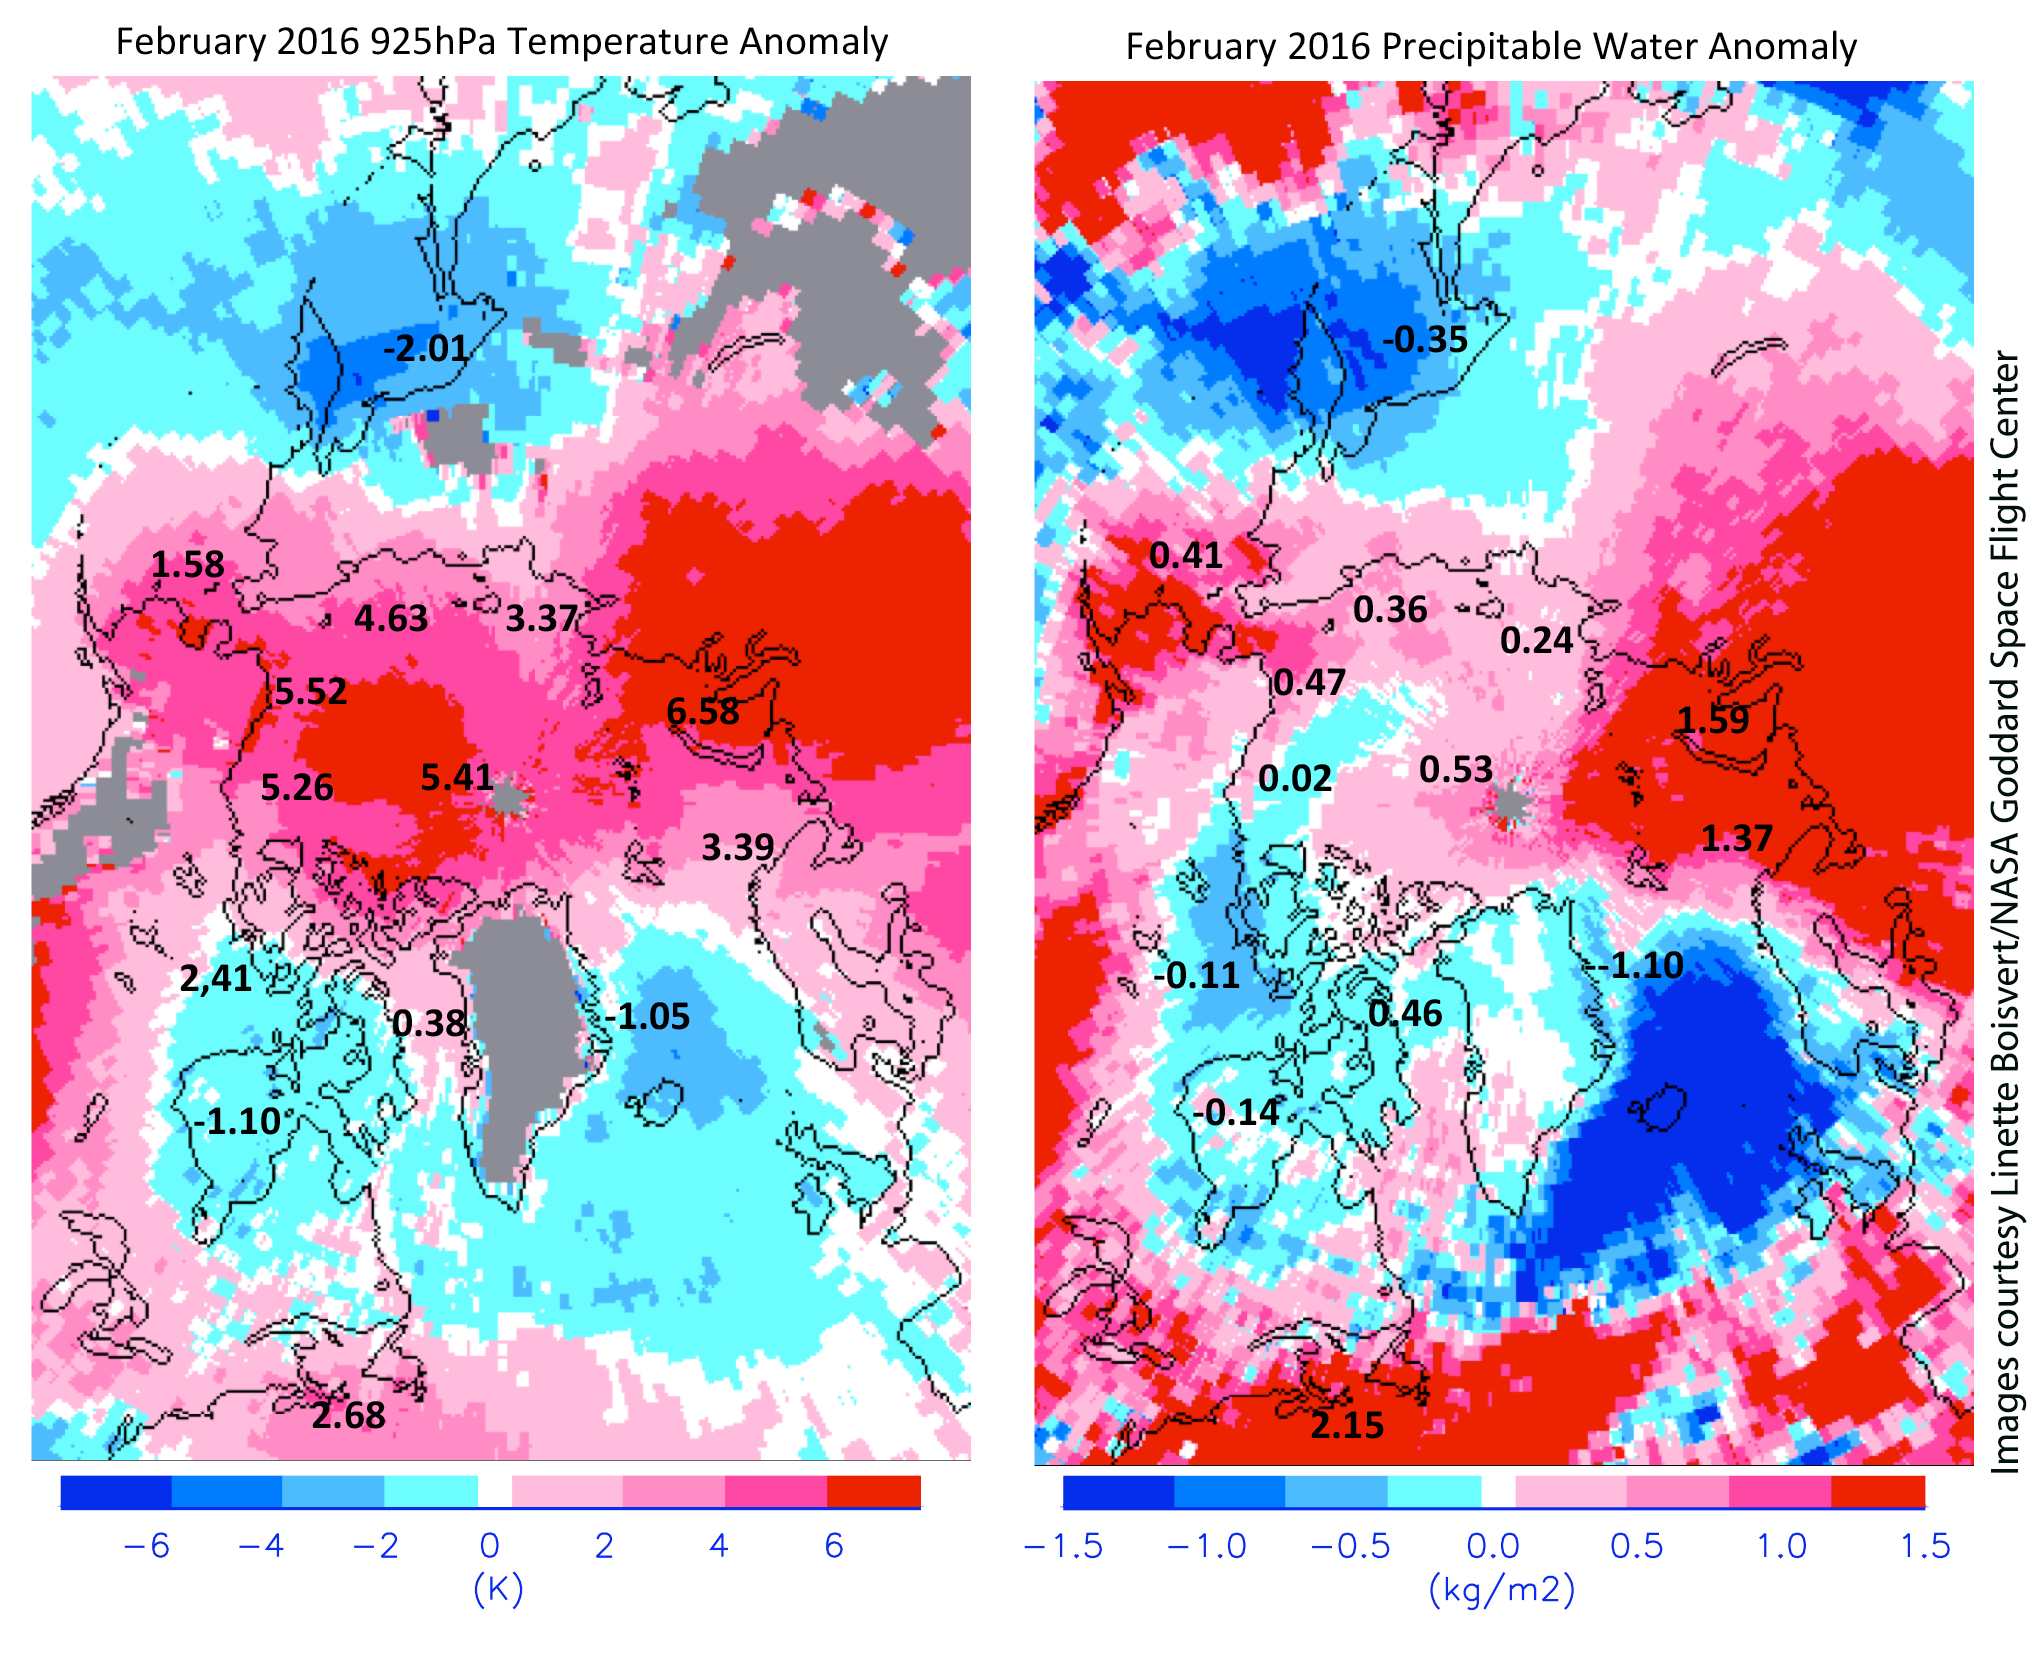
Figure 4. These two images show February 2016 departures from the 2003 to 2015 average for 925 hPa air temperature (left) and precipitable water (right) as derived from the NASA AIRS instrument.
Credit: Linette Boisvert/NASA Goddard Space Flight Center
High-resolution image
Since 2003, the Atmospheric Infrared Sounder (AIRS) onboard the NASA Aqua satellite has collected daily temperature and humidity profiles globally. Although the record is fairly short, AIRS data can provide insight into recent changes in Arctic climate. February average air temperatures, measured by AIRS at 925 hPa, are around 5 degrees Celsius (9 degrees Fahrenheit) above the 2003 to 2015 average over the Beaufort and Chukchi seas and the central Arctic Ocean. Above-average temperatures are also the rule over the Kara Sea and Northern Siberia (6 degrees Celsius or 11 degrees Fahrenheit above average). Regions with especially higher than average temperatures correspond to regions of low sea ice, demonstrating the role played by heat fluxes from open water areas. For example, the Sea of Okhotsk experienced below-average air temperatures, and also had above-average sea ice extents, whereas the Kara, Barents, and Bering seas and the Gulf of St. Lawrence had higher air temperatures compared to average, which coincides with lower than average sea ice extent.
A similar relationship is seen in the total precipitable water for February 2016. Precipitable water is the amount of water vapor in the atmospheric column totaled from the surface to the top of the troposphere, expressed as kilograms of water per square meter (one kilogram per square meter equals 1 millimeter of water depth). In February, areas with precipitable water between 12 percent (Bering Sea) to 70 percent (Kara Sea) above the 2003 to 2015 February average corresponded to regions with below-average sea ice extent. Water vapor is a greenhouse gas, and with more water vapor in the air, there is a stronger emission of longwave radiation to the surface. Conversely, the observation that above-average amounts of water vapor are found over areas of reduced sea ice extent points to a role of local evaporation, and evaporation is a cooling process that by itself will favor ice growth.
A late freeze-up
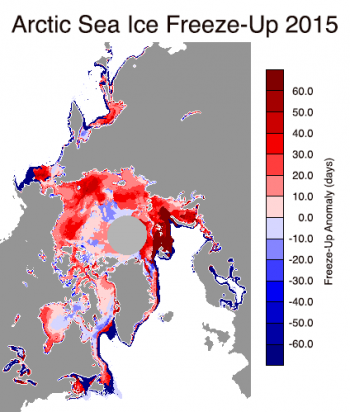
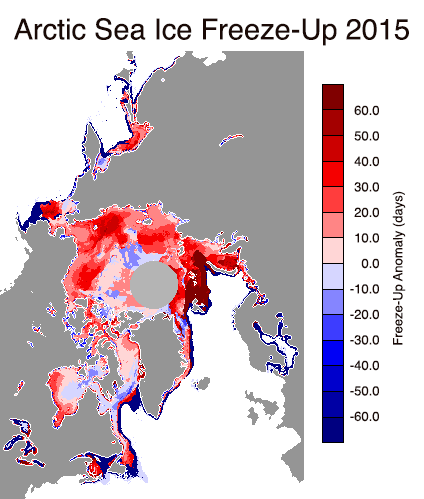
Figure 5. This images shows freeze-up anomalies in the Arctic for 2015. Reds indicate areas where freeze-up began later than average and blues indicate freeze-up beginning earlier than average.
Credit: National Snow and Ice Data Center, data provided by J. Miller/T. Markus, NASA Goddard Space Flight Center
High-resolution image
Sea ice reformed or refroze later than average throughout most of the Arctic, especially in the Kara and Barents seas where the freeze-up happened about two months later than average. Ice was also late to form in the Beaufort, Chukchi, East Siberian, and Laptev seas, between ten and forty days later than average. In contrast, the timing of freeze-up over the central Arctic Ocean near the pole was near average, as was also the case in Baffin Bay and parts of Hudson Bay. When freeze-up happens late, the ice has less time to thicken before the melt season starts, leading to a thinner ice cover that is more prone to melting out in summer.
References
NASA Goddard Institute for Space Studies. Global Land-Ocean Temperature Index in 0.01 degrees Celsius. http://data.giss.nasa.gov/gistemp/tabledata_v3/GLB.Ts+dSST.txt.
NASA Goddard Institute for Space Studies. NASA, NOAA Analyses Reveal Record-Shattering Global Warm Temperatures in 2015. http://www.giss.nasa.gov/research/news/20160120.
National Oceanic and Atmospheric Administration. Global Analysis – January 2016. https://www.ncdc.noaa.gov/sotc/global/201601.