On September 16, Arctic sea ice appeared to have reached its minimum extent for the year of 3.41 million square kilometers (1.32 million square miles). This is the lowest seasonal minimum extent in the satellite record since 1979 and reinforces the long-term downward trend in Arctic ice extent. The sea ice extent will now begin its seasonal increase through autumn and winter.
Please note that this is a preliminary announcement. Changing winds could still push ice floes together, reducing ice extent further. NSIDC scientists will release a full analysis of the melt season in early October, once monthly data are available for September.
Overview of conditions

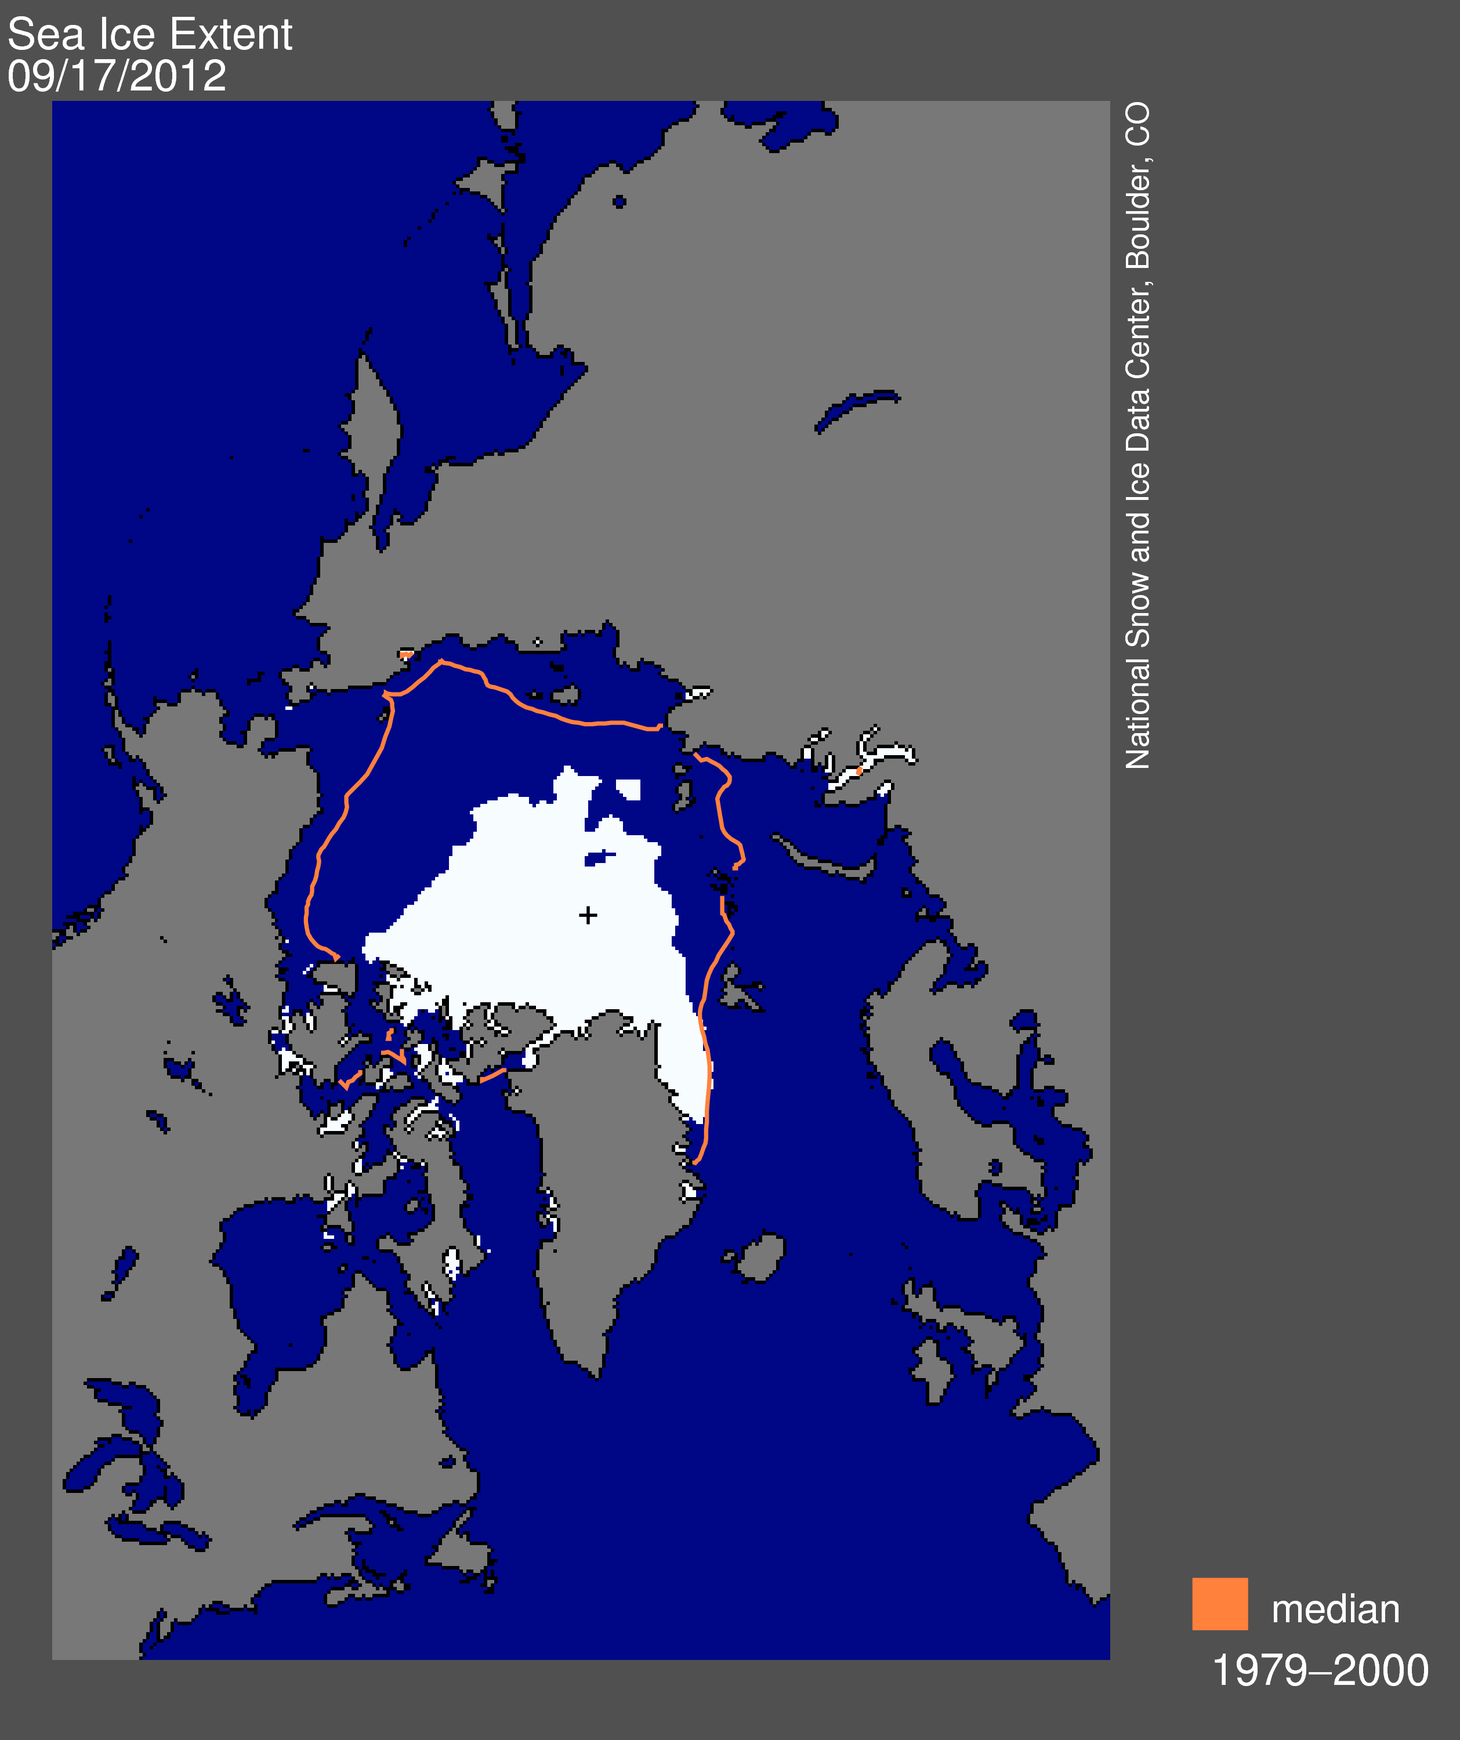
Figure 1. Arctic sea ice extent for September 16, 2012 was 3.41 million square kilometers (1.32 million square miles). The orange line shows the 1979 to 2000 median extent for that day. The black cross indicates the geographic North Pole. Sea Ice Index data. About the data
Credit: National Snow and Ice Data Center
High-resolution image
On September 16, 2012 sea ice extent dropped to 3.41 million square kilometers (1.32 million square miles). This appears to have been the lowest extent of the year. In response to the setting sun and falling temperatures, ice extent will now climb through autumn and winter. However, a shift in wind patterns or a period of late season melt could still push the ice extent lower. The minimum extent was reached three days later than the 1979 to 2000 average minimum date of September 13.
This year’s minimum was 760,000 square kilometers (293,000 square miles) below the previous record minimum extent in the satellite record, which occurred on September 18, 2007. This is an area about the size of the state of Texas. The September 2012 minimum was in turn 3.29 million square kilometers (1.27 million square miles) below the 1979 to 2000 average minimum, representing an area nearly twice the size of the state of Alaska. This year’s minimum is 18% below 2007 and 49% below the 1979 to 2000 average.
Overall there was a loss of 11.83 million square kilometers (4.57 million square miles) of ice since the maximum extent occurred on March 20, 2012, which is the largest summer ice extent loss in the satellite record, more than one million square kilometers greater than in any previous year.
Conditions in context
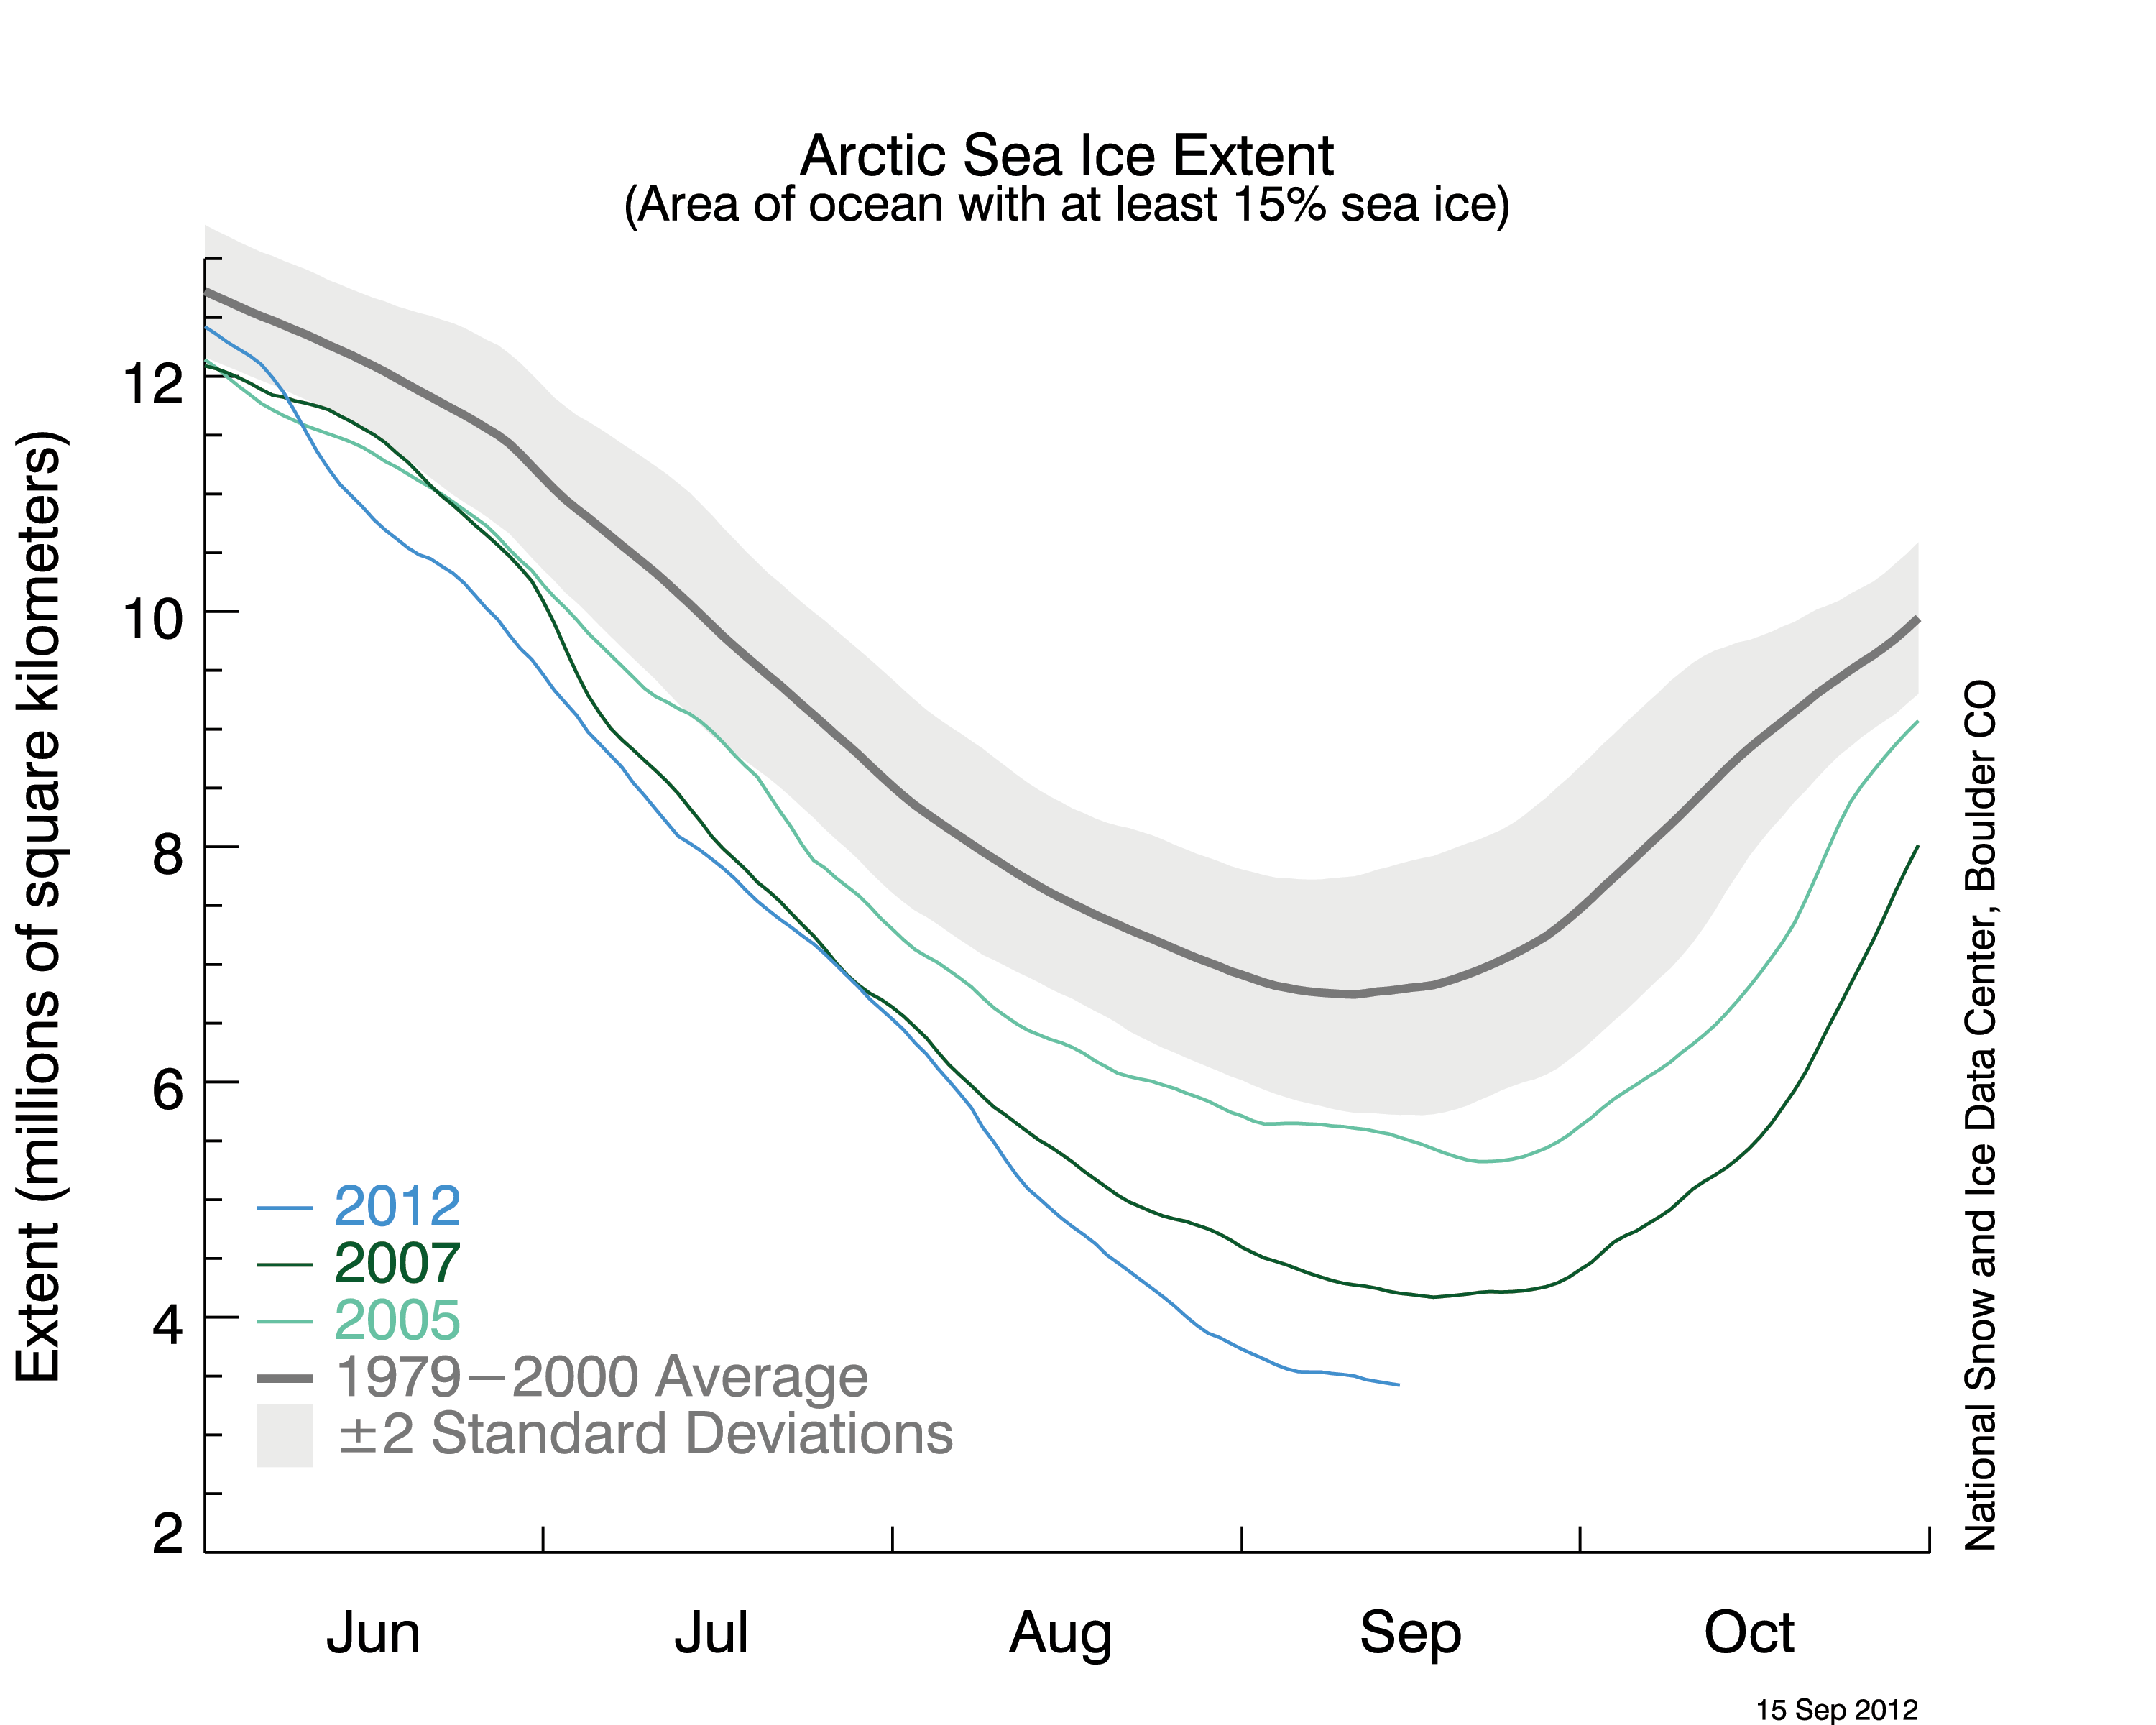
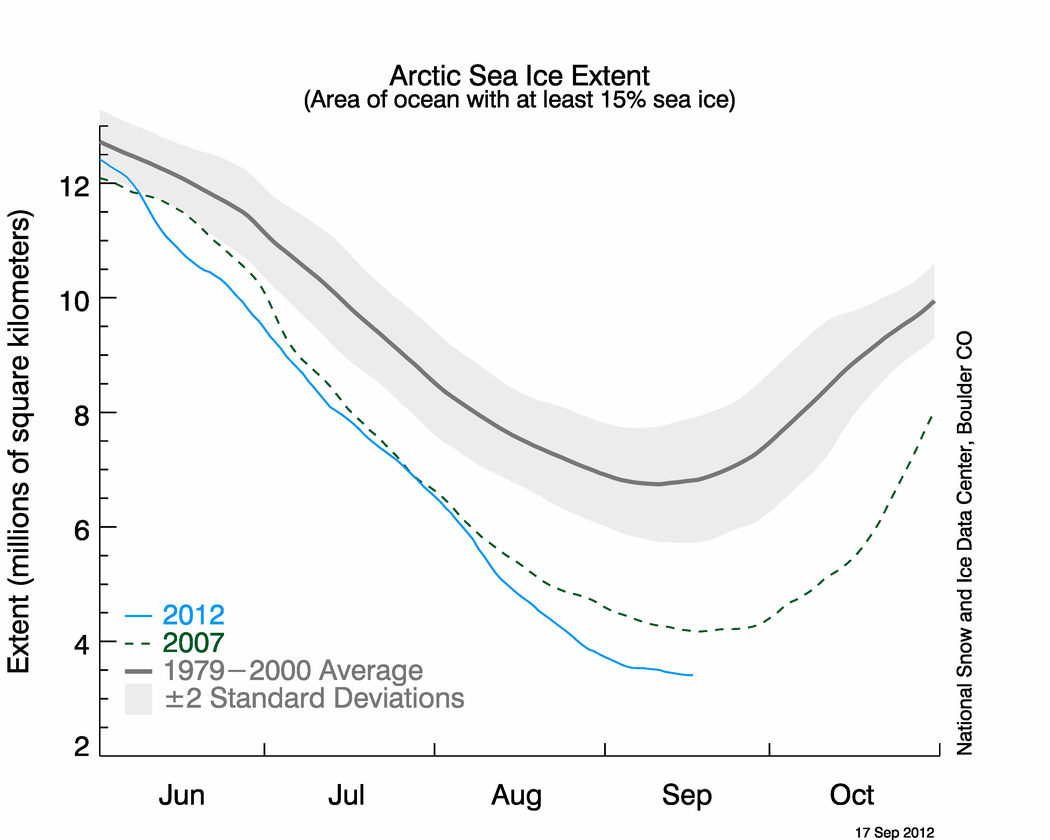
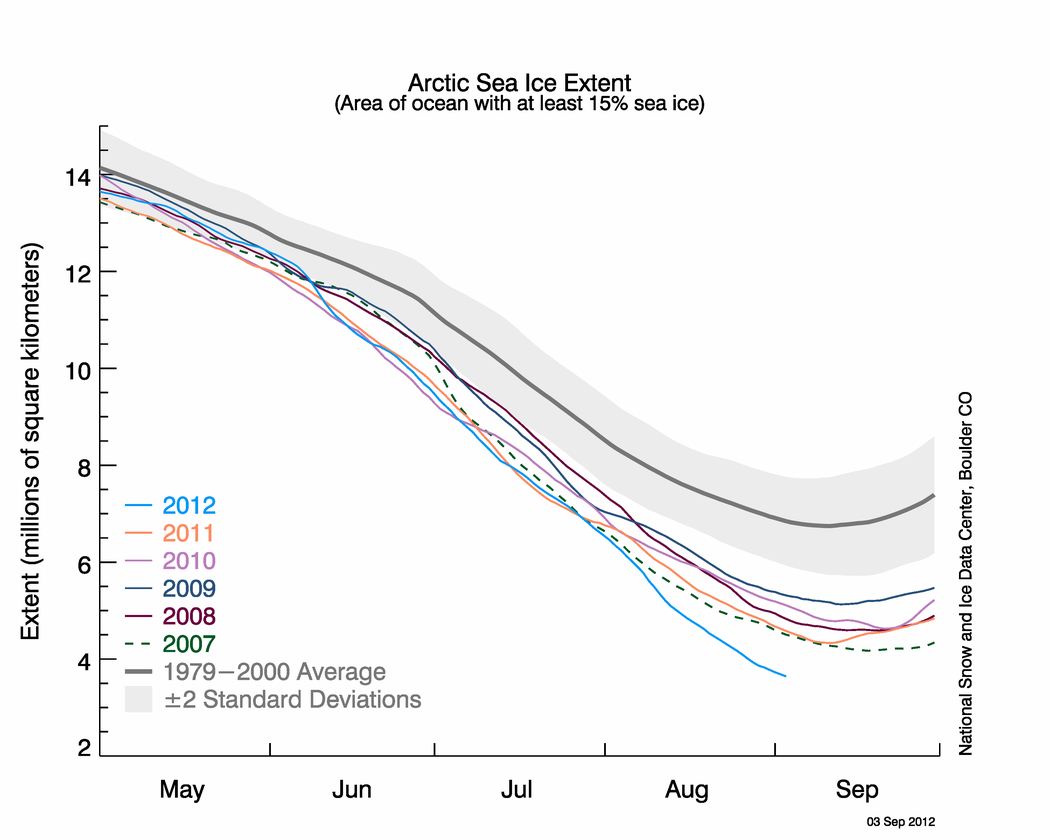
Figure 2. The graph above shows Arctic sea ice extent as of September 17, 2012, along with daily ice extent data for 2007 and 2005, the previous record low years. 2012 is shown in blue and 2007 in green. The gray area around the average line shows the two standard deviation range of the data. Sea Ice Index data.
Credit: National Snow and Ice Data Center
High-resolution image
The six lowest seasonal minimum ice extents in the satellite record have all occurred in the last six years (2007 to 2012). In contrast to 2007, when climatic conditions (winds, clouds, air temperatures) favored summer ice loss, this year’s conditions were not as extreme. Summer temperatures across the Arctic were warmer than average, but cooler than in 2007. The most notable event was a very strong storm centered over the central Arctic Ocean in early August. It is likely that the primary reason for the large loss of ice this summer is that the ice cover has continued to thin and become more dominated by seasonal ice. This thinner ice was more prone to be broken up and melted by weather events, such as the strong low pressure system just mentioned. The storm sped up the loss of the thin ice that appears to have been already on the verge of melting completely.
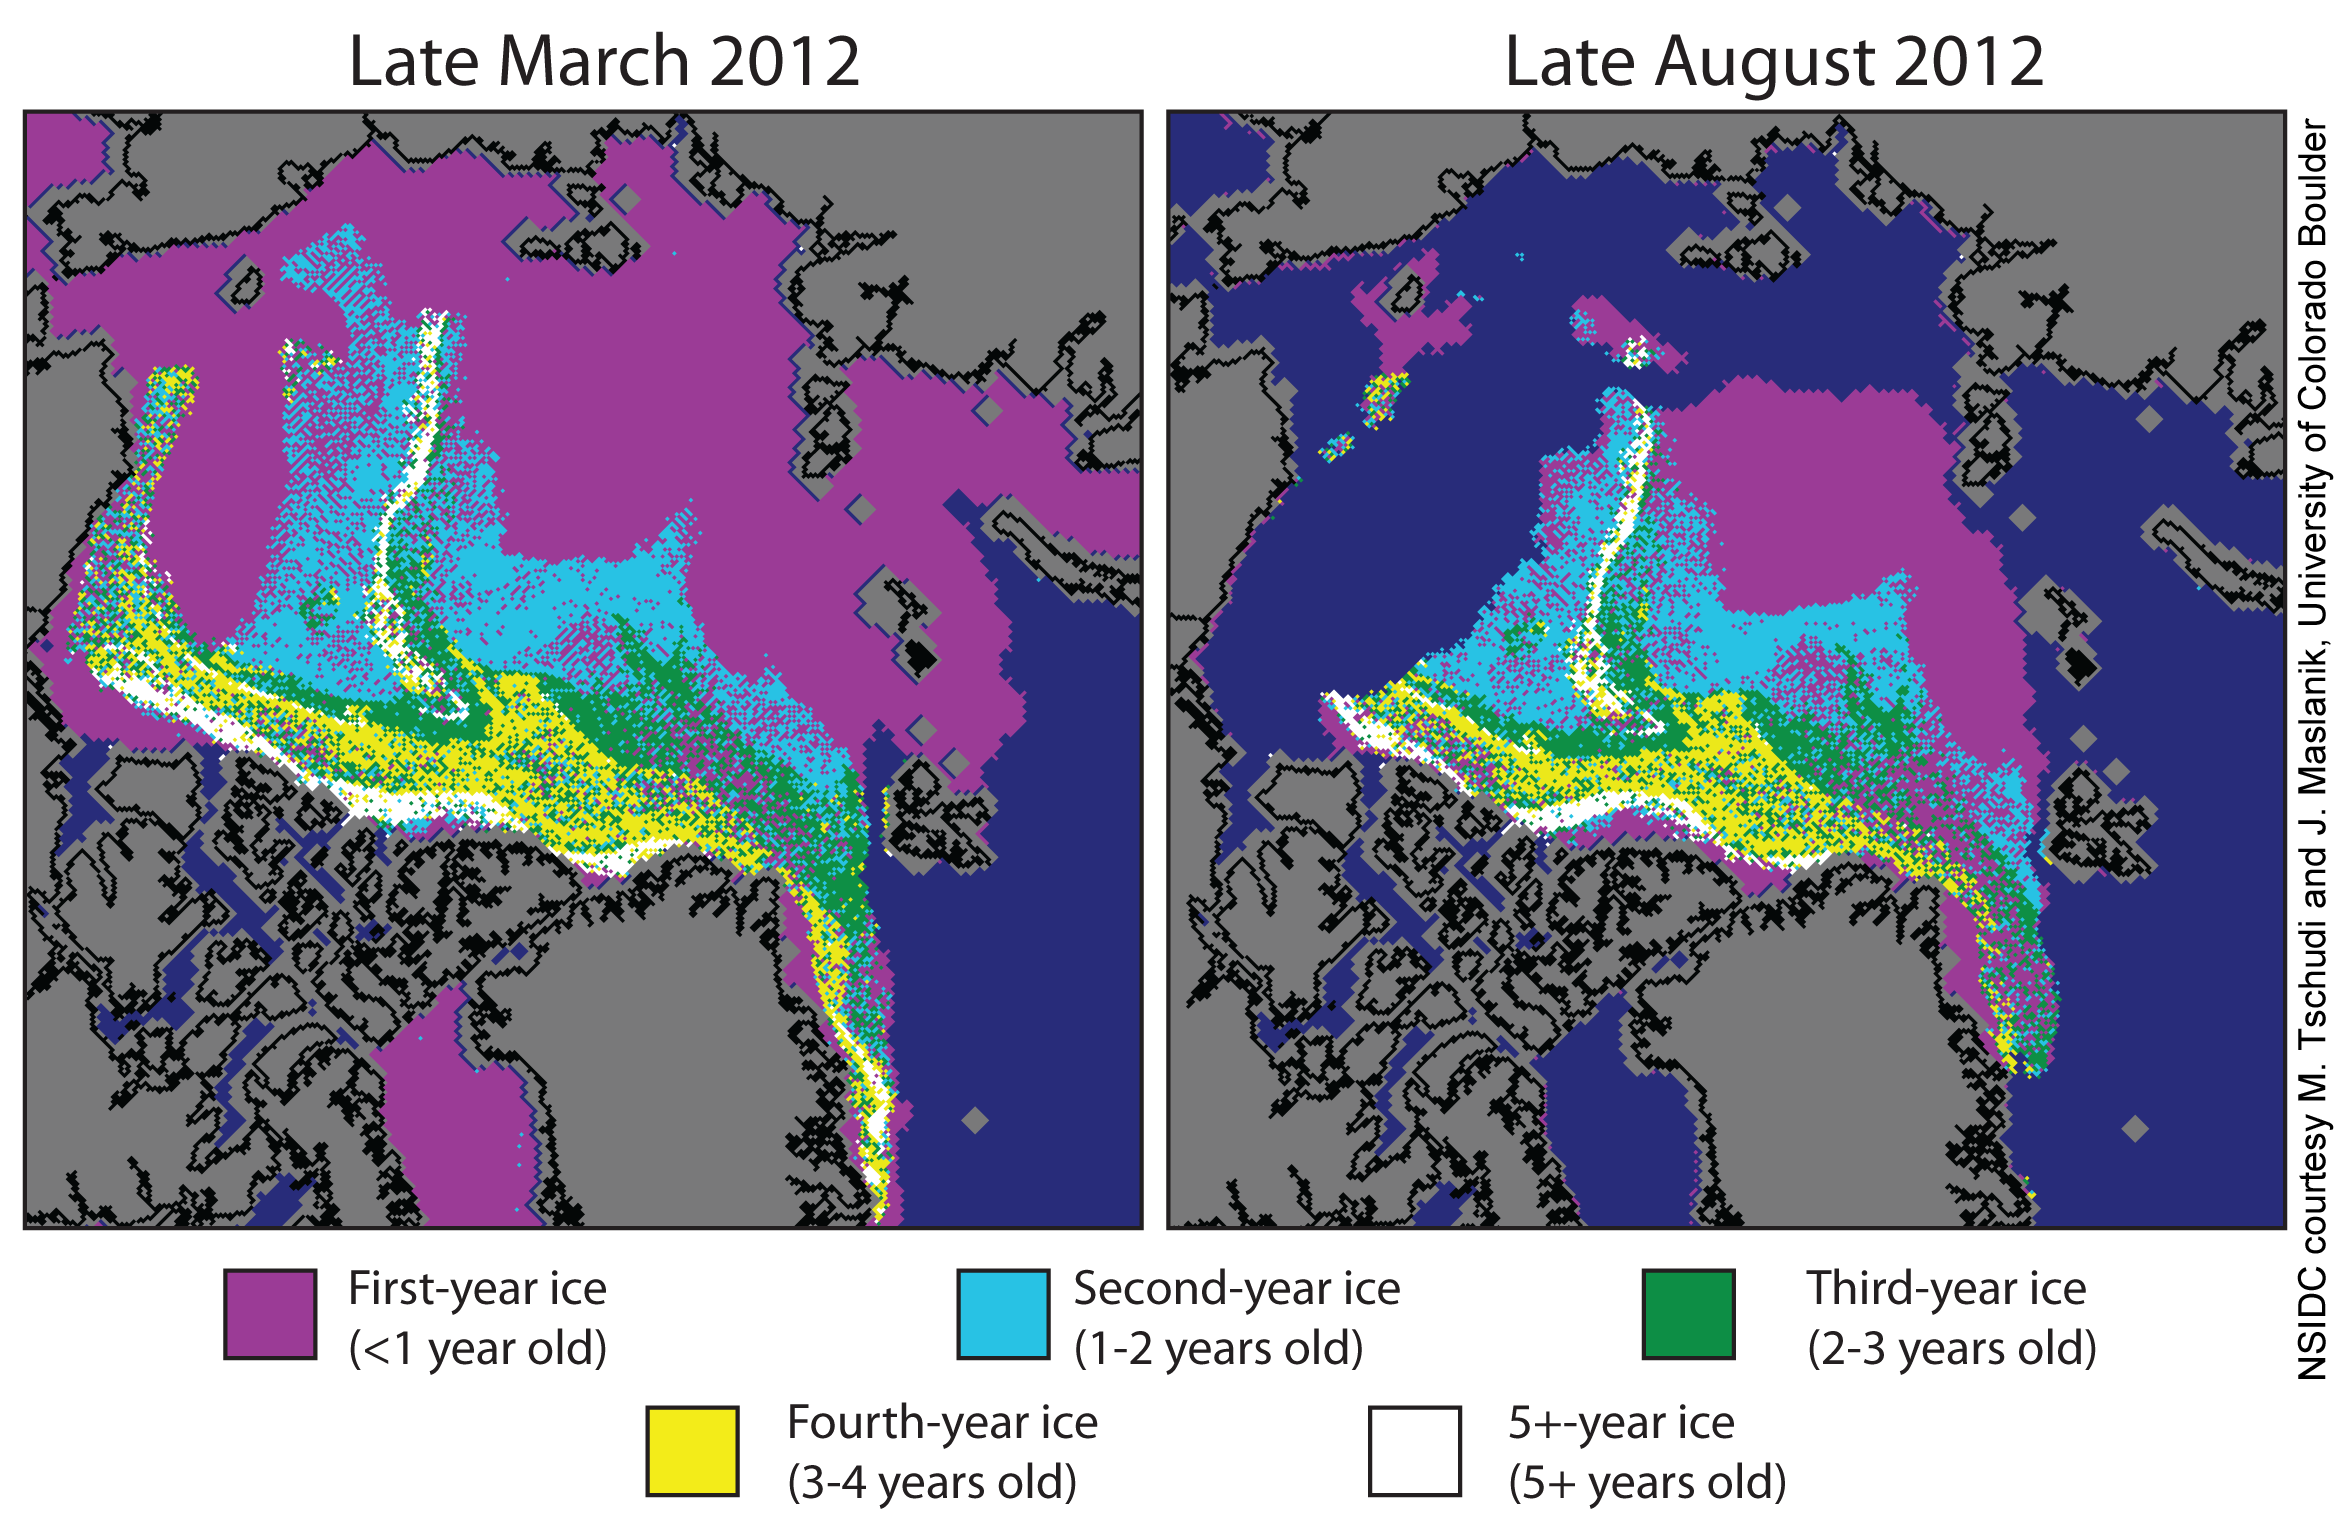
Varying distribution of ice in 2012 vs. 2007
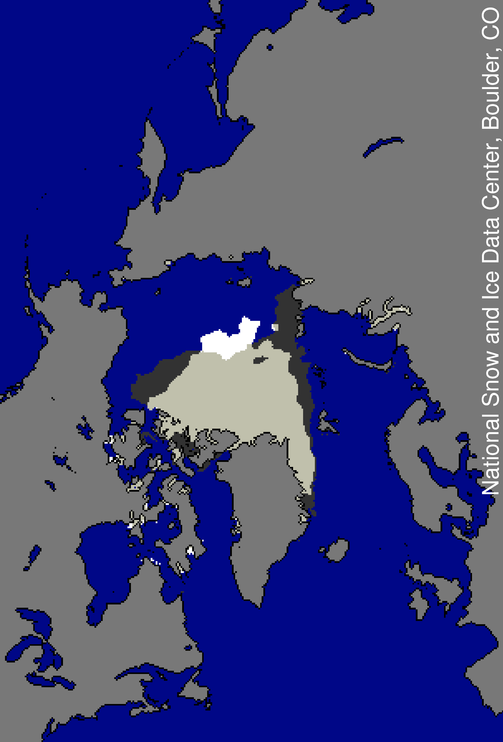
Figure 3. The image above shows the different distribution of ice extent at the time of the September 2012 minimum, compared to the September 2007 minimum. Dark gray indicates where ice extent was present only in 2007; white indicates where ice extent was present only in 2012; and light gray shows where ice extent was present in both 2007 and 2012.
Credit: National Snow and Ice Data Center
High resolution image
The spatial pattern of ice extent at this year’s seasonal minimum is different than that observed for 2007. This year the ice is more extensive in some parts of the central Arctic Ocean. However, the ice is less extensive this year compared to 2007 in the Beaufort Sea, the western Laptev Sea, the East Greenland Sea, and parts of the Canadian Archipelago. As mentioned in our previous post, the Northern Sea Route opened around mid August this year, compared to 2007 when a tongue of ice extended to the coast, blocking the route throughout the summer.
Previous minimum Arctic sea ice extents
| Year | Minimum Ice Extent | Date | |
|---|---|---|---|
| in millions of square kilometers | in millions of square miles | ||
| 2007 | 4.17 | 1.61 | September 18 |
| 2008 | 4.59 | 1.77 | September 20 |
| 2009 | 5.13 | 1.98 | September 13 |
| 2010 | 4.63 | 1.79 | September 21 |
| 2011 | 4.33 | 1.67 | September 11 |
| 2012 | 3.41 | 1.32 | September 16 |
| 1979 to 2000 average | 6.70 | 2.59 | September 13 |
| 1979 to 2010 average | 6.14 | 2.37 | September 15 |
Note that the dates and extents of the minimums have changed since we originally posted in 2007; see our Frequently Asked Questions for more information.