Arctic sea ice extent breaks 2007 record low

Arctic sea ice appears to have broken the 2007 record daily extent and is now the lowest in the satellite era. With two to three more weeks left in the melt season, sea ice continues to track below 2007 daily extents.

Please note that this is not an announcement of the sea ice minimum extent for 2012. NSIDC will release numbers for the 2012 daily minimum extent when it occurs. A full analysis of the melt season will be published in early October, once monthly data are available for September.

Overview of conditions

Figure 1. Arctic sea ice extent for August 26, 2012 (right) was 4.10 million square kilometers (1.58 million square miles), which was 70,000 square kilometers (27,000 square miles) below the September 18, 2007 daily extent of 4.17 million square kilometers (1.61 million square miles, left). The orange line shows the 1979 to 2000 median extent for that day. The black cross indicates the geographic North Pole. Sea Ice Index data. About the data.


Credit: National Snow and Ice Data Center
High-resolution images: Figure 1a , Figure 1b

Arctic sea ice extent fell to 4.10 million square kilometers (1.58 million square miles) on August 26, 2012. This was 70,000 square kilometers (27,000 square miles) below the September 18, 2007 daily extent of 4.17 million square kilometers (1.61 million square miles).

Including this year, the six lowest ice extents in the satellite record have occurred in the last six years (2007 to 2012).

Conditions in context

Figure 2. The graph above shows Arctic sea ice extent as of August 26, 2012, along with daily ice extent data for 2007, the previous record low year, and 1980, the record high year. 2012 is shown in blue, 2007 in green, and 1980 in orange. The 1979 to 2000 average is in dark gray. The gray area around this average line shows the two standard deviation range of the data. The 1981 to 2010 average is in sky blue. Sea Ice Index data.

Credit: National Snow and Ice Data Center
High-resolution image  


After tracking near 2007 levels through July, the extent declined rapidly in early August. Since then, the loss rate has slowed some, averaging about 75,000 square kilometers (29,000 square miles) per day—equivalent to the size of the state of South Carolina. However, this is still much faster than the normal rate at this time of year of about 40,000 square kilometers per day (15,000 square miles).

Note that the date and extent of the 2007 minimum have changed since we originally posted in 2007; see our Frequently Asked Questions for more information.


A summer storm in the Arctic

Arctic sea ice extent during the first two weeks of August continued to track below 2007 record low daily ice extents. As of August 13, ice extent was already among the four lowest summer minimum extents in the satellite record, with about five weeks still remaining in the melt season. Sea ice extent dropped rapidly between August 4 and August 8. While this drop coincided with an intense storm over the central Arctic Ocean, it is unclear if the storm prompted the rapid ice loss. Overall, weather patterns in the Arctic Ocean through the summer of 2012 have been a mixed bag, with no consistent pattern.

Overview of conditions

Figure 1. Arctic sea ice extent for August 13, 2012 was 5.09 million square kilometers (1.97 million square miles), 483,000 square kilometers (186,000 square miles) below the same day in 2007. The orange line shows the 1979 to 2000 median extent for that day. The black cross indicates the geographic North Pole. Sea Ice Index data. About the data

Credit: National Snow and Ice Data Center
High-resolution image

Arctic sea ice extent on August 13 was 5.09 million square kilometers (1.97 million square miles). This is 2.69 million square kilometers (1.04 million square miles) below the 1979 to 2000 average extent for the date, and is 483,000 square kilometers (186,000 square miles) below the previous record low for the date, which occurred in 2007. ( Note: The sea ice extent originally published on August 14, 2012 was the actual one-day value for August 13. We normally report the five-day trailing mean, so to be consistent we have updated the post with these numbers instead of the one-day value. See the Sea Ice Index Documentation for more information about the five-day trailing mean.) Low extent for the Arctic as a whole is driven by extensive open water on the Atlantic side of the Arctic, the Beaufort Sea, and—due to rapid ice loss over the past two weeks—the East Siberian Sea. Ice is near its normal (1979 to 2000) extent only off the northeastern Greenland coast. Ice near the coast in eastern Siberia continues to block sections of the Northern Sea Route. The western entrance to the Northwest Passage via McClure Strait remains blocked.

Conditions in context

Figure 2. The graph above shows Arctic sea ice extent as of August 13, 2012, along with daily ice extent data for the previous five years. 2012 is shown in blue, 2011 in orange, 2010 in pink, 2009 in navy, 2008 in purple, and 2007 in green. The gray area around the average line shows the two standard deviation range of the data. Sea Ice Index data.

Credit: National Snow and Ice Data Center
High-resolution image

The average pace of ice loss since late June has been rapid at just over 100,000 square kilometers (38,000 square miles) per day. However, this pace nearly doubled for a few days in early August during a major Arctic cyclonic storm, discussed below. Unlike the summer of 2007 when a persistent pattern of high pressure was present over the central Arctic Ocean and a pattern of low pressure was over the northern Eurasian coast, the summer of 2012 has been characterized by variable conditions. Air tempertures at the 925 hPa level (about 3000 feet above the ocean surface) of 1 to 3 degrees Celsius (1.8 to 5.4 degrees Fahrenheit) above the 1981 to 2012 average have been the rule from central Greenland, northern Canada, and Alaska northward into the central Arctic Ocean. Cooler than average conditions (1 to 2 degrees Celsius or 1.8 to 3.6 degrees Fahrenheit) were observed in a small region of eastern Siberia extending into the East Siberian Sea, helping explain the persistence of low concentration ice in this region through early August.

The Great Arctic Cyclone of 2012

Figure 3. This subsection of the surface weather analysis from the Canadian Meteorological Centre for August 6, 2012 (at 0600 Greenwich Mean Time) shows a very strong cyclone over the central Arctic Ocean north of Alaska. The isobars (lines of equal pressure) are very tightly packed around the low pressure system, indicating strong winds. Greenland is on the right side of the figure while Canada is at the bottom.

Credit: Canadian Meteorological Centre
High-resolution image

A low pressure system entered the Arctic Ocean from the eastern Siberian coast on August 4 and then strengthened rapidly over the central Arctic Ocean. On August 6 the central pressure of the cyclone reached 964 hPa, an extremely low value for this region. It persisted over the central Arctic Ocean over the next several days, and slowly dissipated. The storm initially brought warm and very windy conditions to the Chukchi and East Siberian seas (August 5), but low temperatures prevailed later.

Figure 4. These maps of sea ice concentration from the Special Sensor Microwave Imager/Sounder (SSMIS) passive microwave sensor highlight the very rapid loss of ice in the western Arctic (northwest of Alaska) during the strong Arctic storm. Magenta and purple colors indicate ice concentration near 100%; yellow, green, and pale blue indicate 60% to 20% ice concentration.

Credit: National Snow and Ice Data Center courtesy IUP Bremen
High-resolution image

Low pressure systems over the Arctic Ocean tend to cause the ice to diverge or spread out and cover a larger area. These storms often bring cool conditions and even snowfall. In contrast, high pressure systems over the Arctic cause the sea ice to converge. Summers dominated by low pressure systems over the central Arctic Ocean tend to end up with greater ice extent than summers dominated by high pressure systems.

However, the effects of an individual strong storm, like that observed in early August, can be complex. While much of the region influenced by the August cyclone experienced a sudden drop in temperature, areas influenced by winds from the south experienced a rise in temperature. Coincident with the storm, a large area of low concentration ice in the East Siberian Sea (concentrations typically below 50%) rapidly melted out. On three consecutive days (August 7, 8, and 9), sea ice extent dropped by nearly 200,000 square kilometers (77,220 square miles). This could be due to mechanical break up of the ice and increased melting by strong winds and wave action during the storm. However, it may be simply a coincidence of timing, given that the low concentration ice in the region was already poised to rapidly melt out.

Further Reading

Long, Z. and W. Perrie. 2012. Air-sea interactions during an Arctic storm. Journal of Geophysical Research, 117, D15103, doi:10.1029/2011JD016985.

Screen, J. A., I. Simmonds, and K. Keay. 2011. Dramatic interannual changes of perennial Arctic sea ice linked to abnormal summer storm activity. Journal of Geophysical Research, 116, D15105, doi:10.1029/2011JD015847.

Serreze, M. C. and A. P. Barrett. 2008. The summer cyclone maximum over the central Arctic Ocean. Journal of Climate, 21, doi:10.1175/2007JCLI1810.1.

A most interesting Arctic summer

Arctic sea ice extent declined quickly in July, continuing the pattern seen in June. On August 1, ice extent was just below levels recorded for the same date in 2007, the year that saw the record minimum ice extent in September. Low sea ice concentrations are present over large parts of the western Arctic Ocean. Warm conditions dominated the weather for most of the Arctic Ocean and surrounding lands. For a brief period in early July, nearly all of the Greenland ice sheet experienced surface melt, a rare event.

Overview of conditions

Sea ice image for July 2012

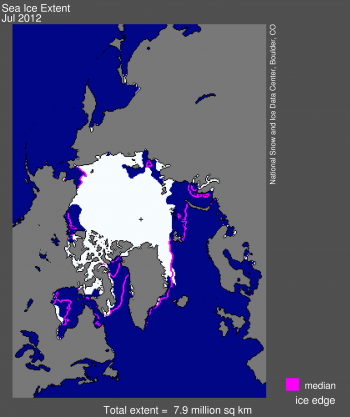
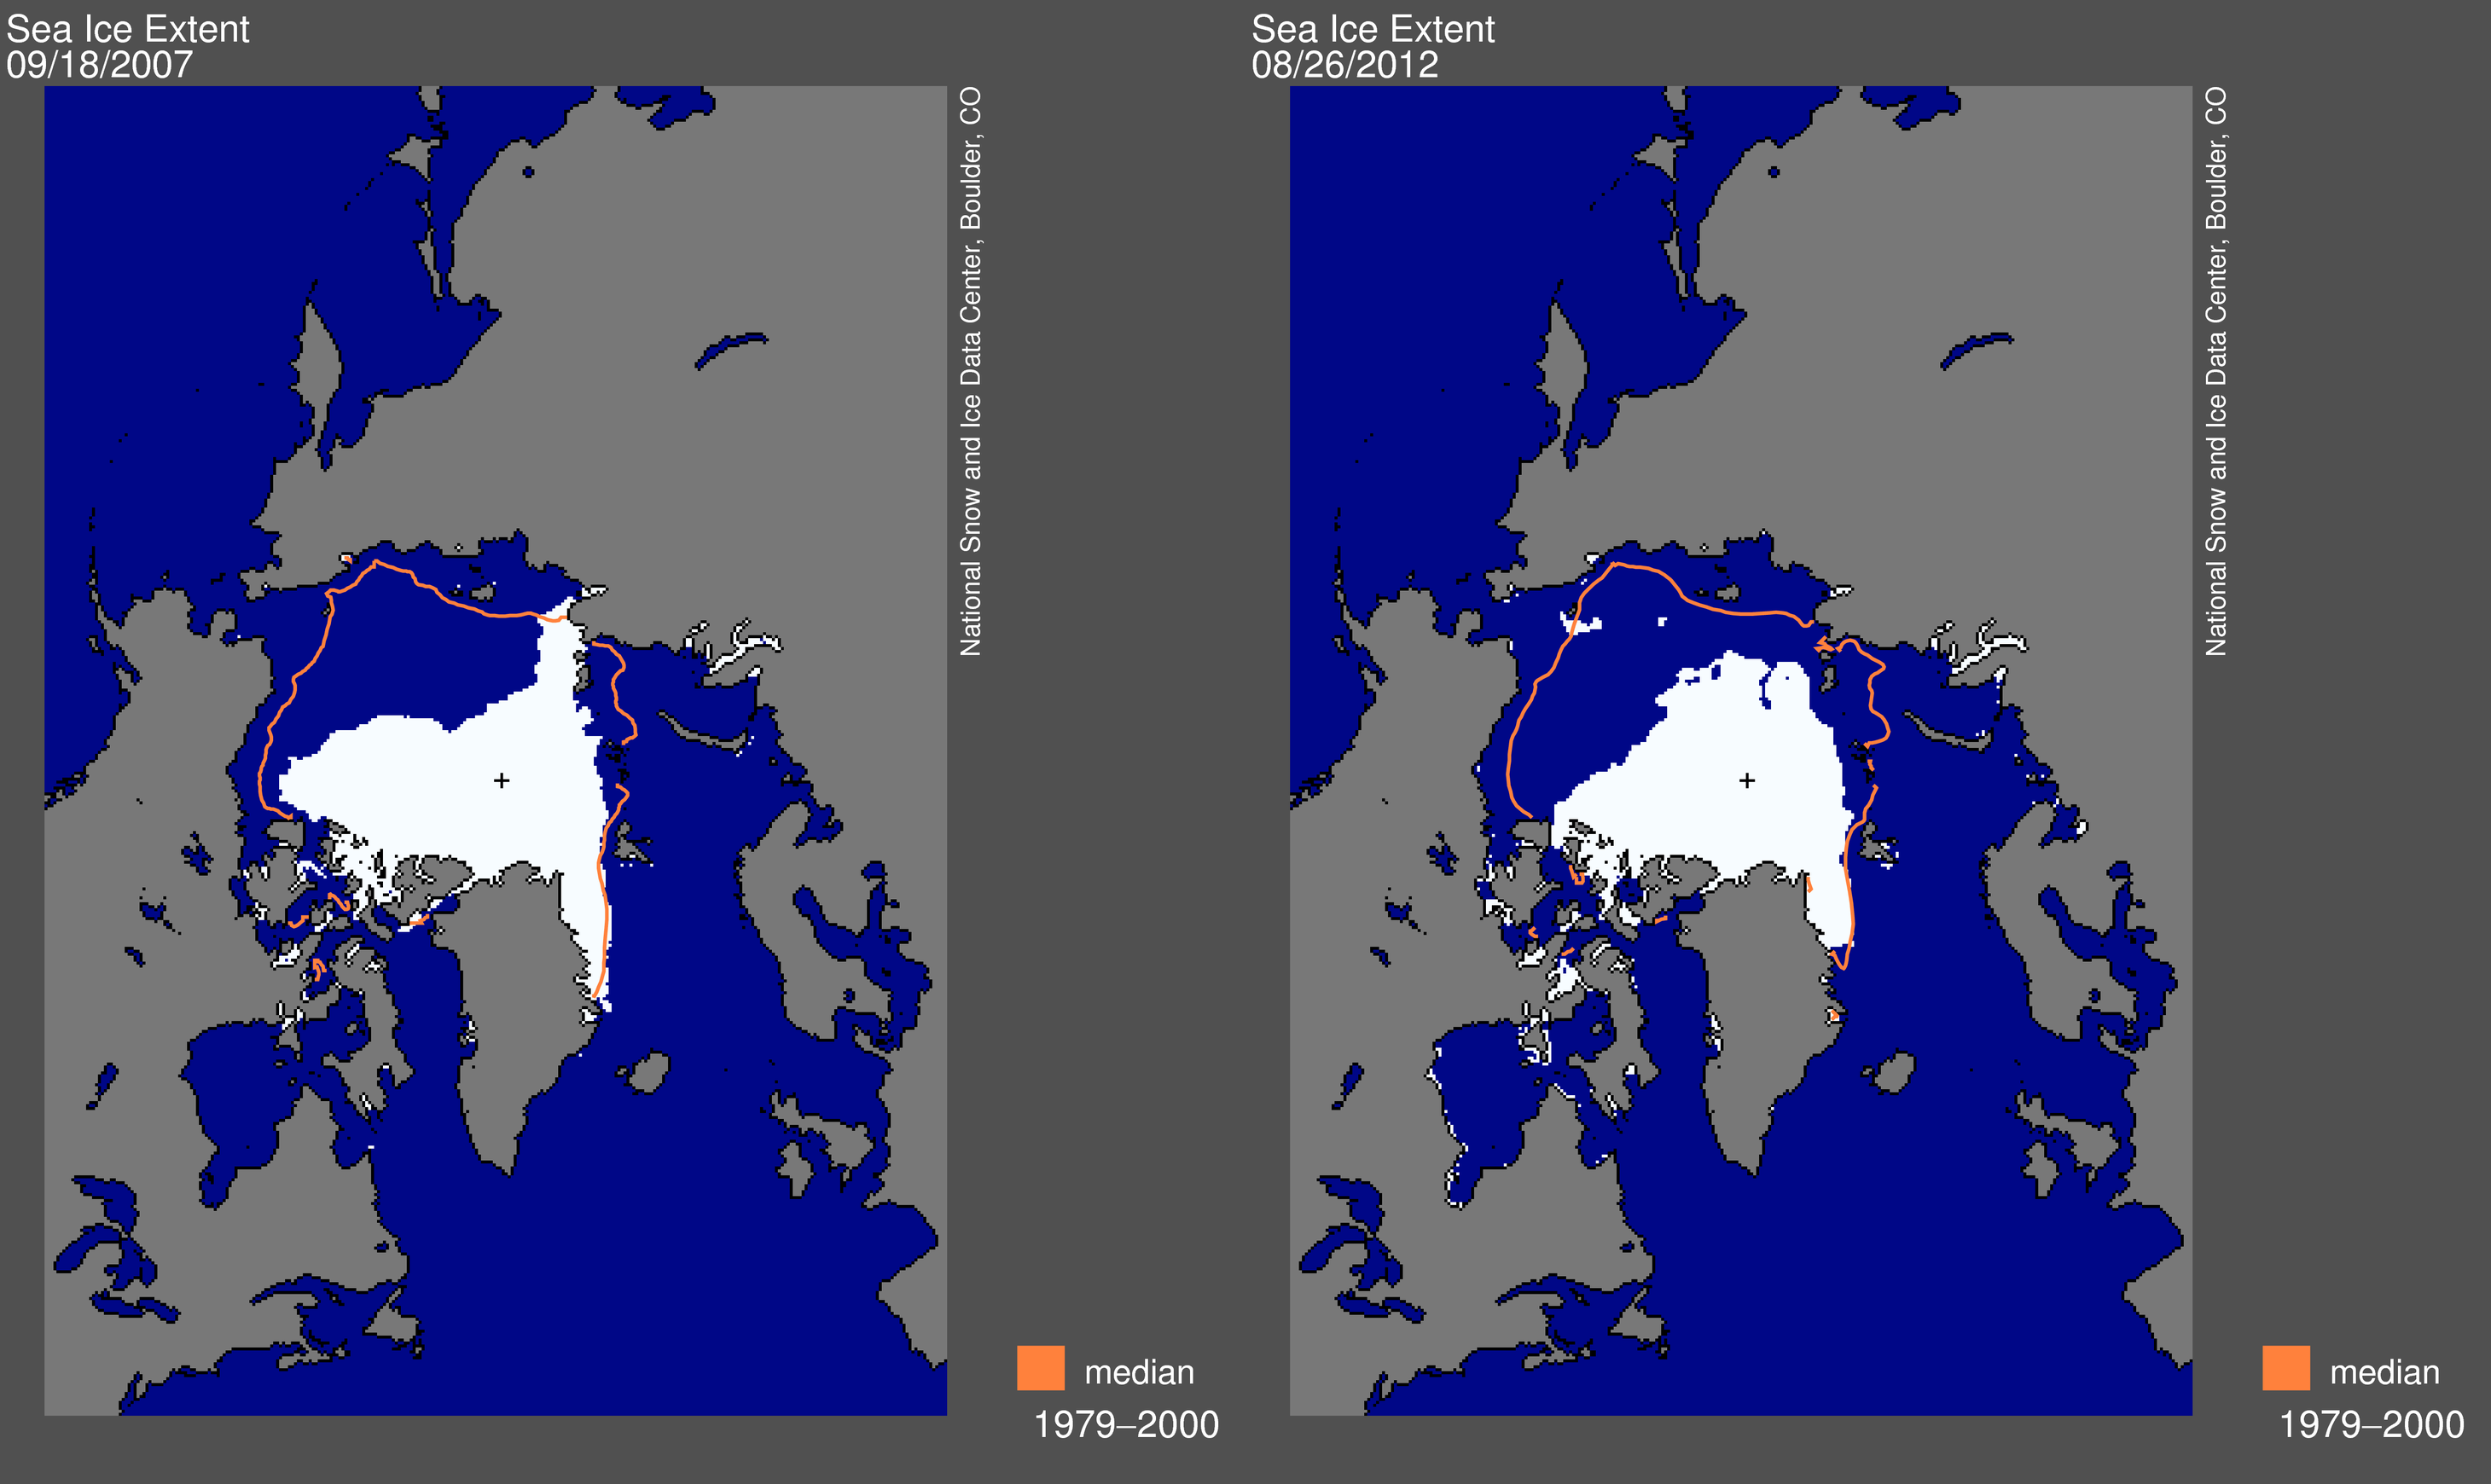
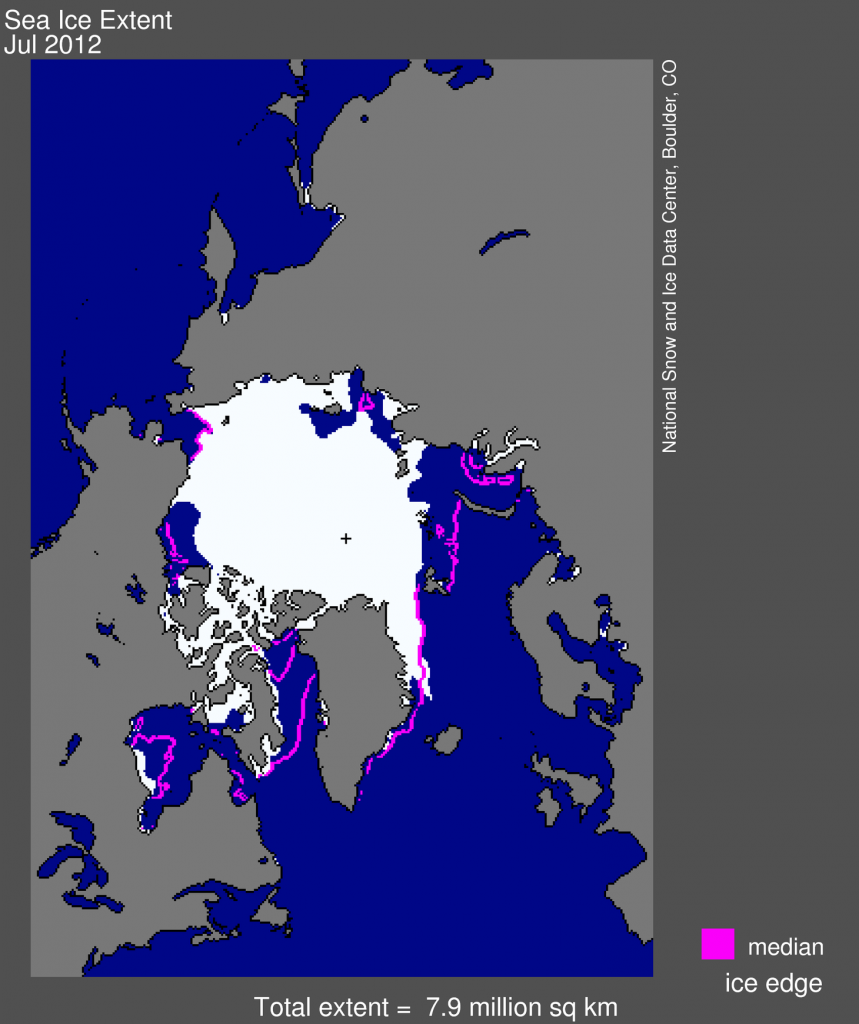
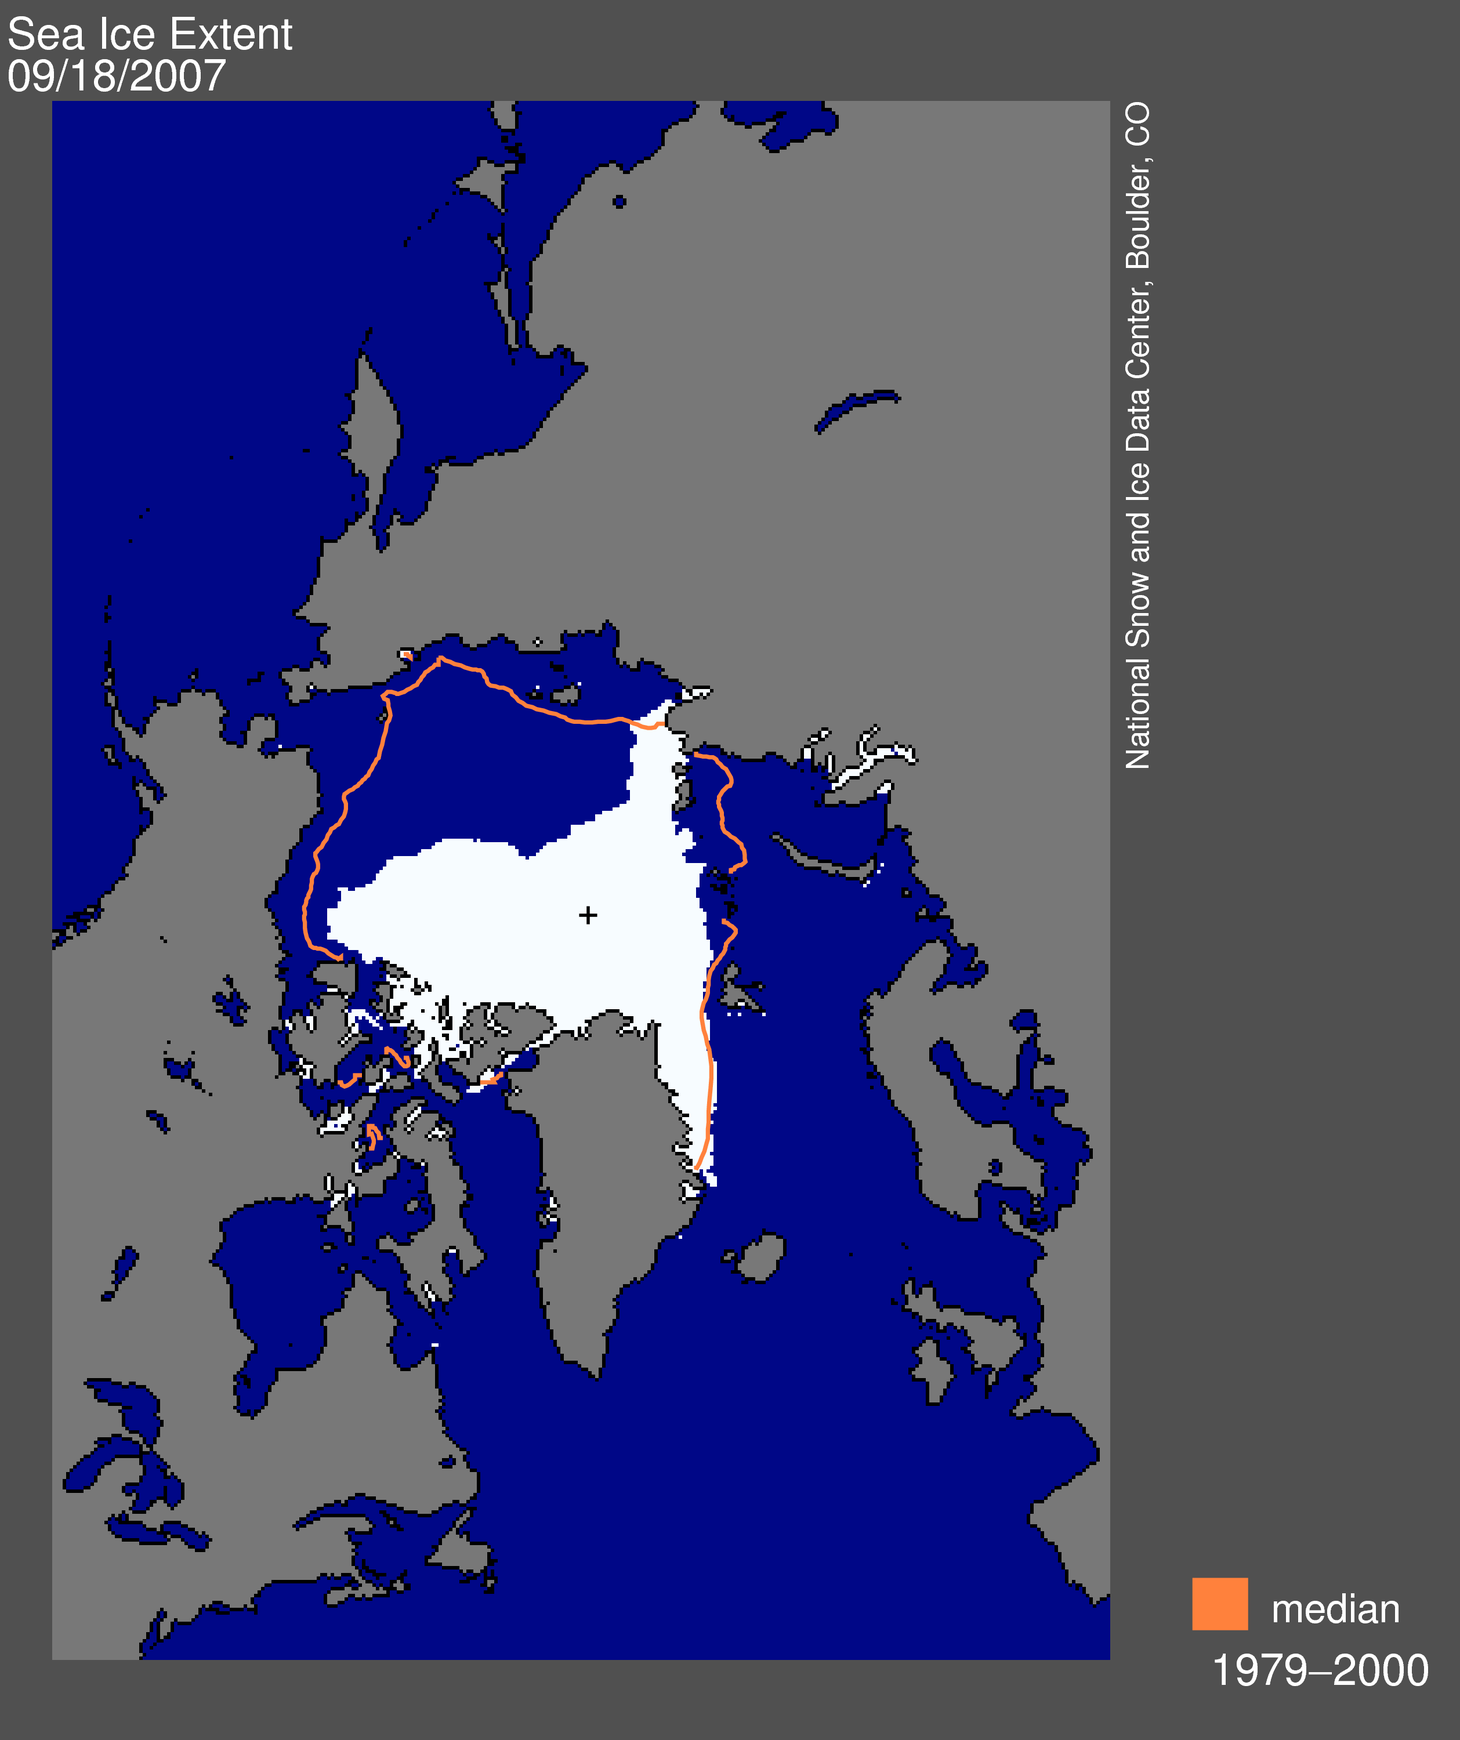
Figure 1. Arctic sea ice extent for July 2012 was 7.94 million square kilometers (3.07 million square miles). The magenta line shows the 1979 to 2000 median extent for that month. The black cross indicates the geographic North Pole. Sea Ice Index data. About the data

Credit: National Snow and Ice Data Center
High-resolution image

Arctic sea ice extent for July 2012 averaged 7.94 million square kilometers (3.07 million square miles). This was 2.12 million square kilometers (819,000 square miles) below the 1979 to 2000 average extent. July 2012 ice extent was 20,000 square kilometers (7,700 square miles) above the 2011 record July low.

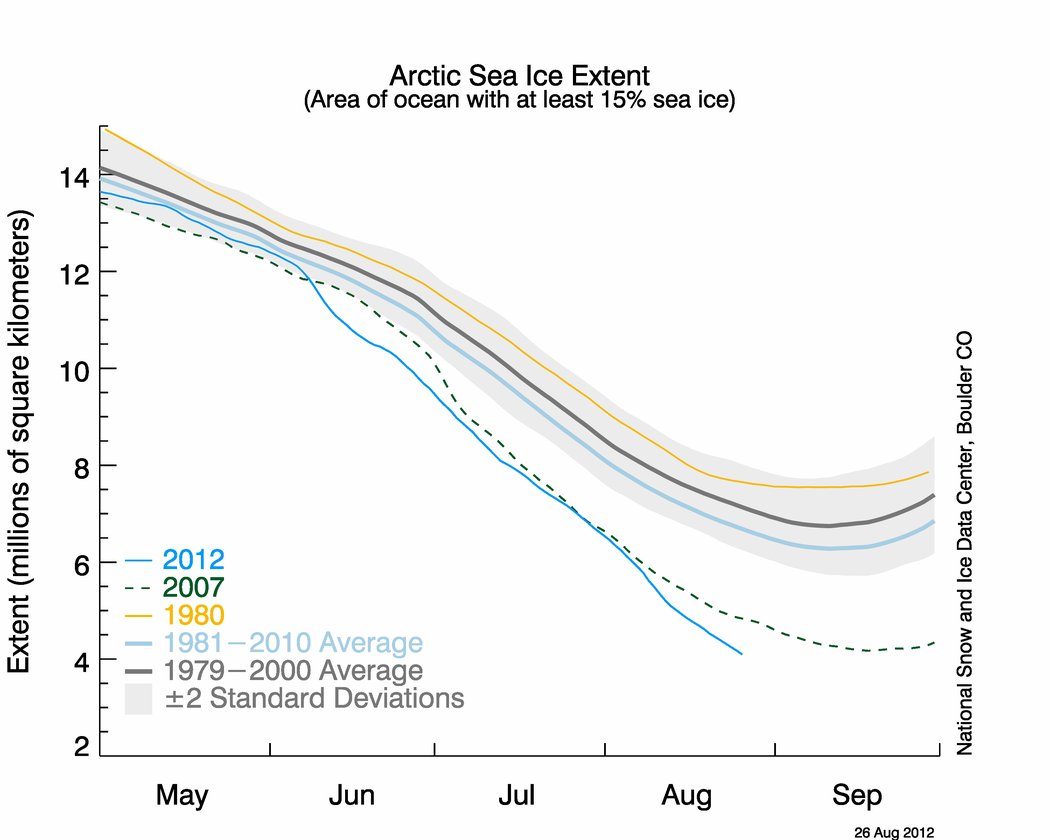
As throughout the summer, the low ice extent for the Arctic as a whole is primarily due to extensive open water on the Atlantic side of the Arctic (Kara, Laptev and East Siberian seas) and the Beaufort Sea. By August 1, open water in the Laptev Sea, along the Siberian coast, had reached nearly 80oN latitude. Ice extent remains near average in the Chukchi Sea, and ice continues to block sections of the both the Northern Sea Route and the Northwest Passage. The ice extent recorded for August 1 of 6.53 million square kilometers (2.52 million square kilometers) is the lowest in the satellite record. The previous record for the same date was set in 2007 at 6.64 million square kilometers (2.56 million square miles), when the current record low September ice extent was set.

Conditions in context

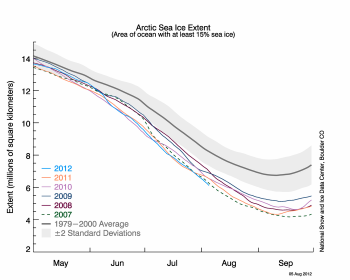
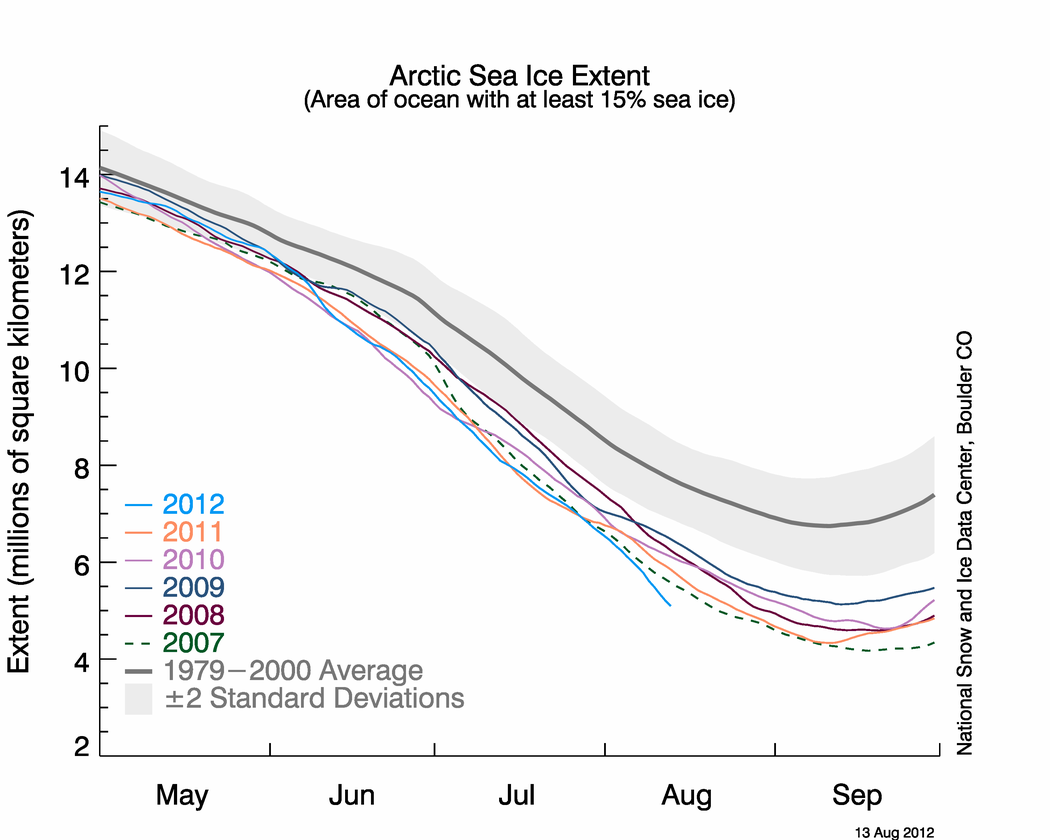
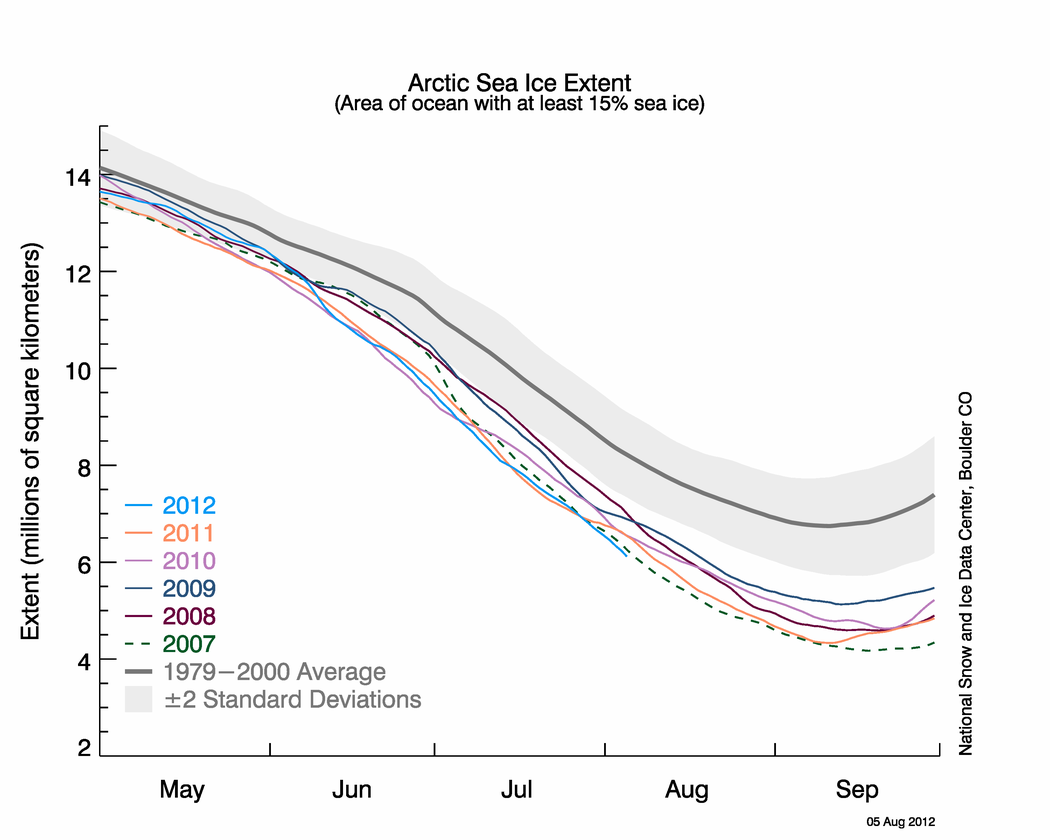
Figure 2. The graph above shows Arctic sea ice extent as of August 5, 2012, along with daily ice extent data for the 2011 and for 2007, the record low year. 2012 is shown in blue, 2011 in orange, and 2007 in green. The gray area around the average line shows the two standard deviation range of the data. Sea Ice Index data.

Credit: National Snow and Ice Data Center
High-resolution image

In July, the Arctic lost a total of 2.97 million square kilometers (1.15 million square miles) of ice. The largest July total loss, 3.53 million square kilometers (1.36 million square miles) occurred in the year 2007. Warm conditions prevailed over most of the Arctic Ocean; temperatures at the 925 hPa level (about 3,000 feet above the ocean surface) were typically 1 to 3 degrees Celsius (1.8 to 5.4 degrees Fahrenheit) above the 1981 to 2010 average over the Beaufort Sea and regions to the north, as well as over Baffin Bay. By contrast, temperatures were 1 to 3 degrees Celsius below average over the Norwegian Sea. Weather patterns over the Arctic Ocean varied substantially through the month, as they have done throughout the melt season.

July 2012 compared to recent years

Graph of sea ice extent trend

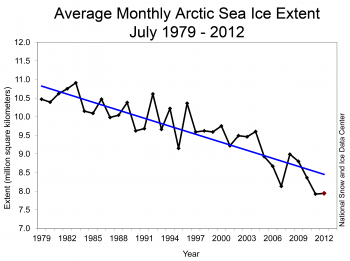
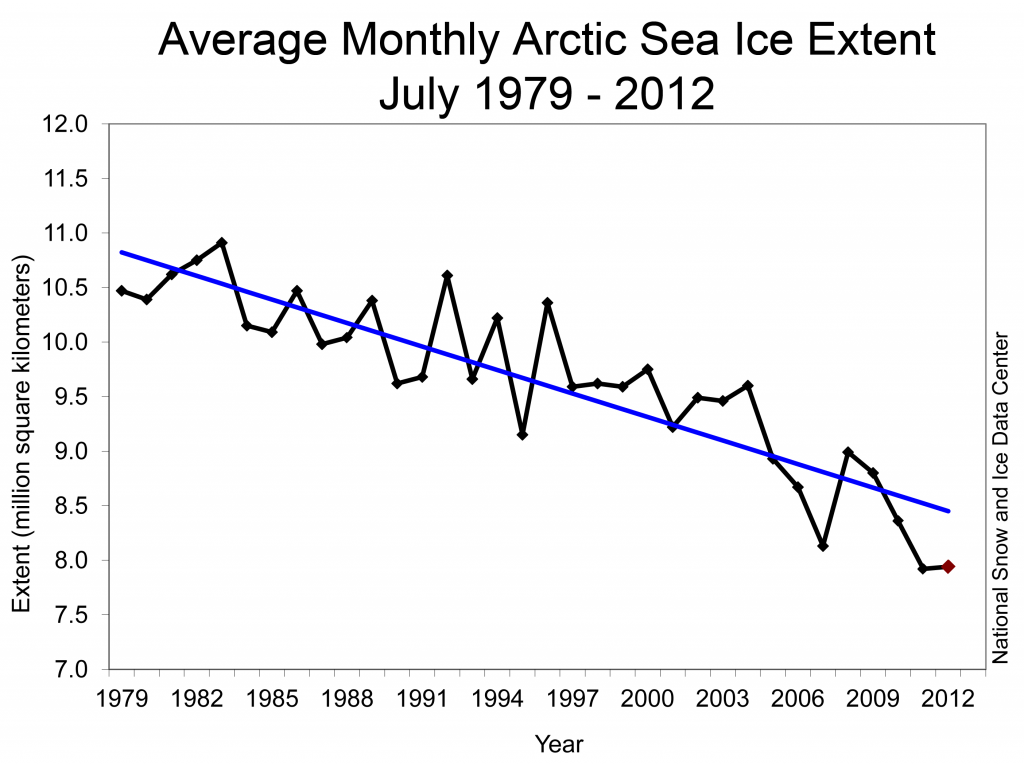
Figure 3. Monthly July ice extent for 1979 to 2012 shows a decline of 7.1% per decade.

Credit: National Snow and Ice Data Center
High-resolution image

Arctic sea ice extent for July 2012 was the second lowest in the satellite record, behind 2011. Through 2012, the linear rate of decline for July Arctic ice extent over the satellite record is 7.1% per decade.

MODIS data shows low concentration ice

MODIS image of sea ice

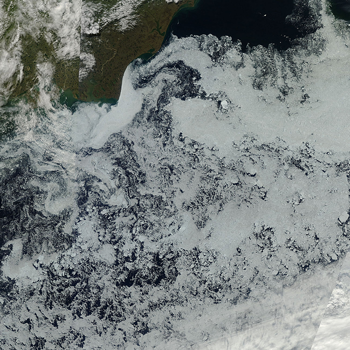
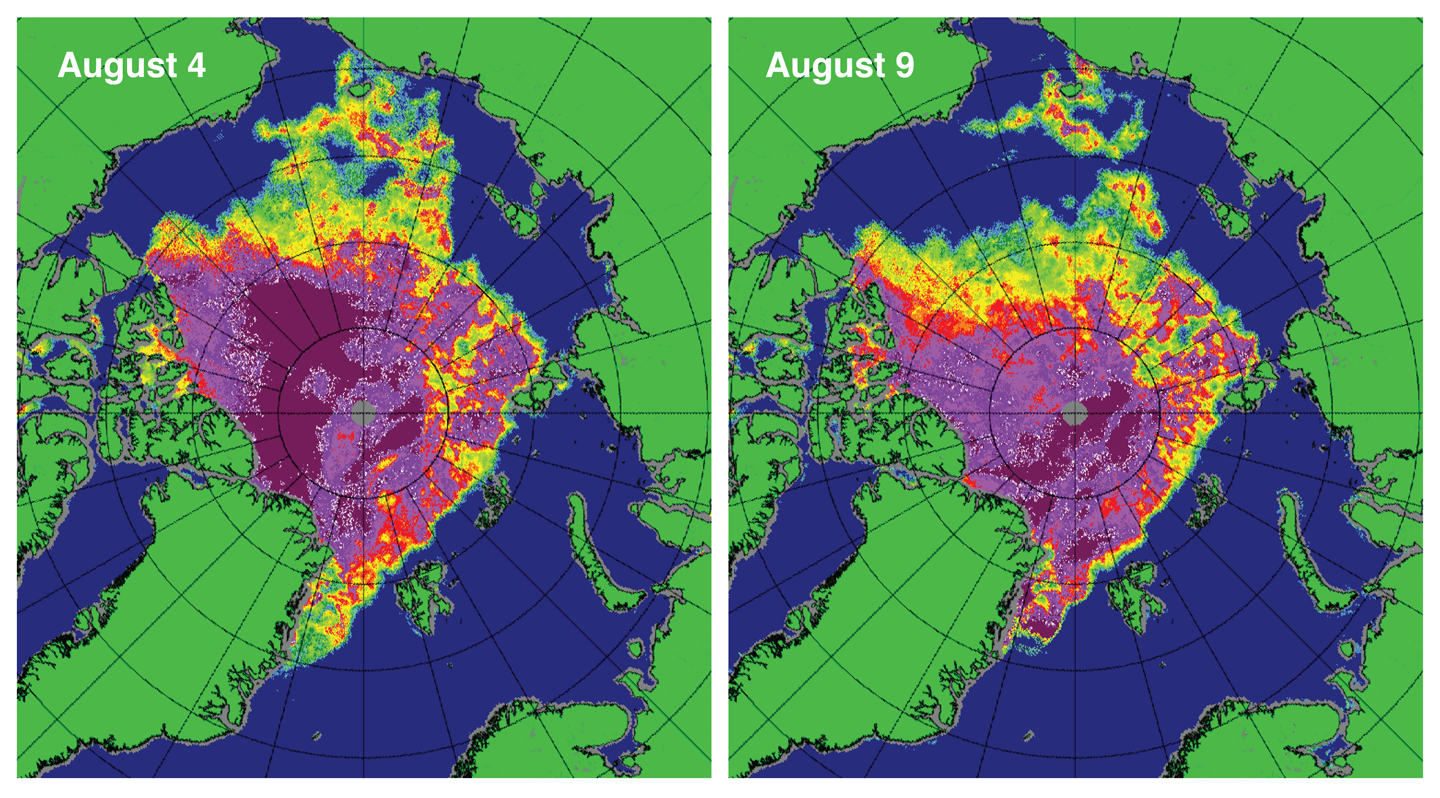
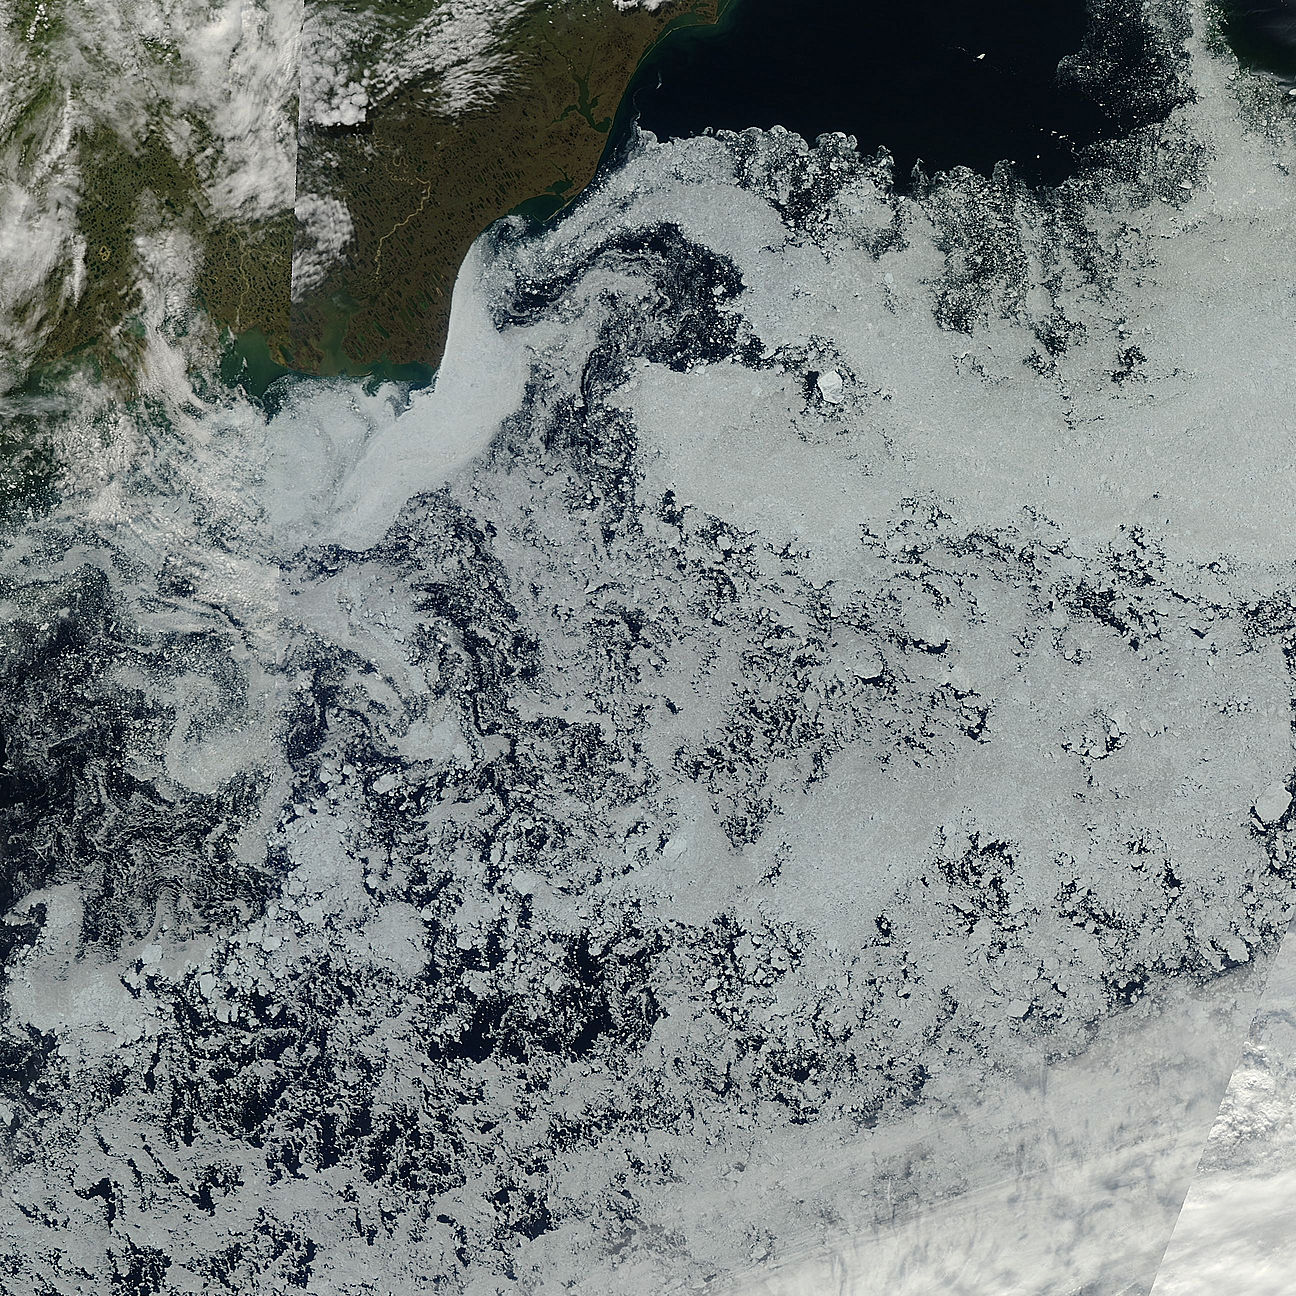
Figure 4. This image from the Moderate Resolution Imaging Spectroradiometer (MODIS), taken in late July, shows areas of low concentration sea ice in the Beaufort Sea, north of Alaska. Barrow, Alaska is at the top left. The resolution is 500 meters. The cloud band covering much of the lower right part of the image is associated with an approaching storm.

Credit: NASA Goddard Space Flight Center, Rapid Response
High-resolution image

In our last post (July 24, 2012) we commented on large areas of low ice concentration depicted in Special Sensor Microwave Imager/Sounder (SSMIS) data in the Beaufort and Chukchi seas, the Canadian Archipelago, the East Greenland Sea, and north of Siberia. These areas of low ice concentration ice can be seen clearly in visible-band data collected by the Moderate Resolution Imaging Spectroradiometer (MODIS) aboard NASA’s Aqua and Terra satellites.

The MODIS image shows polygonal floes of multi-year ice, as well as thin, gray first-year ice, and dark open water in the Beaufort Sea, north of Alaska. Most of these areas of low concentration ice will likely melt over the next month. Because MODIS senses light reflected from the surface as opposed to the emission of microwave radiation, its ability to see the surface depends on cloud cover.

Comparisons between observed and modeled September sea ice trends

Graph of sea ice model results

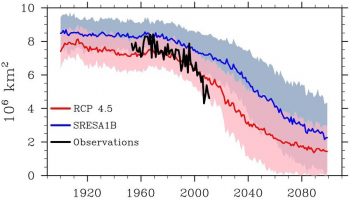
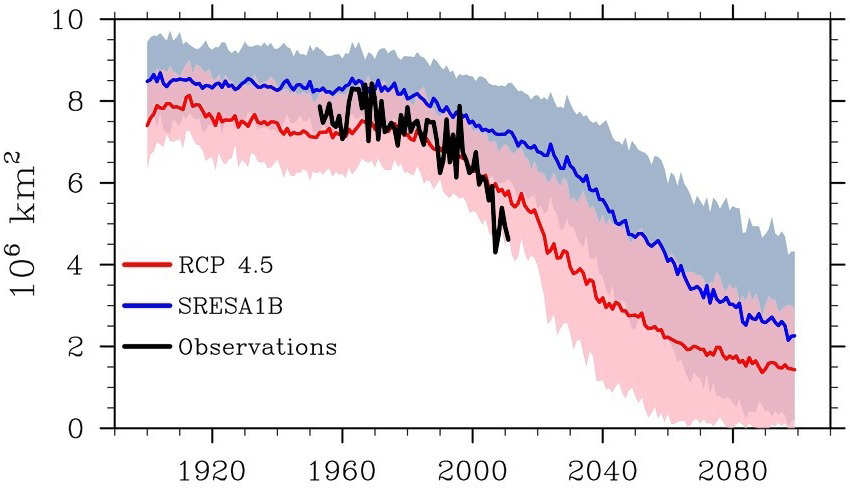
Figure 5. This figure shows the observed September sea ice extent for 1952 to 2011 (bold black line) and extents for 1900 to 2100 from the CMIP3 models using the “business as usual” SRESA1B greenhouse gas emissions scenario (the blue line averaging results from all of the model runs with the blue shading showing the +/- 1 standard deviation of the different model runs) and from the CMIP5 archive, using the RCP 4.5 scenario (pink line and pink shading). The darker pink shading shows where the simulations from CMIP3 and CMIP5 overlap each other.

Credit: National Snow and Ice Data Center courtesy Stroeve et al. 2012
High-resolution image

Previous research at NSIDC documented that September Arctic ice extent has declined faster than models predicted it would. The comparison was between observations and simulated trends from models participating in the World Climate Research Programme Coupled Model Intercomparison Project Phase 3 (CMIP3). These climate models were used in the 2007 4th Assessment report of the Intergovernmental Panel on Climate Change (IPCC). In a new paper, Stroeve et al. (2012) compared the observed 1979-2011 September trend for the Arctic against trends over the same period from the next generation of models in the CMIP5 archive. While the newer CMIP5 models do a better job of simulating the observed trend, most of the modeled ice extent trends are still smaller than the observed downward trend. NSIDC is working with researchers to further improve the models, which help extend and refine our understanding of the climate system.

Extensive melt over the Greenland Ice Sheet

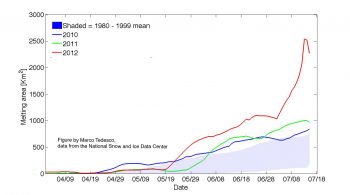
Figure 6. This figure shows the daily, cumulative area of the Greenland ice sheet showing surface melt for 2012, 2011, 2010 and for the 1980 to 1999 mean. While melt was unusually extensive through May and June of 2012, the melt area increased rapidly in early July in response to an unusually warm weather event.

Credit: National Snow and Ice Data Center courtesy Marco Tedesco, CUNY
High-resolution image

This summer, the ocean has not been the only place where unusual melt has been observed in the Arctic. NASA researchers reported that for several days in early July, nearly the entire Greenland ice sheet experienced a brief period of surface melt, including at the summit of the ice sheet. Typically, about half of the ice sheet sees some surface melting during summer, but this tends to be confined to the lower elevations. The 2012 event was associated with a high-pressure weather pattern bringing unusually warm temperatures over the higher elevations of the ice sheet. While the event has not been seen previously in the 34-year satellite record, there is evidence in ice core data from Summit, Greenland of similar events occurring several times over the past few thousand years. These melt events recorded in the ice cores from Summit show an overall average frequency of about once every 150 years since the end of the last ice age. Perhaps more important, however, is the extraordinary high melting occurring this year around the lower elevations in Greenland. Figure 6 shows that the first few months of melt exceeded past higher-than-average melt seasons. Flooding and damage to structures has been reported in some areas where this melt runs off the ice sheet and fills streams and rivers along the Greenland coast. The surface melt runoff, as well as the flow of ice and the resulting calving of icebergs, are contributors to sea level rise. Along with the substantial summer sea ice extent decline and the early Northern Hemisphere snow melt, the pace of Greenland surface melt suggests that 2012 is yet another interesting summer in the Arctic.

For more information and images, visit Greenland Melting.

References

Stroeve, J. C., V. Kattsov, A. P. Barrett, M. C. Serreze, T. Pavlova, M. M. Holland, and W. N. Meier. 2012. Trends in Arctic sea ice extent from CMIP5, CMIP3 and observations. Geophys. Res. Lett., doi:10.1029/2012GL052676, in press.