Arctic sea ice extent declined at a rapid pace through the first half of July, and is now tracking below the year 2007, which saw the record minimum September extent. The rapid decline in the past few weeks is related to persistent above-average temperatures and an early start to melt. Snow cover over Northern Eurasia was especially low in May and June, continuing the pattern seen in April.
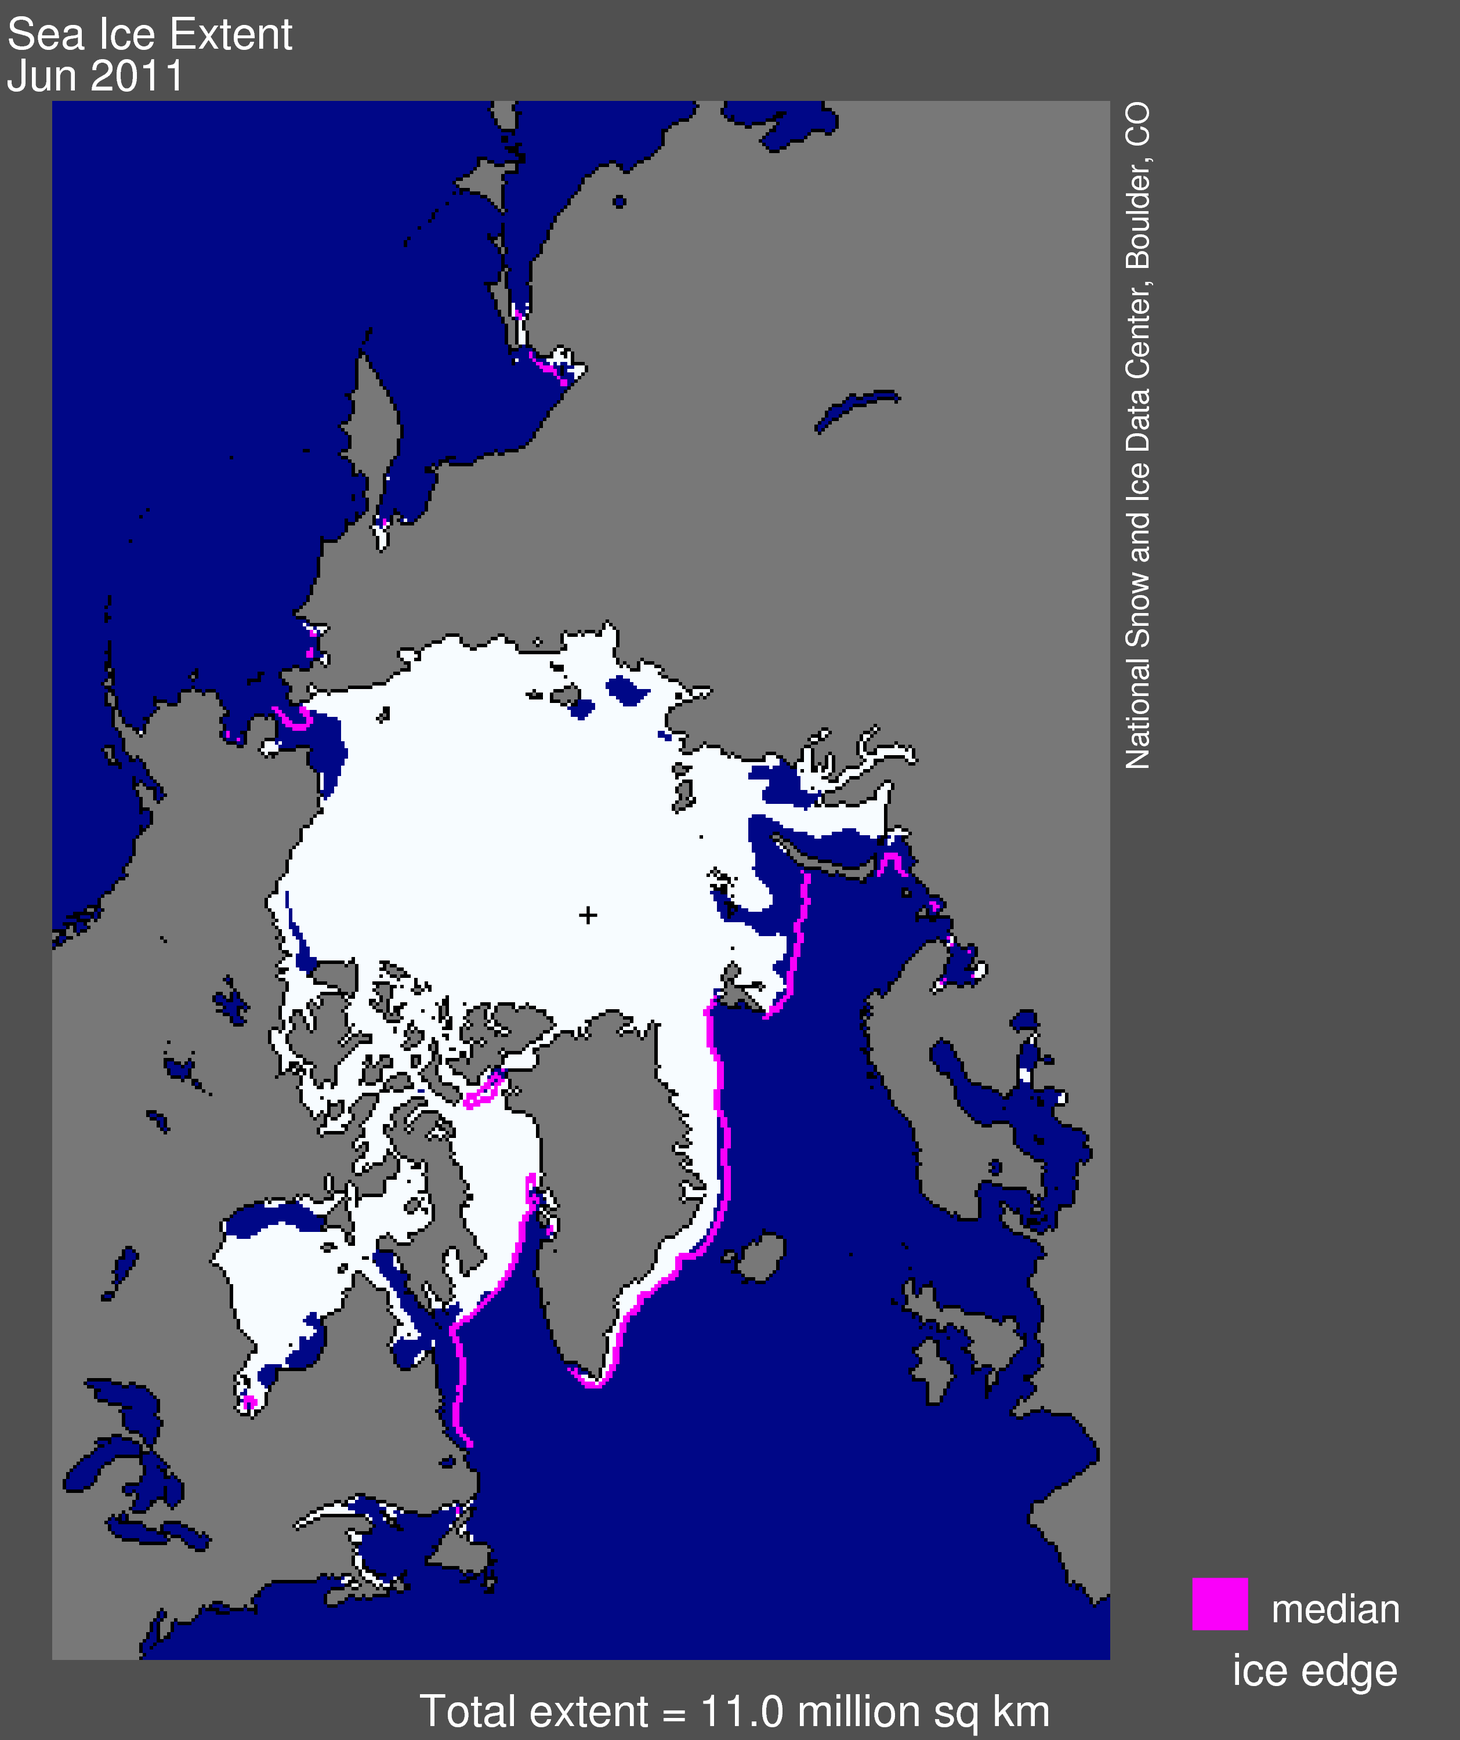
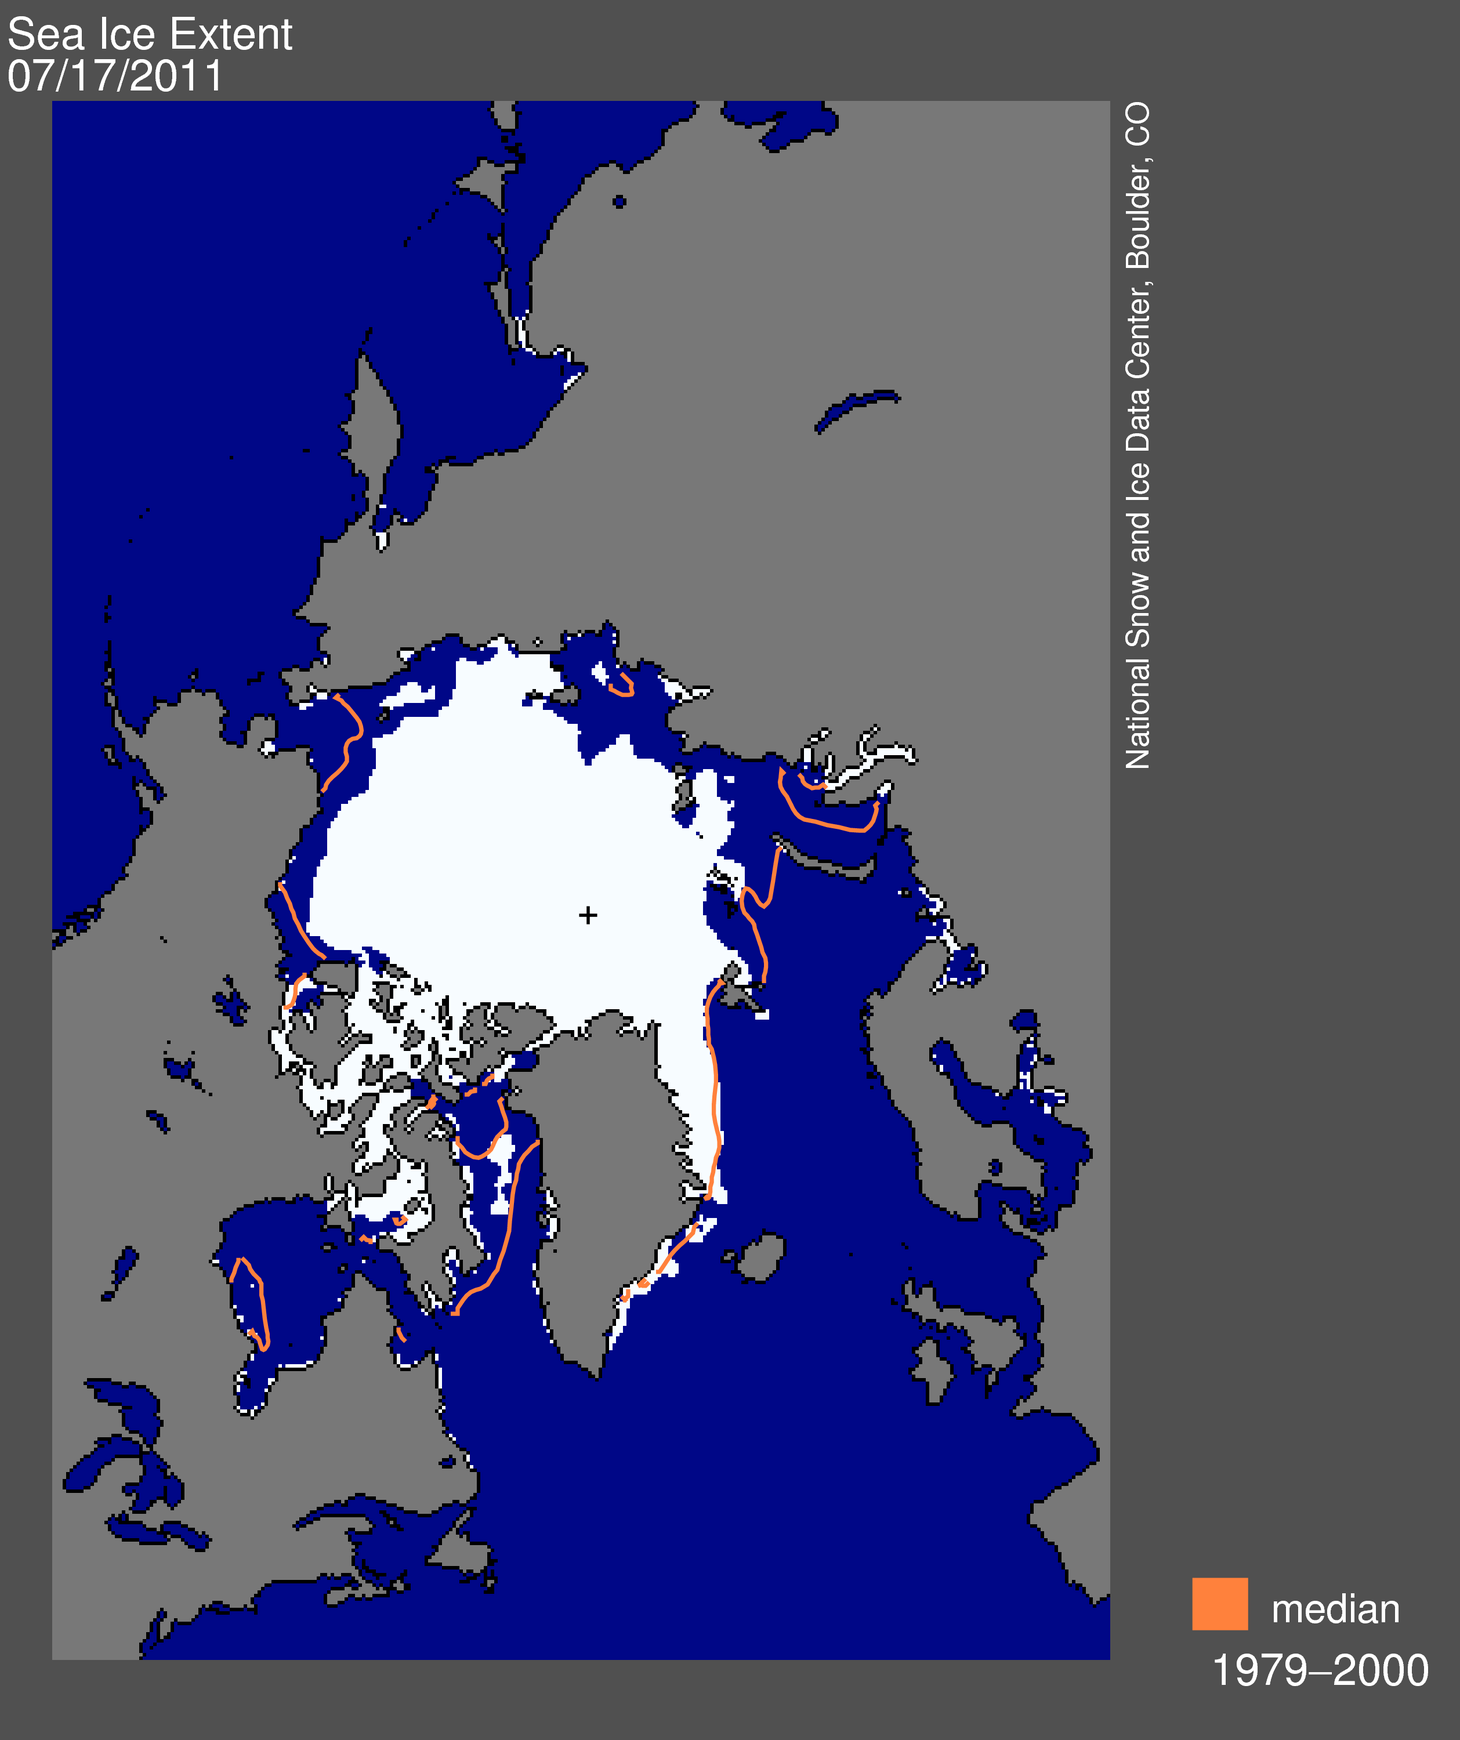 Figure 1. Arctic sea ice extent on July 17, 2011 was 7.56 million square kilometers (2.92 million square miles). The orange line shows the 1979 to 2000 median extent for that day. The black cross indicates the geographic North Pole. Sea Ice Index data. About the data. —Credit: National Snow and Ice Data Center
High-resolution image
Overview of conditions
As of July 17, 2011, Arctic sea ice extent was 7.56 million square kilometers (2.92 million square miles), 2.24 million square kilometers (865,000 square miles) below the 1979 to 2000 average. Sea ice is particularly low in the Barents, Kara, and Laptev Seas (the far northern Atlantic region), Hudson Bay and Baffin Bay.
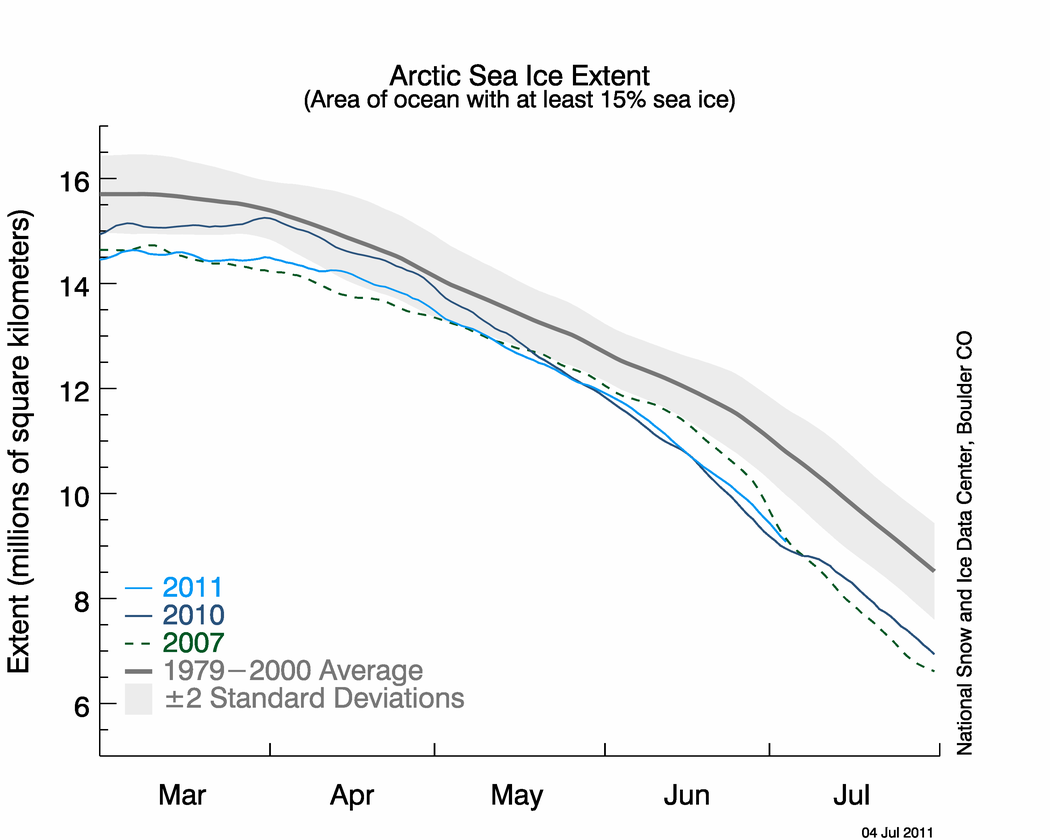
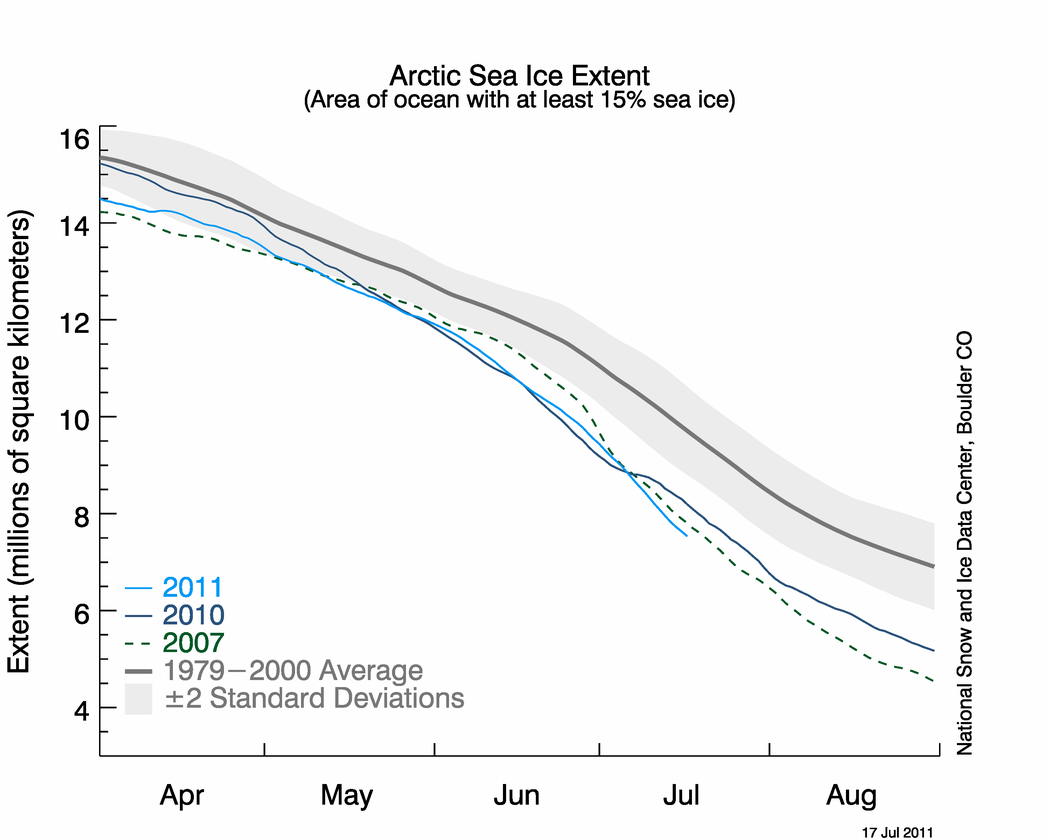 Figure 2. The graph above shows daily Arctic sea ice extent as of July 17, 2011, along with daily ice extents for previous low-ice-extent years. Light blue indicates 2011, dashed green shows 2007, dark blue shows 2010, and dark gray shows the 1979 to 2000 average. The gray area around the average line shows the two standard deviation range of the data. Sea Ice Index data.—Credit: National Snow and Ice Data Center
High-resolution image
Conditions in context
Arctic sea ice extent declined rapidly through the first two weeks of July, at a rate averaging nearly 120,000 square kilometers (46,000 square miles) per day. Ice extent is now tracking below the year 2007, which saw the record minimum September extent.
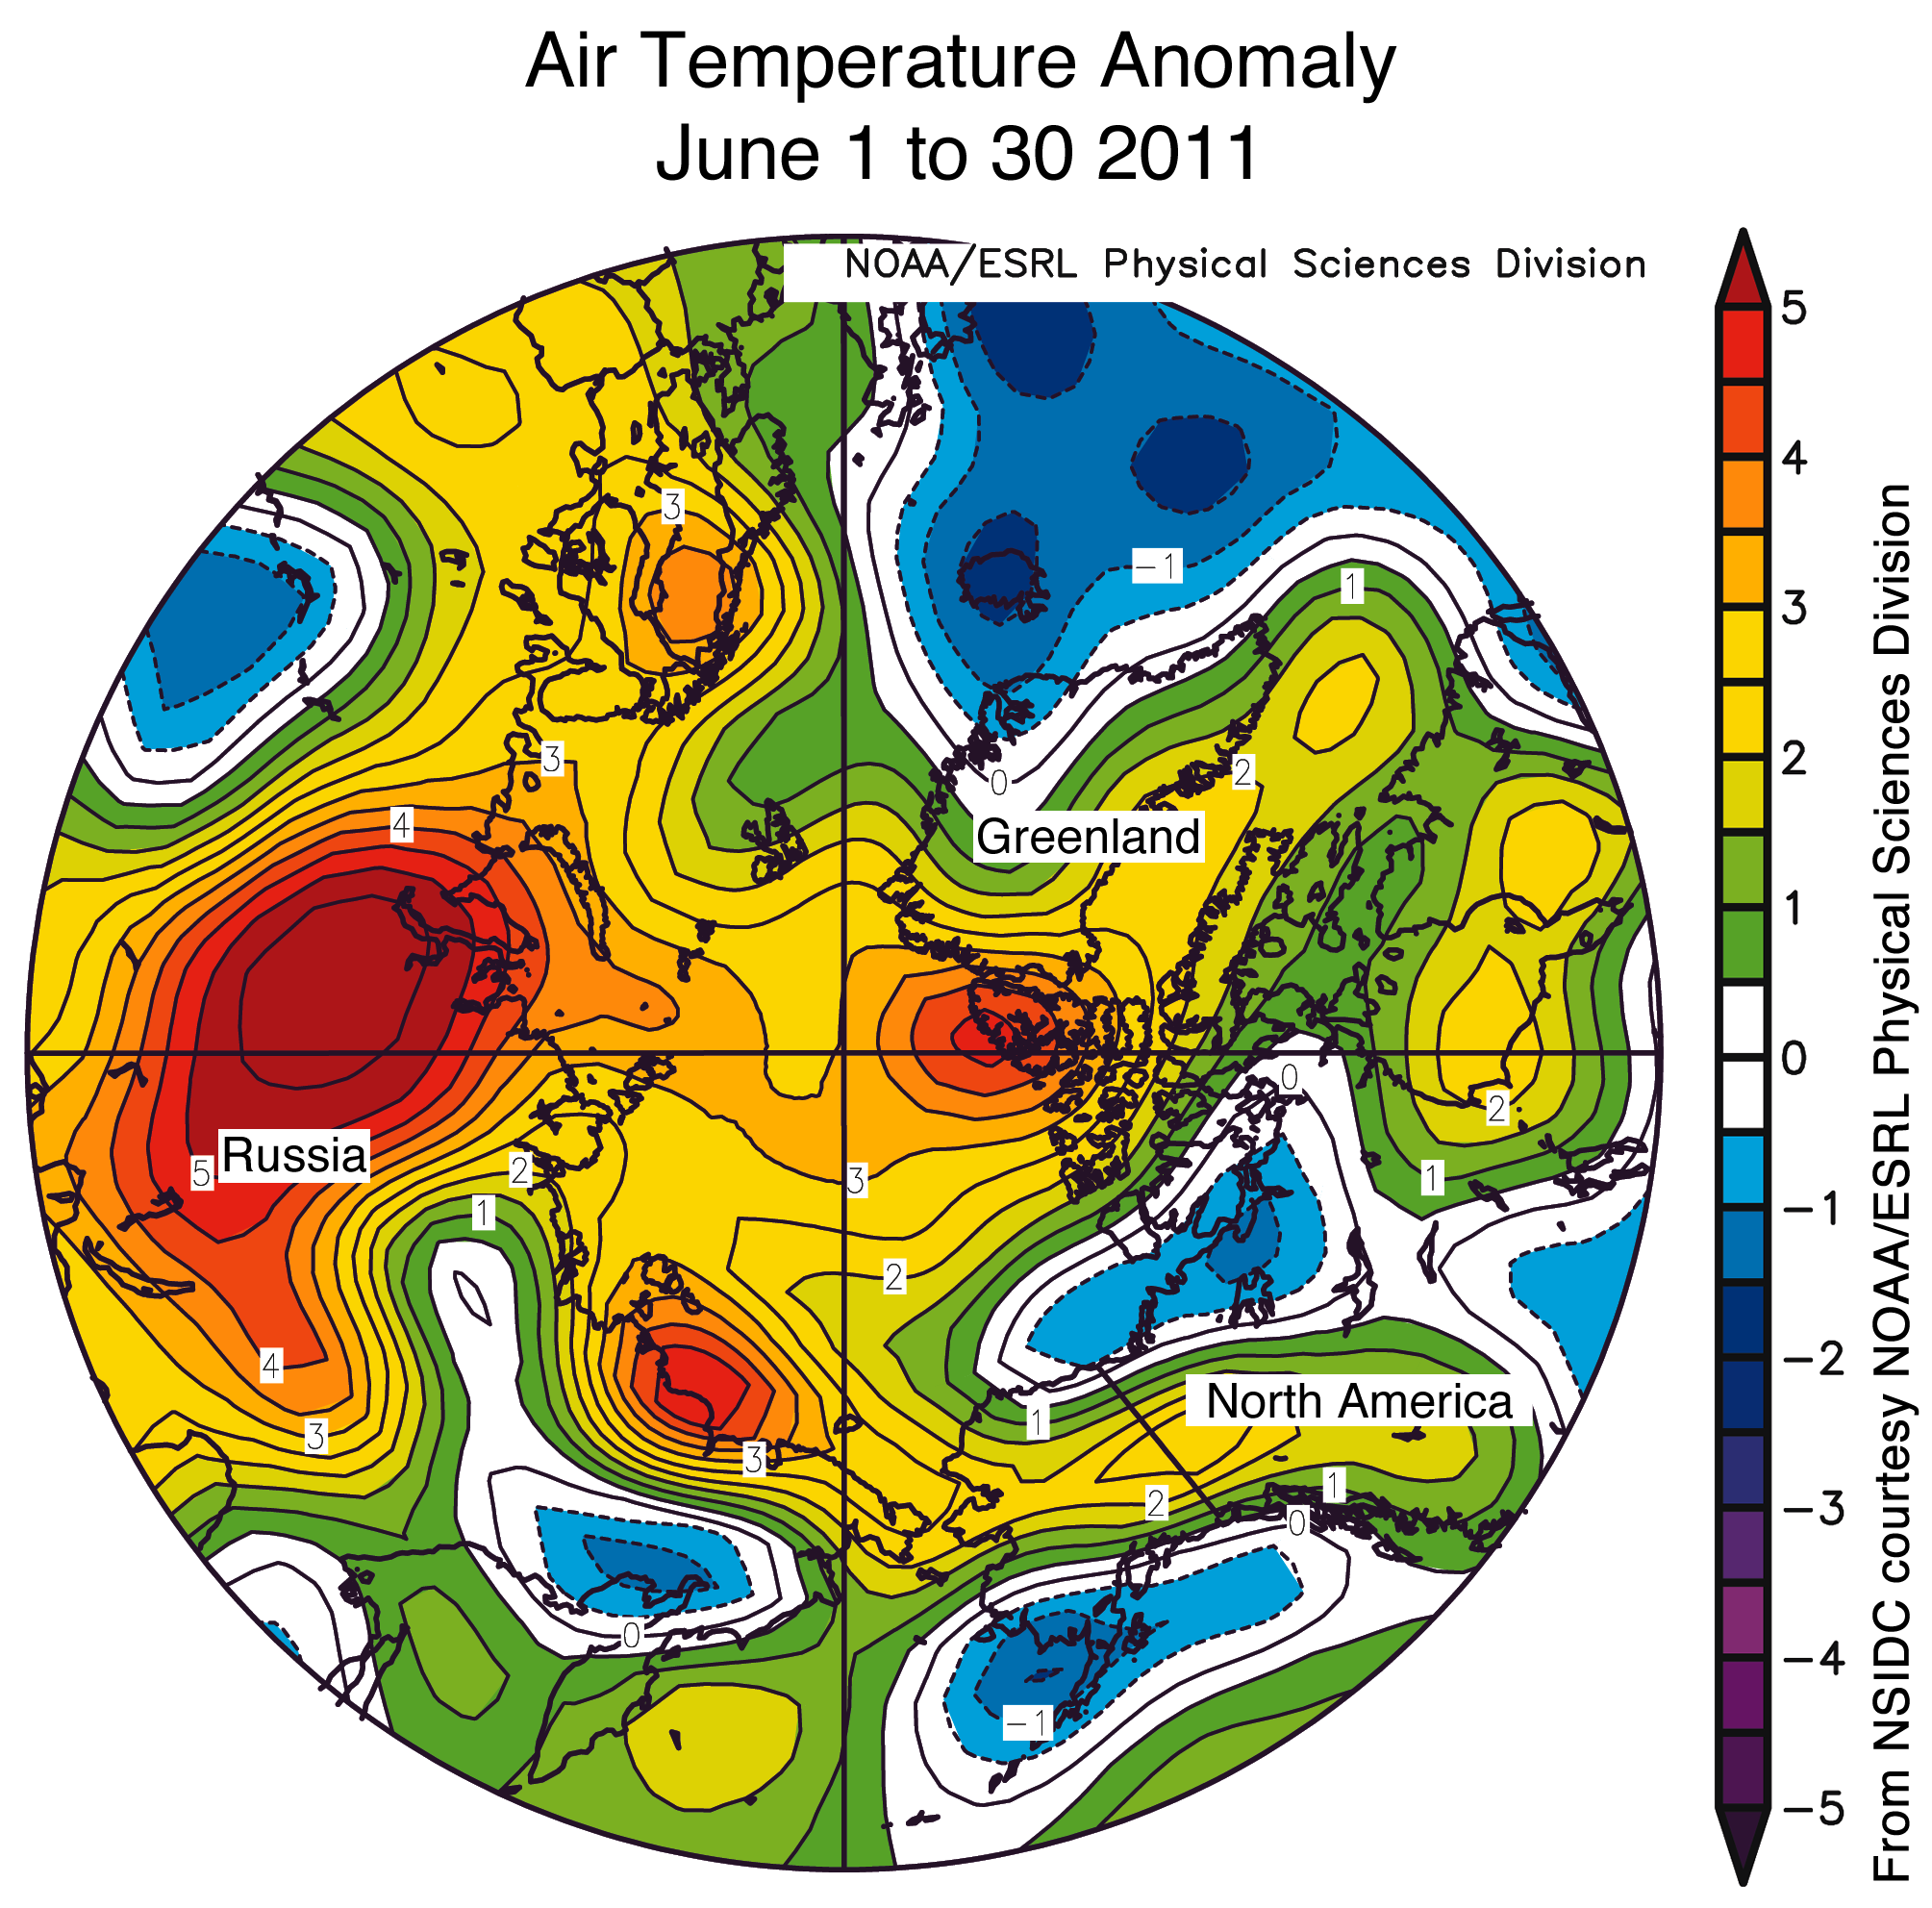
During the first half of July, a high-pressure cell persisted over the northern Beaufort Sea, as it did in June, and is linked to the above-average air temperatures over much of the Arctic Ocean. To date in July, air temperatures over the North Pole (at the 925 millibar level, or roughly 1,000 meters or 3,000 feet above the surface) were 6 to 8 degrees Celsius (11 to 14 degrees Fahrenheit) higher than normal, while temperatures along the coasts of the Laptev and East Siberian seas were 3 to 5 degrees Celsius (5 to 9 degrees Fahrenheit) higher than average. By contrast, temperatures through the first half of July over the Kara Sea have been 2 to 5 degrees Celsius (4 to 9 degrees Fahrenheit) lower than average.
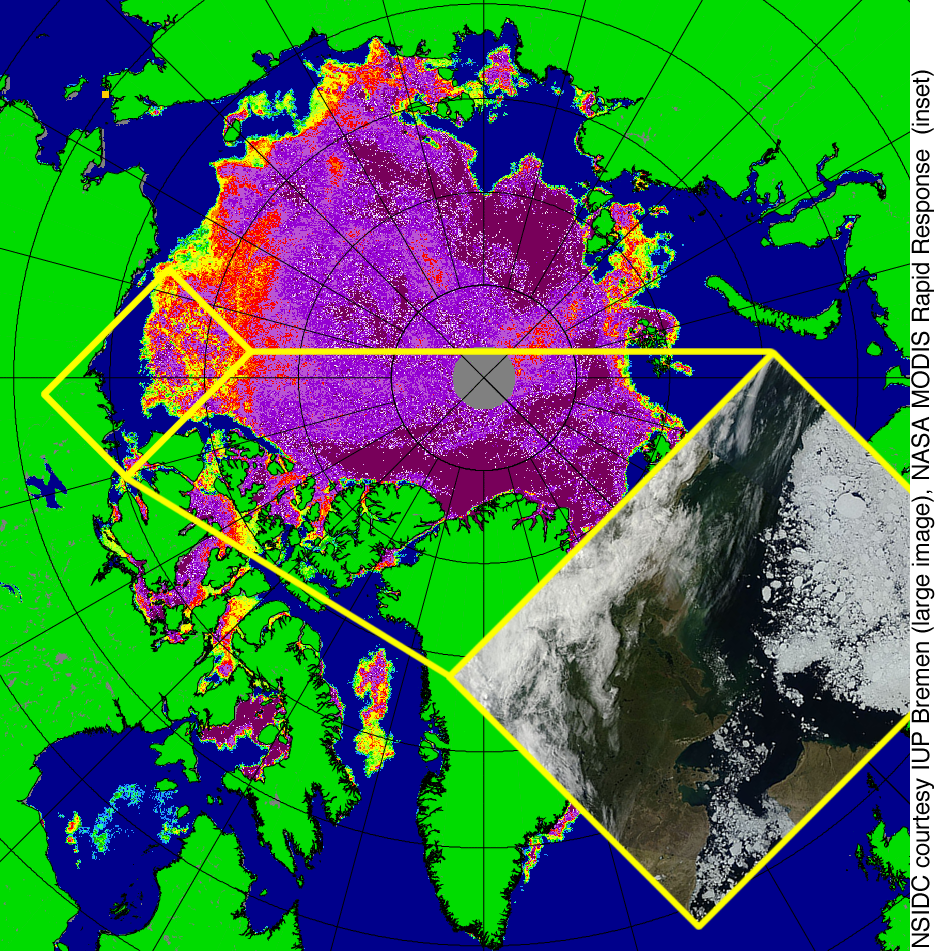
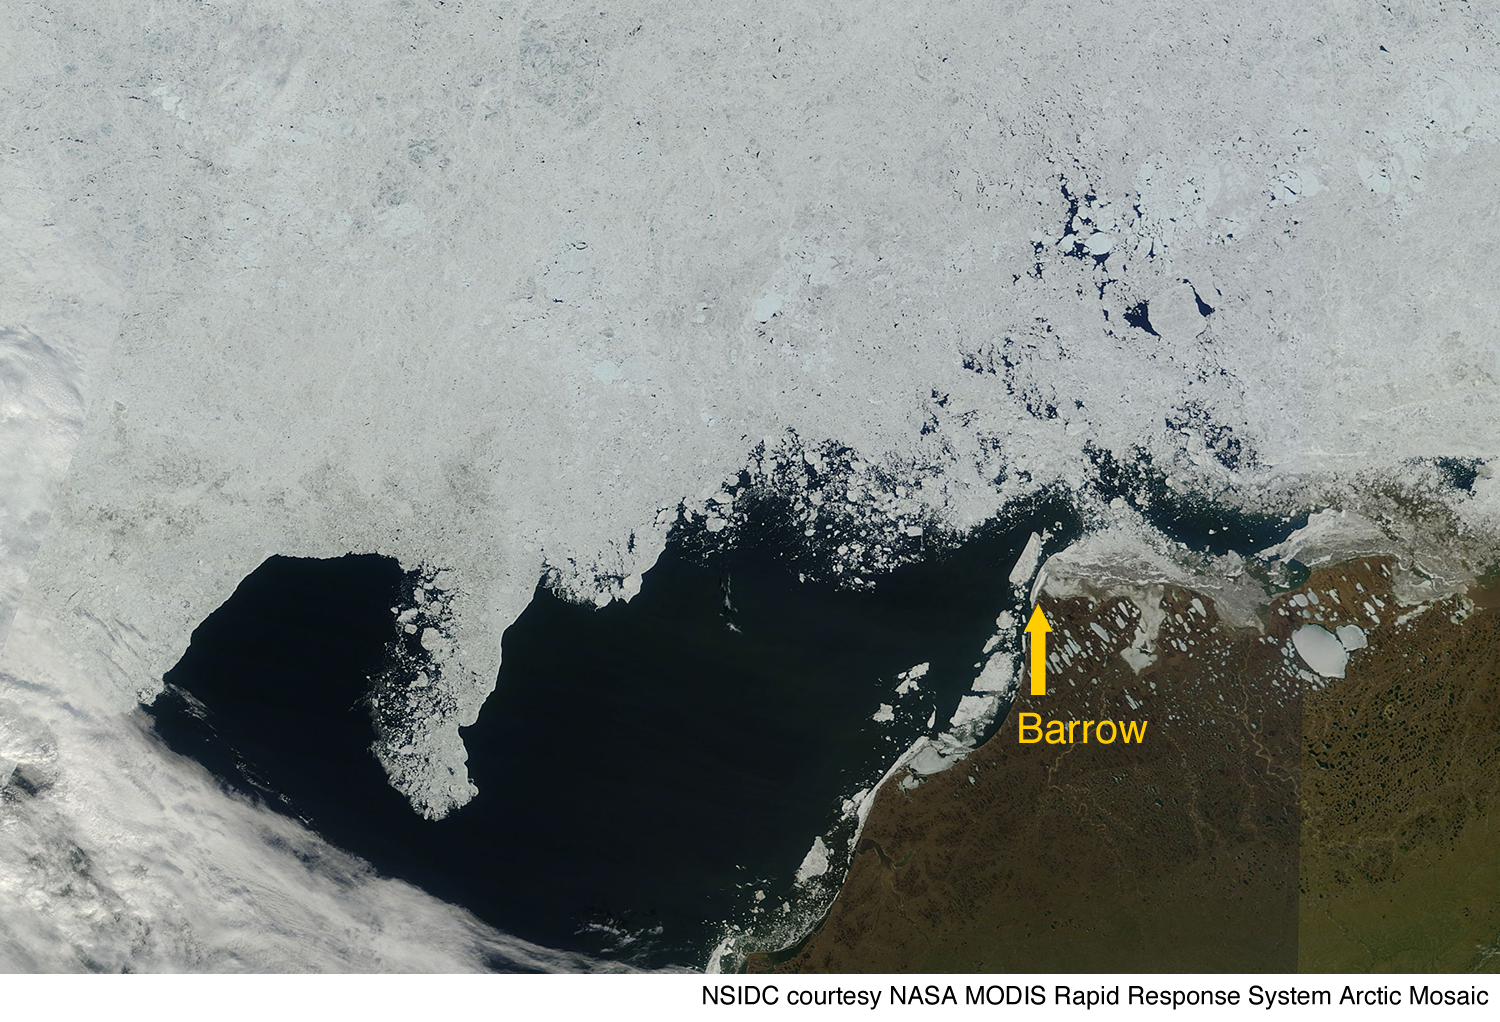
Figure 3. Satellite images from the NASA AMSR-E sensor (large image) and MODIS (inset), show areas of low ice concentration north of Alaska. Both images were obtained on July 15, 2011. In the AMSR-E image, purple indicates areas of high sea ice concentration, while yellow and red indicates lower ice concentration. Blue shows open water and green shows land.—Credit: National Snow and Ice Data Center courtesy IUP Bremen AMSR-E (main image), NASA MODIS Rapid Response Arctic Mosaic (inset)
High-resolution image
A closer look at sea ice concentration
The sea ice extent data that NSIDC uses come from the Special Sensor Microwave Imager/Sounder (SSMIS) on U.S. Department of Defense satellites. Data from other satellites, while not as useful for studying long-term trends, can show more detail about ice cover in particular regions. Currently data from two NASA satellite sensors, the Moderate Resolution Imaging Spectroradiometer (MODIS) and Advanced Microwave Scanning Radiometer for EOS (AMSR-E), show areas of low ice concentration north of Alaska. Ice in these areas is likely to melt out in coming weeks.
Both the Northwest Passage (through the channels of the Canadian Arctic Islands) and the Northern Sea Route (along the Siberian coast) are still choked with ice.
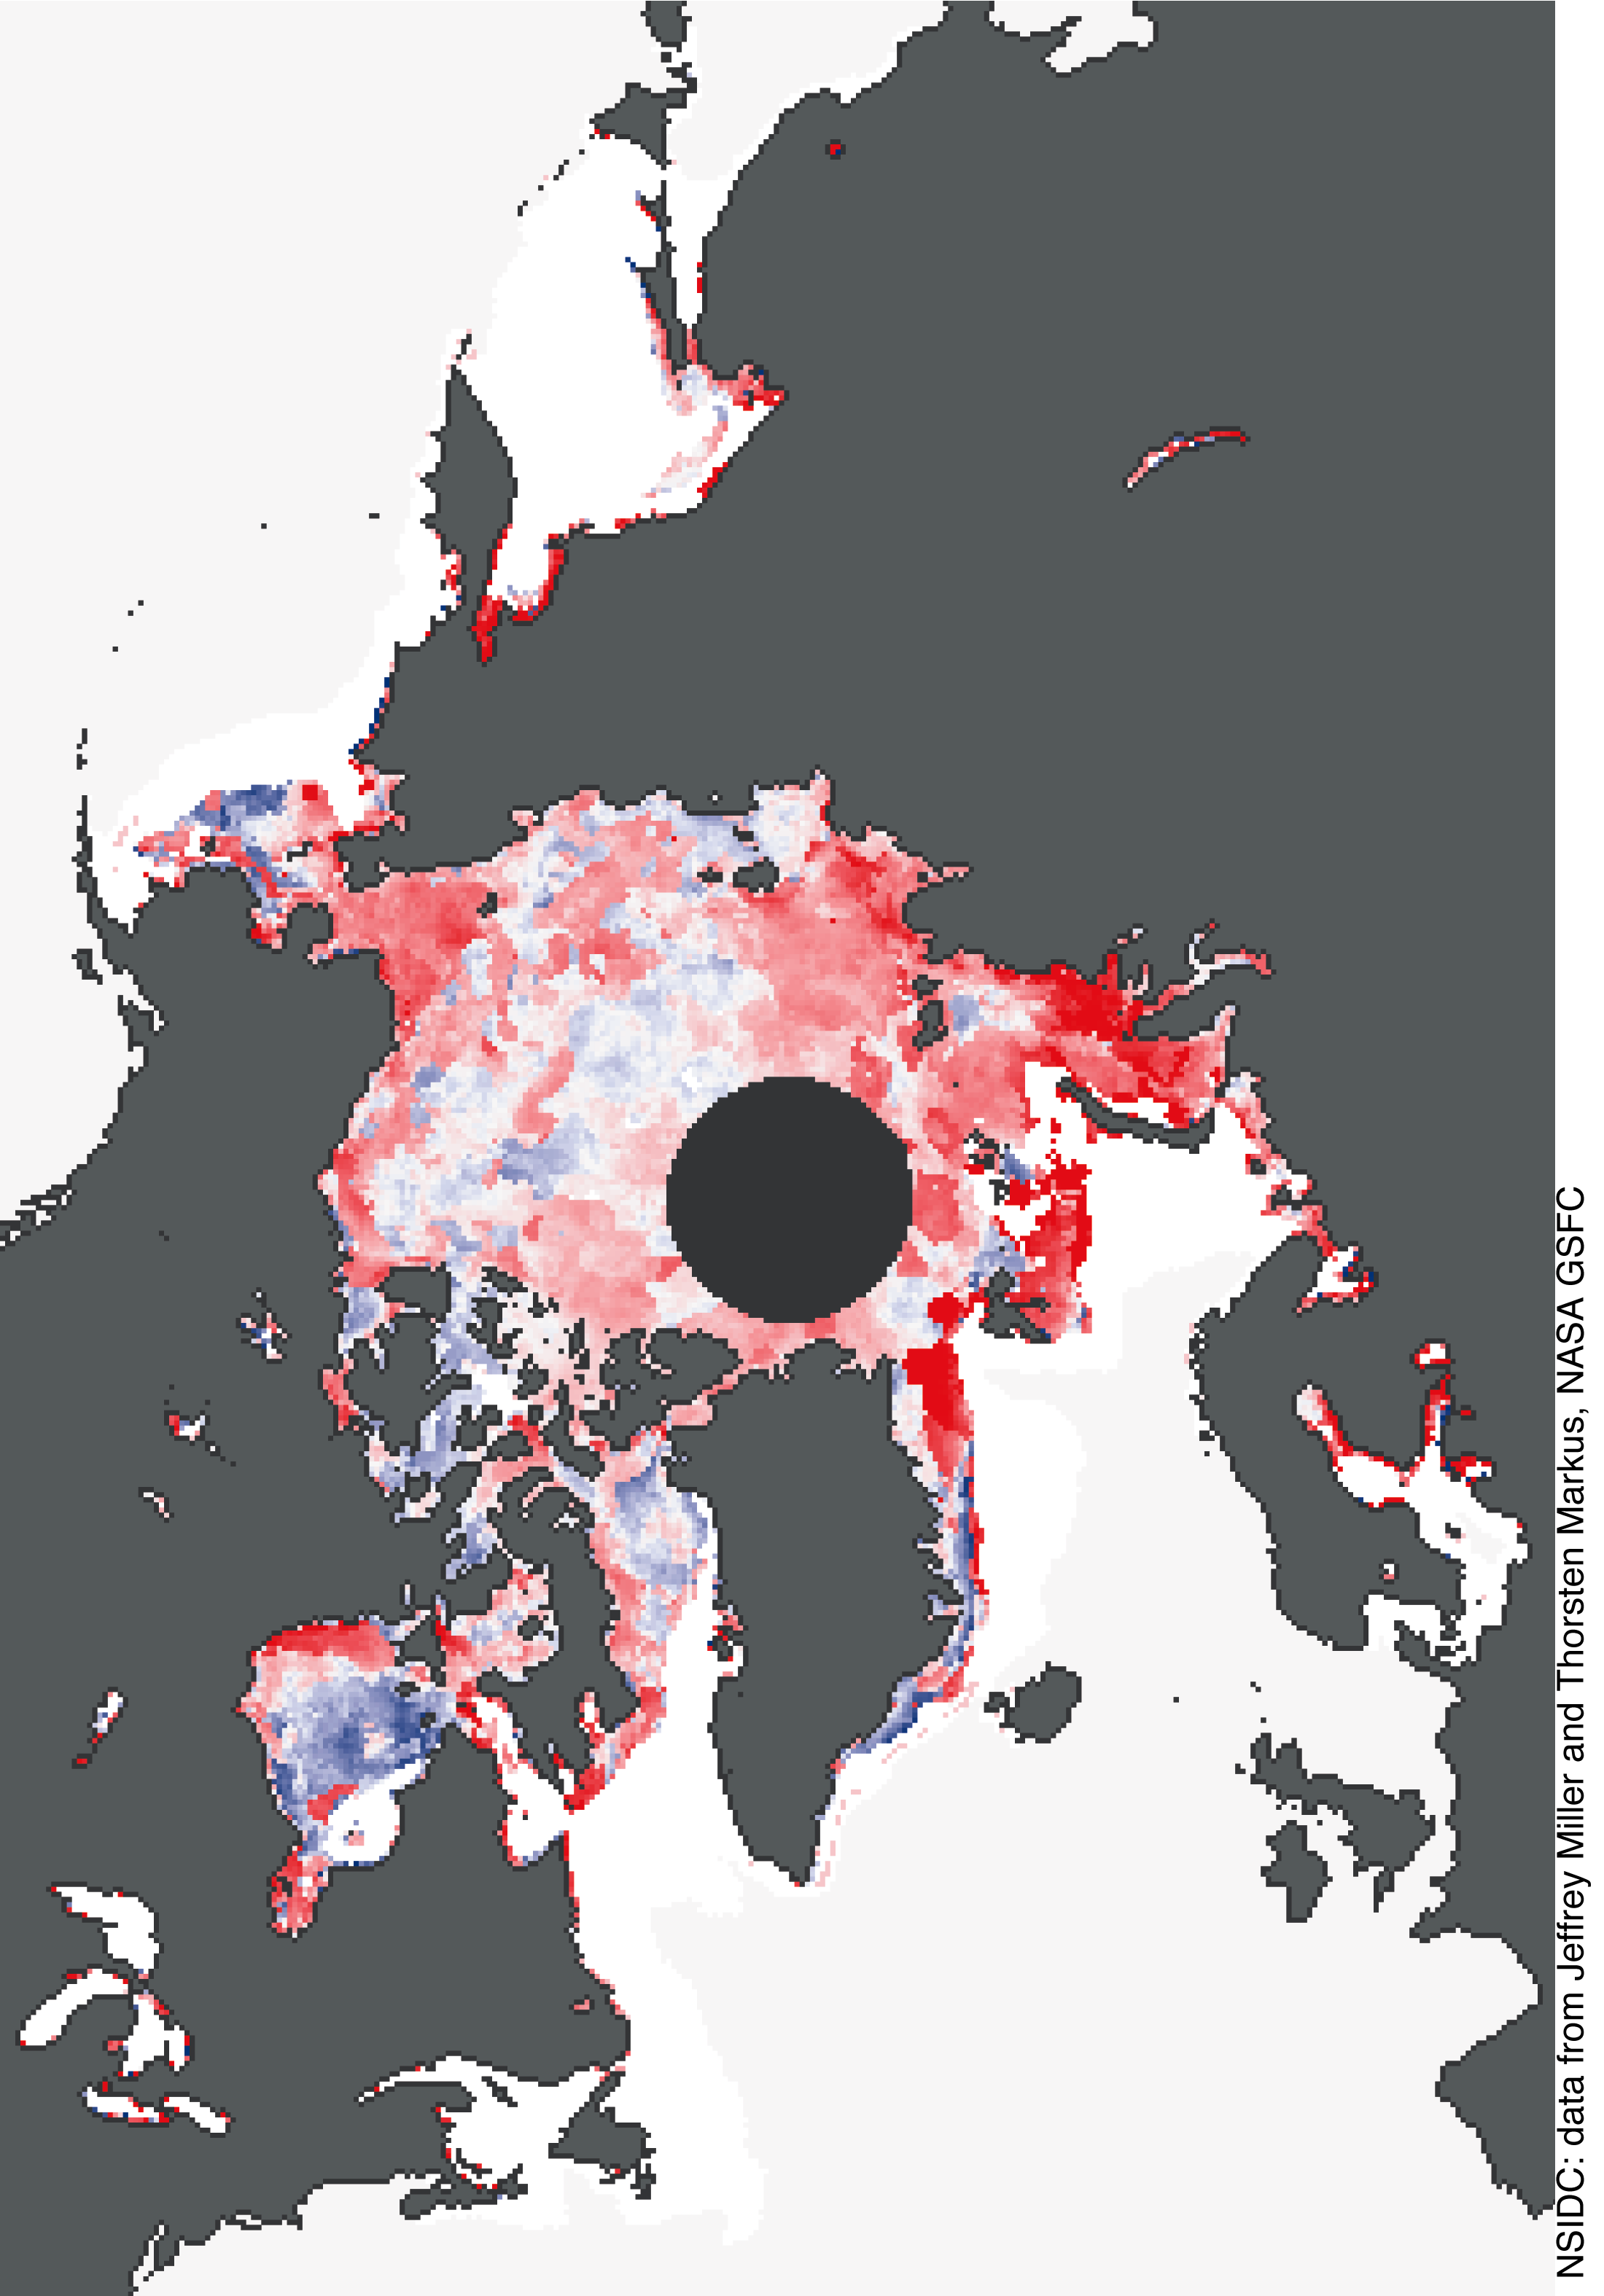
Figure 4. This map shows the difference between average date of melt onset, when ice melt starts, and the date of melt onset this year. Red indicates earlier than normal melt, blue shows later than normal melt. The darkest red is an anomaly of 50 days early or more. White areas show no anomaly, that is they melted no earlier or later than normal. The gray area over the North Pole indicates where no data are available.—Credit: NSIDC, data from Jeffrey Miller and Thorsten Markus, NASA GSFC.
High-resolution image
Early start to Arctic melt
When sea ice starts to melt in spring, small ponds known as melt ponds form on its surface. The small pools create a darker surface (a lower albedo) that fosters further melt. How early sea ice melt starts is one indicator of how much the ice will melt in a given year. New research by Don Perovich and colleagues shows that an early start to sea ice melt increases the total amount of sunlight absorbed through the melt season.
Data processed by researchers Thorsten Markus and Jeffrey Miller at the NASA Goddard Space Flight Center reveal that melt began earlier than normal in both the Chukchi Sea, just north of the Bering Strait, and the Barents, Kara, and Laptev seas. Surface melting on the sea ice began from two weeks to two months earlier than the 1979 to 2000 average in these areas. However, in Baffin Bay and Hudson Bay, a cool spring led to a later start for surface melt, especially in Hudson Bay. Subsequent warm conditions have nevertheless led to rapid ice melt.
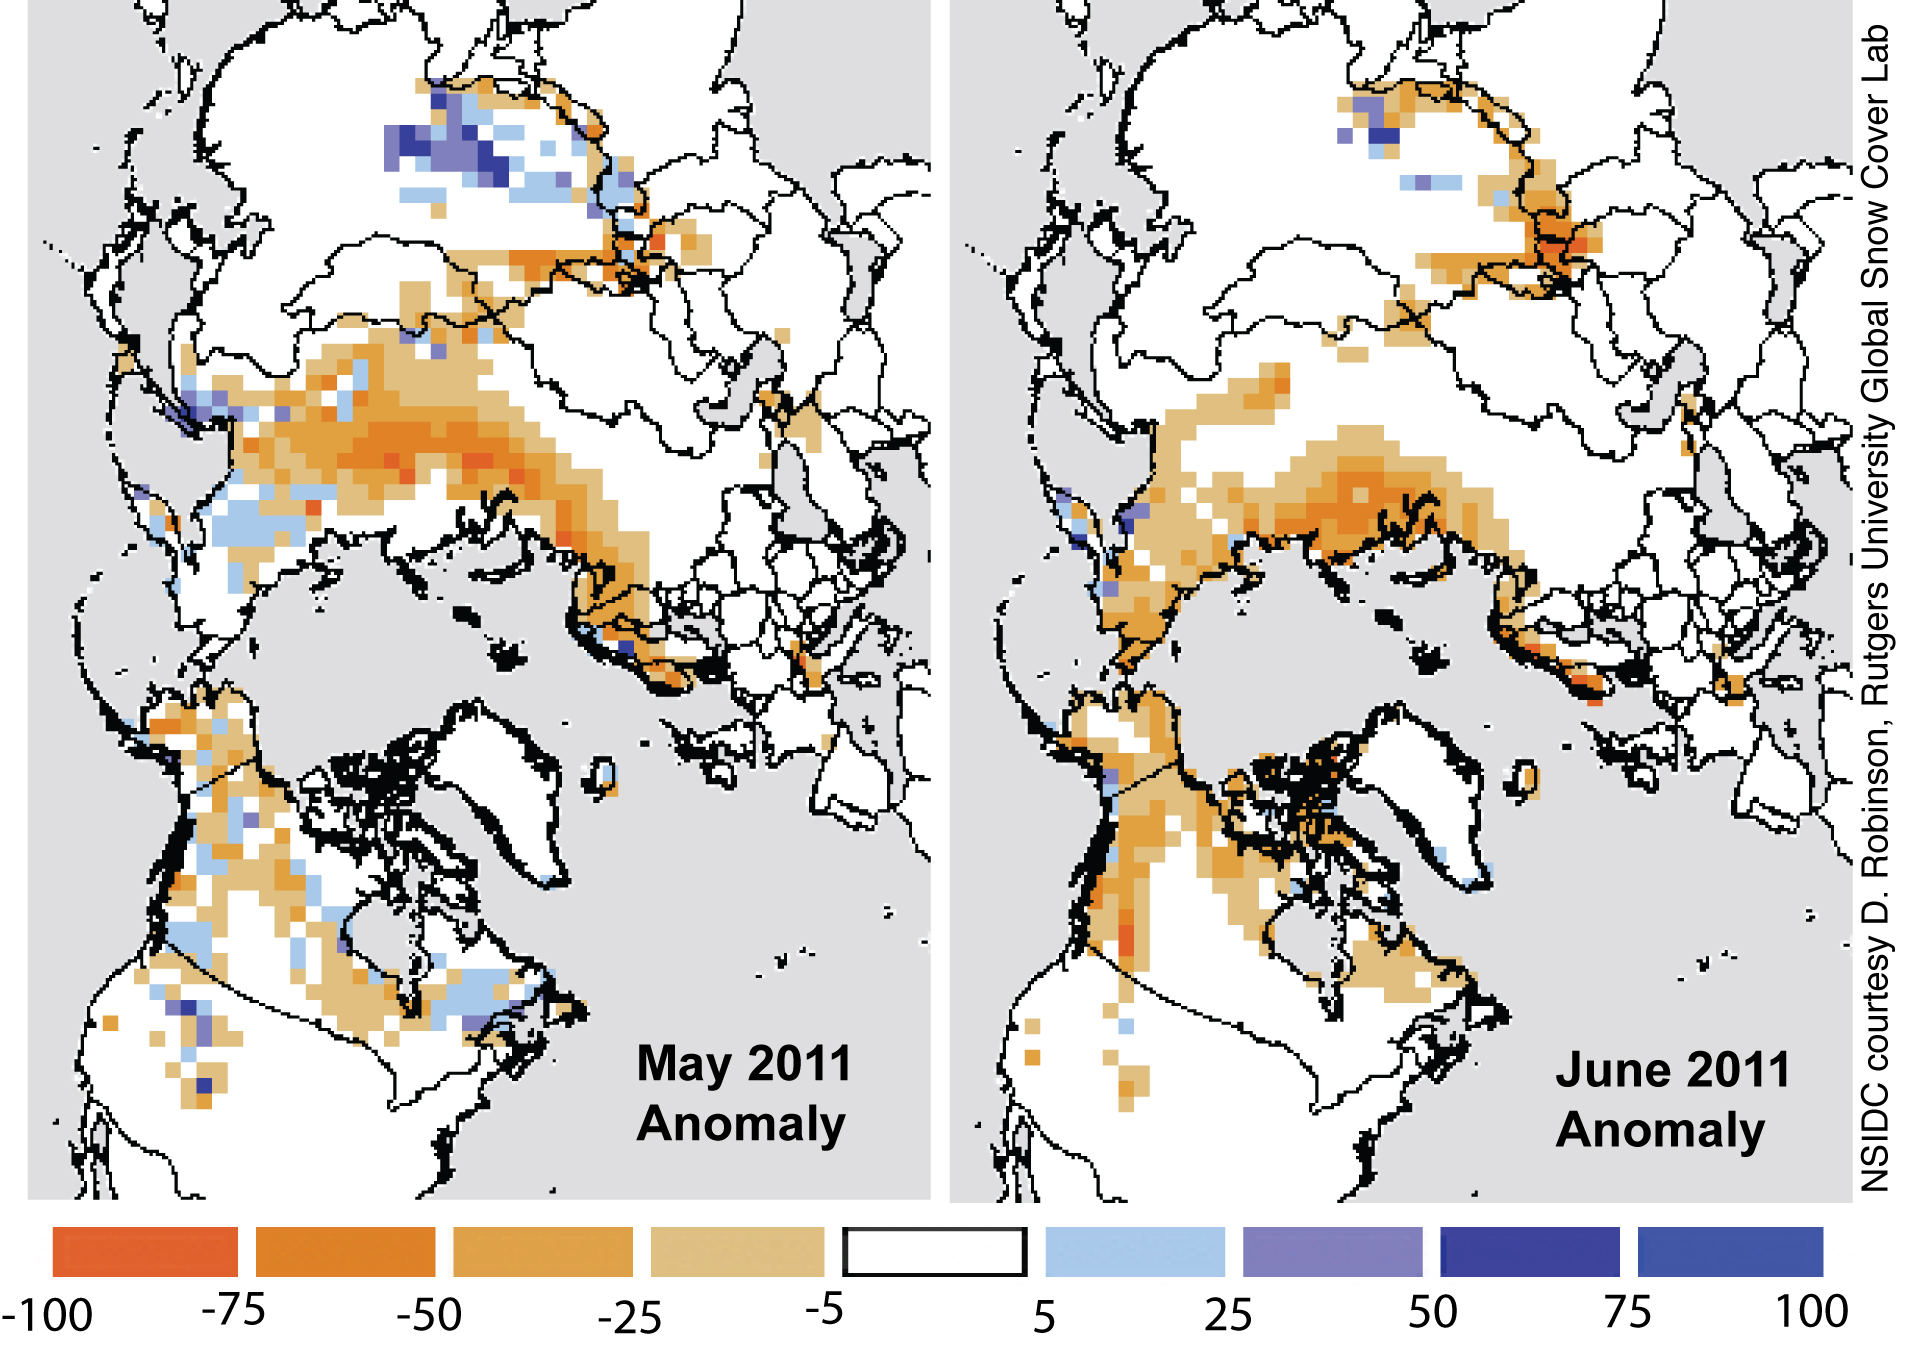
Figure 5. This snow cover anomaly map for May and June, 2011 shows the percent difference between snow cover extent this summer, compared with average snow cover for May and June 1971 to 2000. Areas in orange and red indicate lower-than-usual snow cover, while regions in blue had more snow than normal. —Credit: NSIDC courtesy D. Robinson, Global Snow Cover Lab, Rutgers University
High-resolution image
Low summer snow cover in the Northern Hemisphere
As noted in our May 4 post, snow cover in central Russia retreated early in response to warm conditions this spring. Updated analyses provided by the Global Snow Cover Lab at Rutgers University reveal that snow cover remained very low for May and June. Even though some mountain regions in the U.S. and Canada saw greater-than-normal snow cover, snow cover for the Northern Hemisphere as a whole for May and June was the second lowest since the start of snow cover records in 1966.
According to David Robinson, head of the Rutgers Snow Cover Lab, a new pattern is emerging in which the Northern Hemisphere is cloaked in above-average snow during late autumn, winter, and early spring, followed by rapid melt and retreat in May and June. While snow cover varies from year to year, the far north has seen a clear trend towards less spring snow cover over the last thirty years.
Do you have questions about the upcoming Arctic sea ice minimum extent? Read Heading towards the summer minimum ice extent, on NSIDC’s new Icelights: Your burning questions about ice and climate.
References
Markus, T., J. C. Stroeve, and J. Miller. 2009 Recent changes in Arctic sea ice melt onset, freezeup, and melt season length, J. Geophys. Res., 114, C12024, doi:10.1029/2009JC005436.
Kunkel, K. E., M. Palecki, L. Ensor, K. G. Hubbard, D. Robinson, K. Redmond, D. Easterling. 2009. Trends in Twentieth-Century U.S. Snowfall Using a Quality-Controlled Dataset. J. Atmos. Oceanic Technol., *26*, 33–44. doi: 10.1175/2008JTECHA1138.1
Ghatak, D., A. Frei, G. Gong, J. Stroeve, and D. Robinson. 2010. On the emergence of an Arctic amplification signal in terrestrial Arctic snow extent, J. Geophys. Res., 115, D24105, doi:10.1029/2010JD014007.
Perovich, D.K., K.F. Jones, B. Light, H. Eicken, T. Markus, J. Stroeve, R. Lindsay. 2011. Solar partitioning in a changing Arctic sea-ice cover, Annals of Glaciology, 52(57), 192-196.
For previous analyses, please see the drop-down menu under Archives in the right navigation at the top of this page.