The sea ice cover in May 2024 was marked by an unusually early opening of eastern Hudson Bay. Overall, the rate of decline in the Arctic was near average for the month. In the Antarctic, the seasonal increase in ice extent was slower than average, but extent in early June remains considerably higher than the record-setting low extent at this time last year.
Overview of conditions
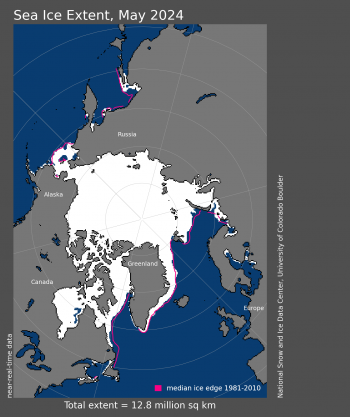
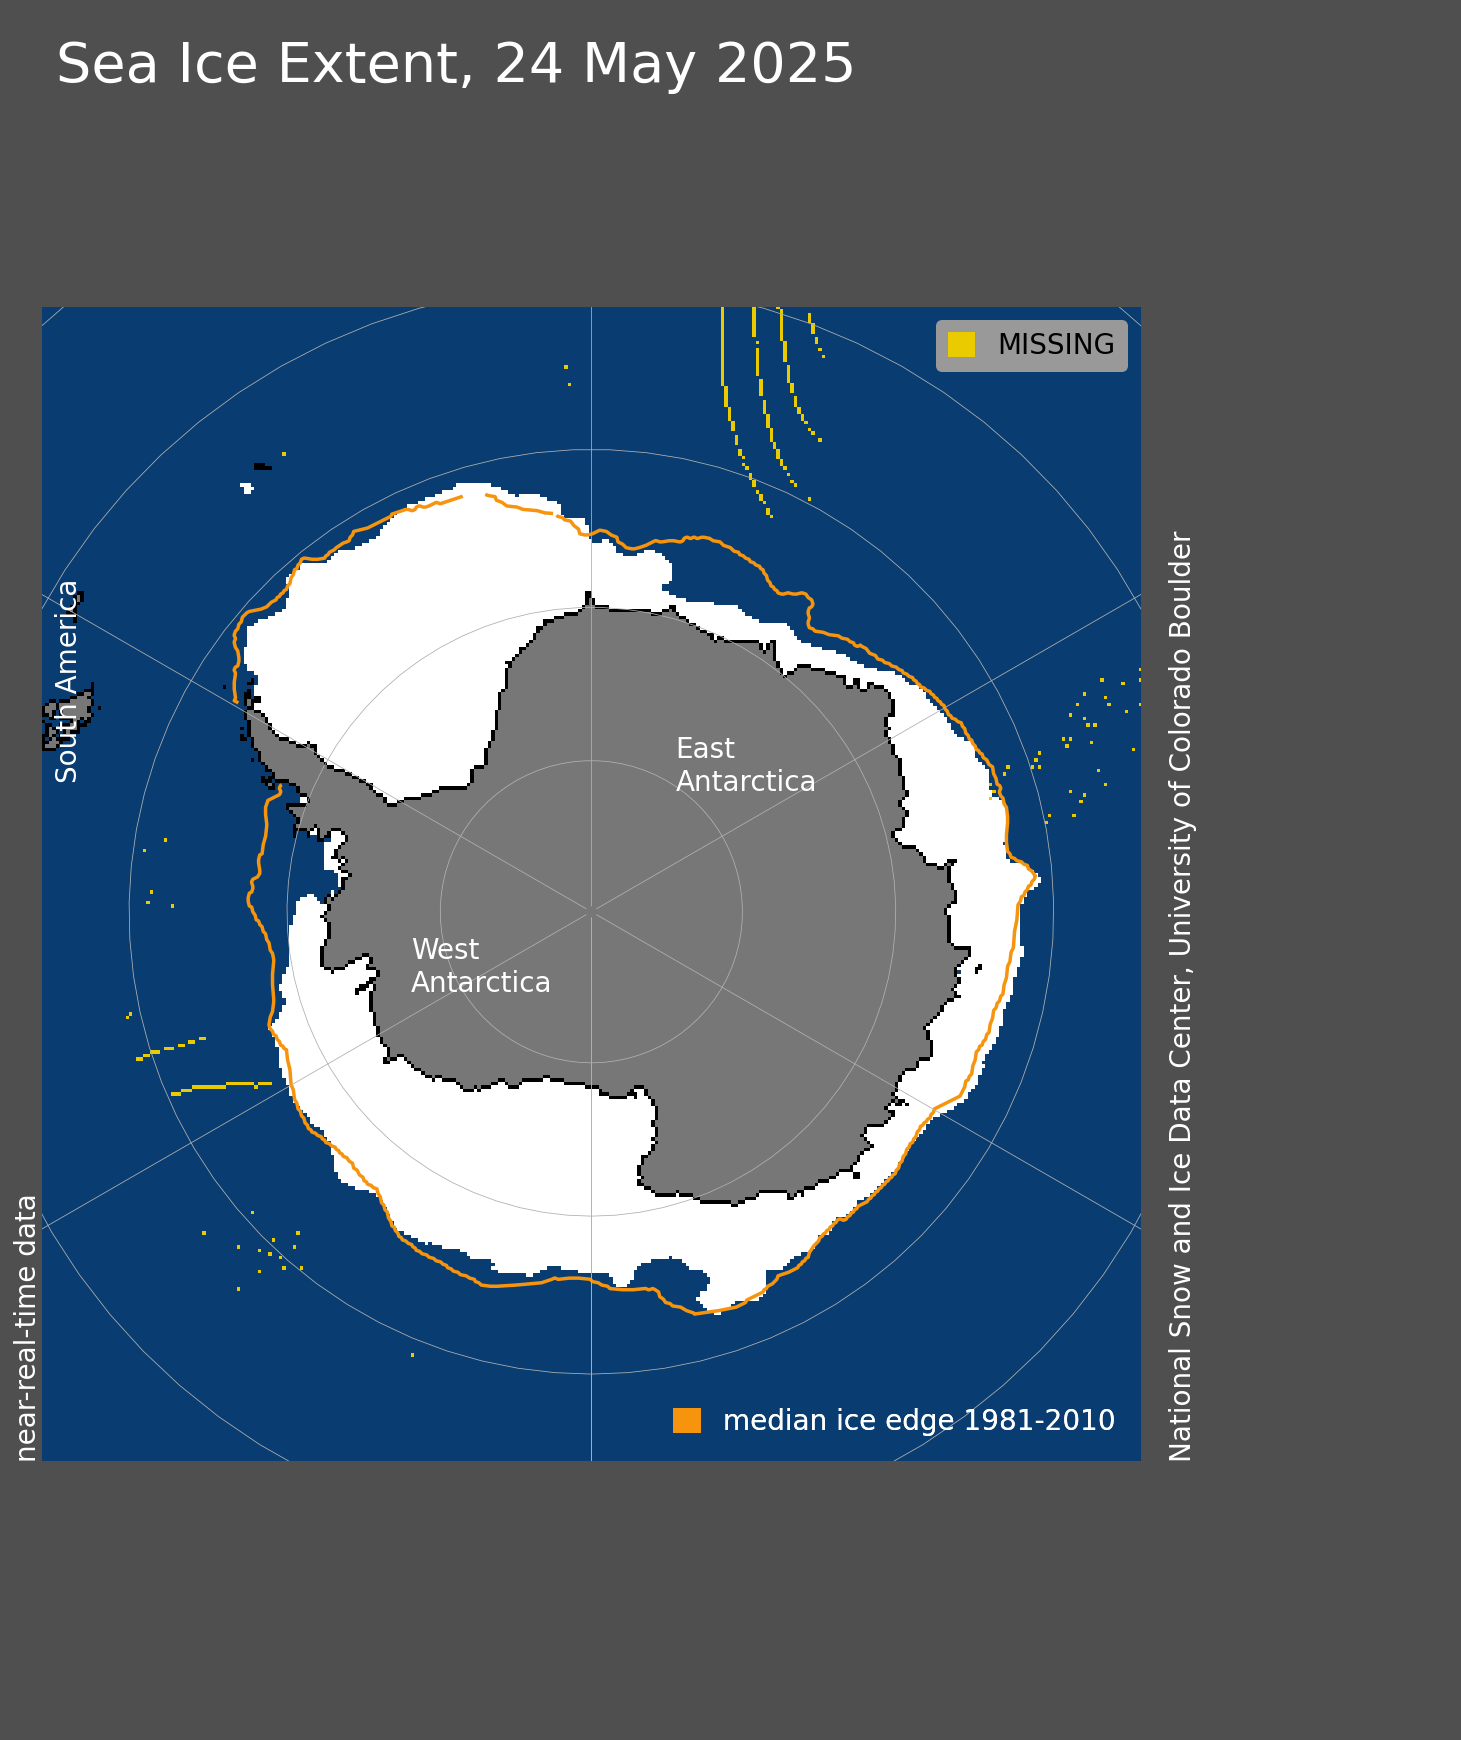
Figure 1a. Arctic sea ice extent for May, 2024, was 12.78 million square kilometers (4.93 million square miles). The orange line shows the 1981 to 2010 average extent for that day. Sea Ice Index data. About the data
Credit: National Snow and Ice Data Center
High-resolution image
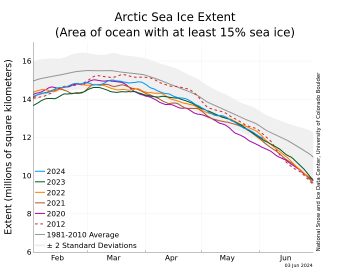
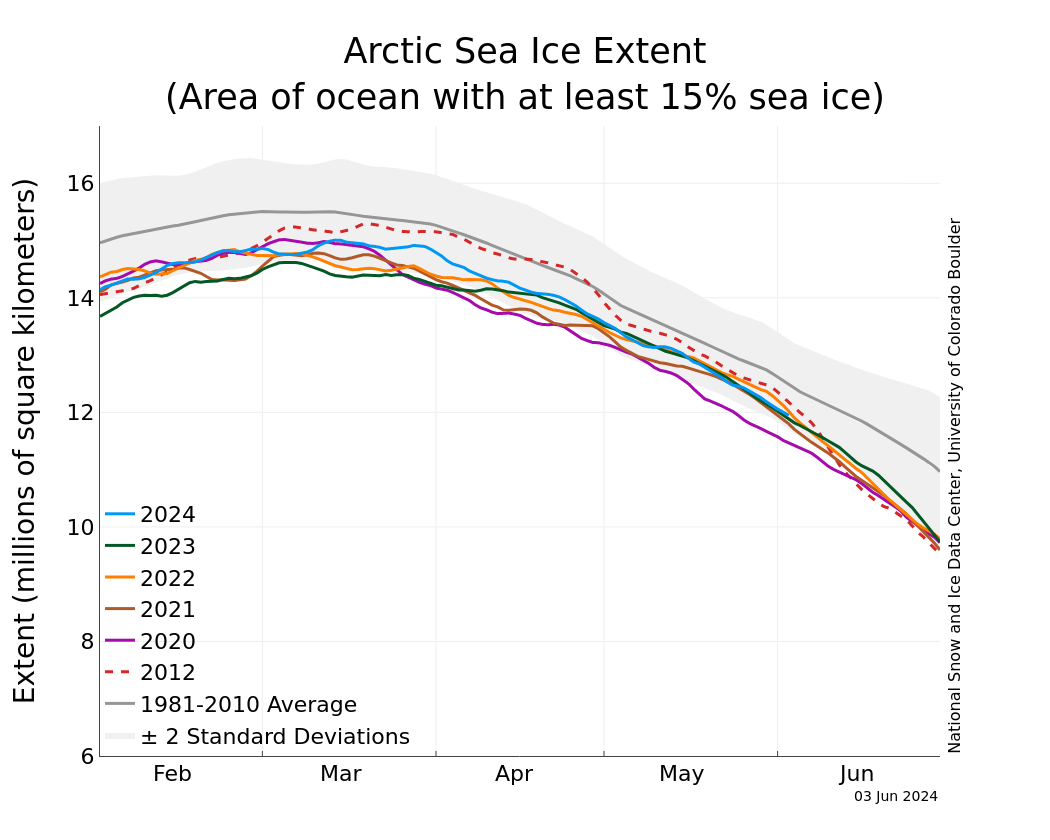
Figure 1b. The graph above shows Arctic sea ice extent as of June 3, 2024, along with daily ice extent data for four previous years and the record low year. 2024 is shown in blue, 2023 in green, 2022 in orange, 2021 in brown, 2020 in magenta, and 2012 in dashed brown. The 1981 to 2010 median is in dark gray. The gray areas around the median line show the interquartile and interdecile ranges of the data. Sea Ice Index data.
Credit: National Snow and Ice Data Center
High-resolution image
The average Arctic sea ice extent for May 2024 was 12.78 million square kilometers (4.93 million square miles), tying for twelfth lowest with 2007 in the passive microwave satellite record (Figure 1a and 1b). As of the beginning of June, extent is well below average in the Hudson Bay and slightly below average elsewhere. Some coastal areas around the Arctic Ocean are beginning to open up, particularly in the Beaufort and Chukchi Seas.
Conditions in context
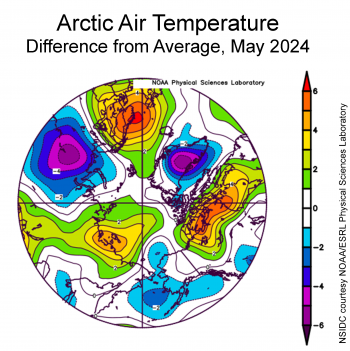
Figure 2a. This plot shows the departure from average air temperature in the Arctic at the 925 hPa level, in degrees Celsius, for May 2024. Yellows and reds indicate above average temperatures; blues and purples indicate below average temperatures.
Credit: NSIDC courtesy NOAA Earth System Research Laboratory Physical Sciences Laboratory
High-resolution image

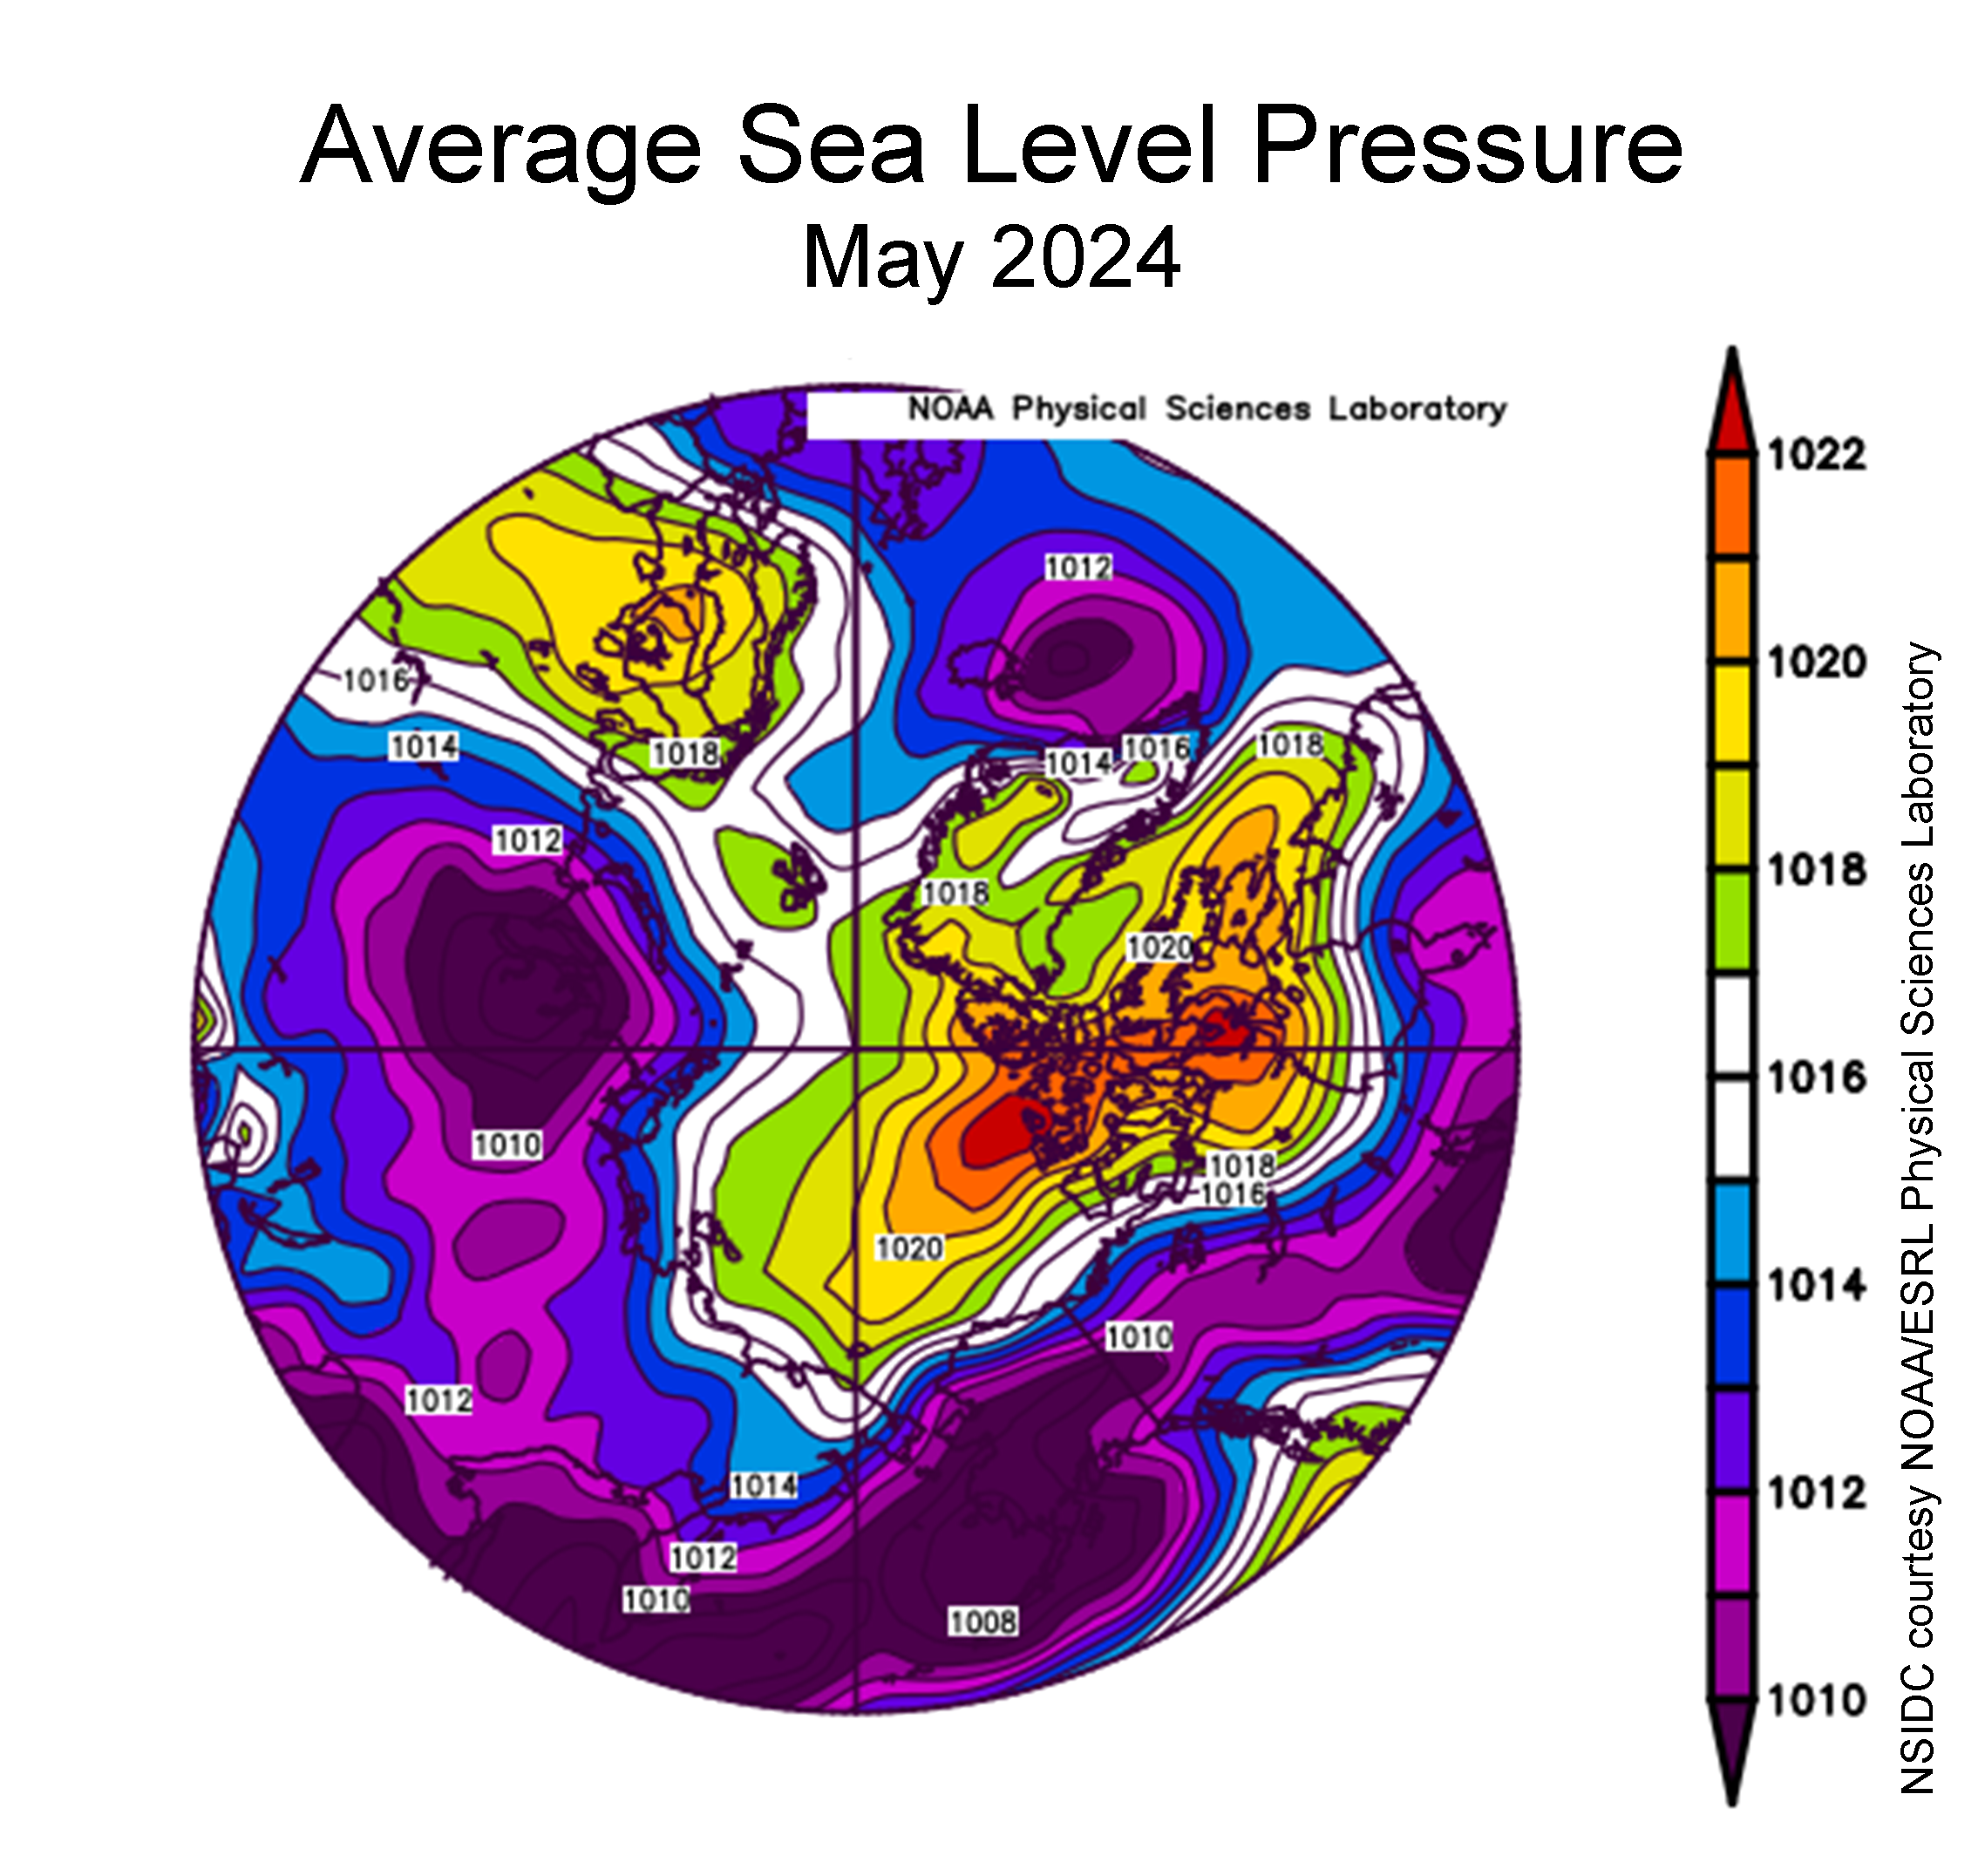
Figure 2b. This plot shows average sea level pressure in the Arctic in millibars for May 2024. Yellows and reds indicate high air pressure; blues and purples indicate low pressure.
Credit: NSIDC courtesy NOAA Earth System Research Laboratory Physical Sciences Laboratory
High-resolution image
Atmospheric conditions over the Arctic were variable during May. Relatively cool conditions reigned over the Bering and Chukchi Seas as well as the Barents and Kara Seas, with air temperatures at the 925 millibar level (about 2,500 feet above sea level) 1 to 3 degrees Celsius (2 to 5 degrees Fahrenheit) below average (Figure 2a). By contrast, temperatures inthe Laptev and East Siberian Seas were 2 to 4 degrees Celsius (4 to 7 degrees Fahrenheit) above average. Temperatures over the Canadian Archipelago and northwestern Hudson Bay were 4 to 5 degrees Celsius (7 to 9 degrees Fahrenheit) above average. It was relatively cool over most of Greenland.
The sea level pressure pattern for May was marked by high pressure centered over the Canadian Archipelago with lower pressures to the south (Figure 2b). As discussed below, this played a large role in the opening of the eastern Hudson Bay by fostering winds from the east that pushed the sea ice west. Pressures were somewhat low from central Russia extending east into Canada, as well as southeast of Greenland.
May 2024 compared to previous years
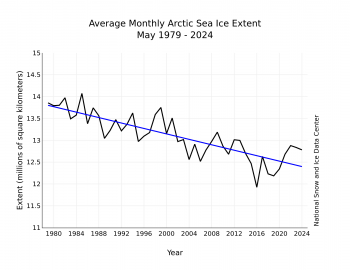
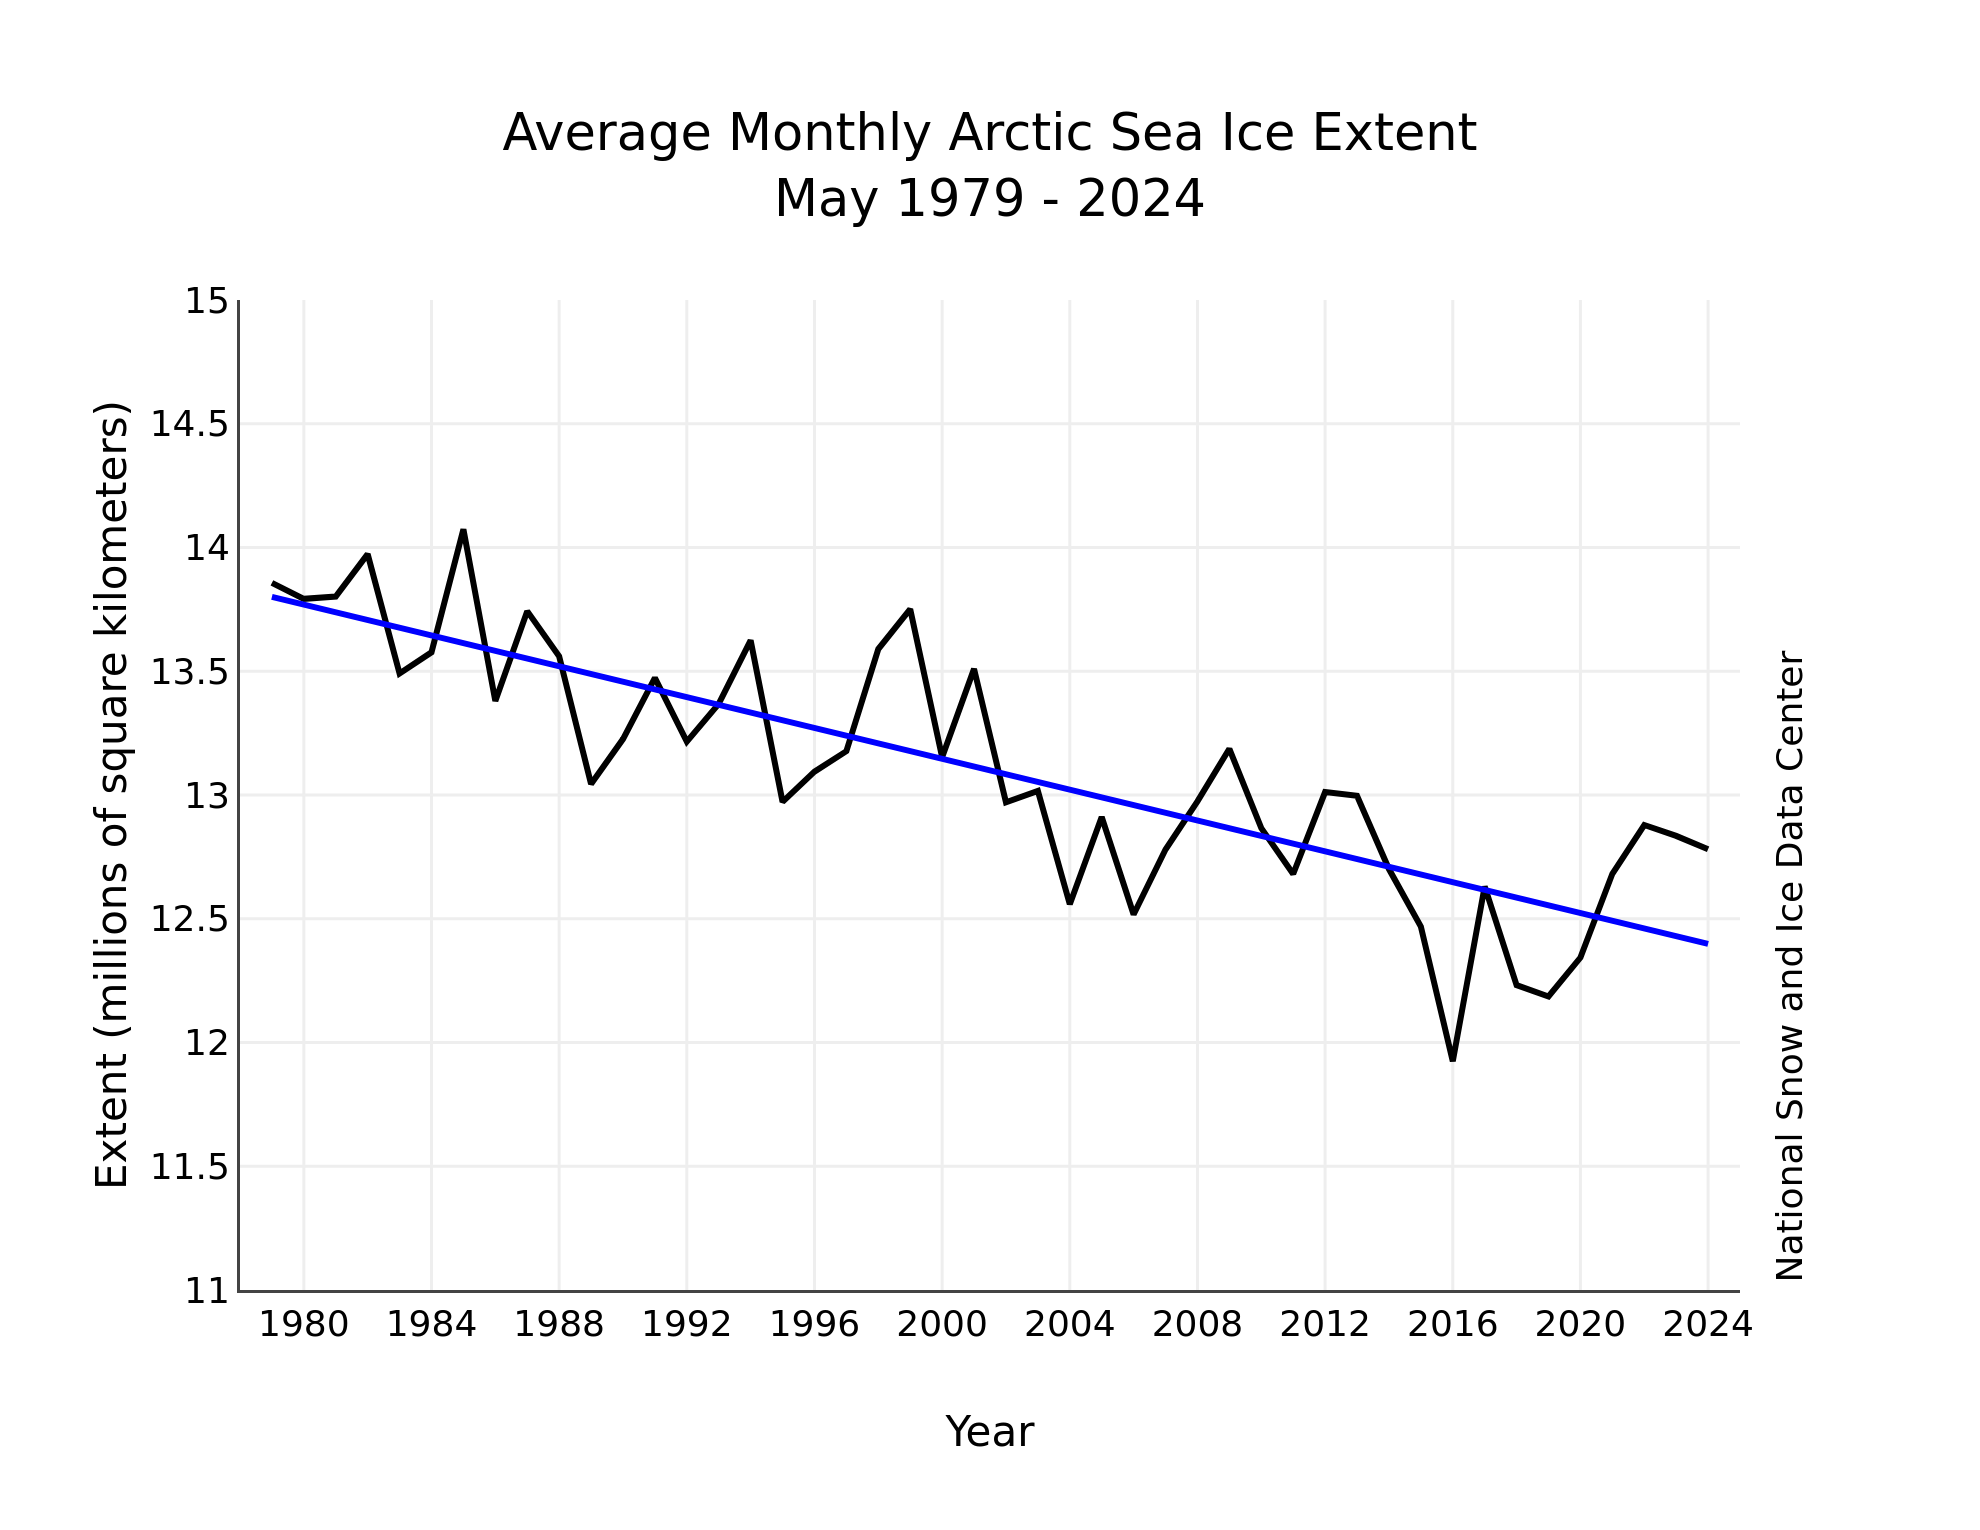
Figure 3. Monthly May ice extent for 1979 to 2024 shows a decline of 2.3 percent per decade.
Credit: National Snow and Ice Data Center
High-resolution image
Including 2024, the downward linear trend in Arctic sea ice extent for May is 31,000 square kilometers (12,000 square miles) per year, or 2.3 percent per decade relative to the 1981 to 2010 average. Based on the linear trend since 1979, April has lost 1.61 million square kilometers (622,000 square miles) of sea ice, which is roughly equivalent in size to the state of Alaska.
May has the smallest downward trend of all months, most likely because the month’s larger ice pack is more constrained by land than in other months. In winter and early spring, extent extends beyond the Arctic where it can vary in the Bering Sea and Sea of Okhotsk. In summer, the ice melts back from the coast and can vary around much of its perimeter in the Arctic Ocean.
An unusual Hudson Bay opening

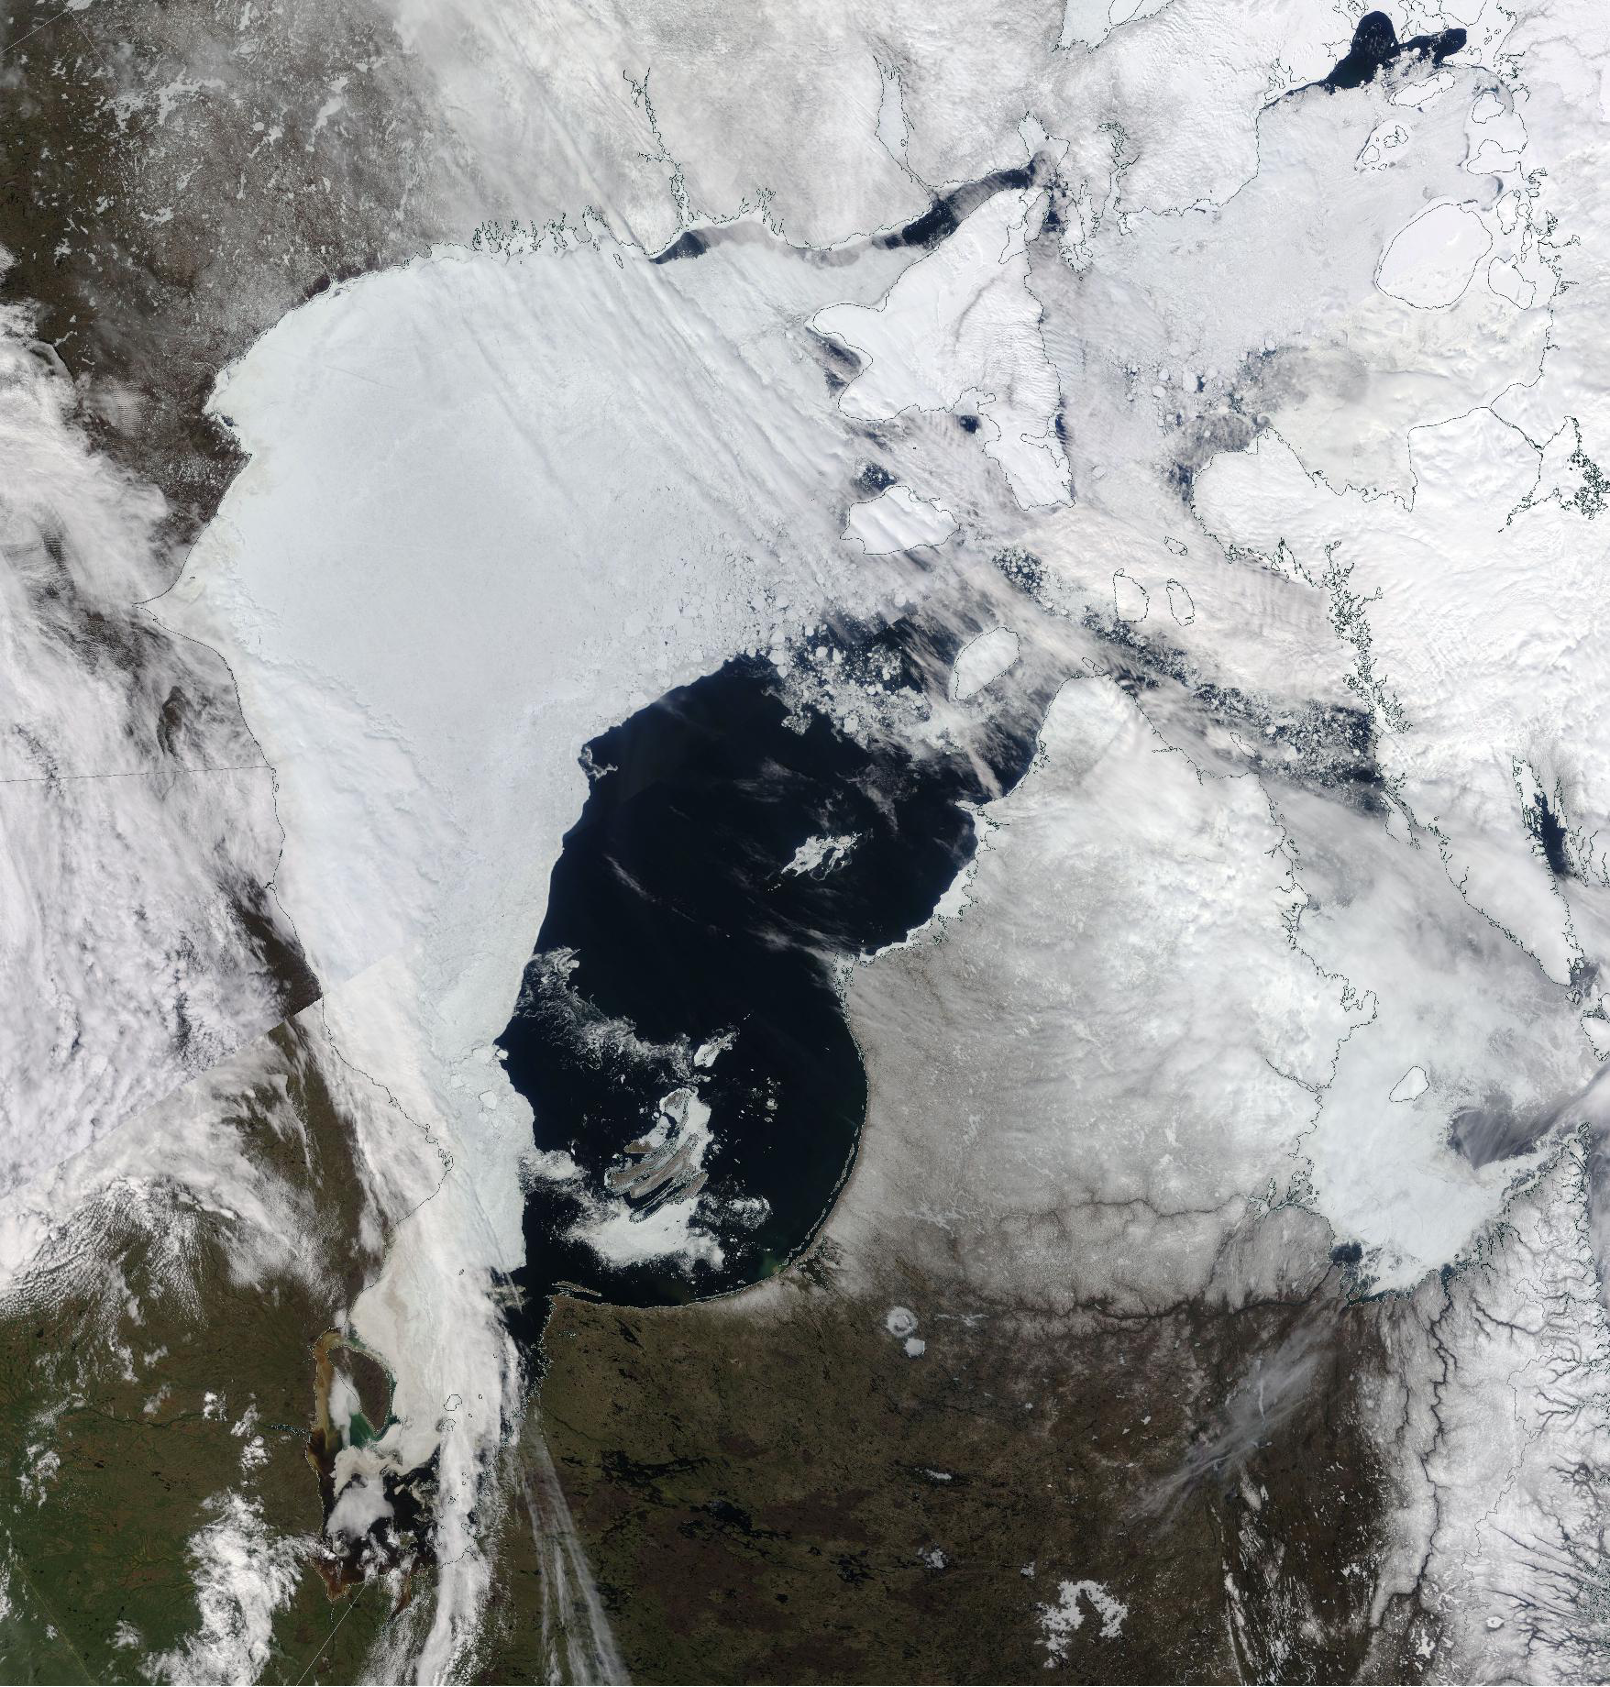
Figure 4a. This NASA Moderate Resolution Imaging Spectroradiometer (MODIS) True Color image from May 26, 2024, shows the vast retreat of sea ice from the eastern coast Hudson Bay.
Credit: NASA Worldview
High-resolution image
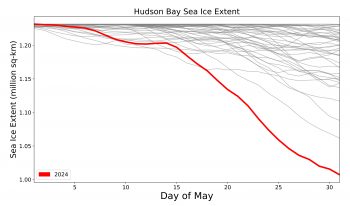
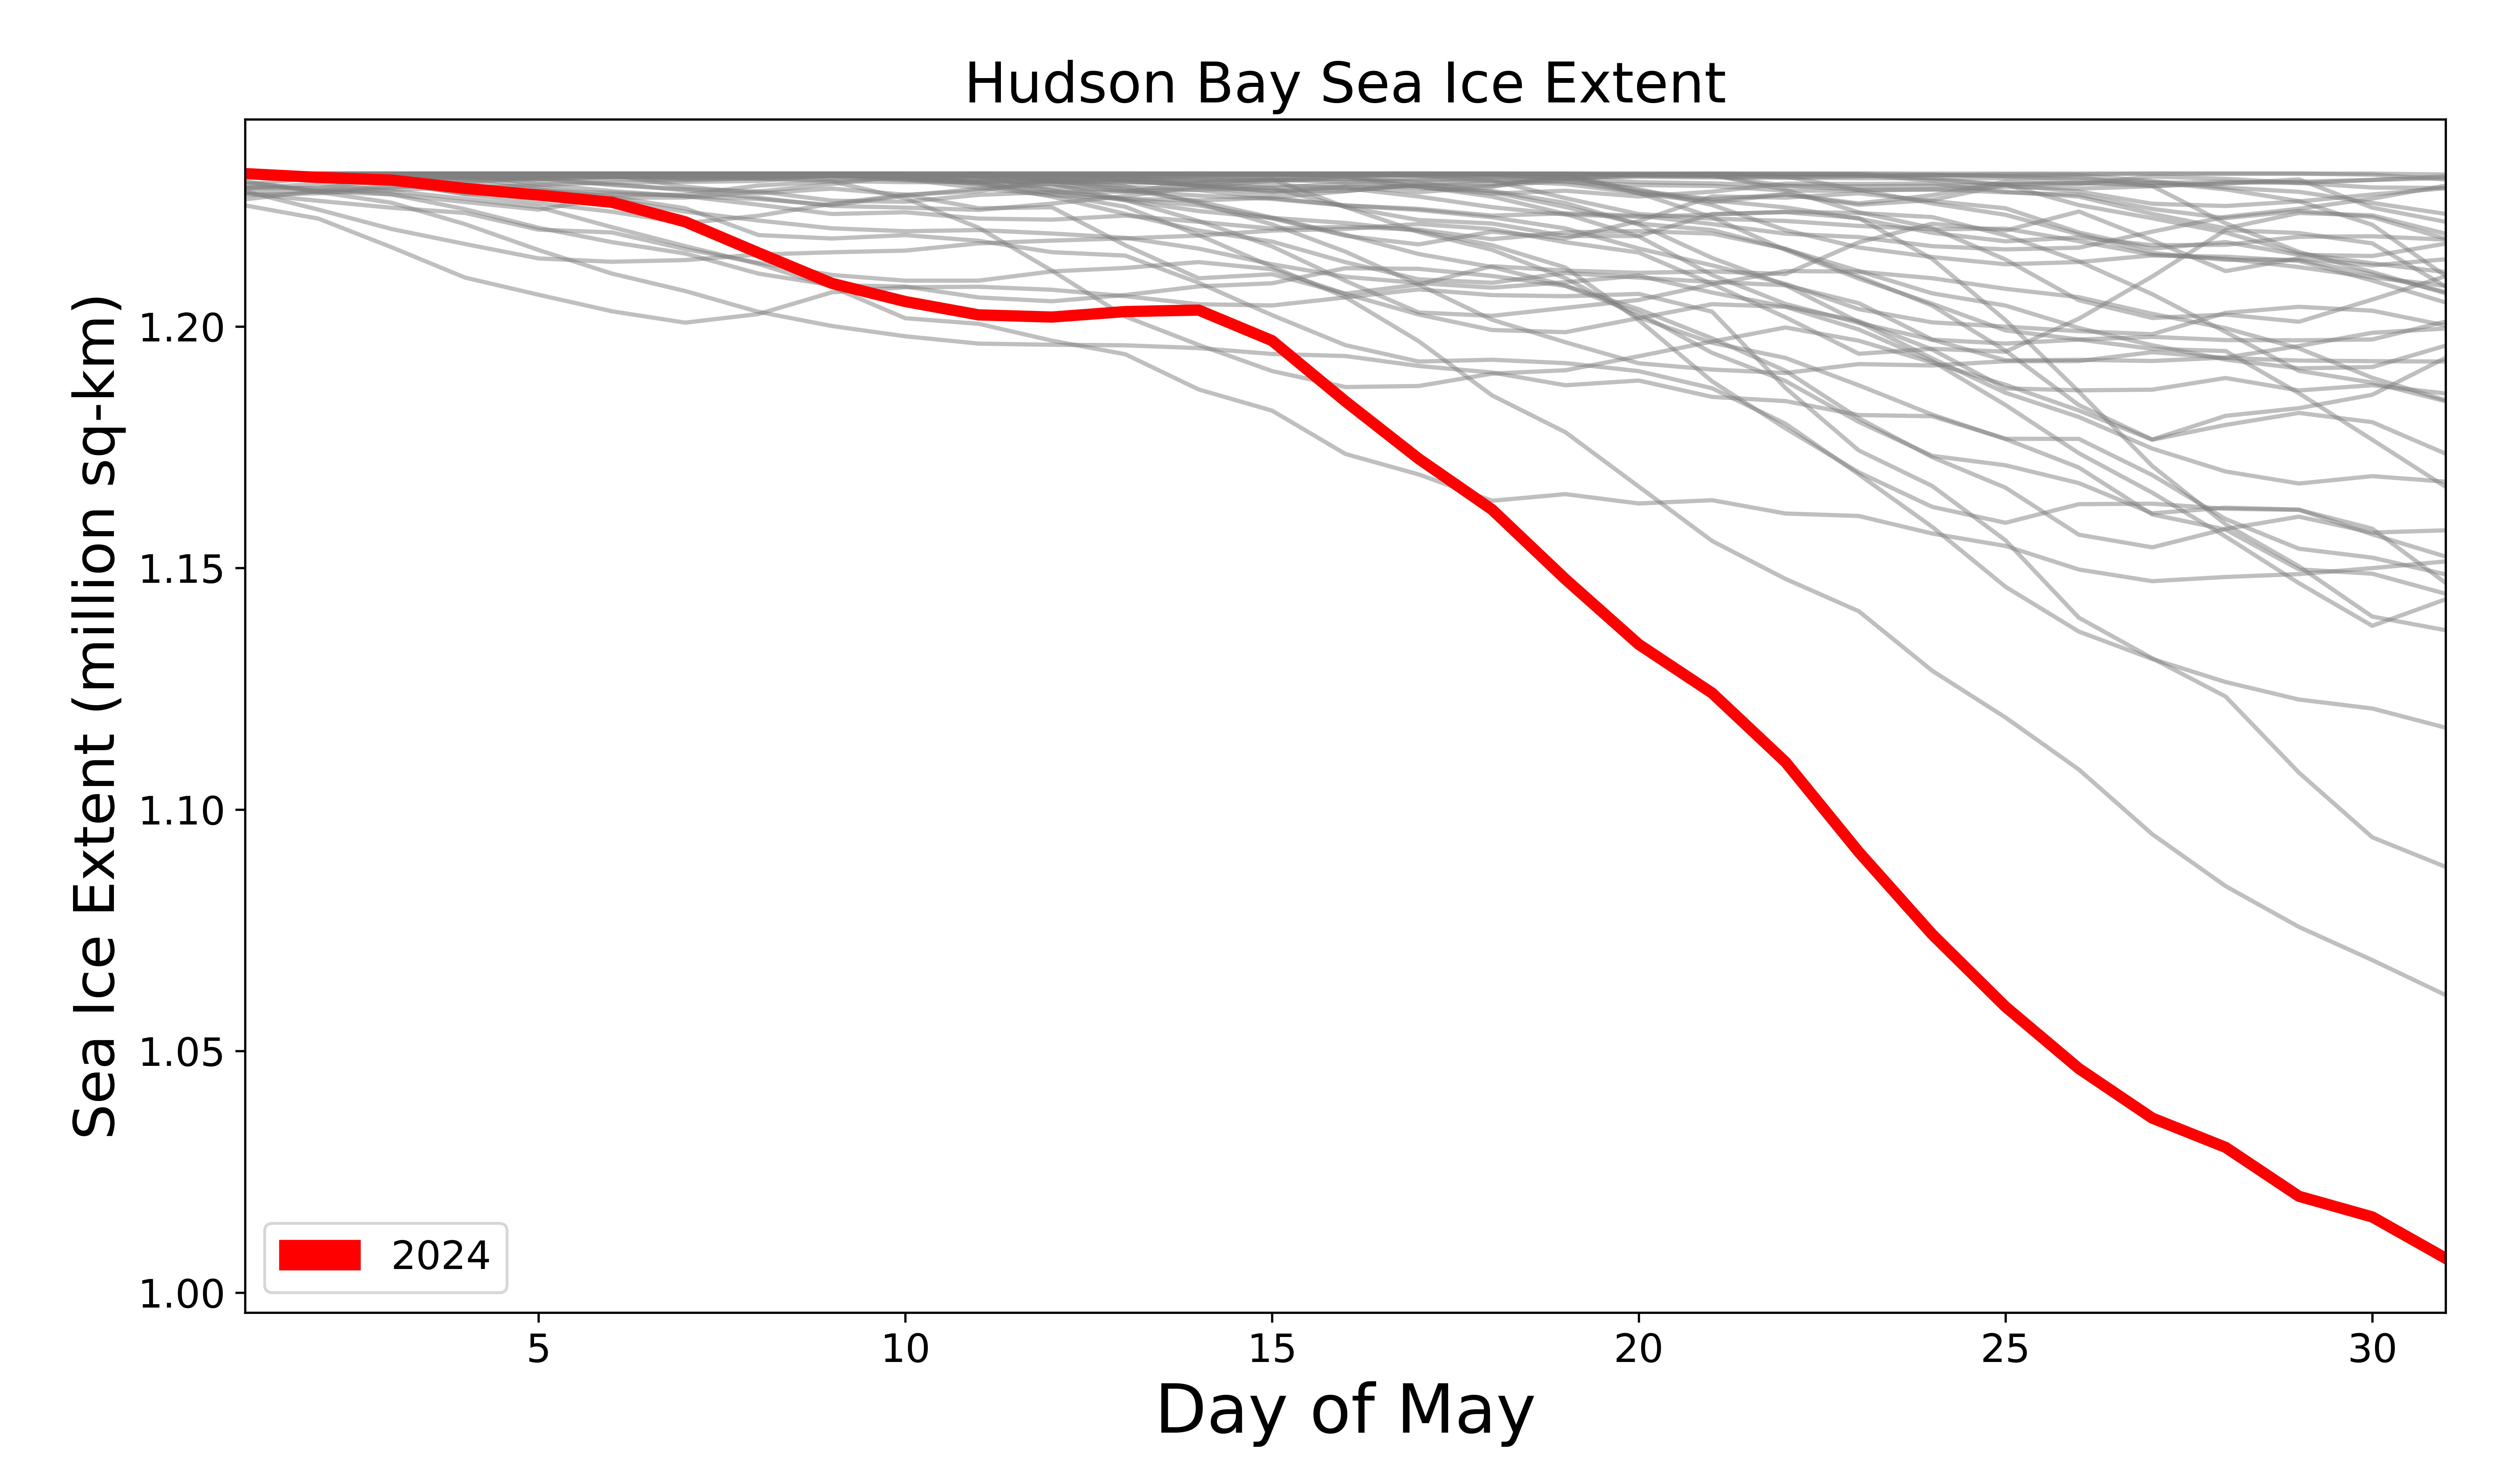
Figure 4b. This graph shows sea ice extent in Hudson Bay for May 2024 in red and all previous years in grey since 1979, when the satellite record began.
Credit: National Snow and Ice Data Center
High-resolution image
This May, early ice loss in the eastern part of Hudson Bay was striking (Figure 4a). On average, Hudson Bay remains nearly completely ice covered through May, though it is not uncommon for some openings in the northwest part of the bay when winds from the northwest push ice away from the coast. However, in terms of size and location, the current opening in the east is unique in the satellite record that dates back to 1979 and has led to the lowest recorded sea ice extent for Hudson Bay for the month (Figure 4b).
Unusual strong and persistent winds from the east caused the low extent, related to the strong pressure gradient between high pressure over the Canadian Archipelago and lower pressure to the south. Some initial opening occurred even in April, but was followed by refreezing. Beginning in early May, the ice moved away from the eastern coast and open water has persisted there since.
As of June 1, Hudson Bay sea ice extent was 205,000 square kilometers (79,000 square miles) below the 1981 to 2010 average extent and 65,000 square kilometers (25,000 square miles) below the previous record low set in 2015.
In memoriam: Ian Stirling
We are deeply saddened by the passing of our colleague Ian Stirling. Ian joined the Canadian Wildlife Service (now Environment and Climate Change Canada) in 1970, where he began his polar bear research projects that would continue for over 30 years. When Ian started, very little was known about polar bears and how they were being impacted by changes to their environment. During his career, he was an energetic field observer, prolific author with more than 250 peer-reviewed scientific papers and five books, and a dedicated graduate student supervisor. In retirement, Ian was a popular naturalist and tour guide on Arctic and Antarctic cruises while he continued to contribute to research. Before he passed, he provided his polar bear expertise to a paper led by NSIDC scientist Julienne Stroeve that looks at the future of the Hudson Bay sea ice environment and impacts on polar bears and ringed seals. The paper will be published in the coming weeks in Nature.
A polar low
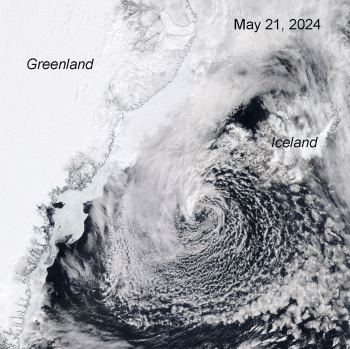
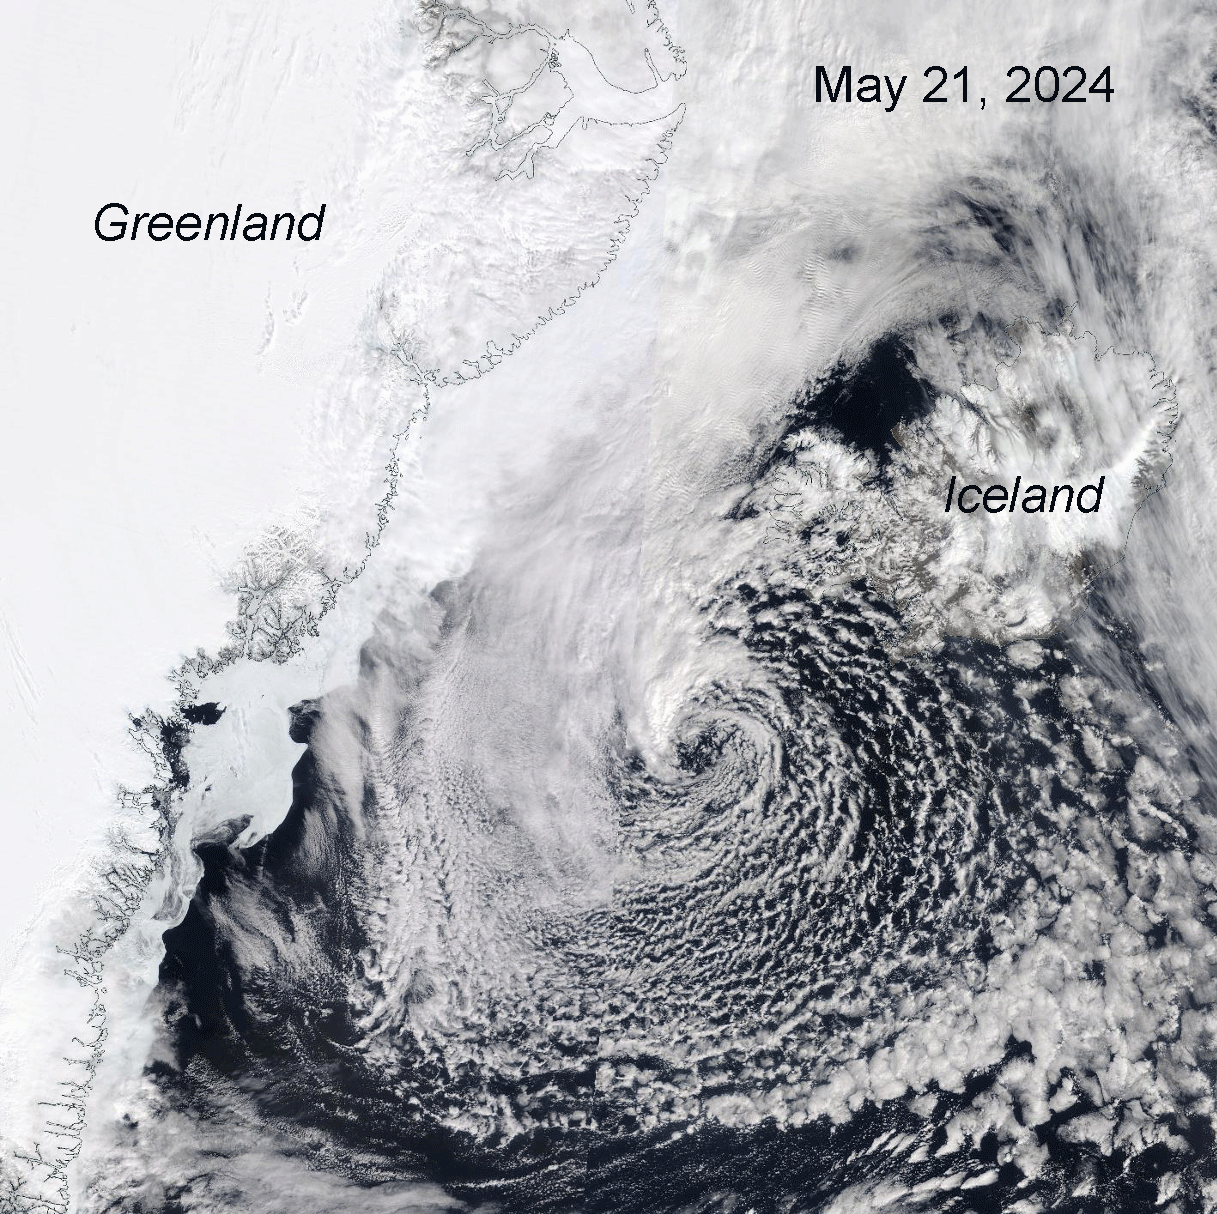
Figure 6. Click to animate. This NASA Moderate Resolution Imaging Spectroradiometer (MODIS) True Color animation flickers between May 20, 2024, and May 21, 2024, to show the progression of the polar low. Greenland is on its left; Iceland is to its right.
Credit: NASA Worldview
High-resolution image
An interesting feature that was spotted in May was a well-defined polar low that formed off the east coast of Greenland on May 20 and tracked off the southwest coast of Iceland until it dissipated May 22. Polar lows are typically small and short-lived (typically no more than two days) low-pressure systems that form over open water. They are features of the cold season only, and quickly die out if moving over the sea ice or land. While some polar lows have a comma-shaped cloud signature, others, like this May example as shown in Moderate Resolution Imaging Spectroradiometer (MODIS) True Color Imagery on NASA’s WorldView, exhibit a spiral pattern with a central eye. Because of their appearance, such polar lows are sometimes called “Arctic hurricanes.” However, polar lows are much smaller and shorter lived than tropical cyclones and formative processes are complex, involving effects of both horizontal temperature gradients (known as baroclinic processes) and convection. Polar lows can present hazards to shipping.
Lopsided Antarctic sea ice

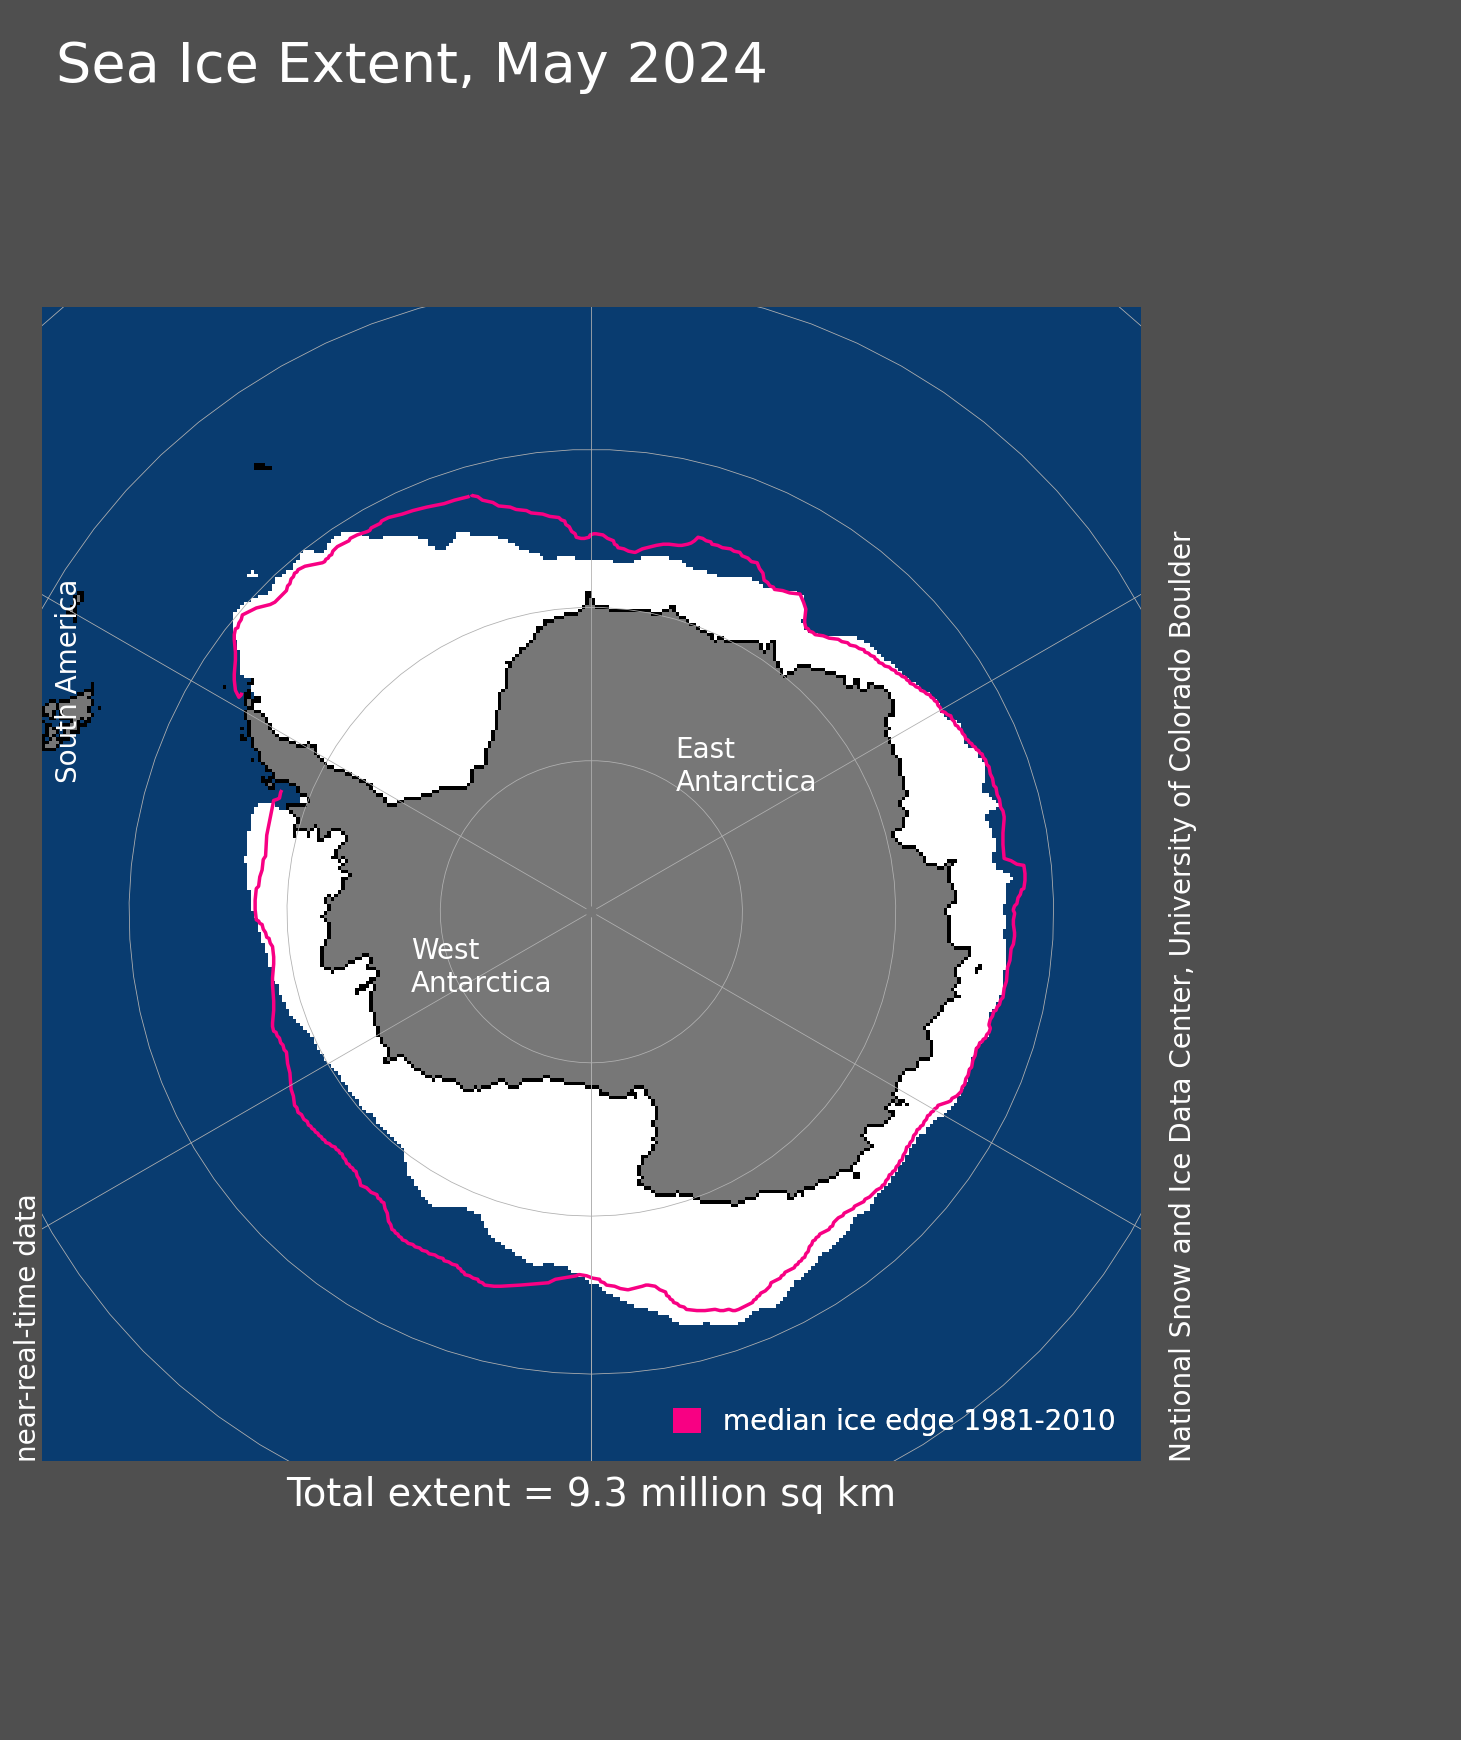
Figure 7. Antarctic sea ice extent for May 2024 was 9.27 million square kilometers (3.58 million square miles). The magenta line shows the 1981 to 2010 average extent for that month. Sea Ice Index data. About the data
Credit: National Snow and Ice Data Center
High-resolution image
Antarctic sea ice growth is progressing as austral winter approaches. During May, the rate of growth was slow relative to the 1981 to 2010 average, but still much faster than last year. As of June 1, Antarctic sea ice extent was 10.52 million square kilometers (4.06 million square miles), which is 1.14 million square kilometers (440,000 square miles) below the 1981 to 2010 average, but well above the June 1, 2023 extent of 9.64 million square kilometers (3.72 million square miles).
The May ice edge was much farther south (below average extent) in the eastern Ross Sea sector and Amundsen Sea as well as north of Dronning Maud Land. Extent was higher (farther north) than average in the Weddell Sea and just west of the Ross Sea. This has resulted in an unusually asymmetric extent pattern around the Antarctic continent.
Changes to Antarctic sea ice extent
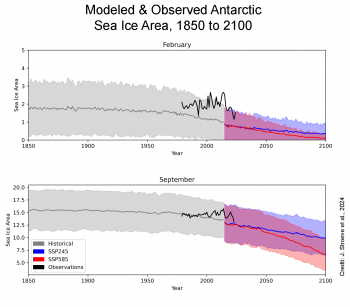
Figure 8. These graphs compare Antarctic sea ice area for February, on top, and September, on bottom, between observations (black line) and CMIP6 model simulations (blue and red lines). The average historical CMIP6 estimates are denoted by the dark gray line with the two standard deviation range of models in shaded light gray. The CMIP6 future extent projections for a 2 degrees Celsius (4 degrees Fahrenheit) global warming (SSP245) are in blue and for 4 degrees Celsius (7 degrees Fahrenheit) global warming (SSP585) are in red with two standard-deviation ranges in respective, shaded colors.
Credit: J. Stroeve et al., 2024
High-resolution image
The causes behind the shift toward lower Antarctic sea ice extent that began in 2016, discussed in previous posts, continue to be studied. Comparing observations with Coupled Model Intercomparison Project 6 (CMIP6) model simulations reveals that models generally underestimate both maximum and minimum extent in the Antarctic. There is good agreement for September during the early part of the record, but the models do not capture the upward sea ice trend from the 1980s through 2015. In February, the model estimates of the minimum area are substantially lower than the observed area. The regime shift to lower areas has resulted in a closer match between the models and observations, particularly for September. This suggests that natural variability in observed sea ice extent is significant.
A recent study by Diamond et al., in Geophysical Research Letters, examined last year’s extreme record low Antarctic winter maximum within the CMIP6 models. They found that without climate warming, such an event is extremely unlikely to occur. When greenhouse gas forcing is included, the event becomes more likely, though still rare. The models suggest that after such an extreme low, there is some recovery, typically occurring over the following decade, but resulting in a new, lower long-term average extent.
References
Diamond, R., L. C. Sime, C. R. Holmes, and D. Schroeder. 2024. CMIP6 models rarely simulate Antarctic winter sea-ice anomalies as large as observed in 2023. Geophysical Research Letters, 51, e2024GL109265, Doi:10.1029/2024GL109265.
Stoll, J. 2022. A global climatology of polar lows investigated for local differences in wind shear environments. Weather and Climate Dynamics 3, doi:10.5194/wcd-3-483-2022.


