Following rapid ice loss in the first half of July, the pace of seasonal ice retreat slowed the rest of the month partly due to the return of a stormy weather pattern over the central Arctic Ocean. The timing of melt onset for 2013 was in general unremarkable. Ice extent remains below average on the Atlantic side of the Arctic, and near average in the Beaufort and Chukchi seas, and along the Eurasian coast.
Overview of conditions
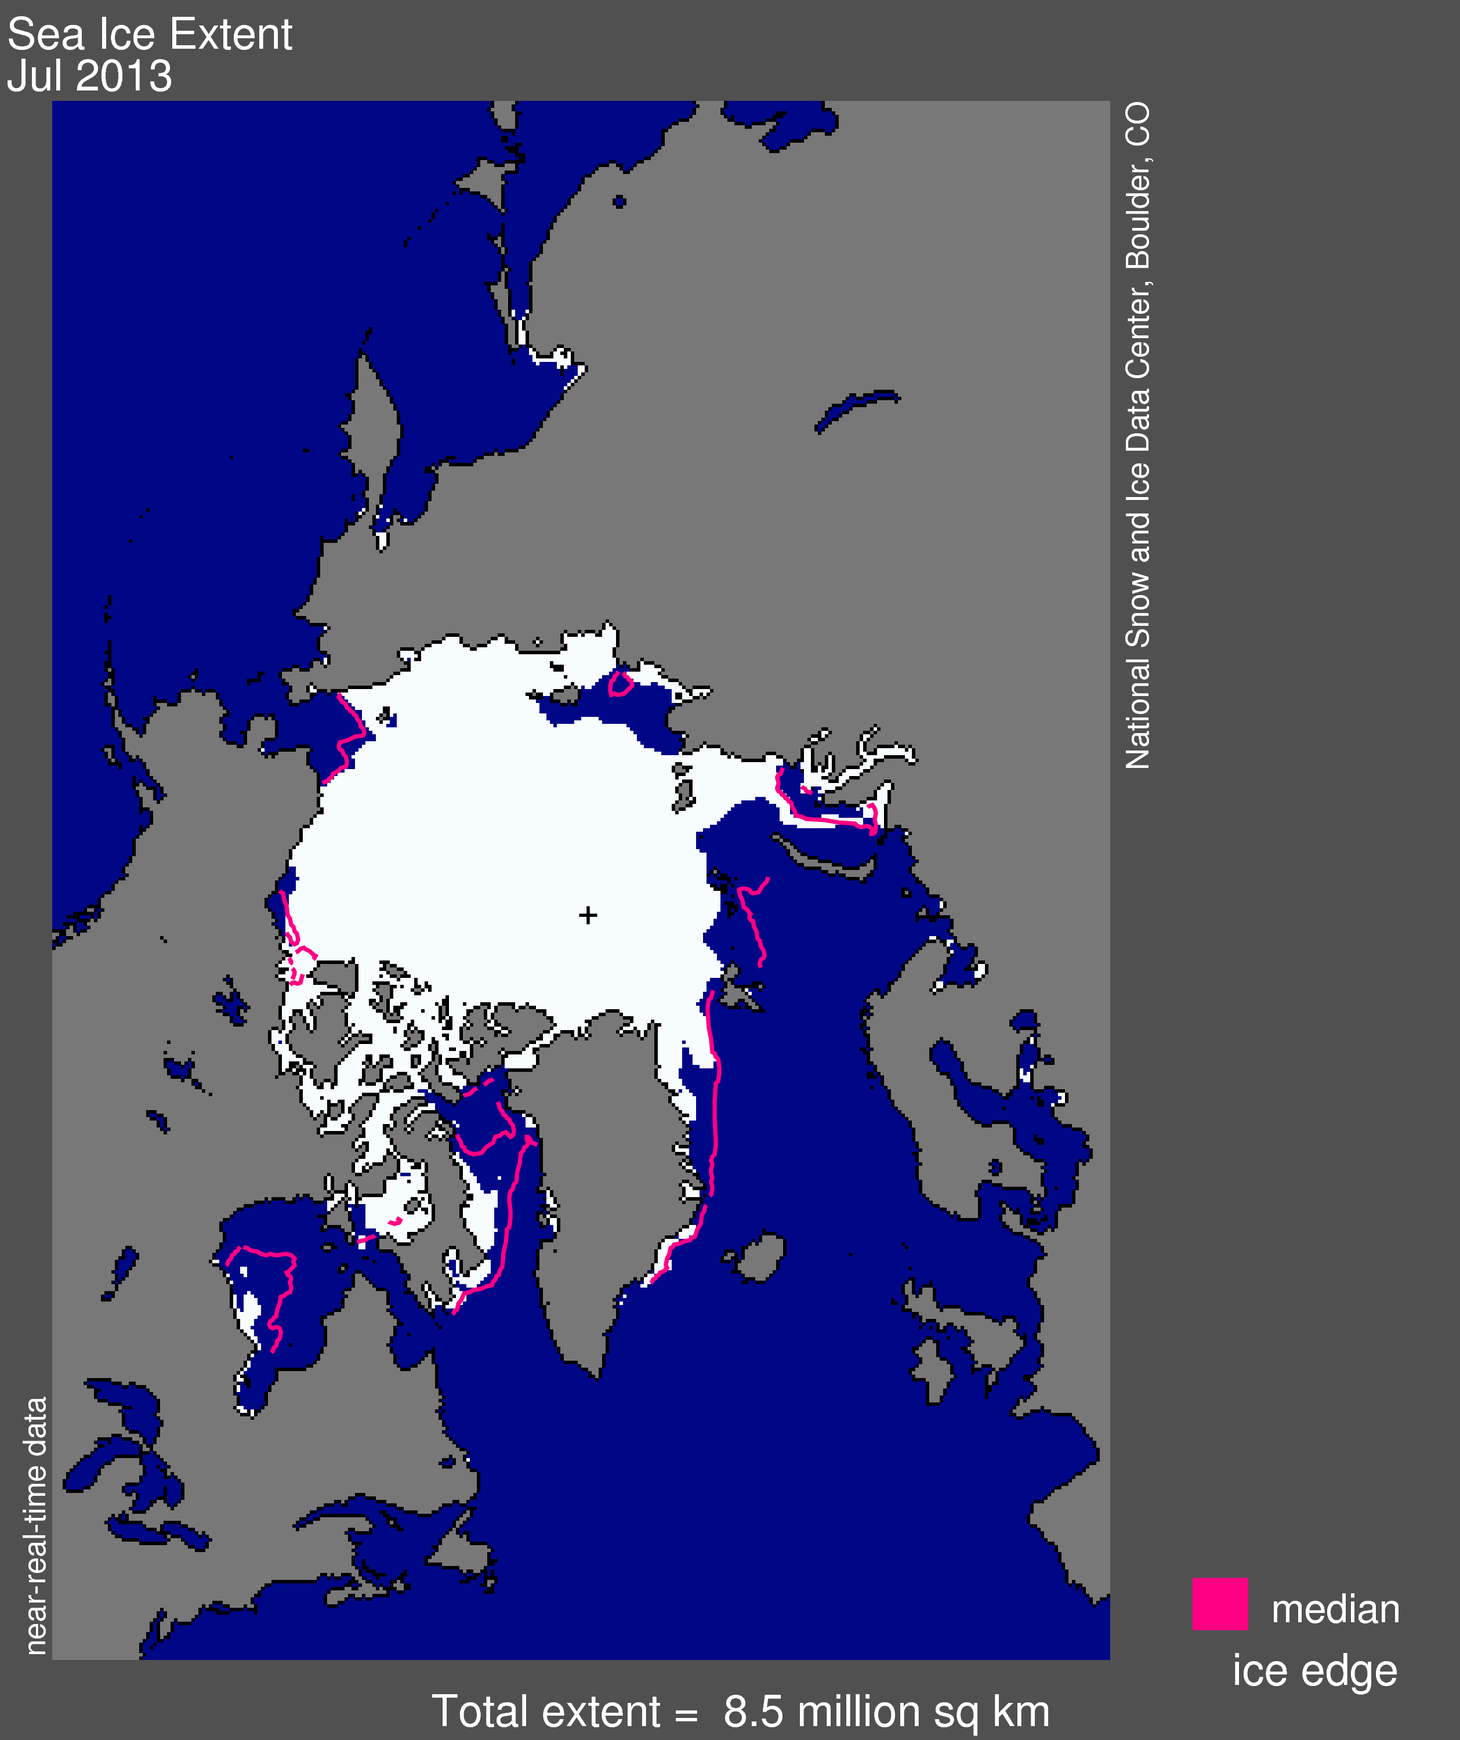
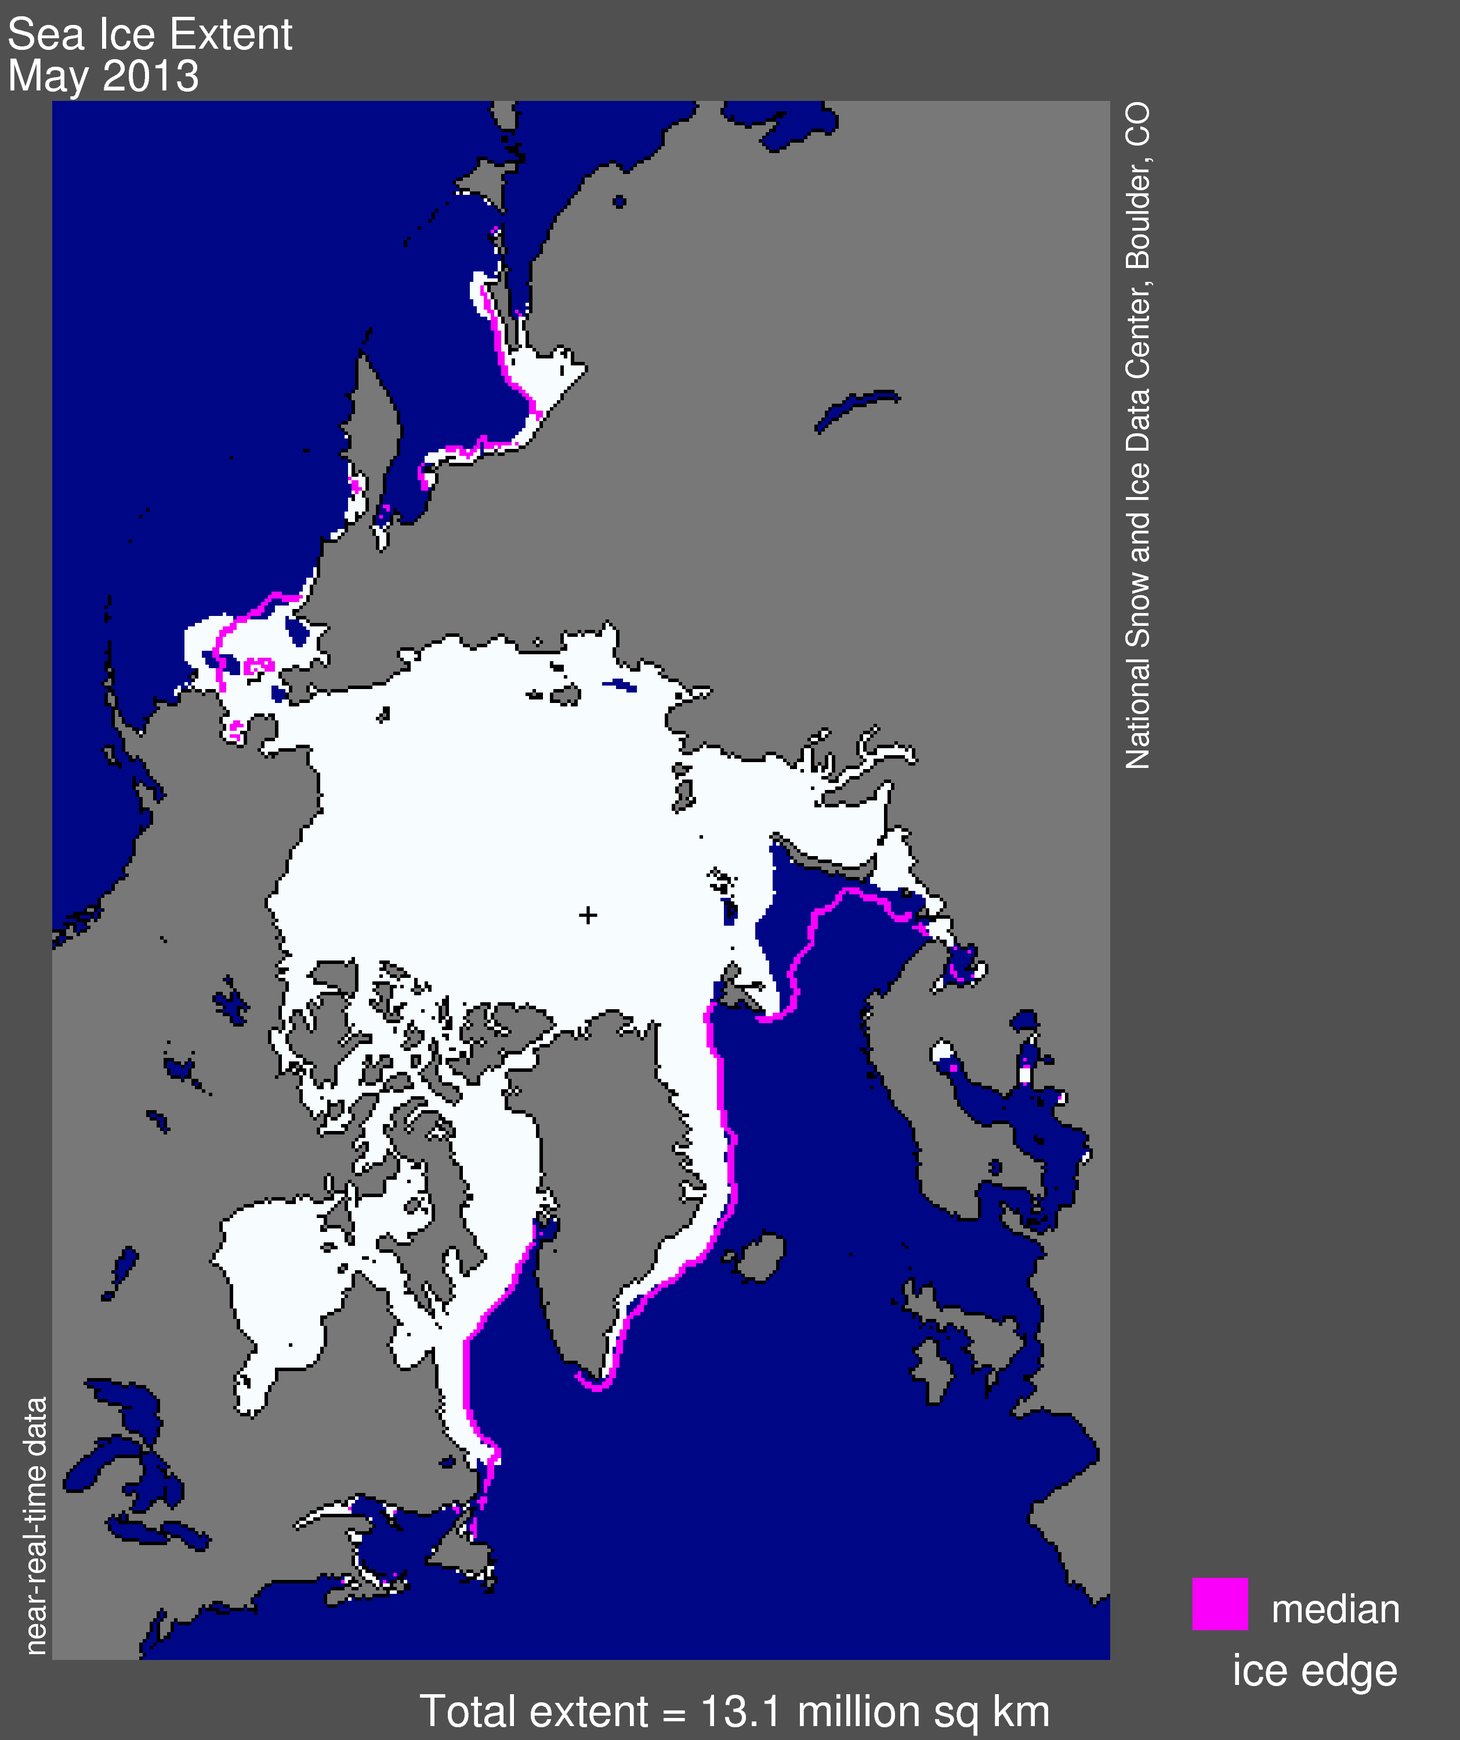
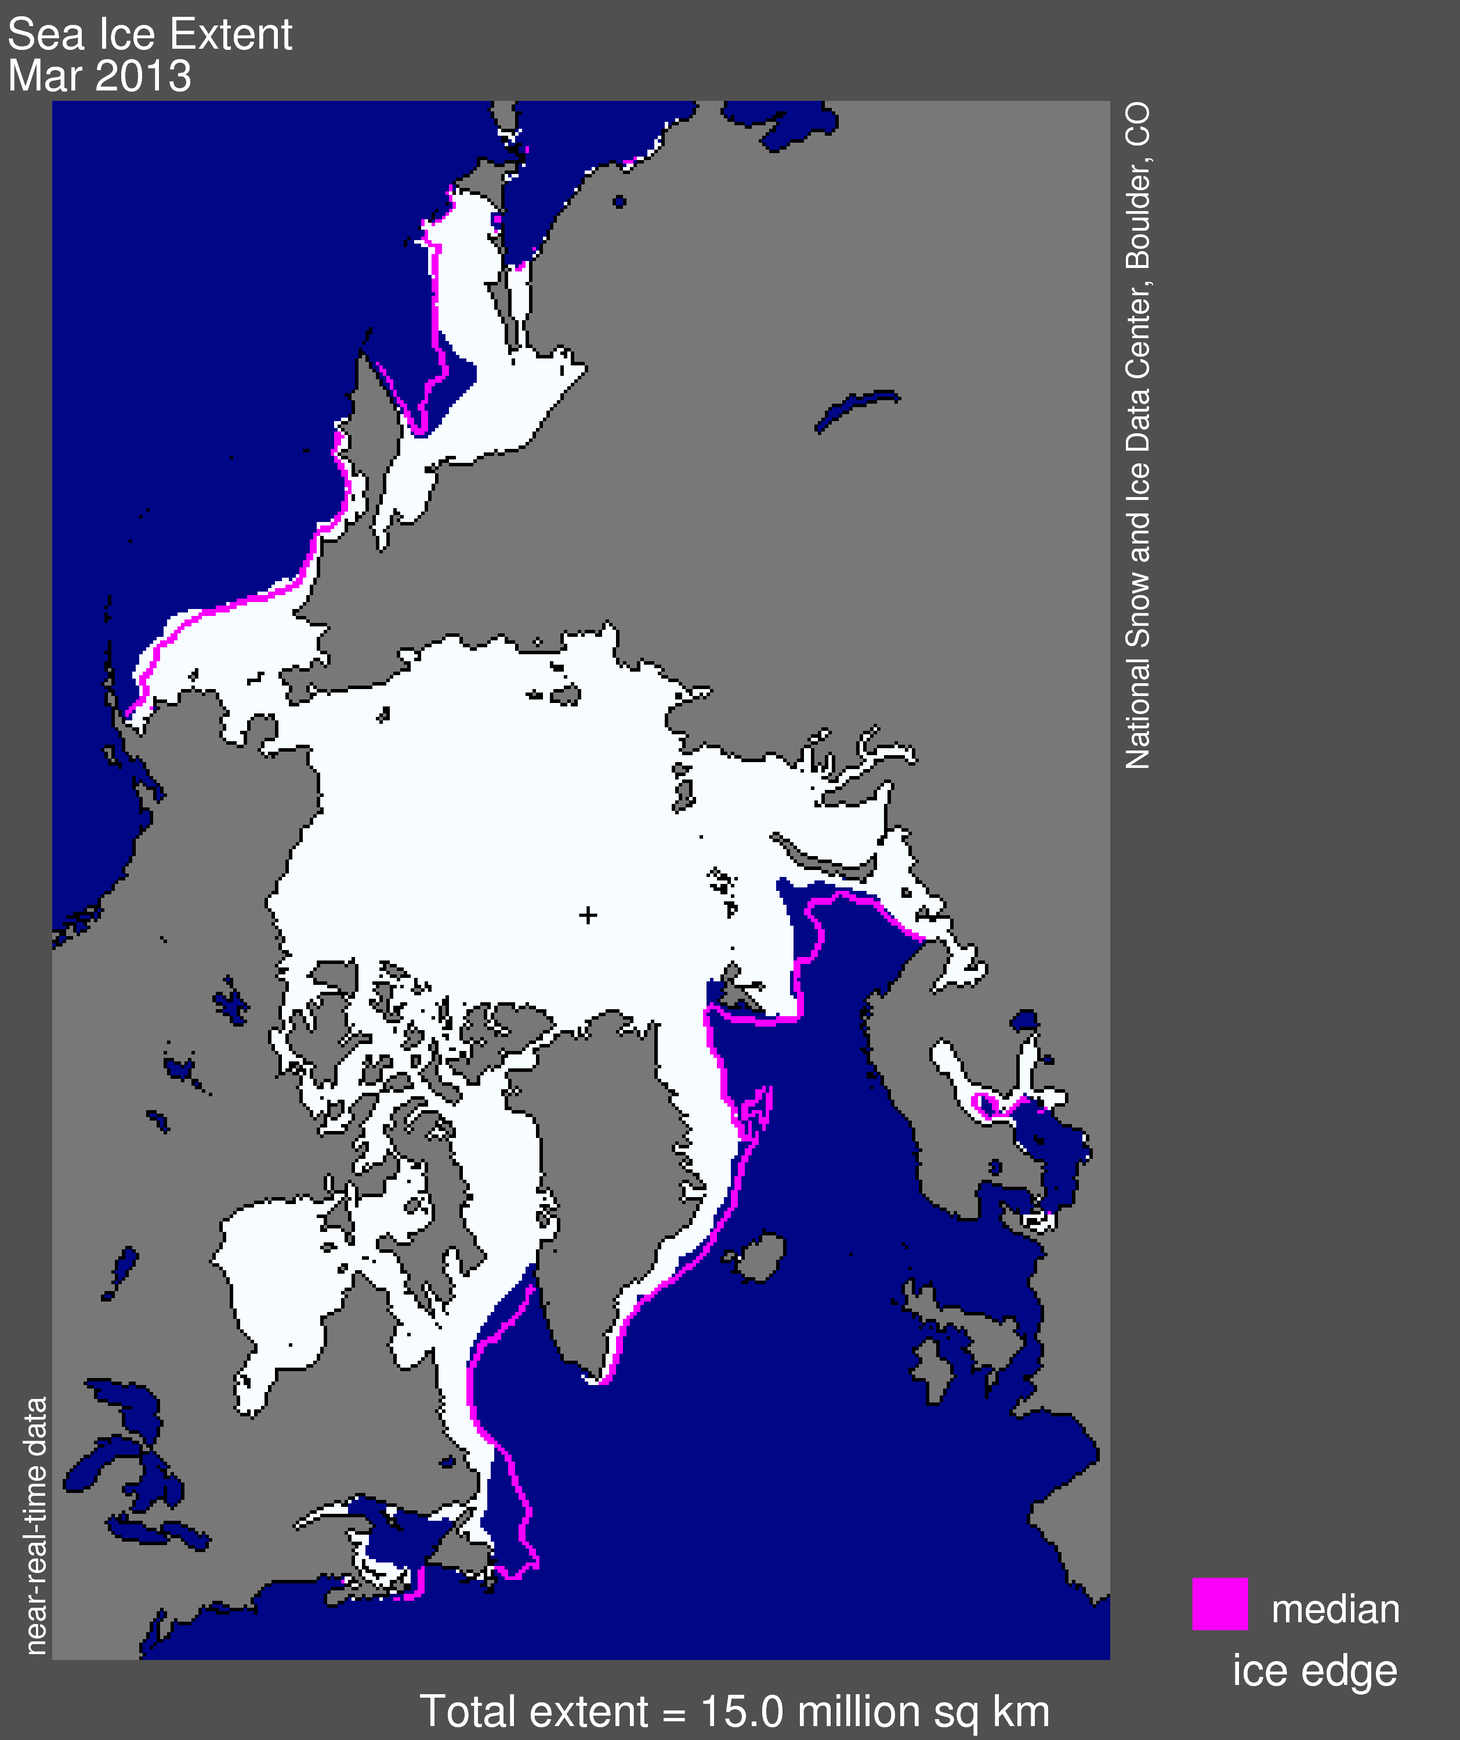
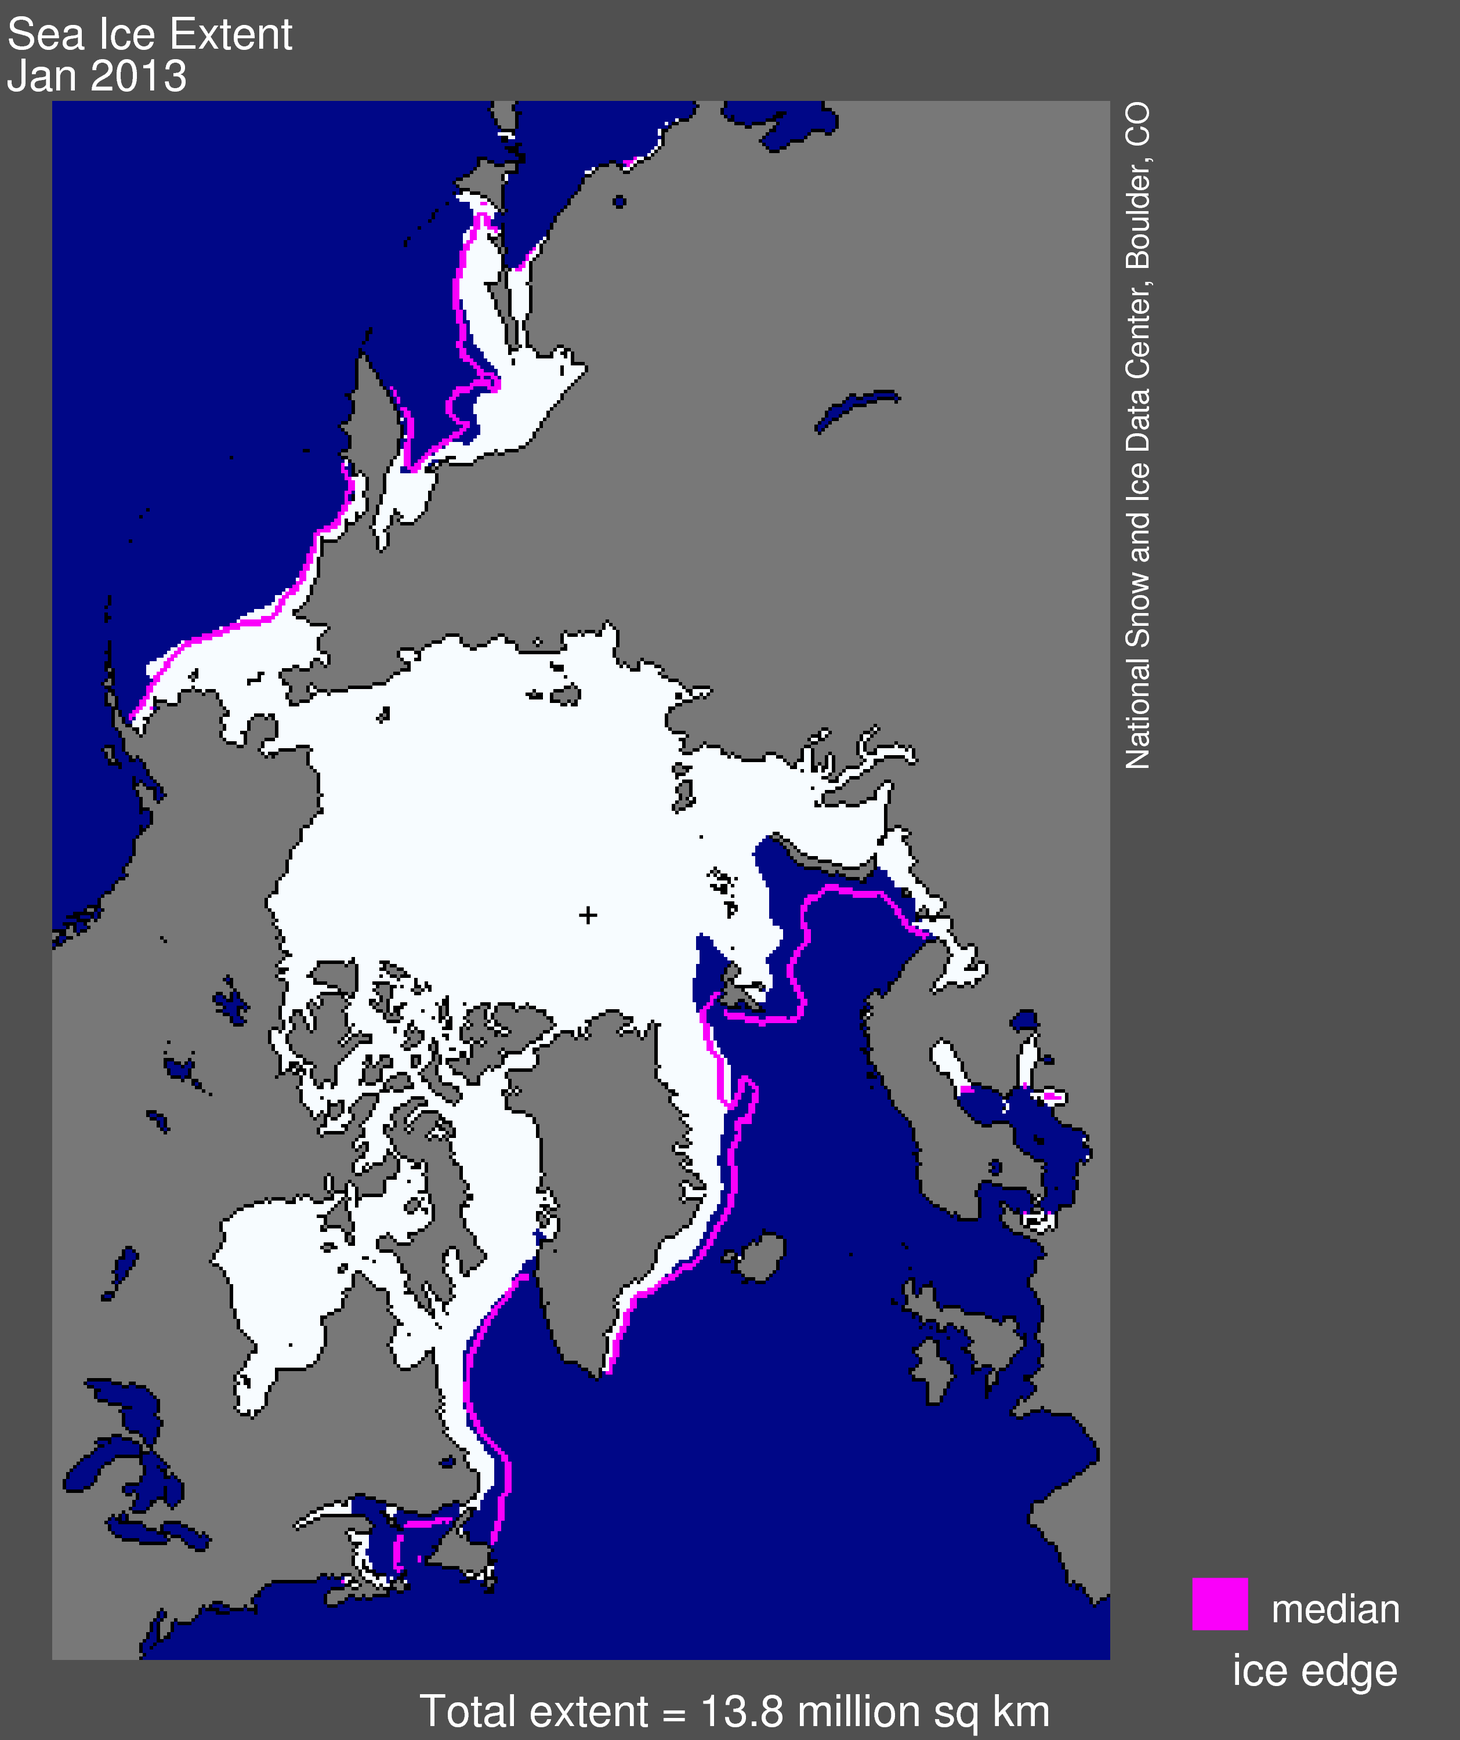
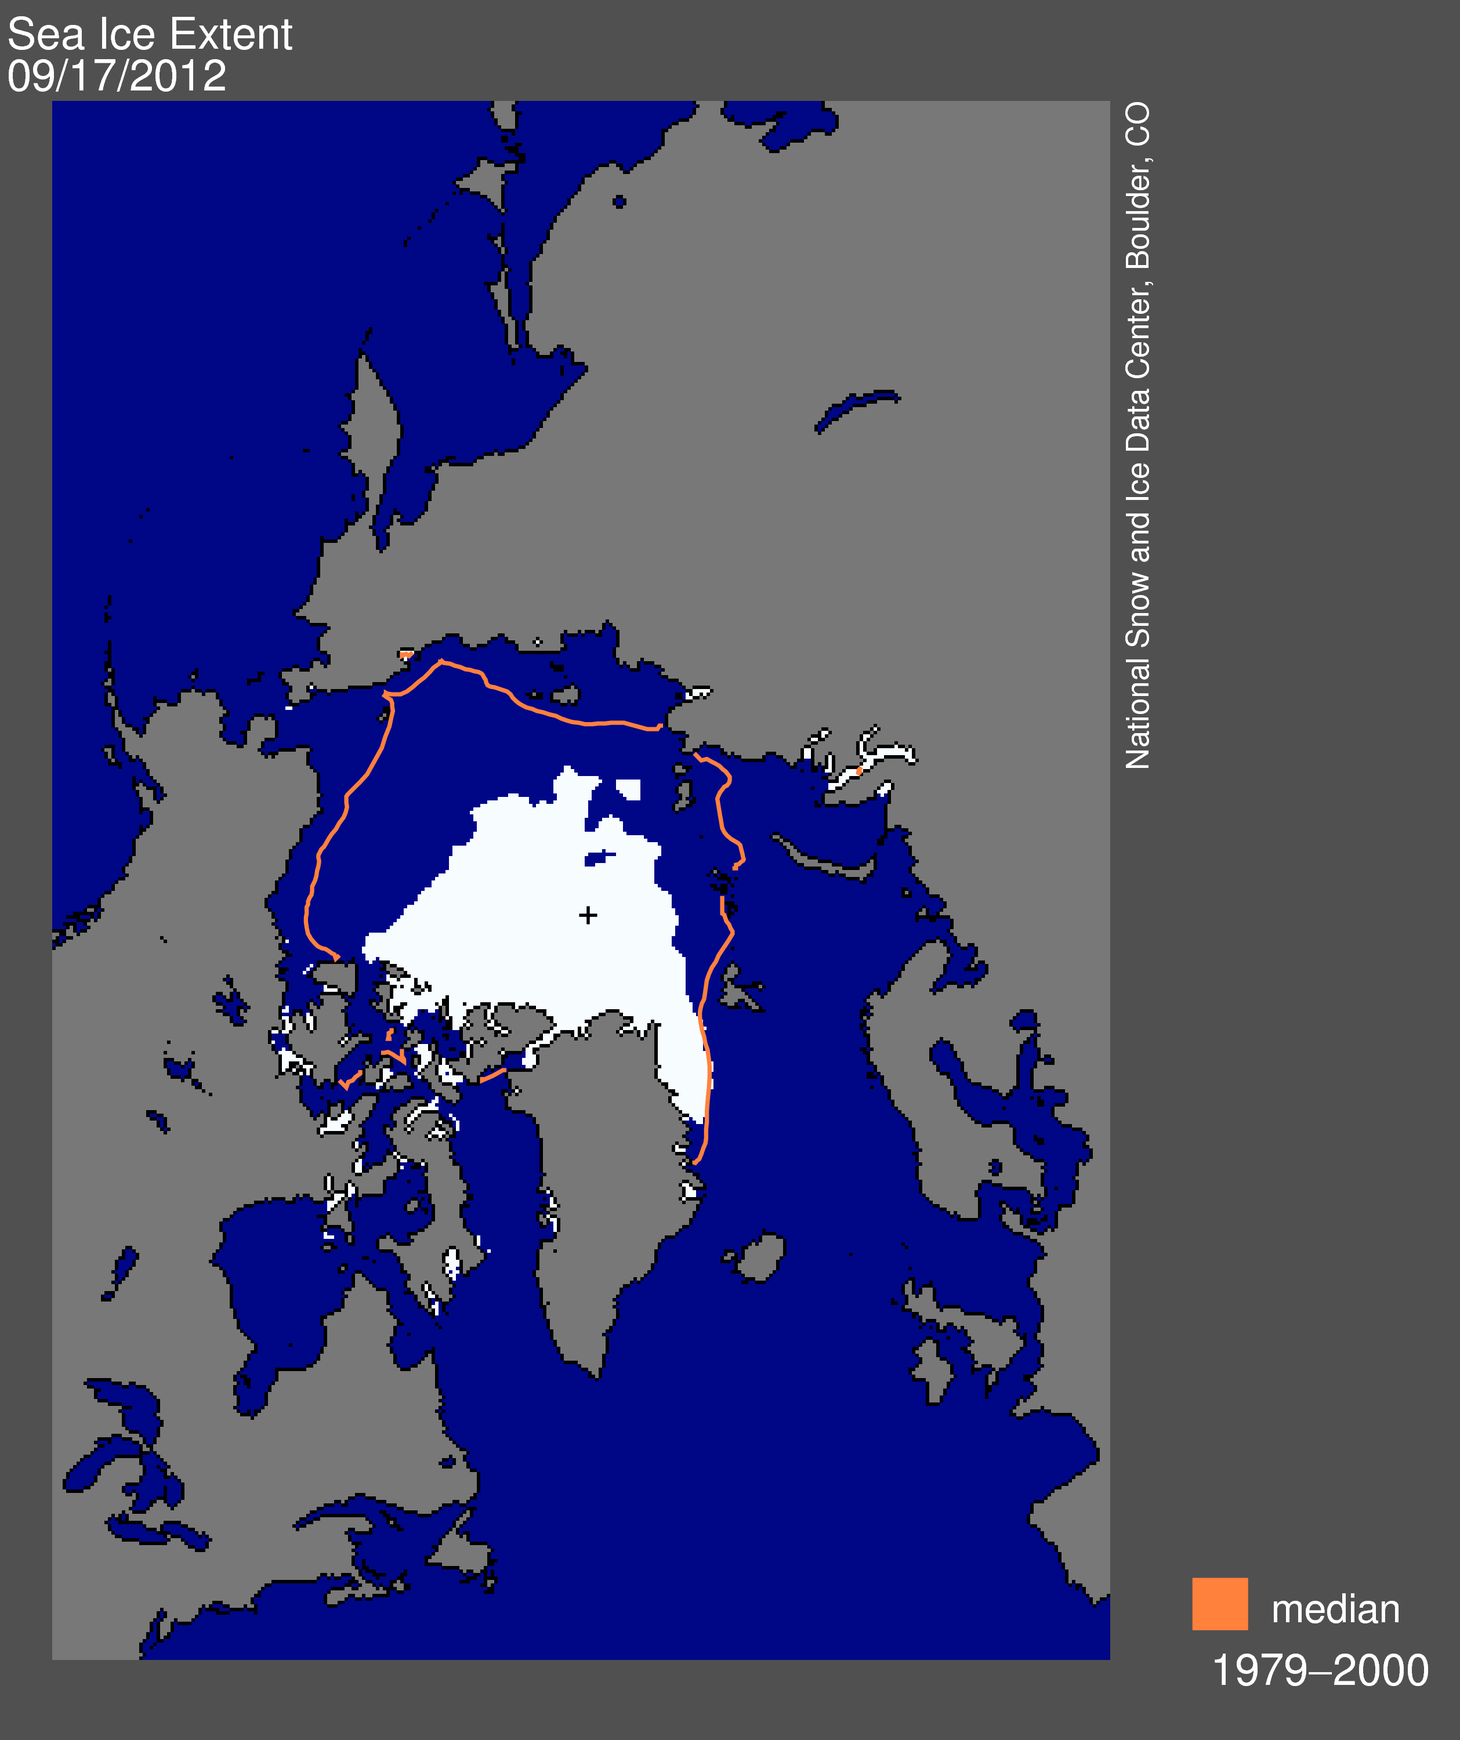
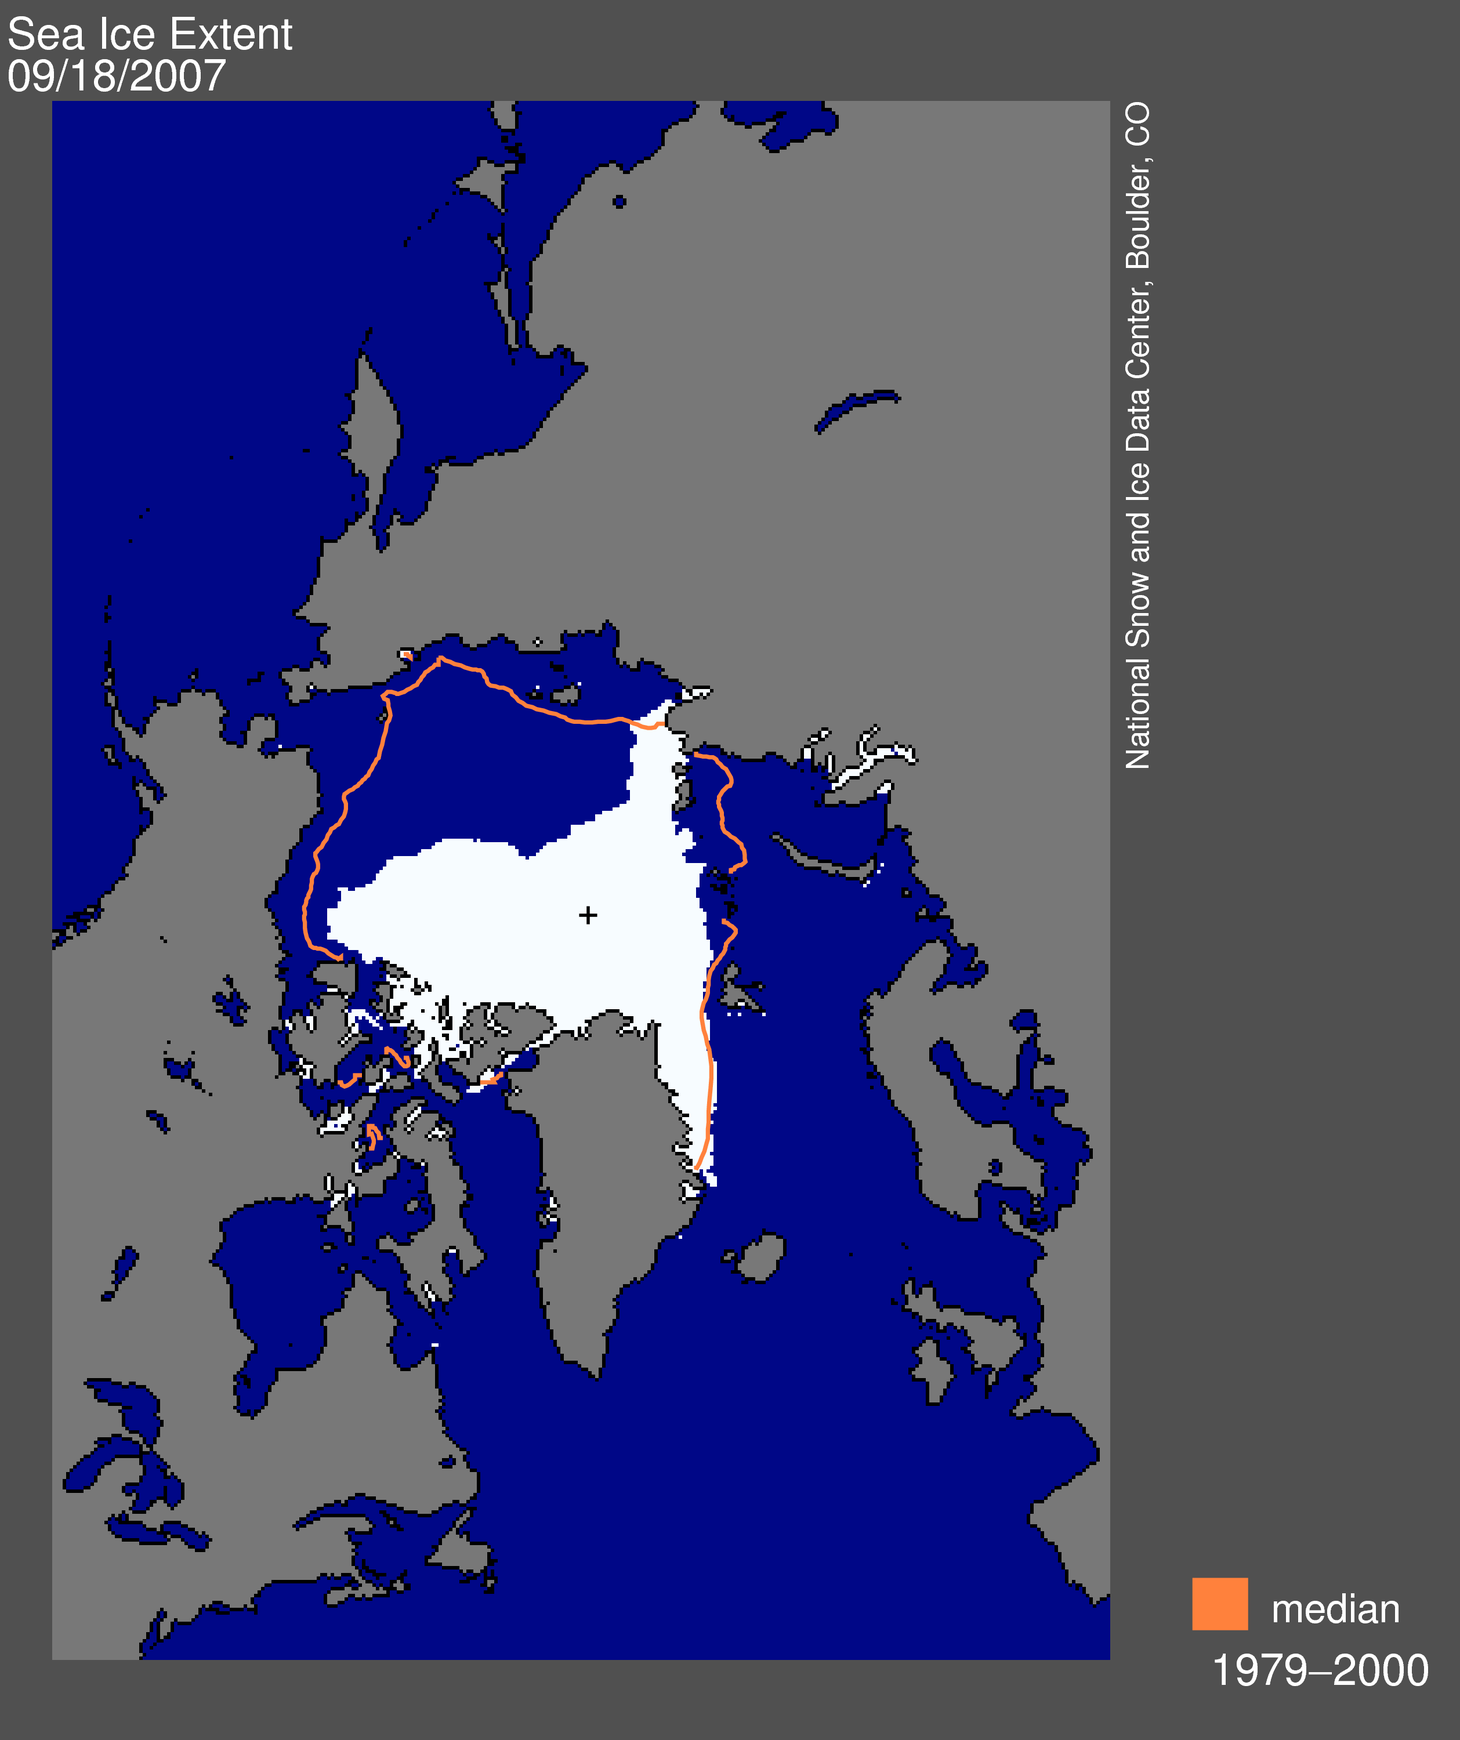
Figure 1. Arctic sea ice extent for July 2013 was 8.45 million square kilometers (3.26 million square miles). The magenta line shows the 1981 to 2010 median extent for that month. The black cross indicates the geographic North Pole. Sea Ice Index data. About the data
Credit: National Snow and Ice Data Center
High-resolution image
Sea ice extent for July 2013 averaged 8.45 million square kilometers (3.26 million square miles). This is 1.25 million square kilometers (483,000 square miles) below the 1981 to 2010 average for the month (Note that on July 2, 2013, NSIDC began using a new 30-year baseline for analyzing sea ice.). Ice extent remains below average on the Atlantic side of the Arctic, and is near average to locally above average in the Beaufort and Chukchi seas and along much of the Eurasian coast.
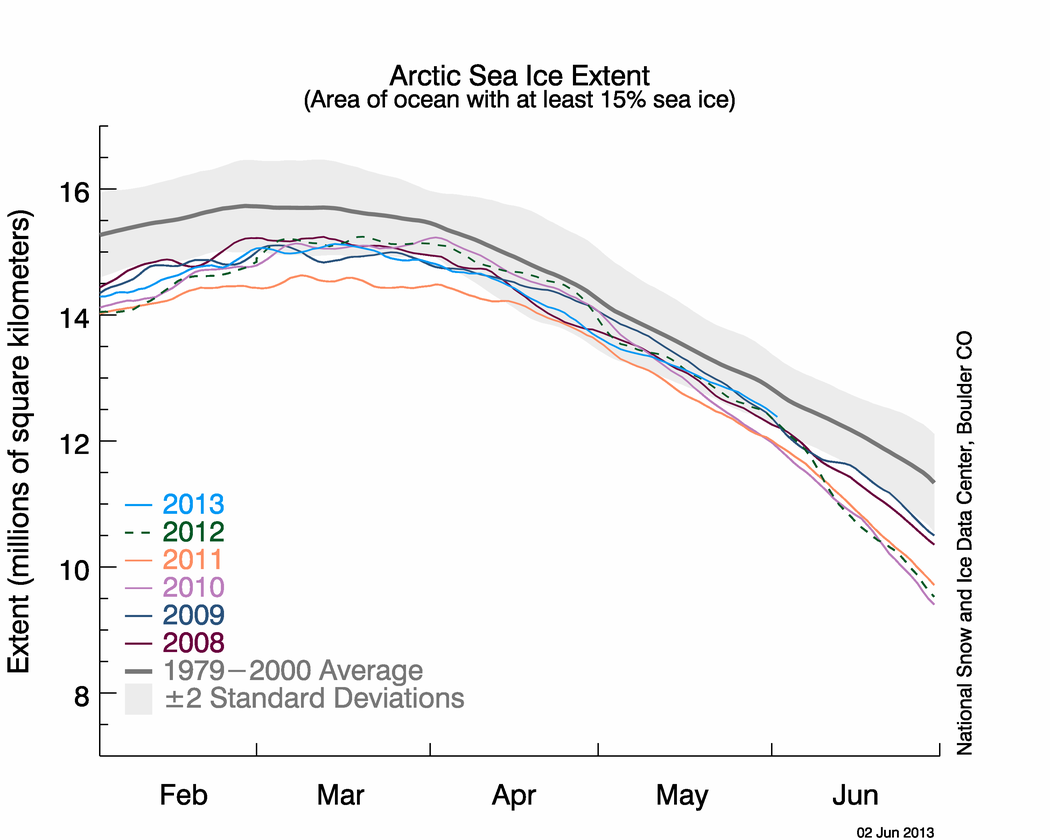
Conditions in context
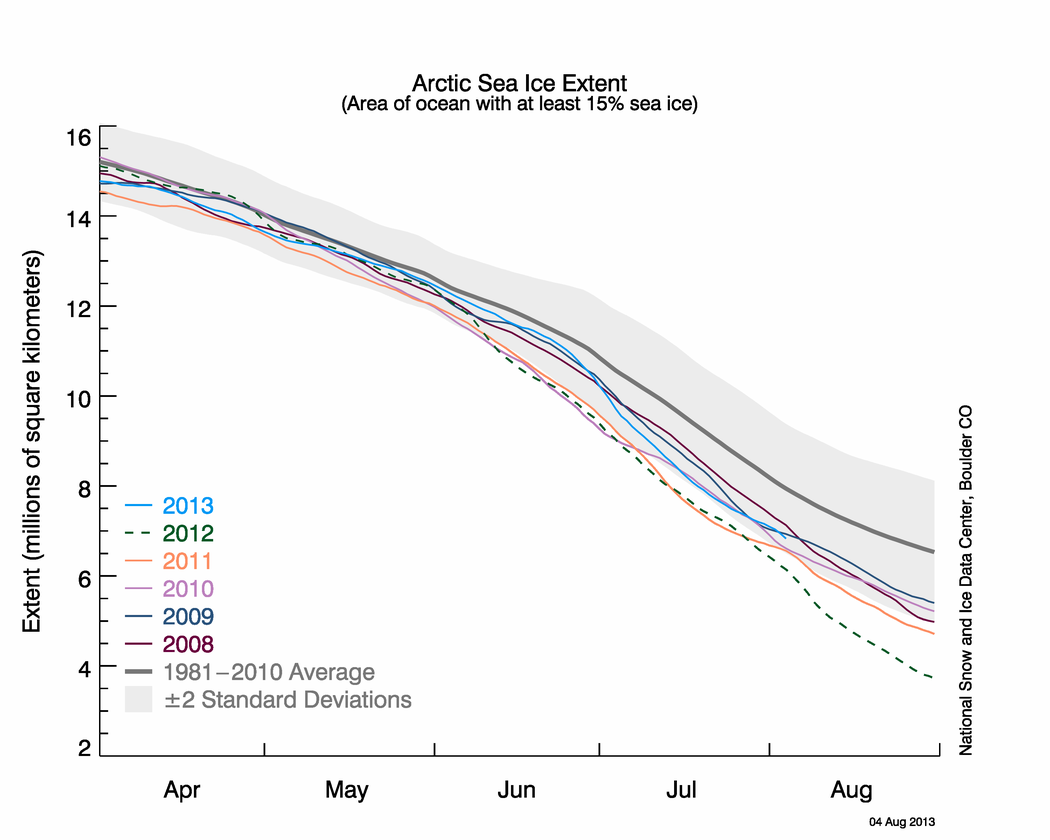
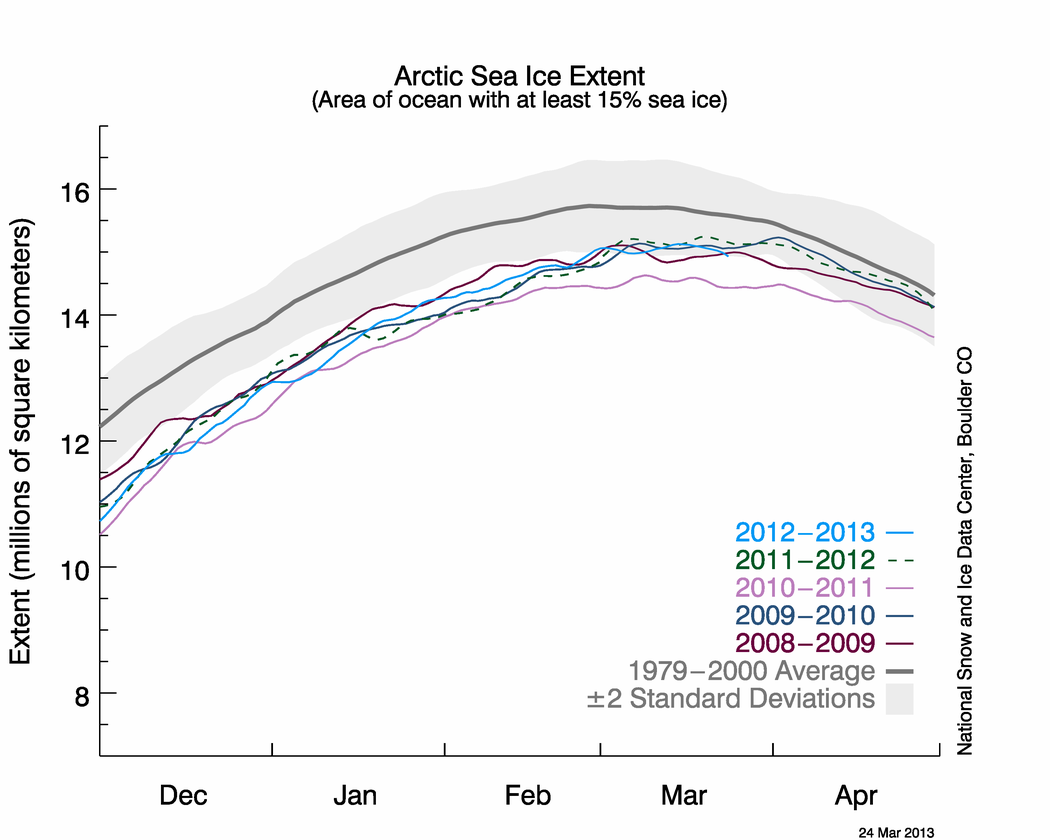
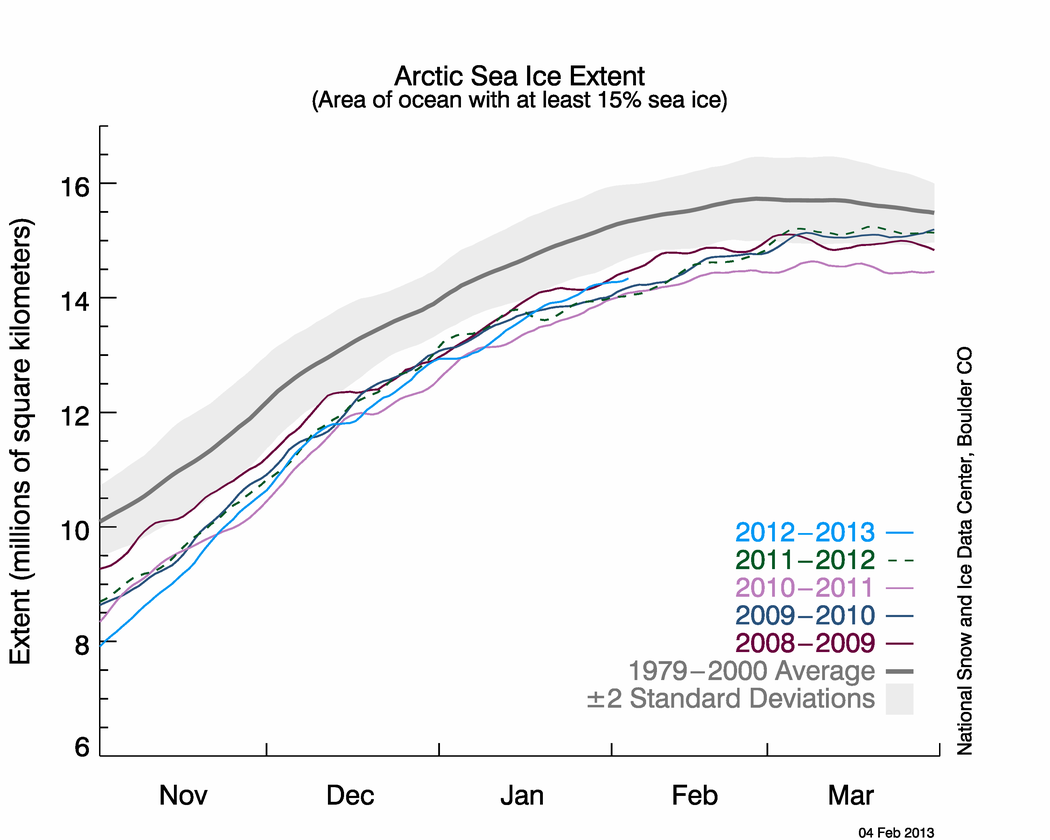
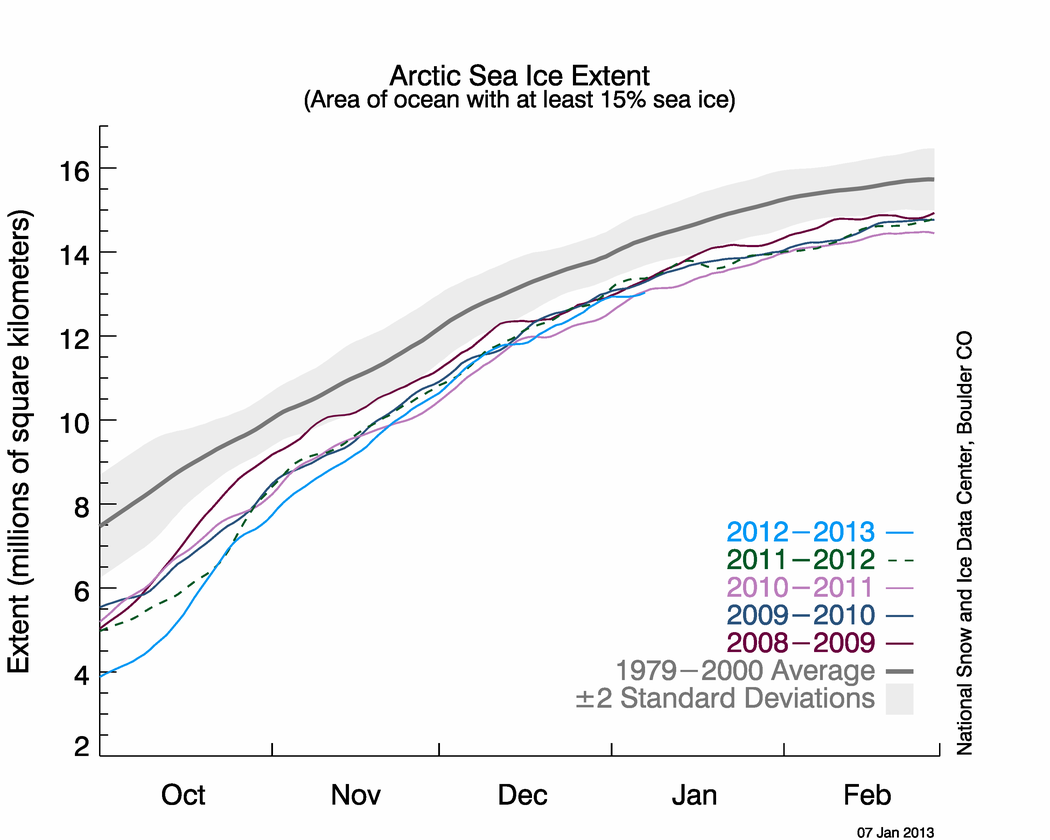
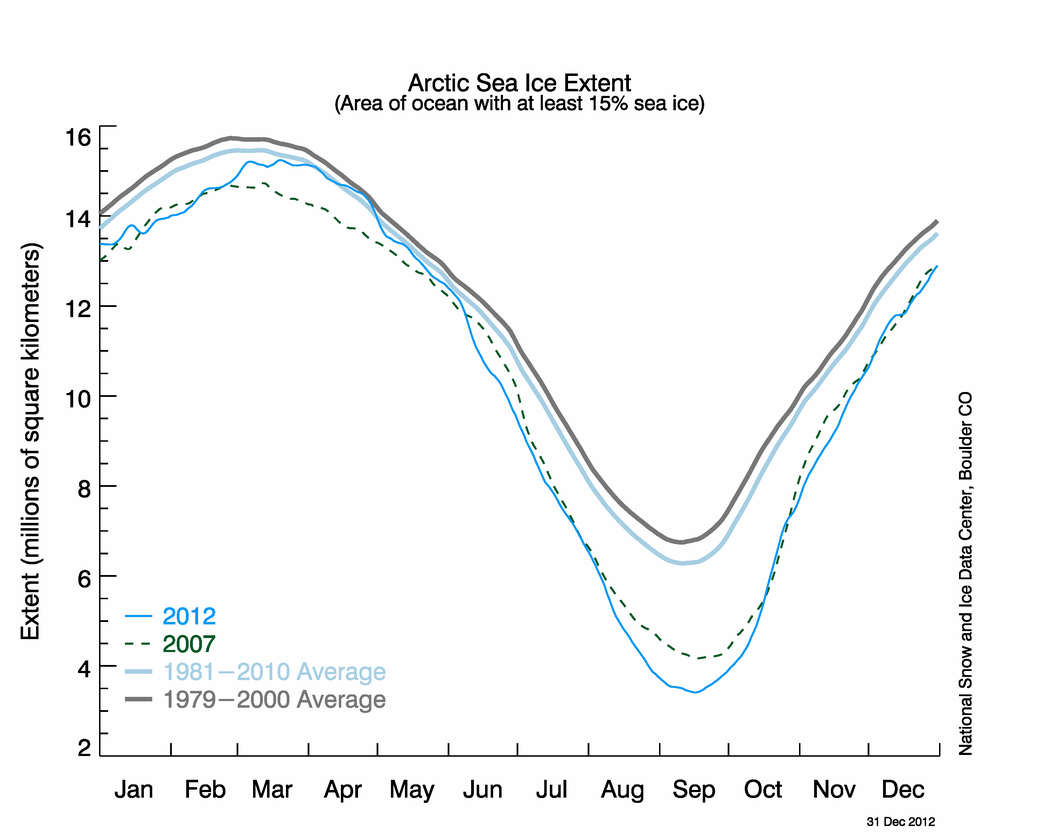
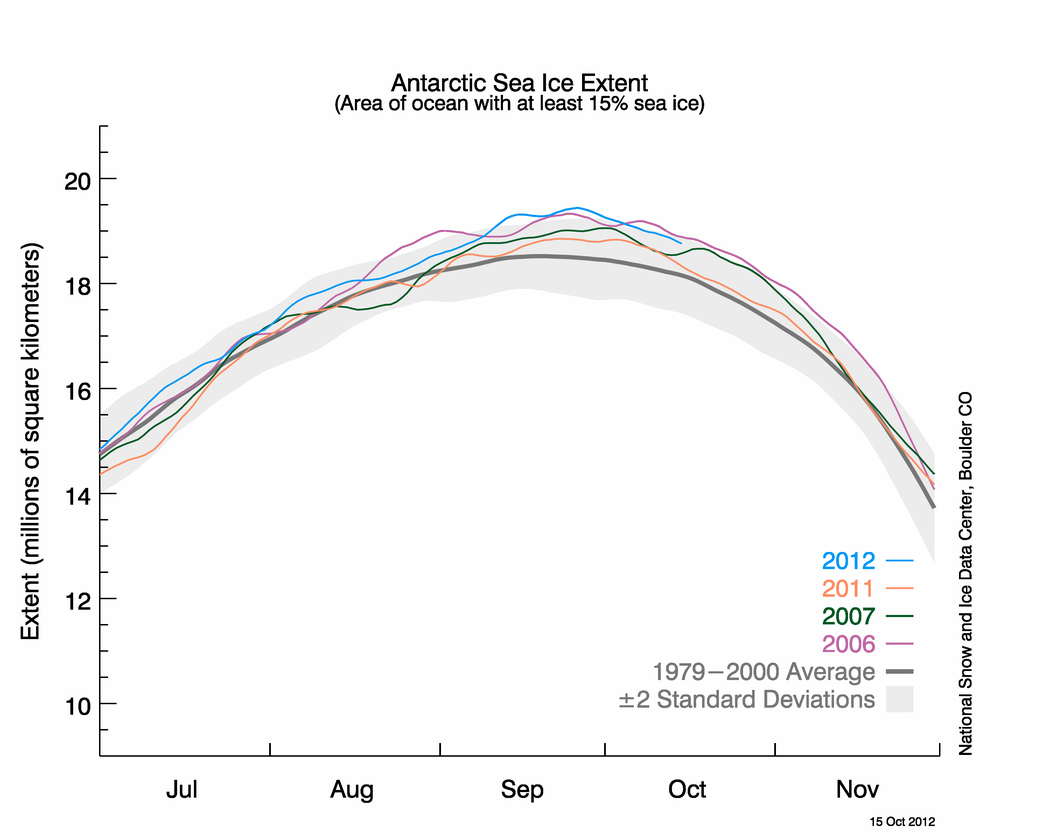
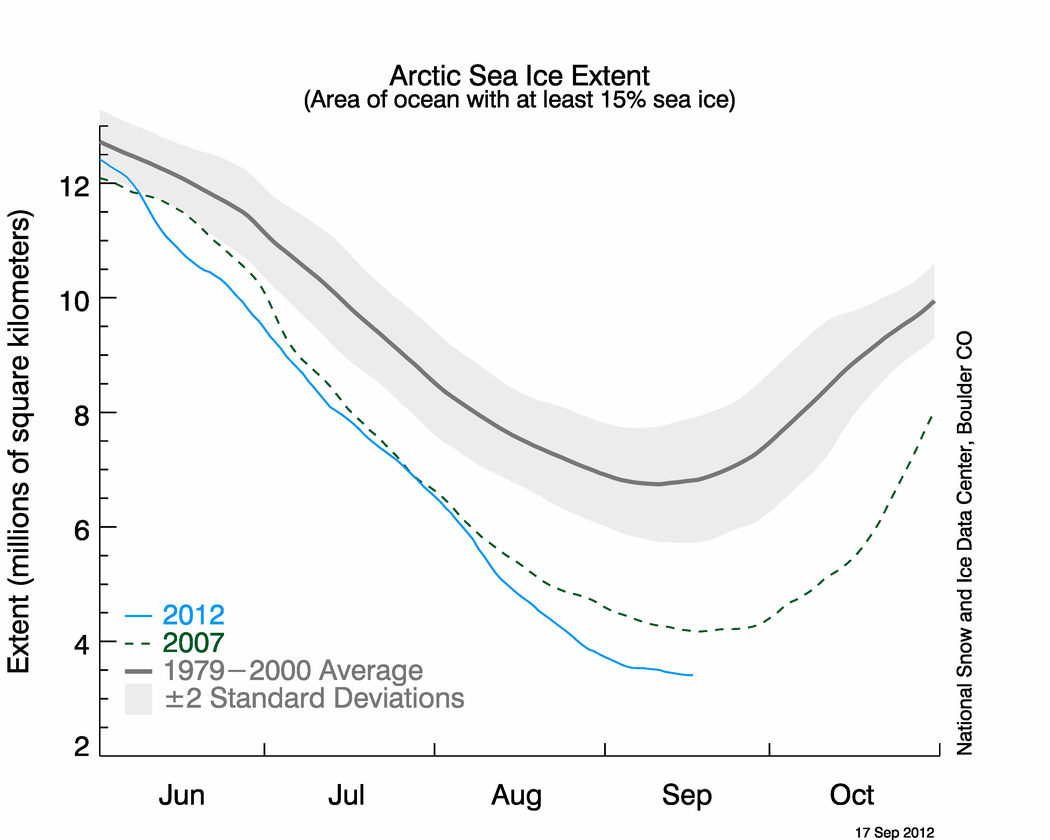
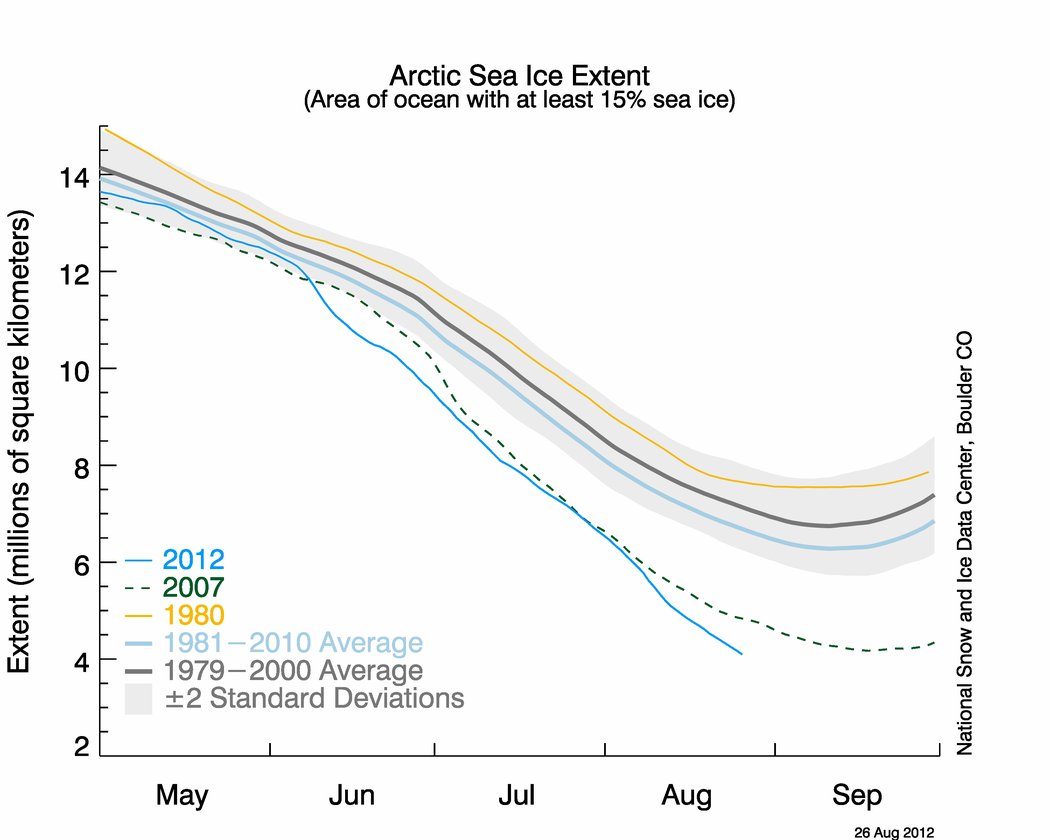
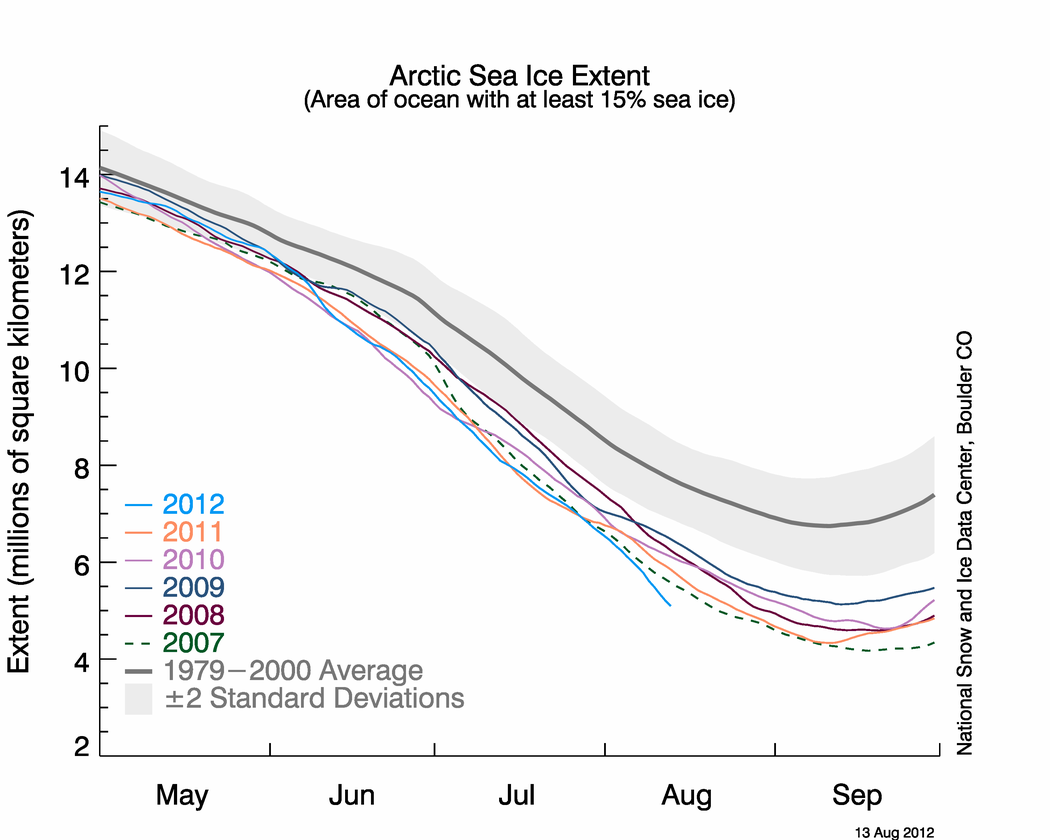
Figure 2. The graph above shows Arctic sea ice extent as of August 4, 2013, along with daily ice extent data for five previous years. 2013 is shown in blue, 2012 in green, 2011 in orange, 2010 in pink, 2009 in navy, and 2008 in purple. The 1981 to 2010 average is in dark gray. Sea Ice Index data.
Credit: National Snow and Ice Data Center
High-resolution image
While sea ice extent retreated rapidly through the first two weeks of July when the weather was dominated by high pressure and clockwise winds over the central Arctic Ocean, the pace of ice loss for the last half of the month was slower. This was partly due to the return of a stormy pattern that brought more counterclockwise winds and cool conditions, and spread the ice out. This spreading of the ice, or ice divergence, can result in more dark open water areas between individual floes that enhance absorption of the sun’s energy, leading to more lateral and basal melting. However, the effects of cooler conditions and ice divergence on the overall ice extent depend in part on the thickness of the ice. Historically, stormy summers tended to end up with more ice than summers characterized by high pressure and few storms. As the ice cover has thinned, stormy conditions may actually help to remove more ice.
July 2013 compared to previous years
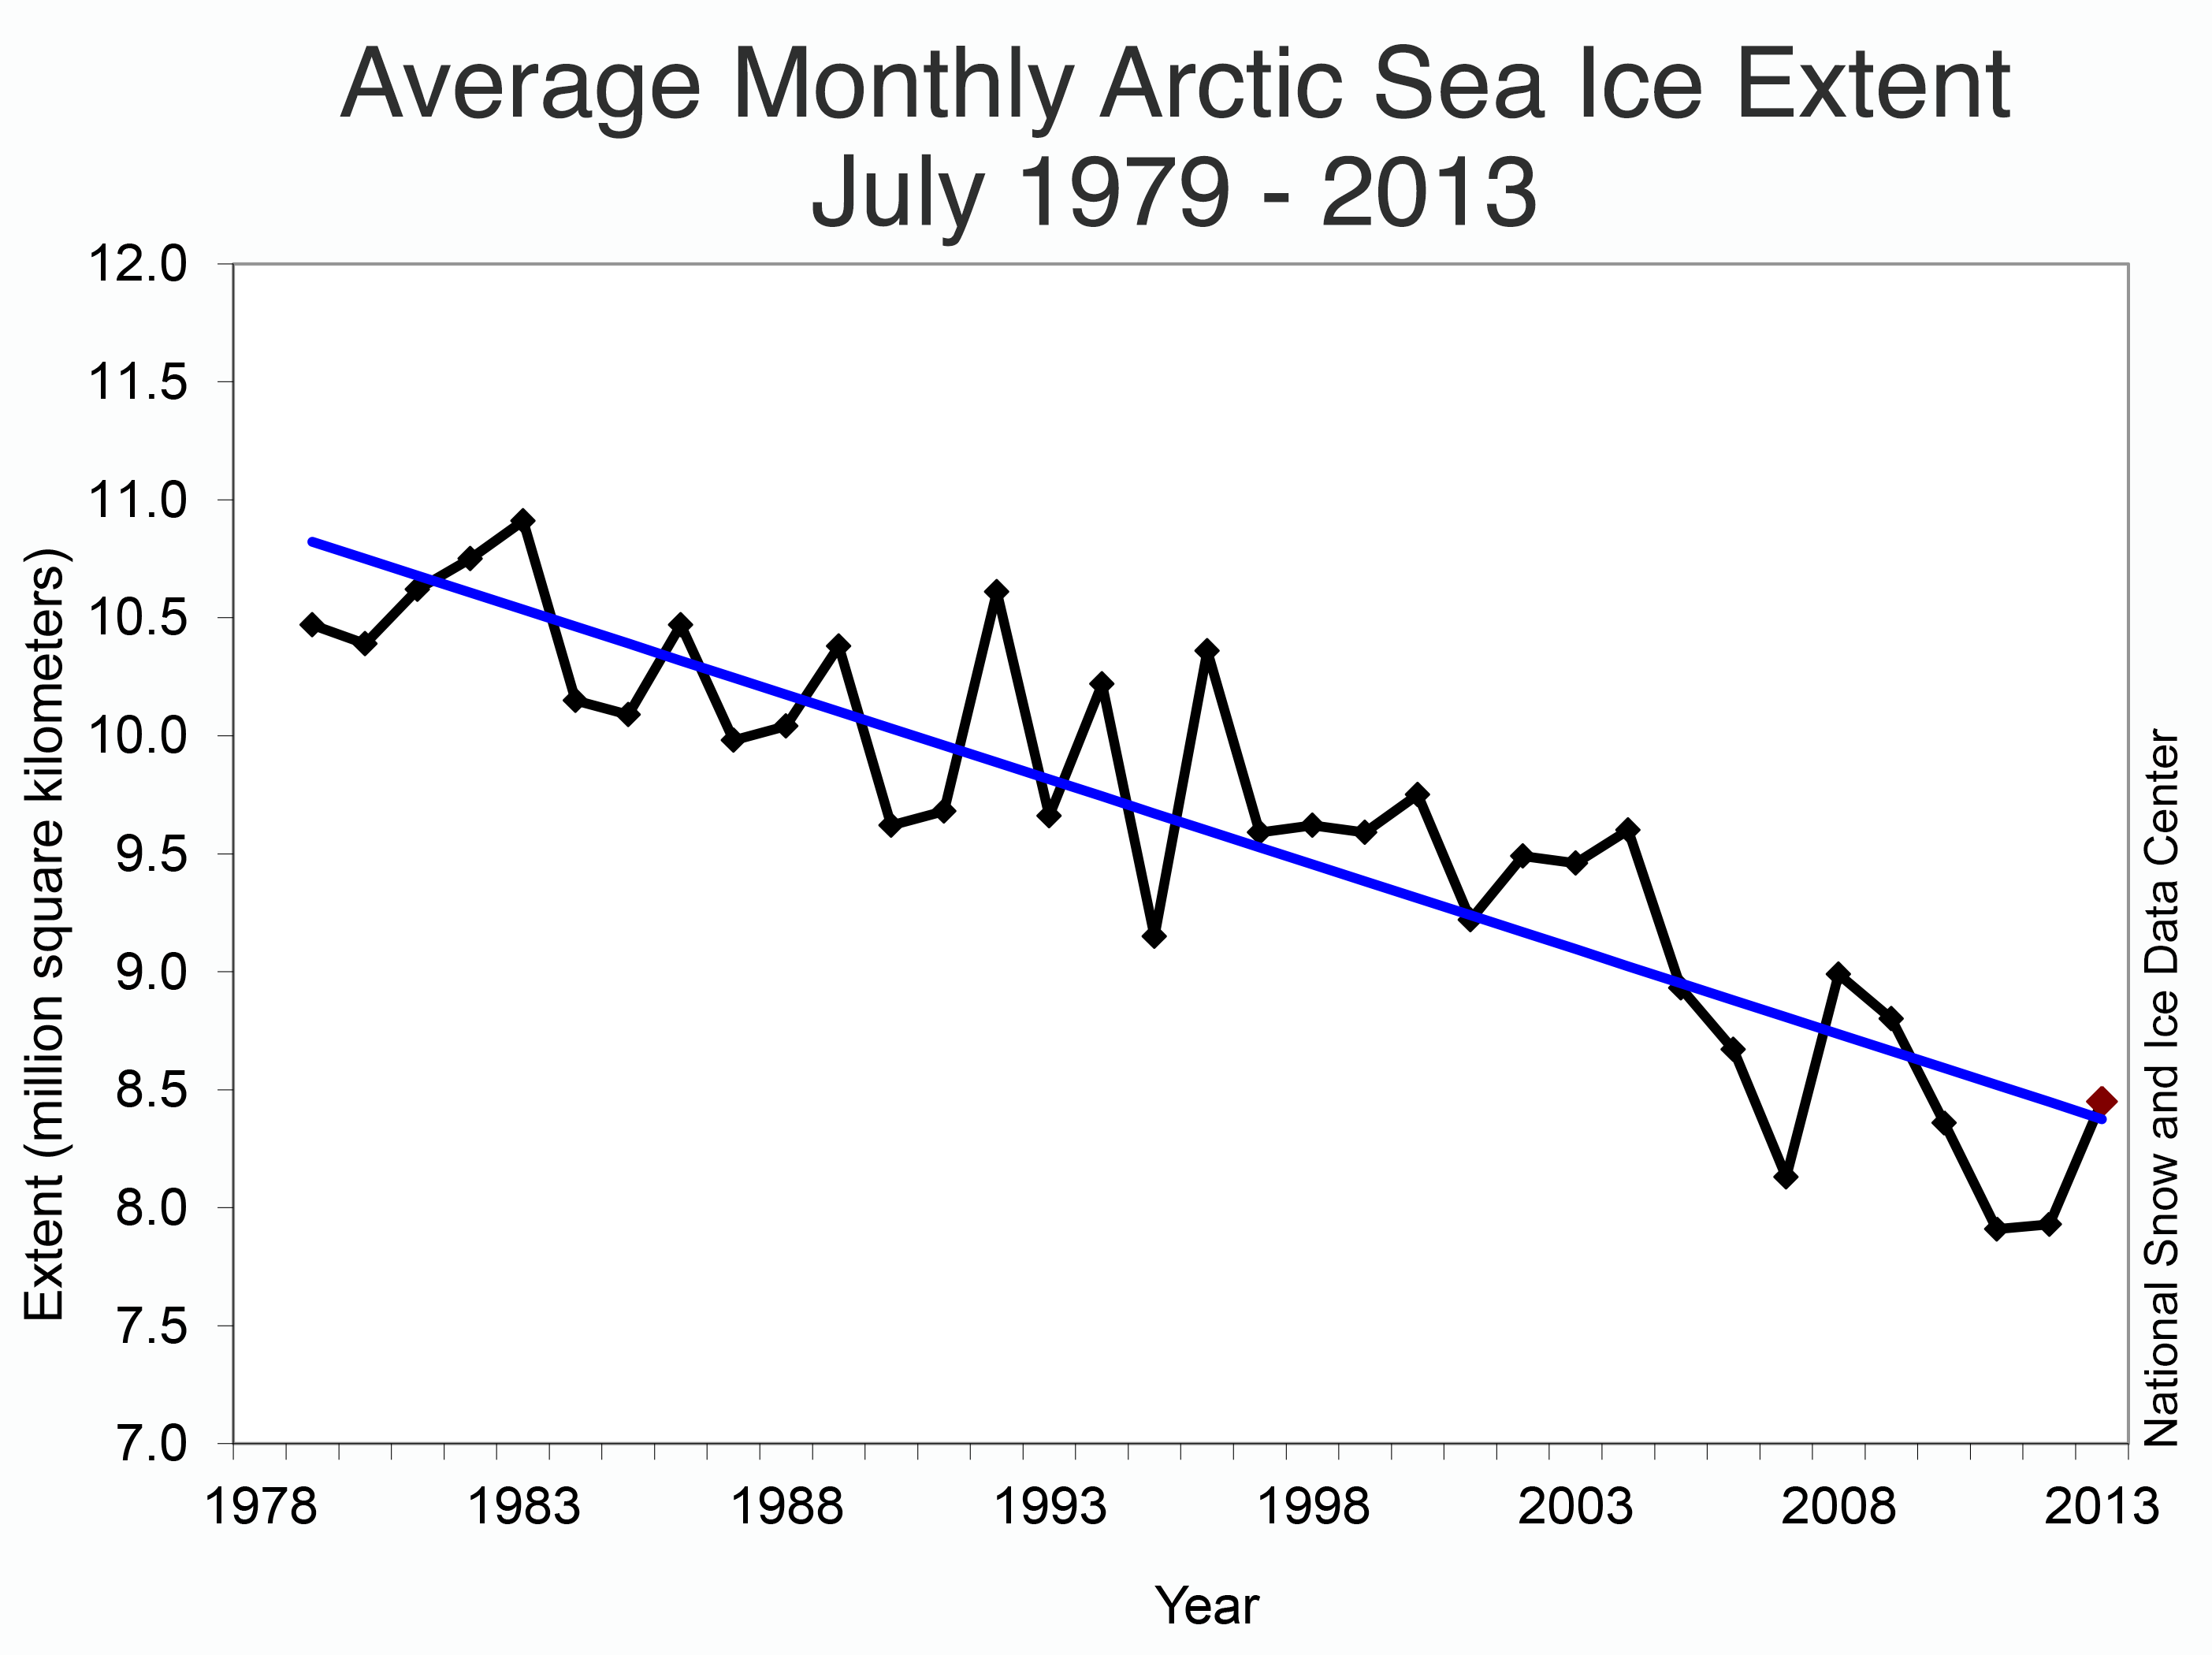
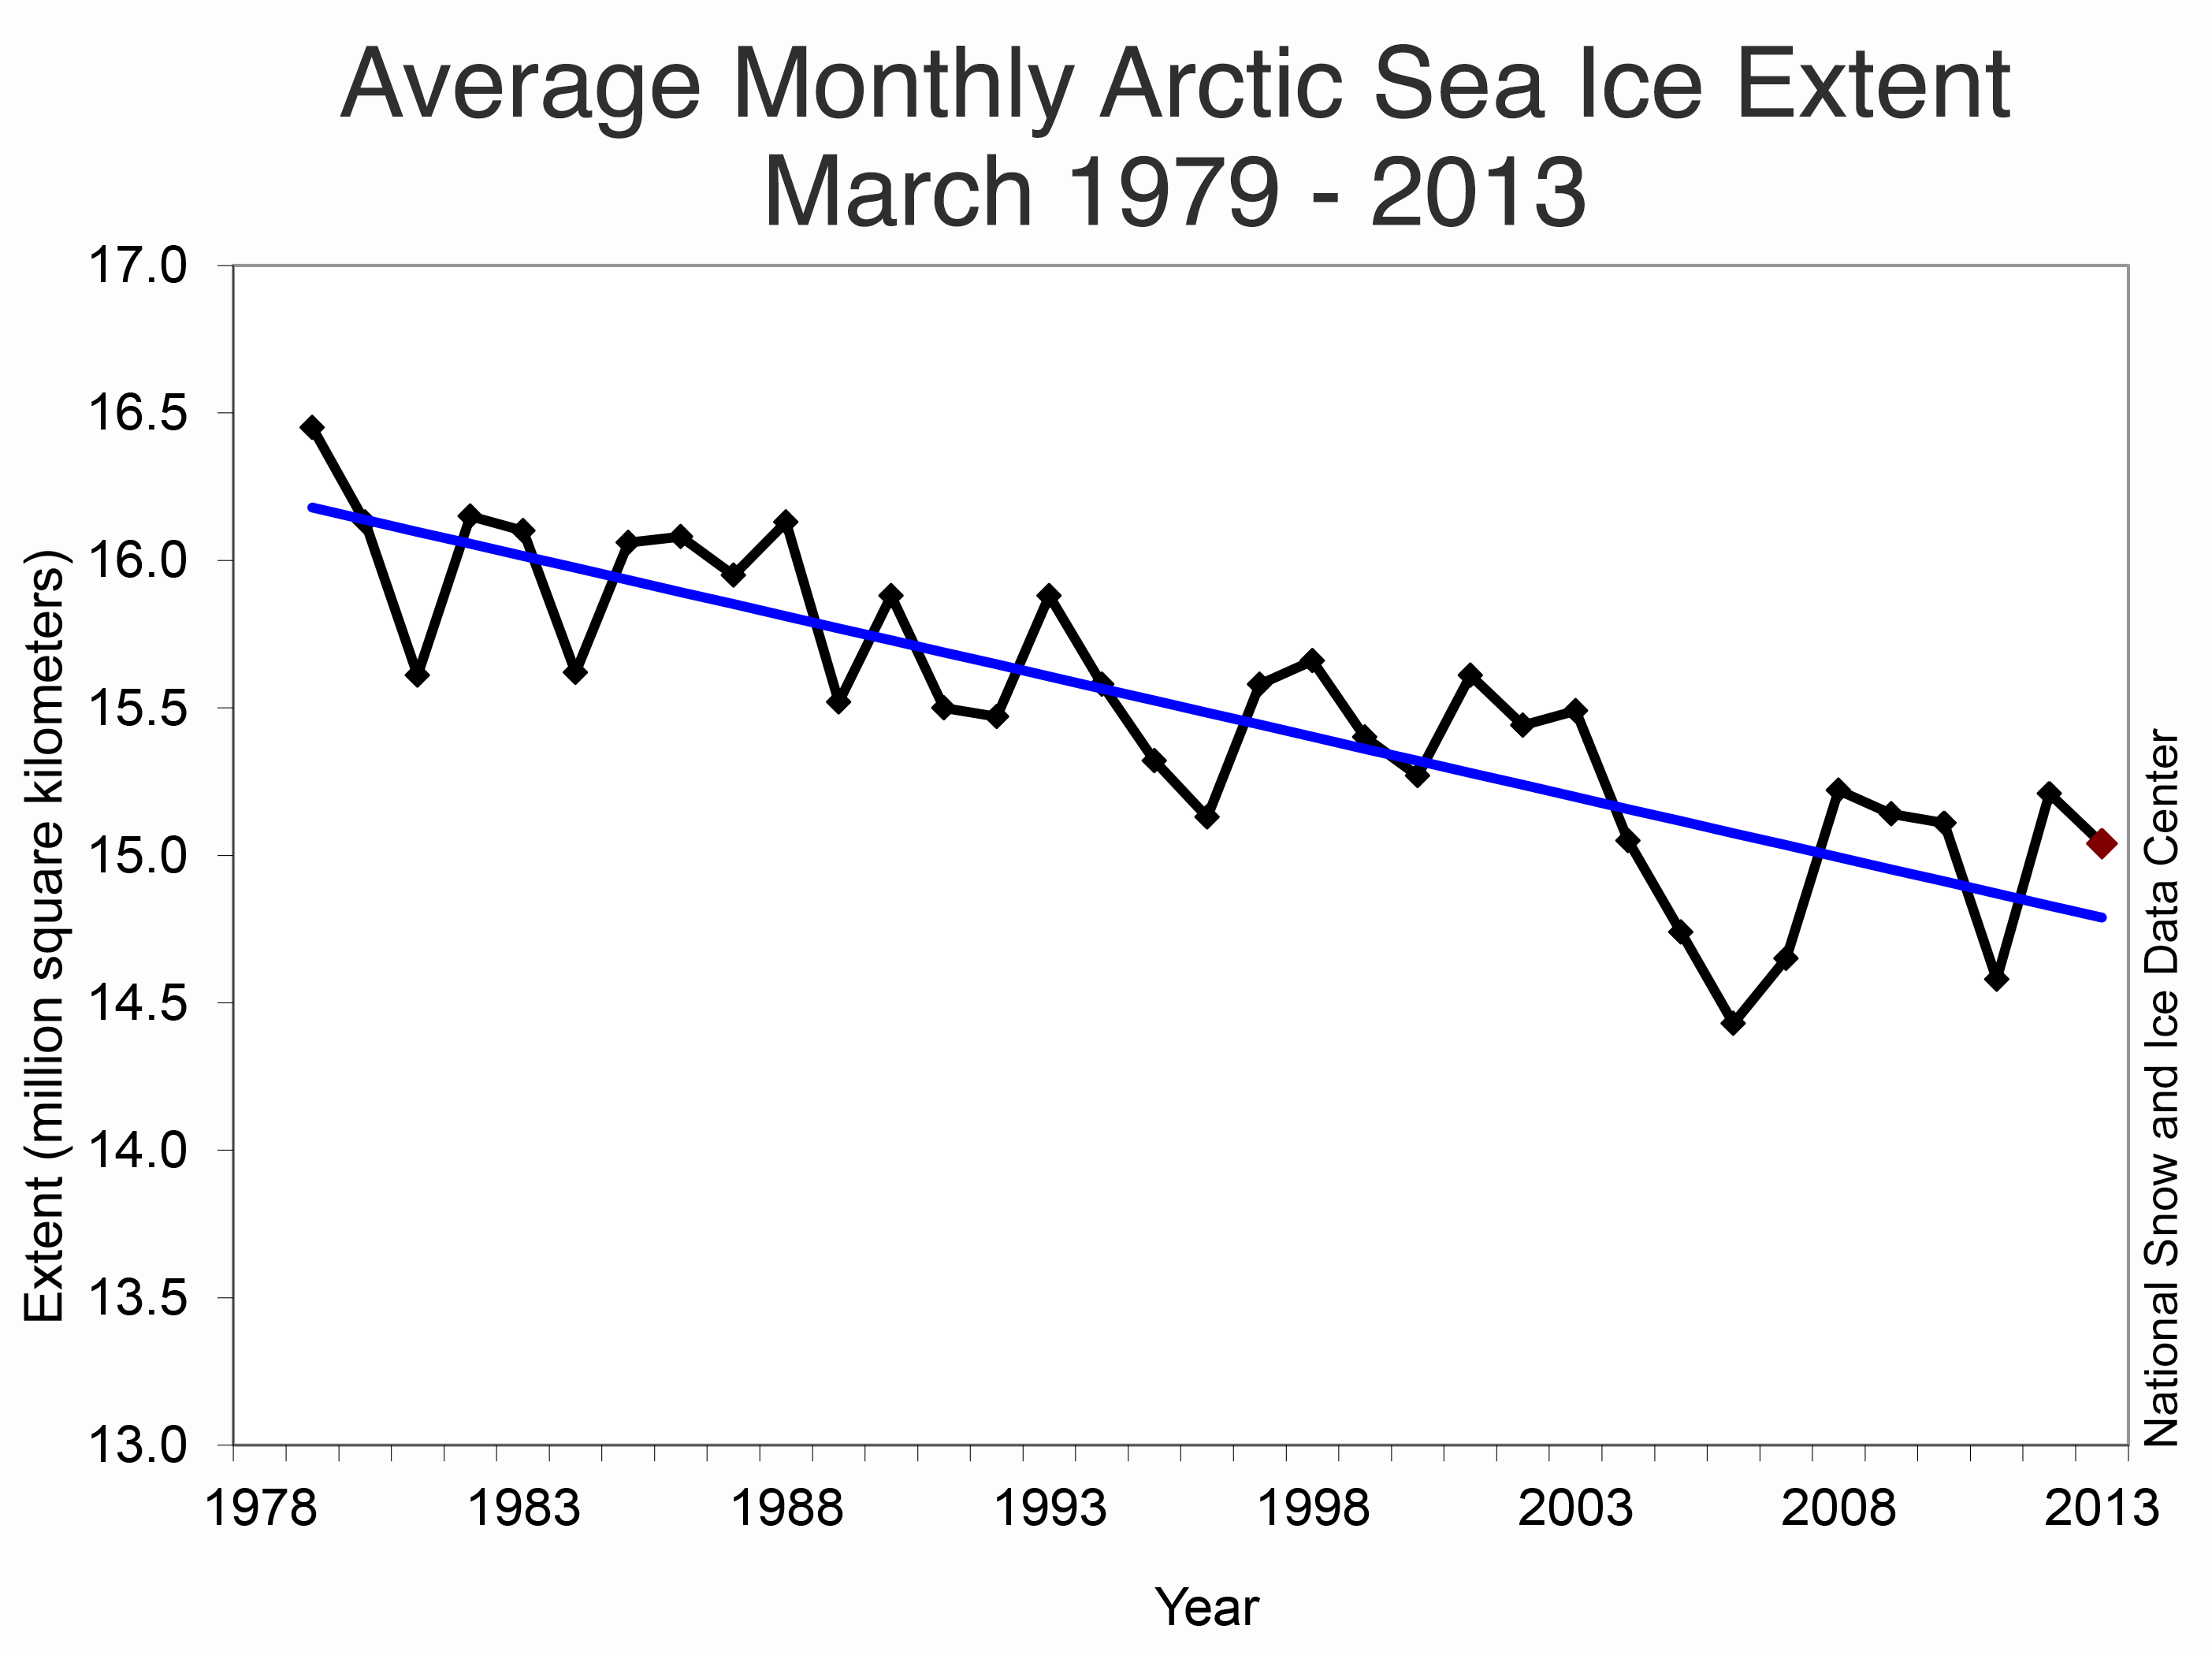
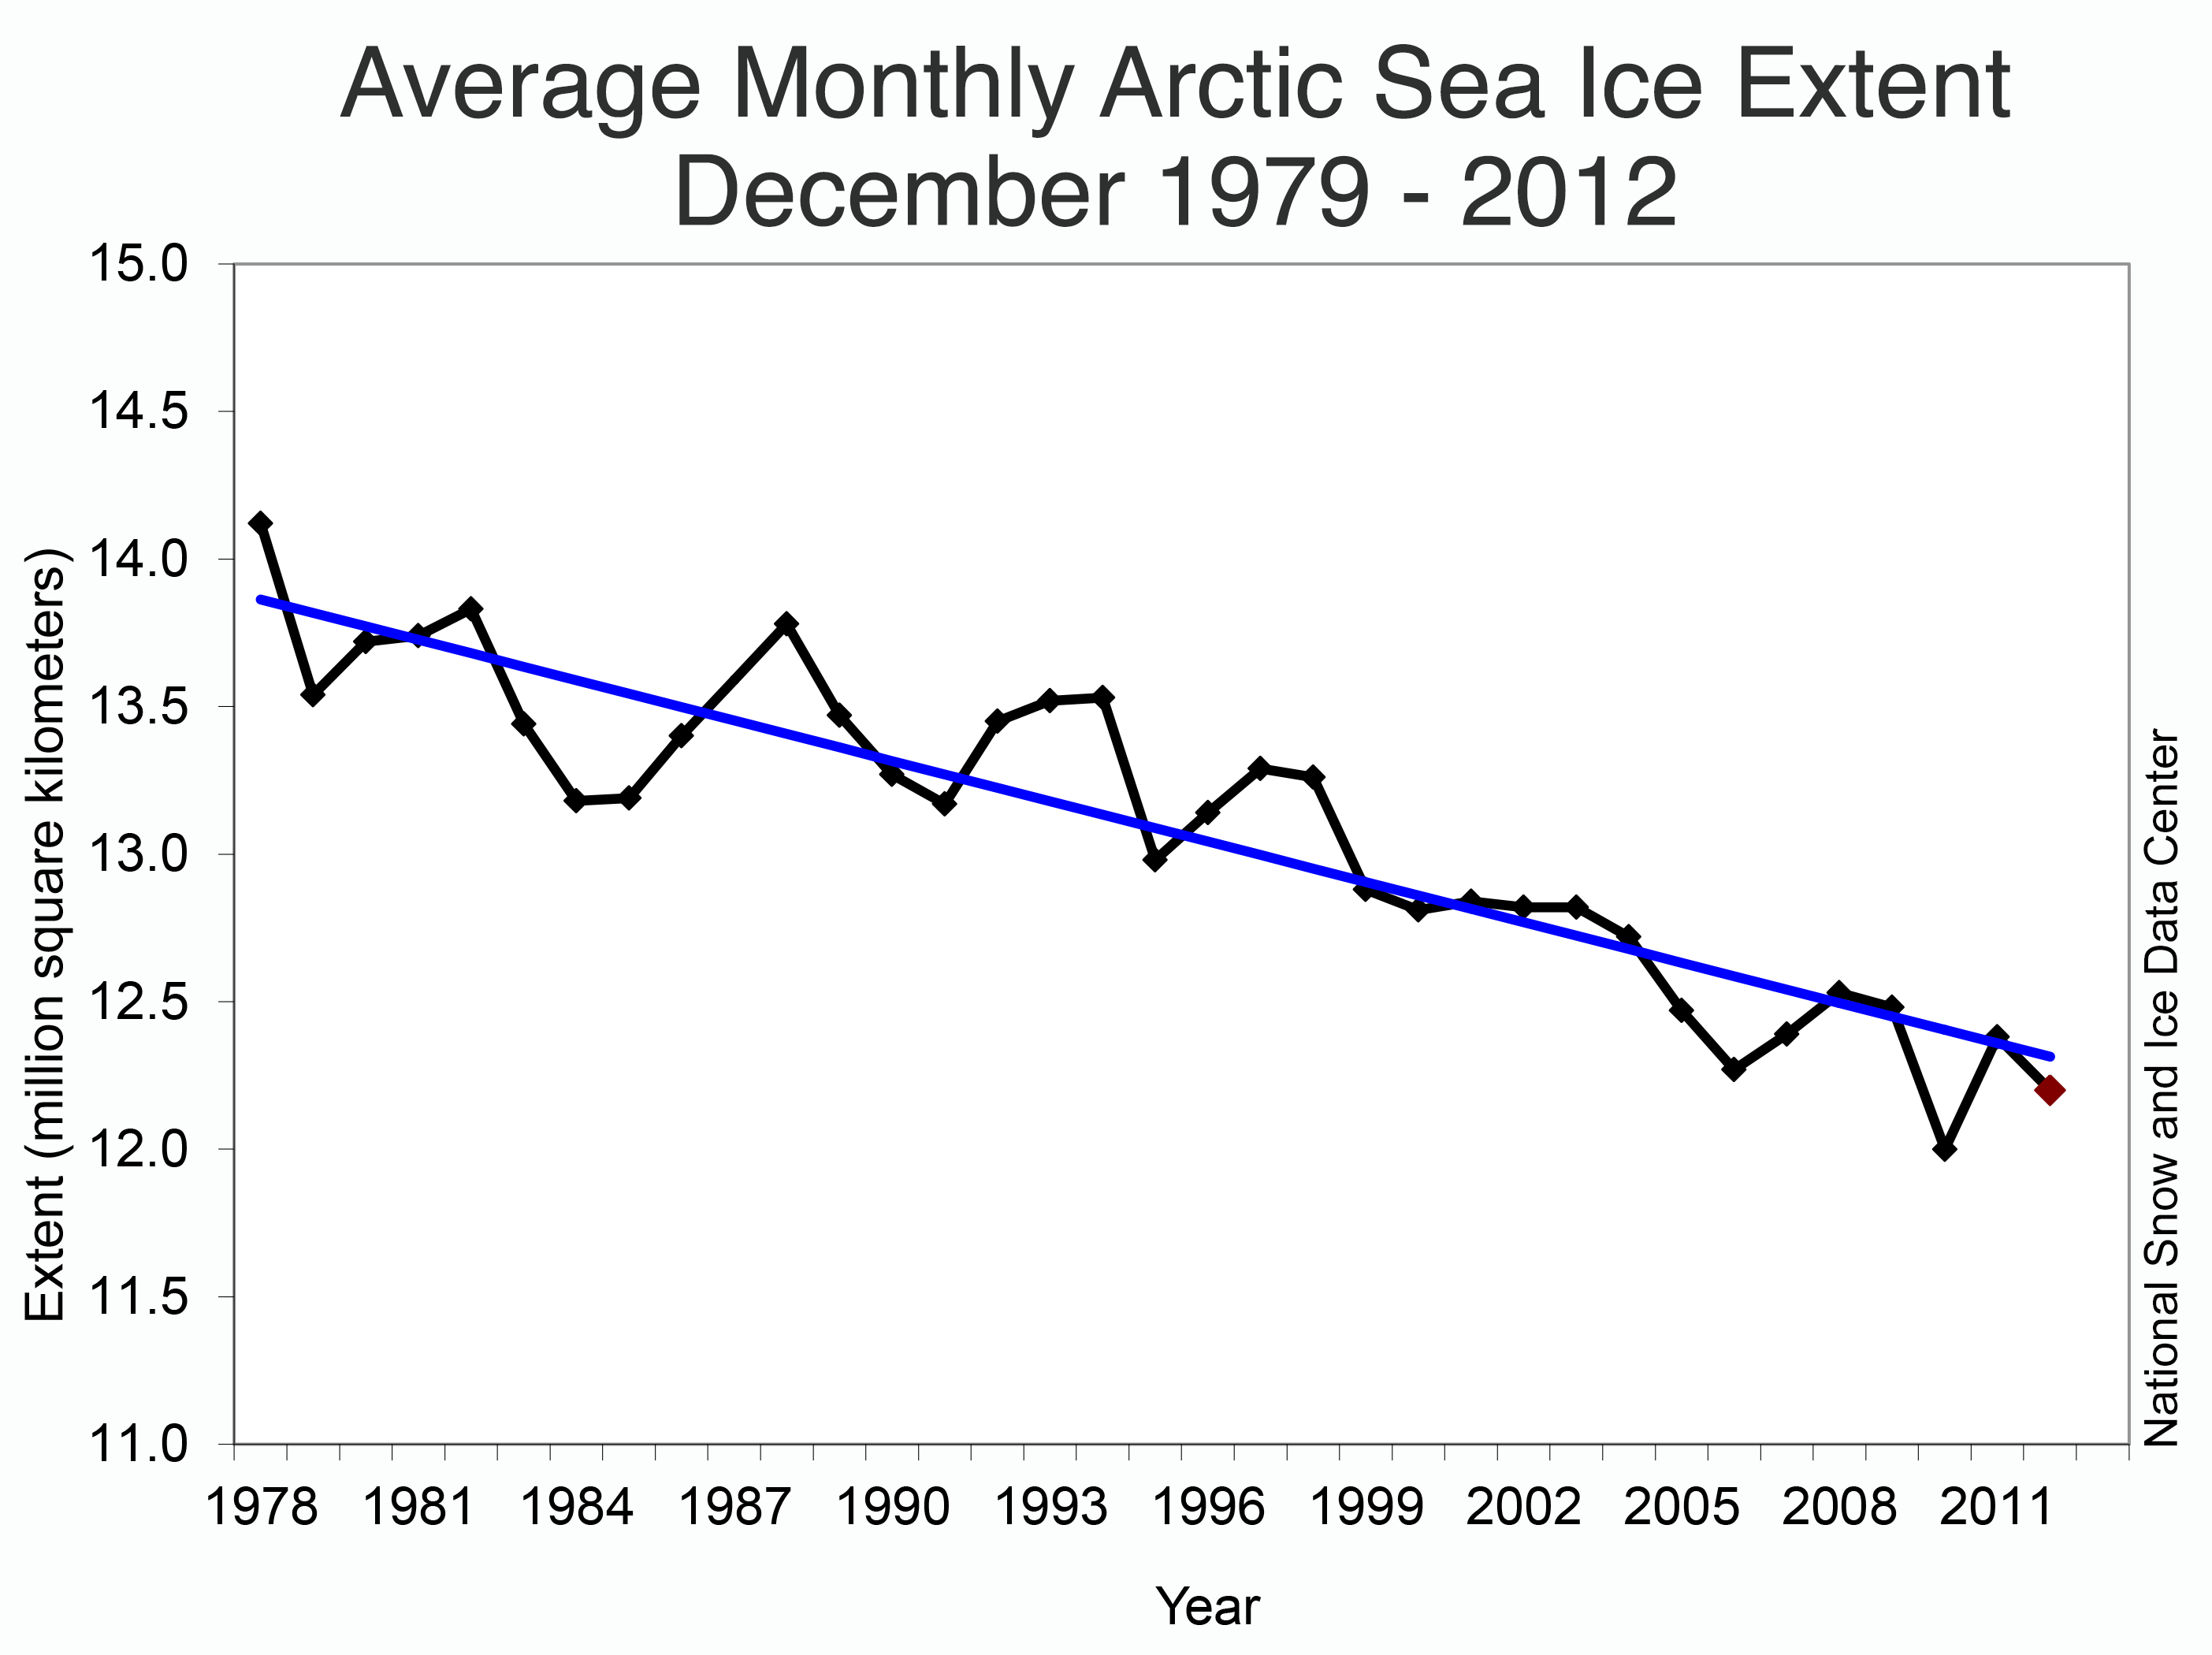
Figure 3. Monthly July ice extent for 1979 to 2013 shows a decline of 7.4% per decade relative to the 1981 to 2010 average.
Credit: National Snow and Ice Data Center
High-resolution image
Overall, extent dropped an average of 105,000 square kilometers (41,000 square miles) per day through the month, the second fastest July ice loss in the satellite record after 2007, and much higher than the 1981 to 2010 average. However, this number averages the rapid ice loss during the first half of the month with the slower loss during the second half of the month. July 2013 was the fifth lowest July in the 1979 to 2013 satellite record, and 540,000 square kilometers (208,000 square miles) above the record low in 2011. The monthly trend is ‑7.4% per decade relative to the 1981 to 2010 average (also ‑7.1% per decade relative to the old 1979 to 2000 baseline).
Summer storms
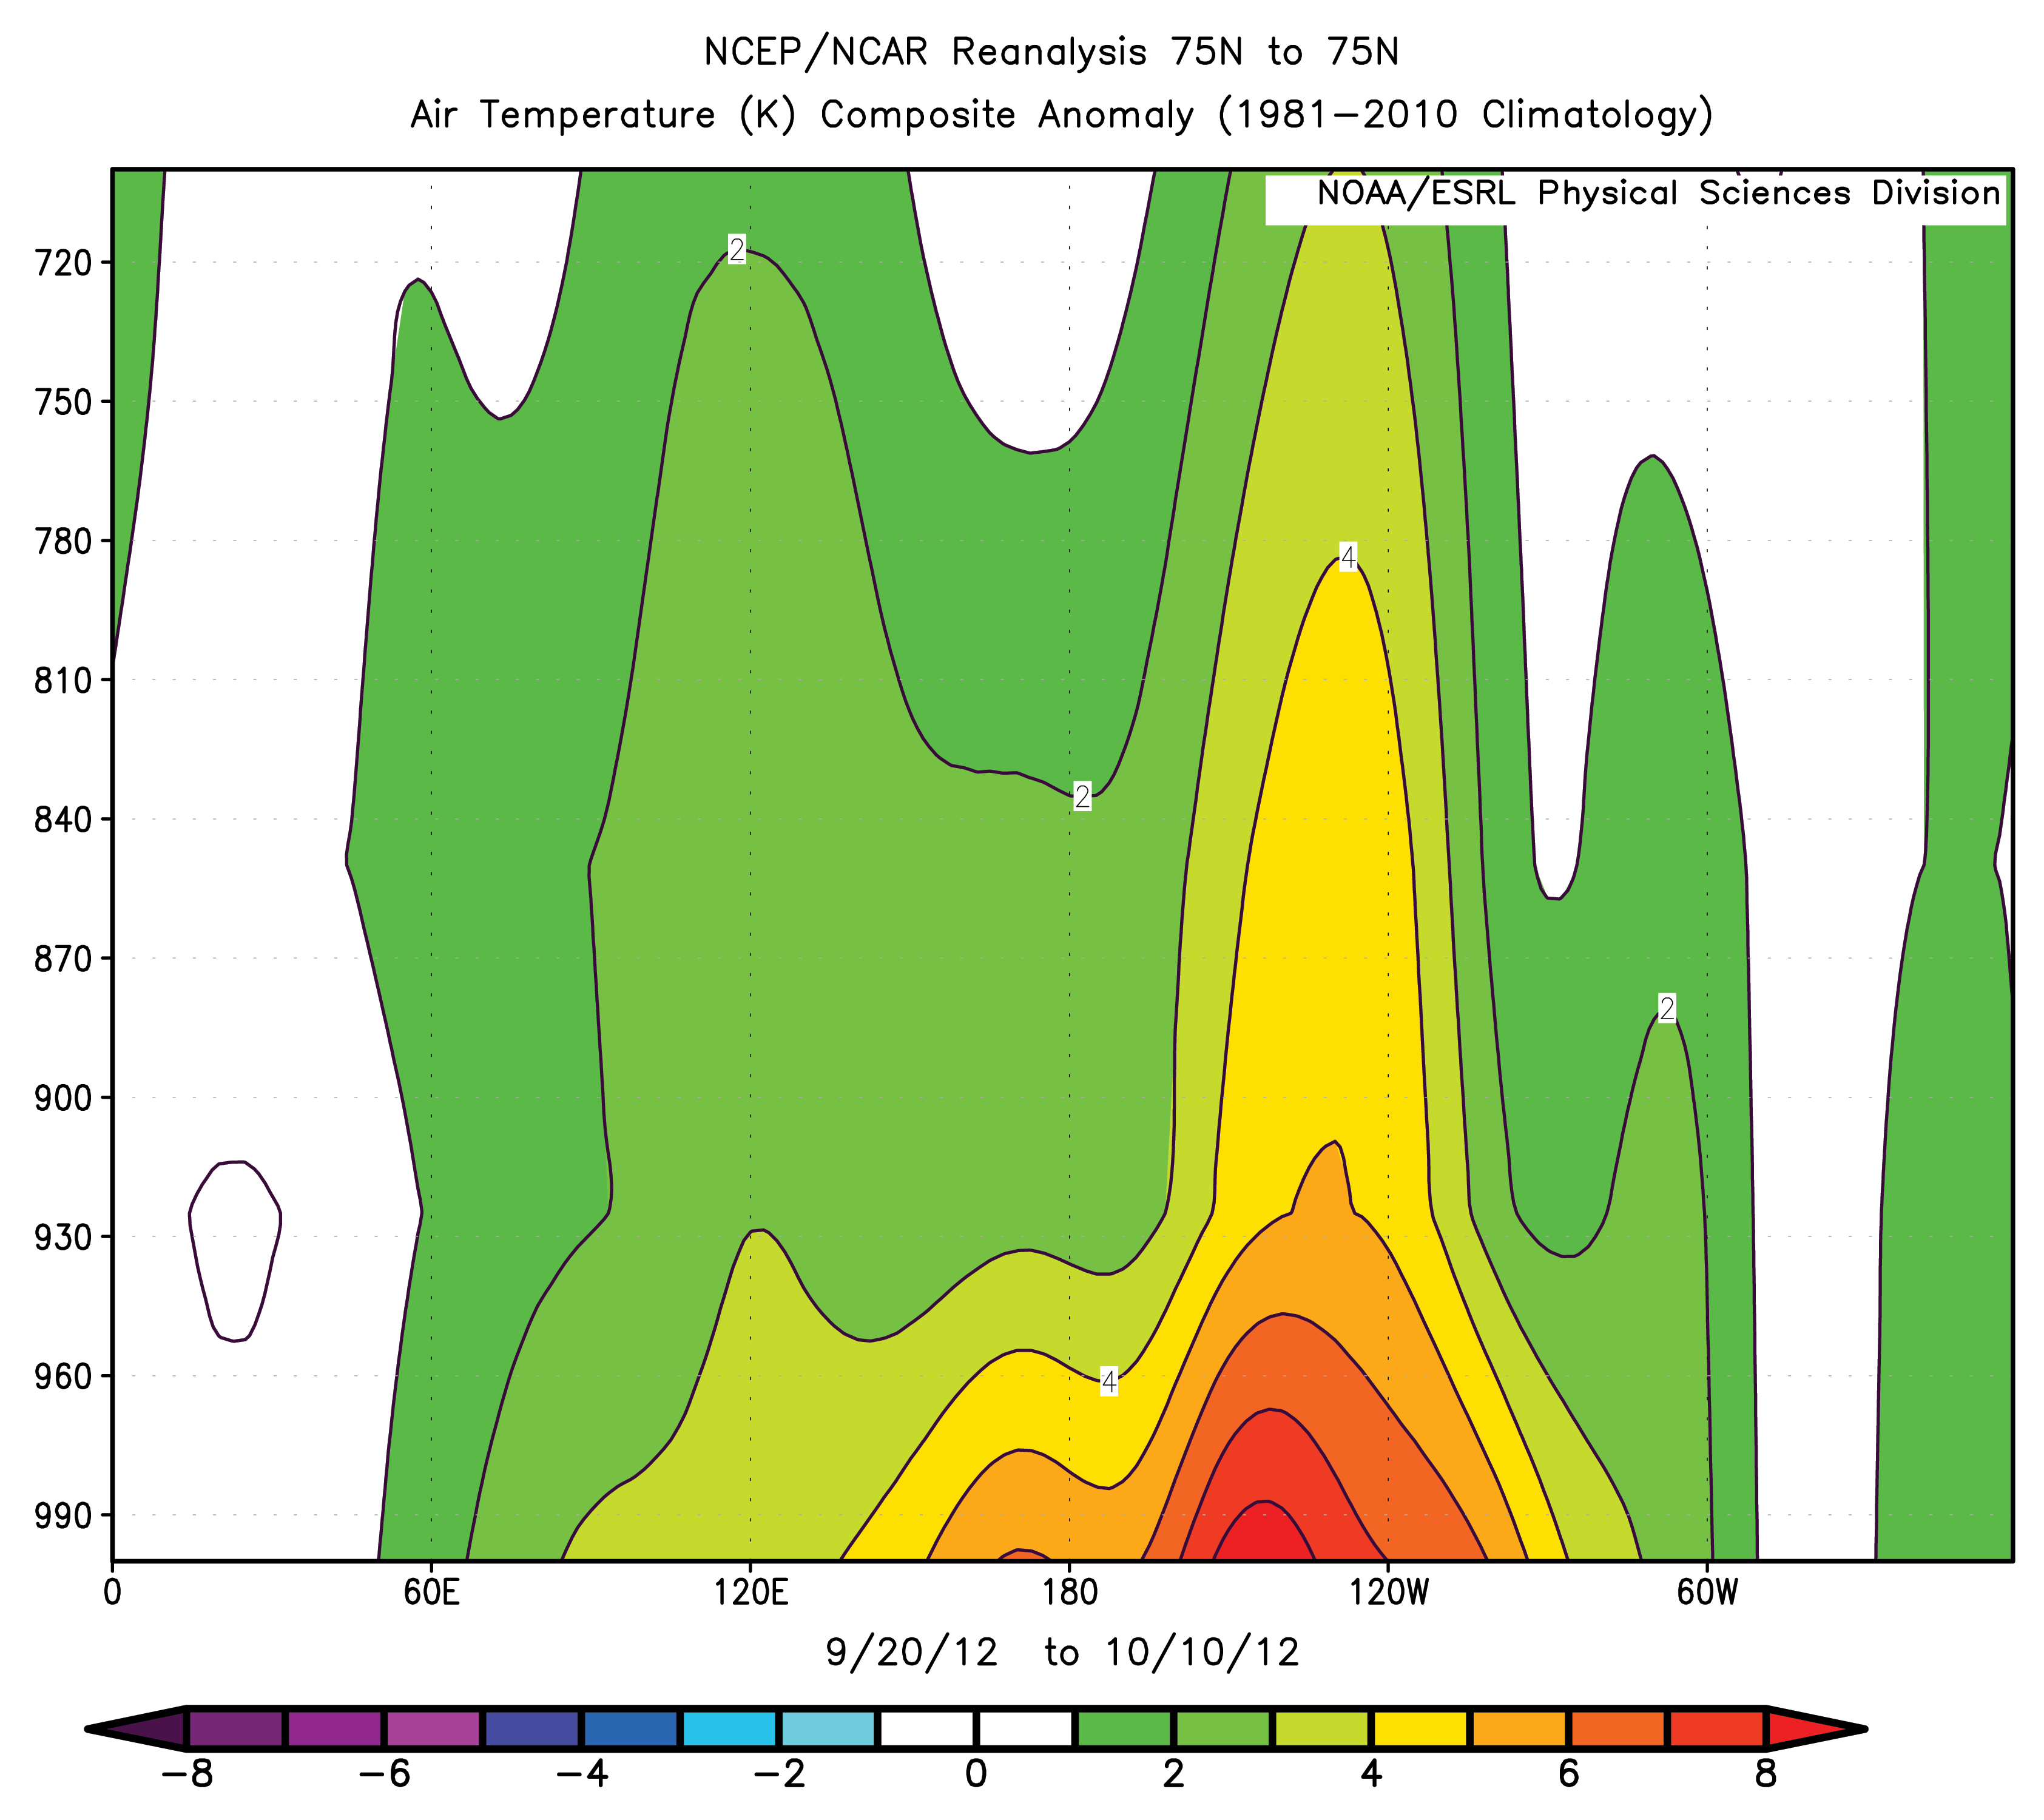
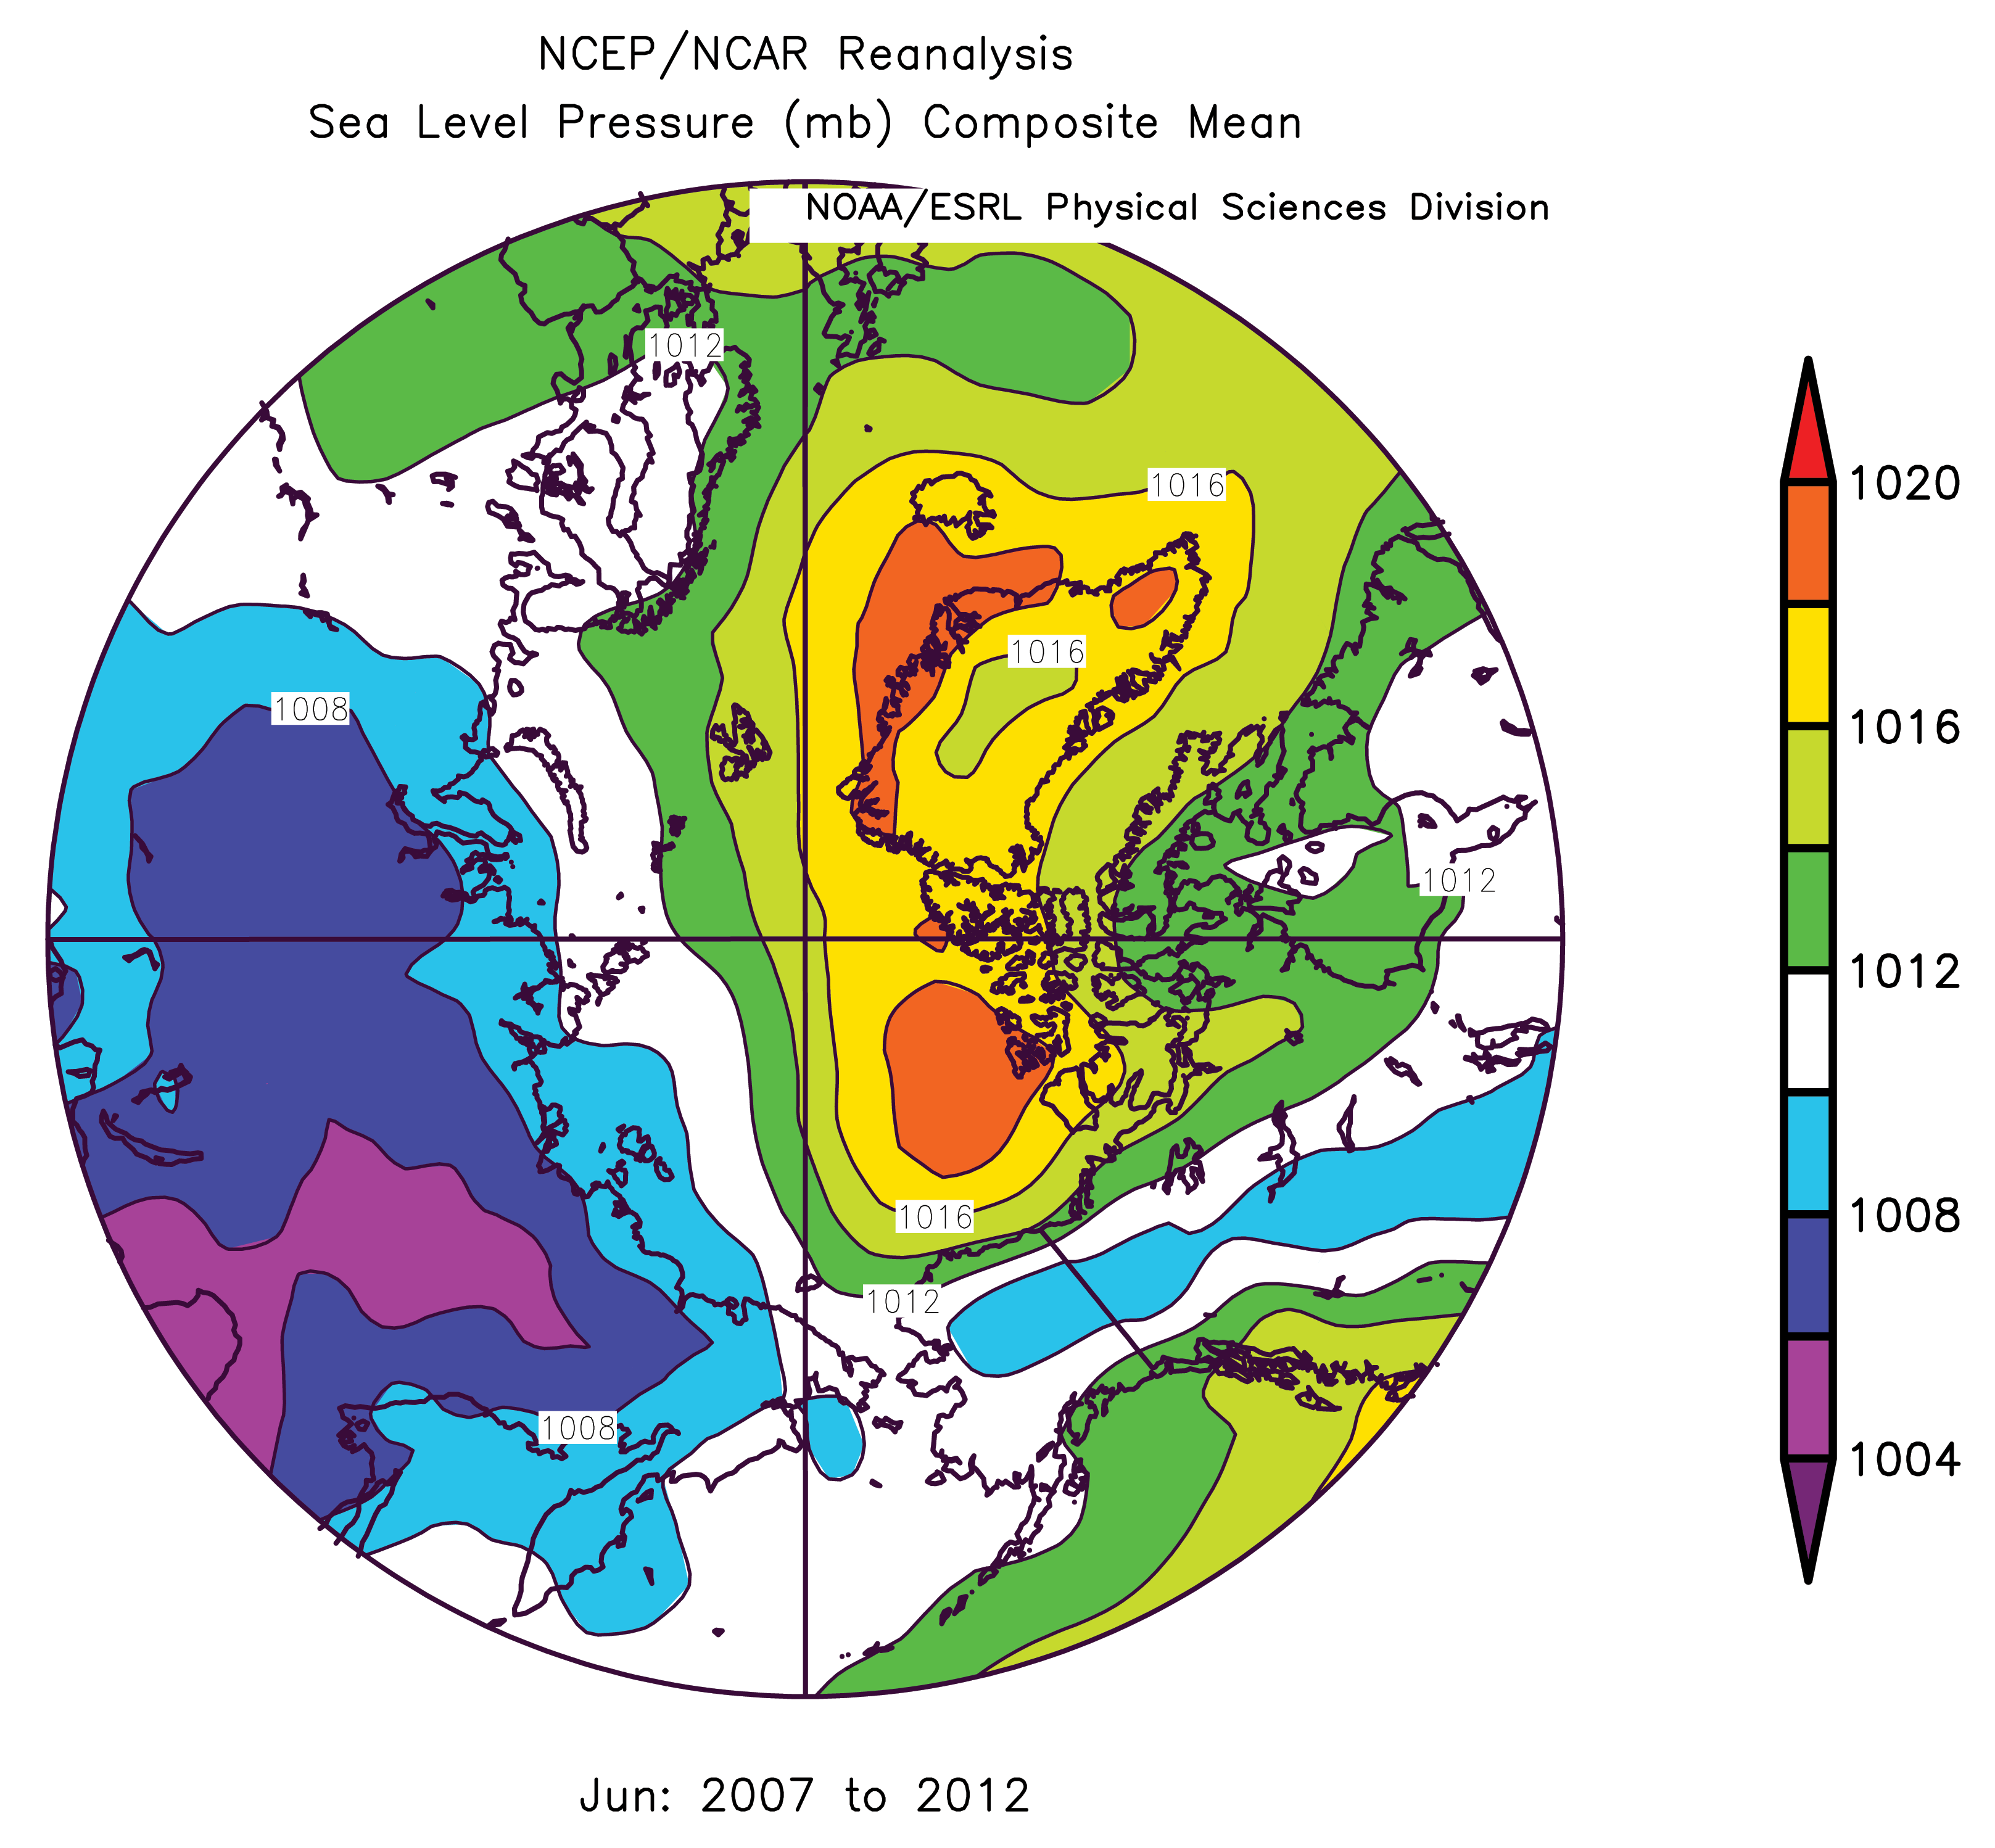
Summer is the stormiest season over the central Arctic Ocean, but the situation can vary greatly within a month (as has been the case for July 2013), from month to month, and year to year. The summer storms in this region can occasionally be quite strong and there has been some discussion that, like hurricanes, strong Arctic storms should be named, perhaps drawing on the Inuit language. Last August, a cyclone in the region attained a central pressure as low as 964 hPa, with attendant strong winds. As just discussed, summers characterized by stormy conditions tend to end up with more sea ice than summers characterized by high pressure. However, the effects of an individual strong storm can be complex. It appears that the August 2012 storm was attended by a modest acceleration in the pace of summer ice loss. While the middle of July 2013 also saw a storm over the central Arctic Ocean with a central pressure of 977 hPa, this year’s event has not led to a strong ice loss.
A note on melt ponds
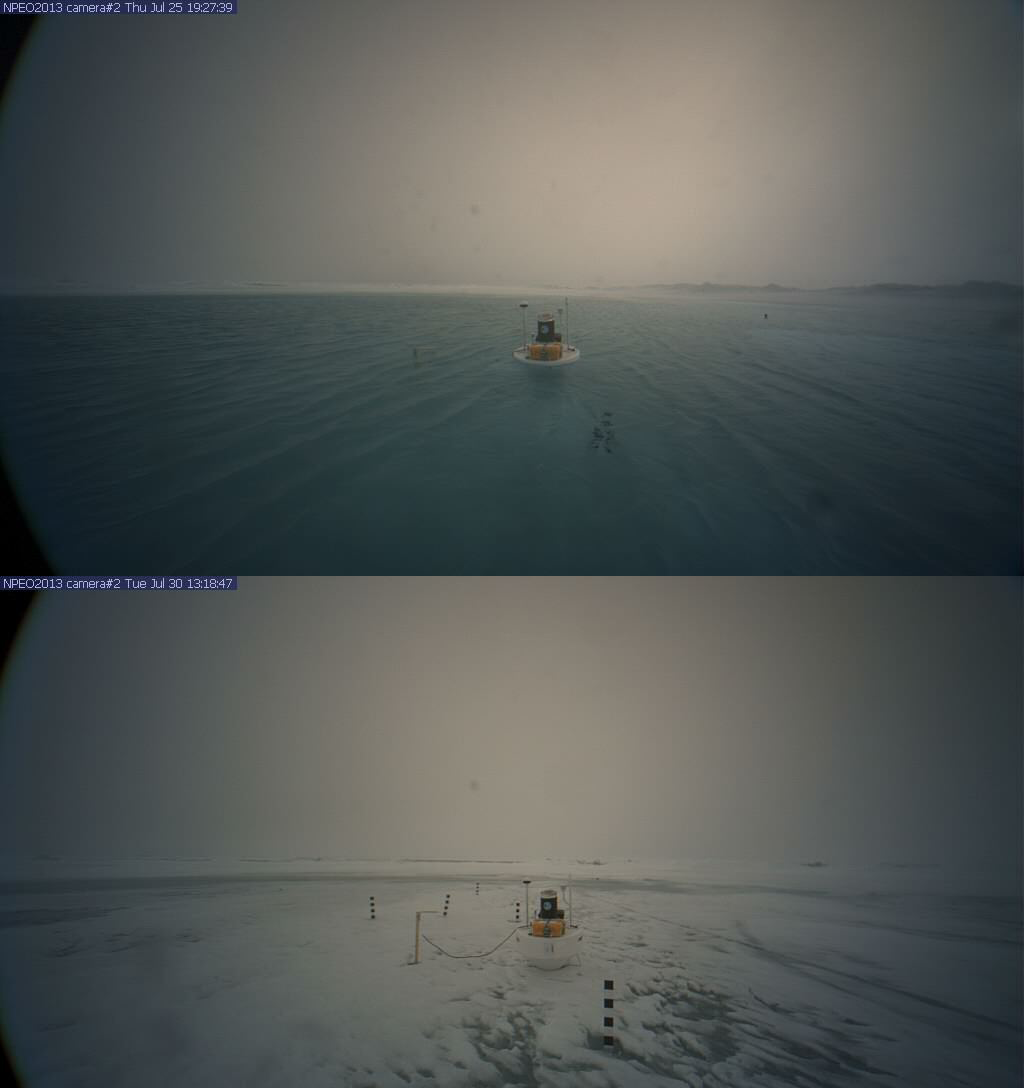
Figure 4. These comparison images show the North Pole Web Cam on July 25, 2013 (top), and July 30, 2013 (bottom).
Credit: North Pole Environmental Observatory
High-resolution image
There have been confusion and misinformation on several Arctic- and climate-focused Web blogs regarding the presence of a lake at the North Pole, as viewed from the North Pole Webcam, which is part of the North Pole Environmental Observatory (NPEO). First, the webcam is not at the North Pole. Because of the drift of the ice, as of this week it is actually located at about 84 degrees North near the prime meridian. Second, the so-called lake is nothing more than a large summer melt pond atop the ice cover, and is not, as some have said, a hole or a polynya in the ice cover. While quite extensive by July 26, the pond appears to have largely disappeared by July 30, by draining off the sea perhaps through a fracture, followed by a dusting of snow. See the NPEO’s FAQ on the melt ponding this year.
*Note: A reader called our attention to details in the North Pole Web Cam images of the recent melt pond. After examining these and conferring with other researchers, we have revised the sentence that reads: “While quite extensive by July 26, the pond appears to have largely disappeared by July 30 under what is probably a thin layer of ice covered with a dusting of snow.” The updated version now reads “While quite extensive by July 26, the pond appears to have largely disappeared by July 30, by draining off the sea perhaps through a fracture, followed by a dusting of snow.”
Onset of summer melt
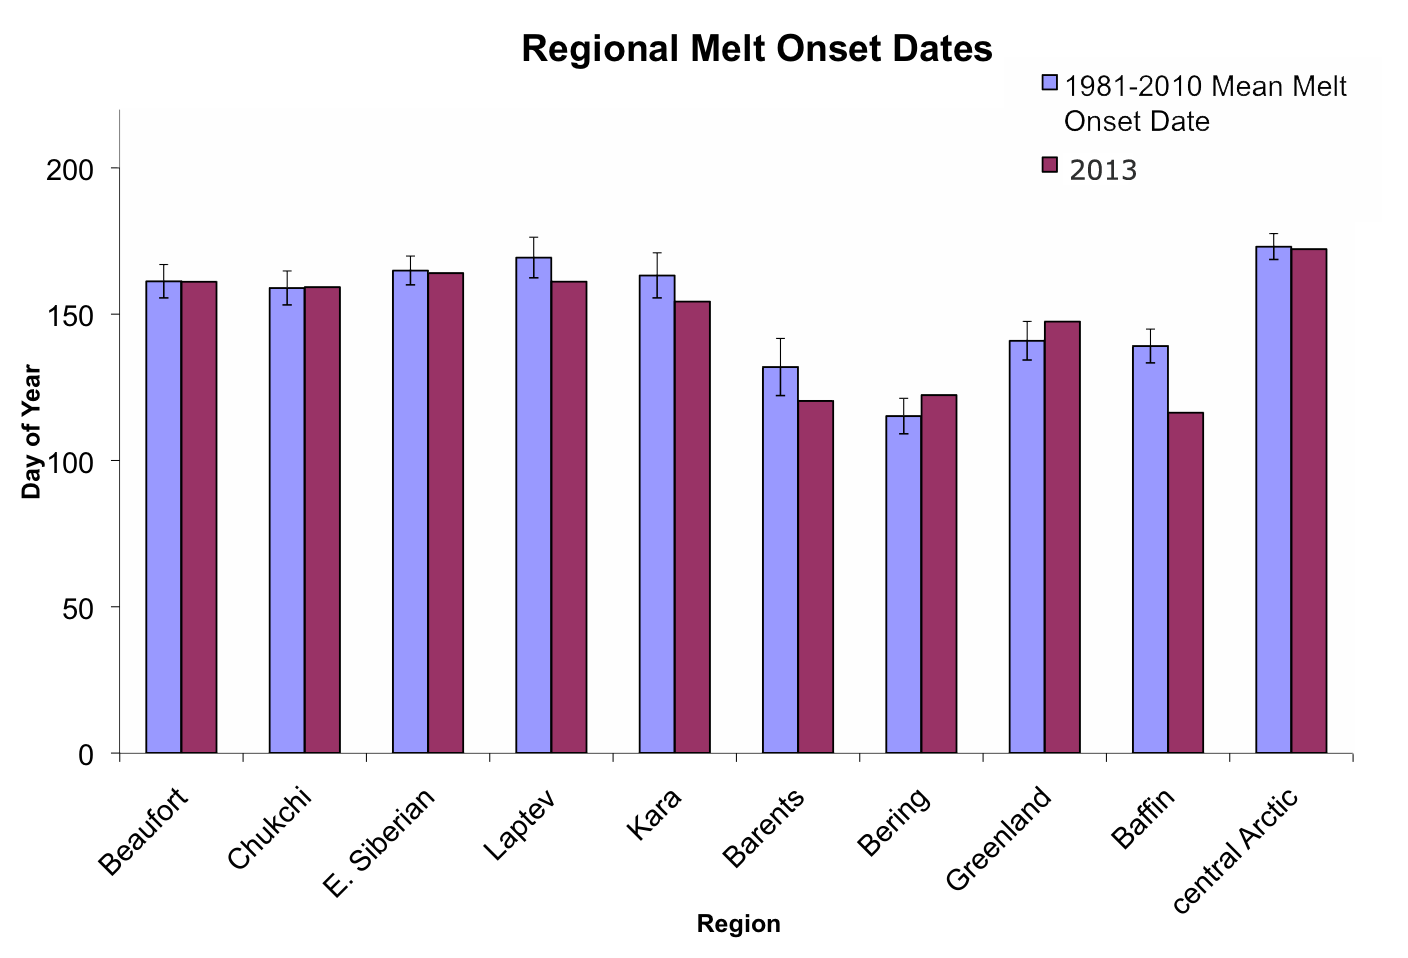
Figure 5. The graph above compares melt onset dates for sectors of the Arctic Ocean.
Credit: National Snow and Ice Data Center
High-resolution image
The same satellite passive microwave data that NSIDC uses to determine sea ice extent can also be used to determine the date of the onset of summer melt over the sea ice cover. Compared to the average over the period 1981 to 2010, the date of melt onset, as assessed for different sectors of the Arctic Ocean, was largely unremarkable. It was slightly earlier than average in some sectors but later than average in others.
Further reading
Serreze, M. C. and A. P. Barrett. 2008. The summer cyclone maximum over the central Arctic Ocean. Journal of Climate 21, doi:10.1175/2007JCLI1810.1.
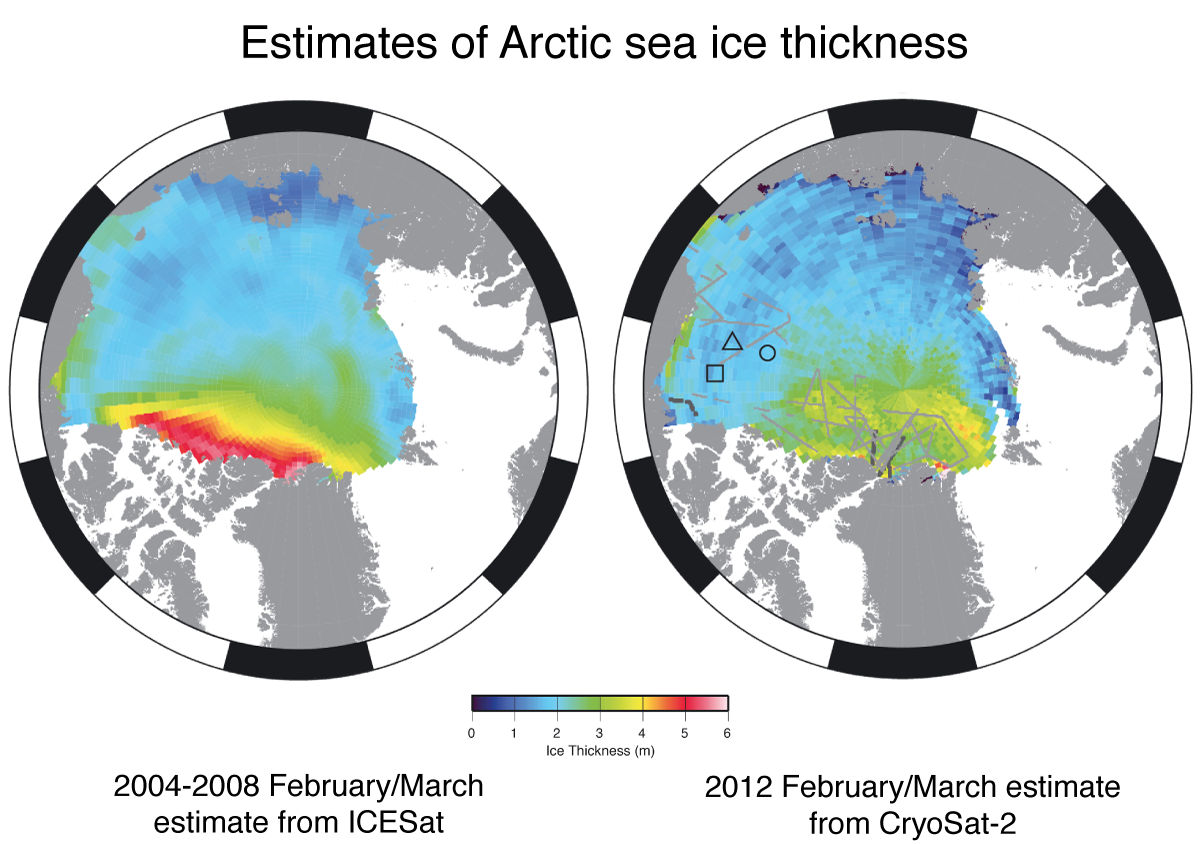
Kwok, R. and N. Untersteiner. 2011. The thinning of the Arctic sea ice. Physics Today 64(4), April 2011, doi:10.1063/1.3580491.
Rosel, A., L. Kaleschke, and G. Birnbaum. 2011. Melt ponds on Arctic sea ice determined from MODIS satellite data using an artificial neural network. The Cryosphere Discussions 5, 2991–3024, doi:10.5194/tcd-5-2991-2011.


