Sea ice extent in the Bering Sea remains at record low levels for this time of year. Total ice extent over the Arctic Ocean also remains low.
Overview of conditions
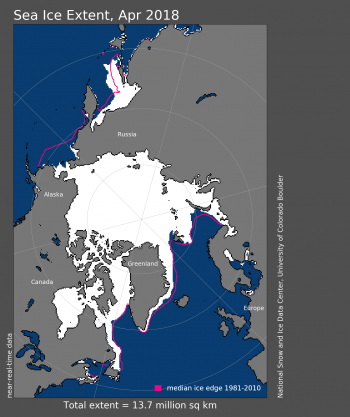
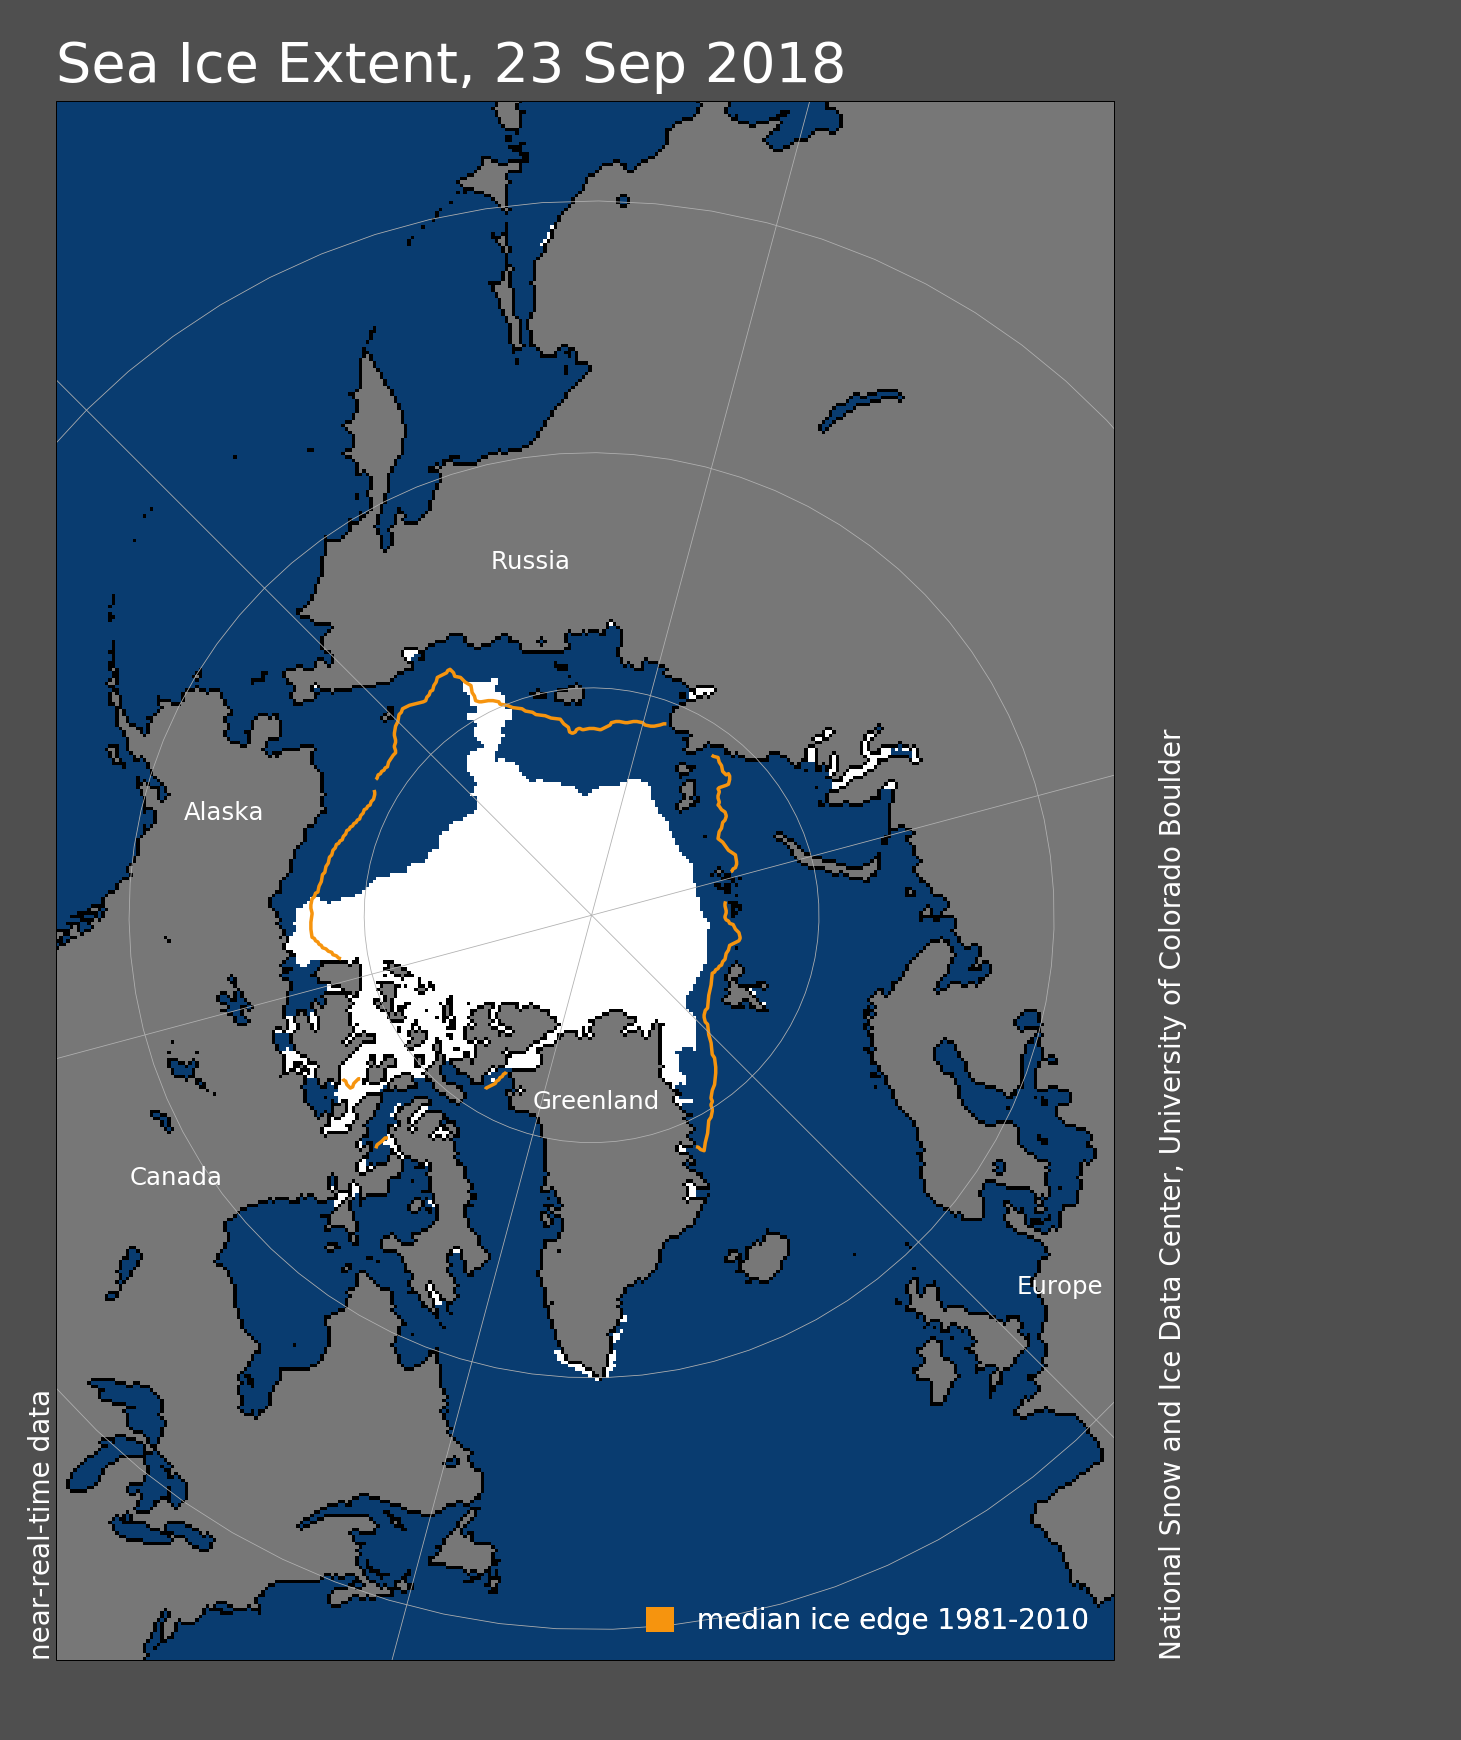
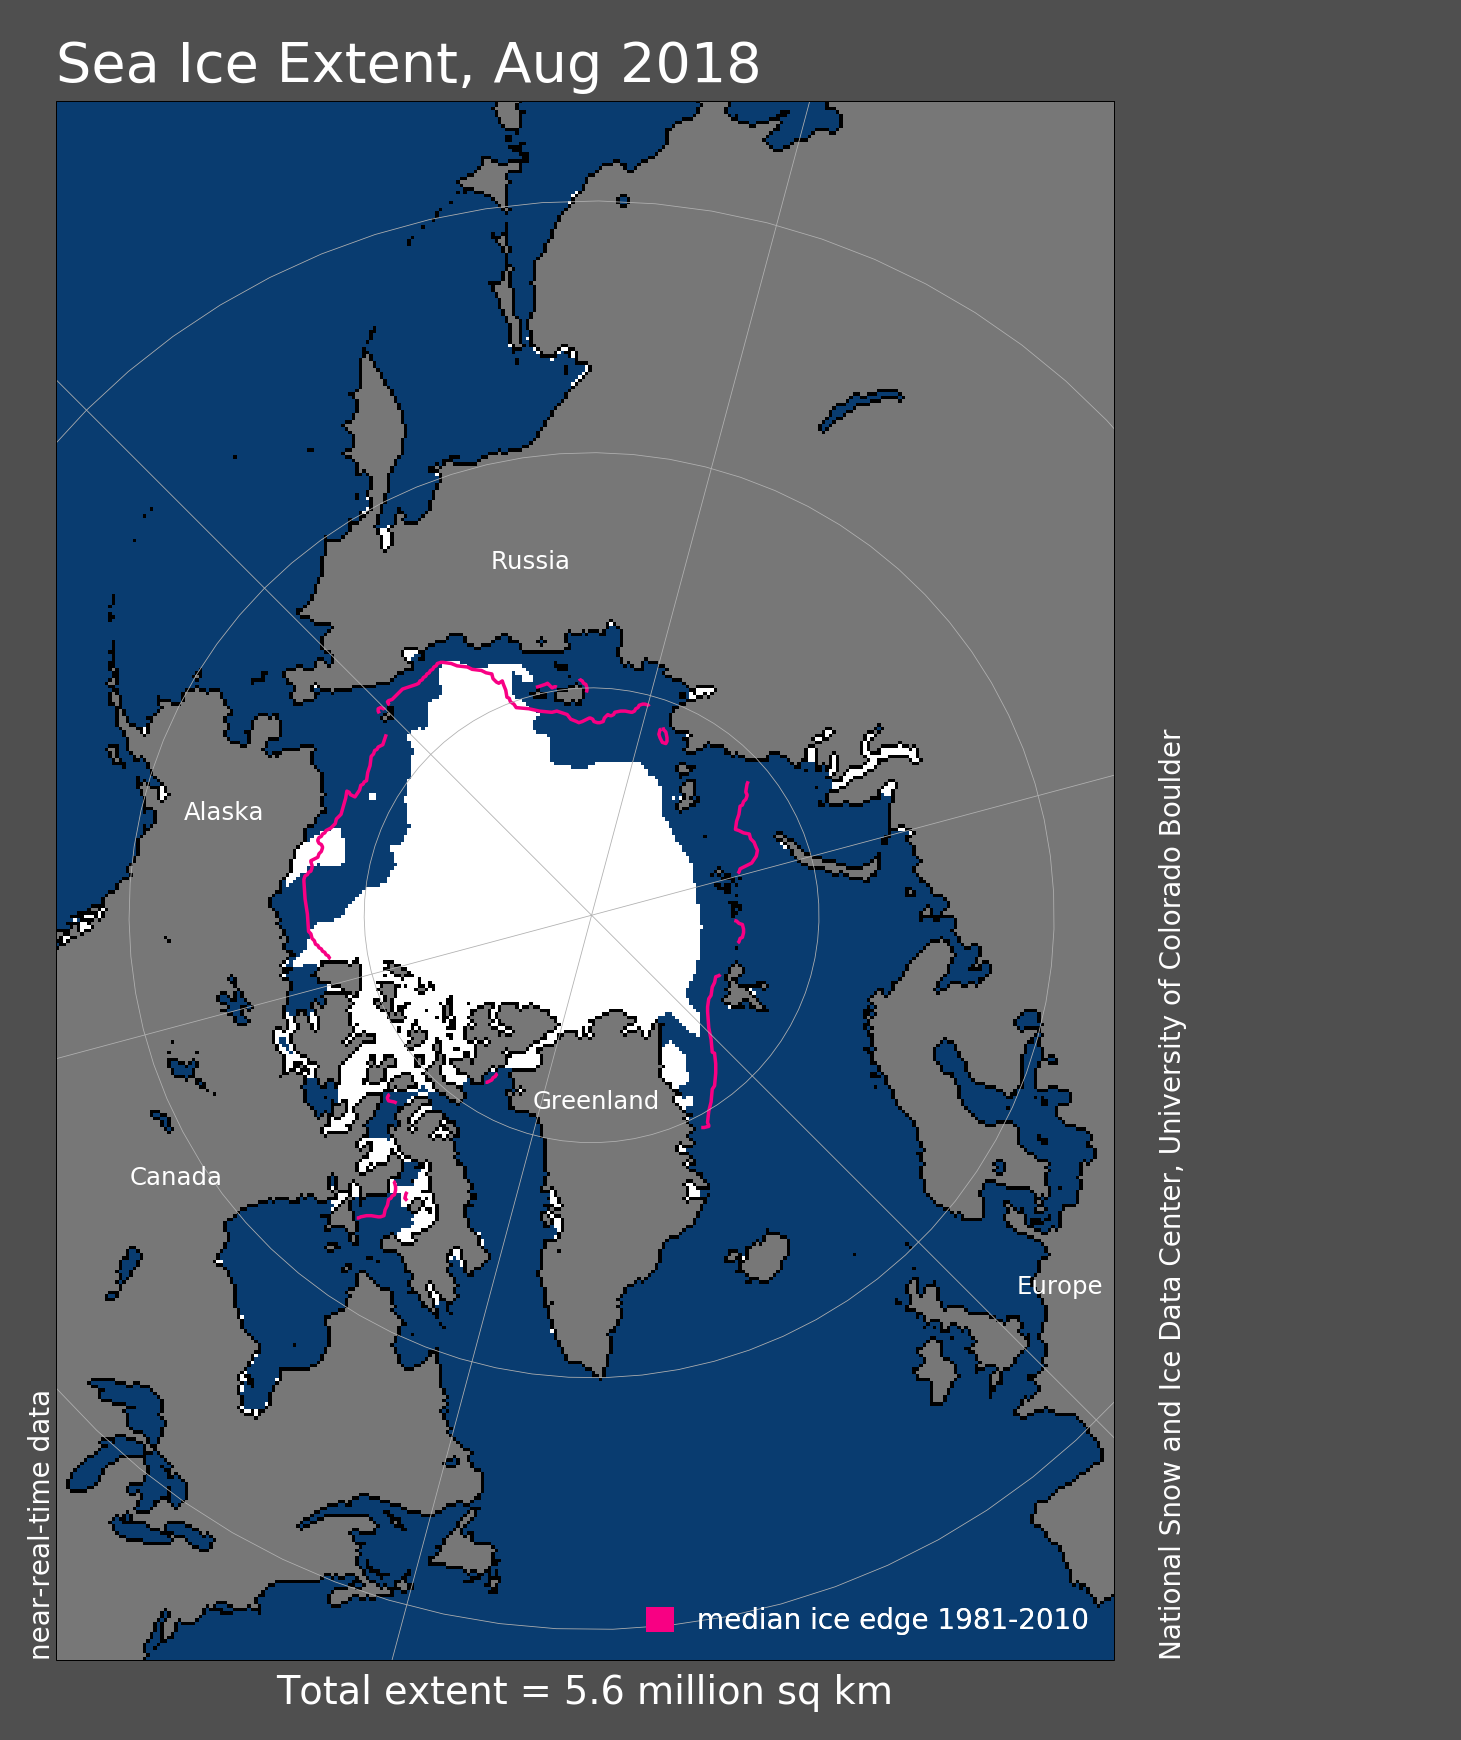
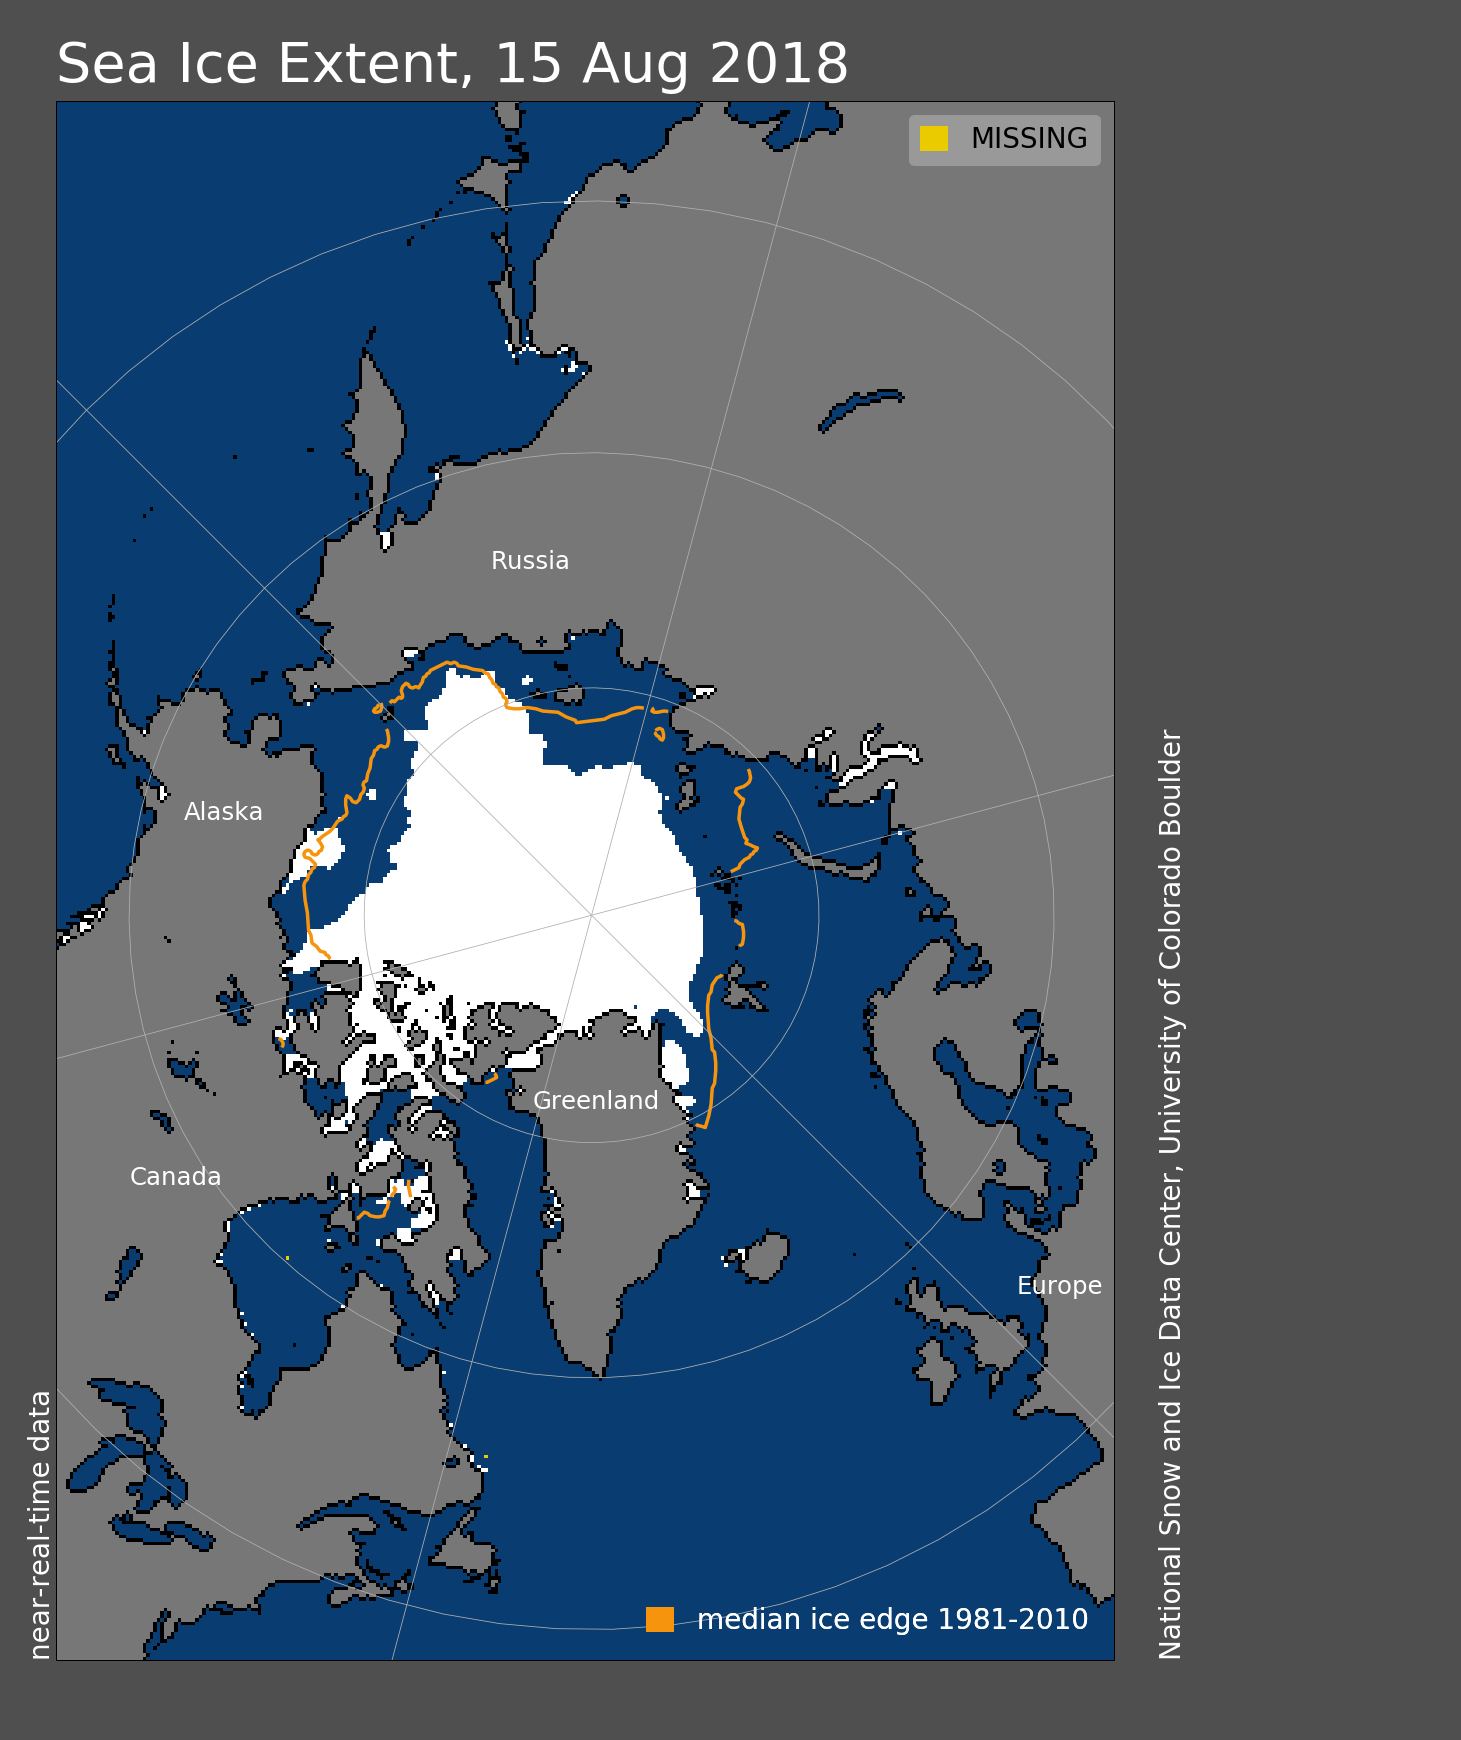
Figure 1. Arctic sea ice extent for April 2018 was 13.71 million square kilometers (5.29 million square miles). The magenta line shows the 1981 to 2010 average extent for the month. Sea Ice Index data. About the data
Credit: National Snow and Ice Data Center
High-resolution image
Arctic sea ice extent for April 2018 averaged 13.71 million square kilometers (5.29 million square miles). This was 980,000 square kilometers (378,400 square miles) below the 1981 to 2010 average and only 20,000 square kilometers (7,700 square miles) above the record low April extent set in 2016. Given the uncertainty in measurements, NSIDC considers 2016 and 2018 as tying for lowest April sea ice extent on record. As seen throughout the 2017 to 2018 winter, extent remained below average in the Bering Sea and Barents Sea. While retreat was especially pronounced in the Sea of Okhotsk during the month of April, the ice edge was only slightly further north than is typical at this time of year. Sea ice extent in the Bering Sea remains the lowest recorded since at least 1979. The lack of sea ice within this region created many coastal hazards this past winter.
Conditions in context

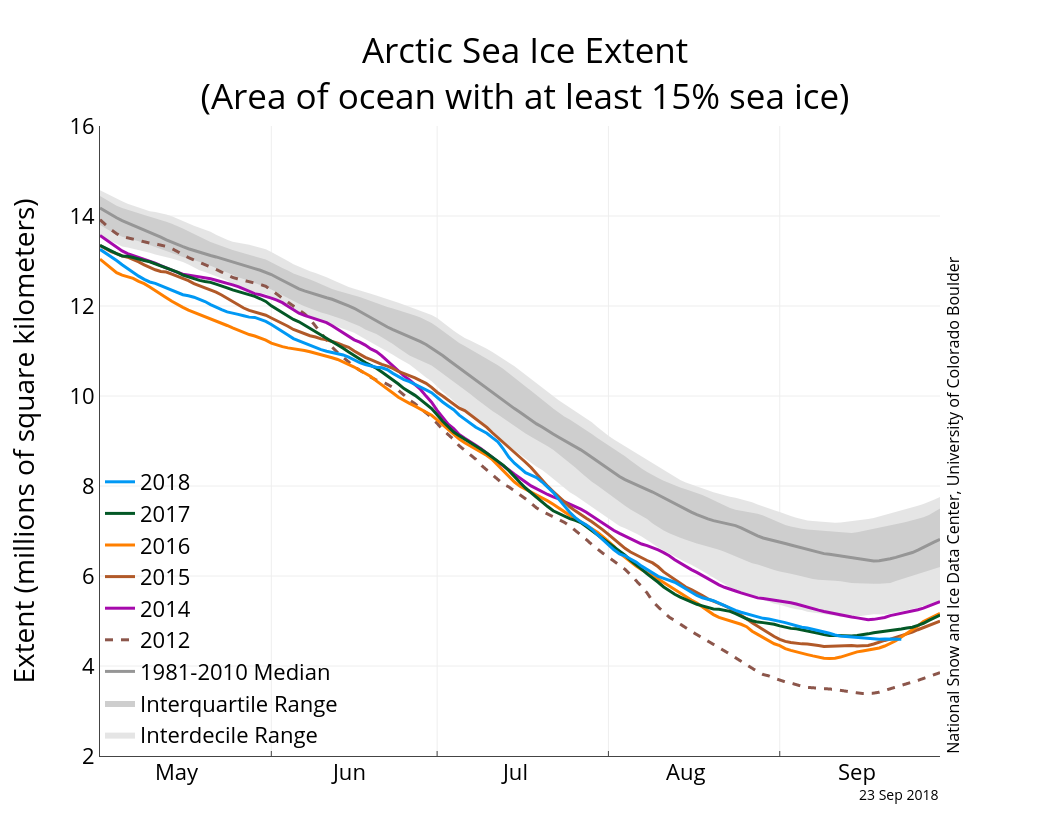
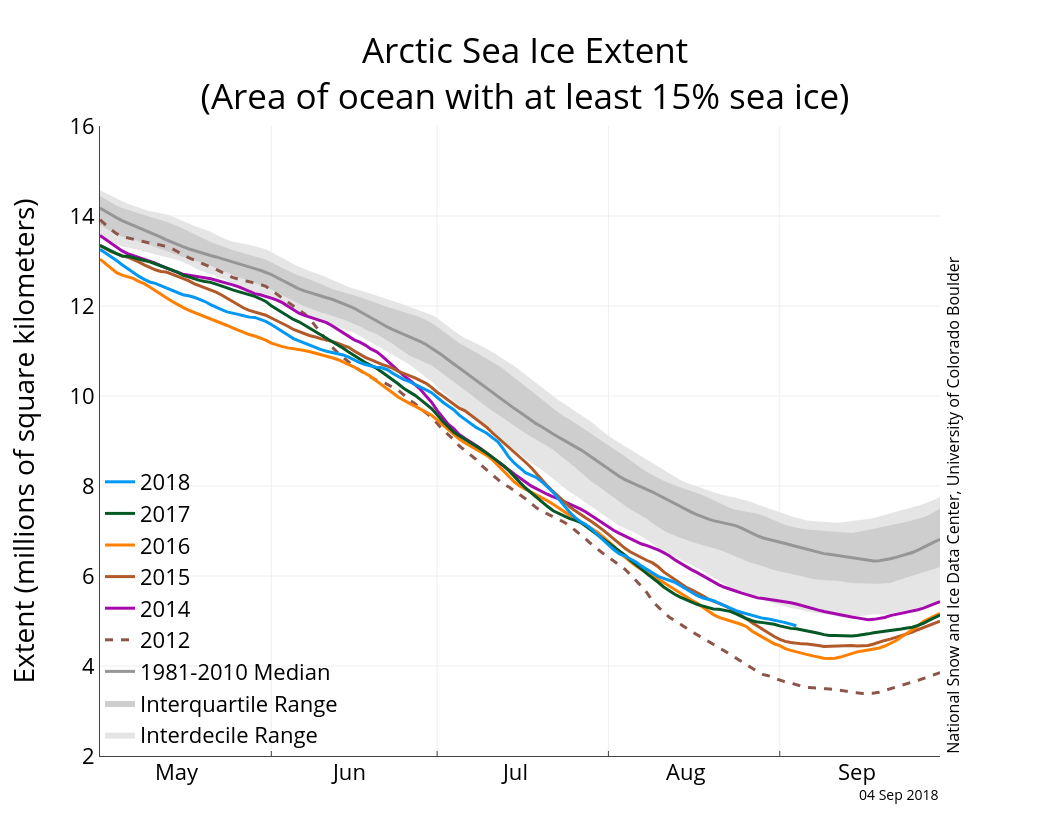
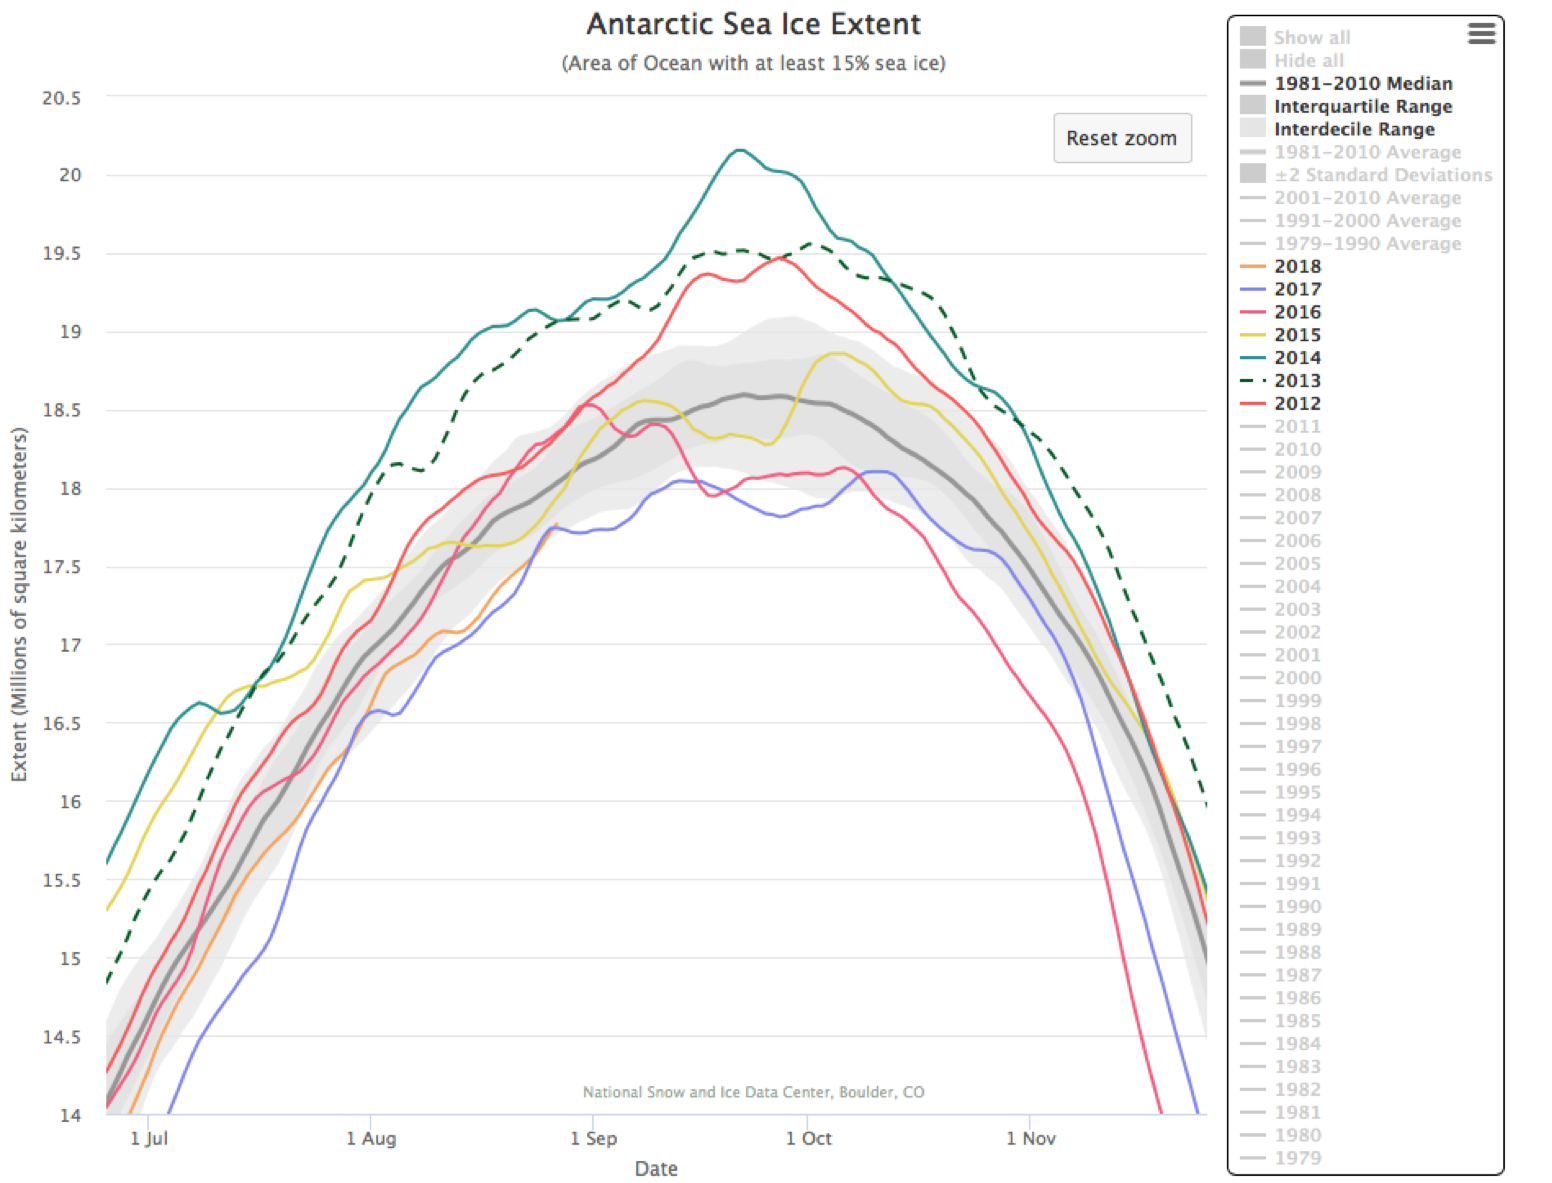
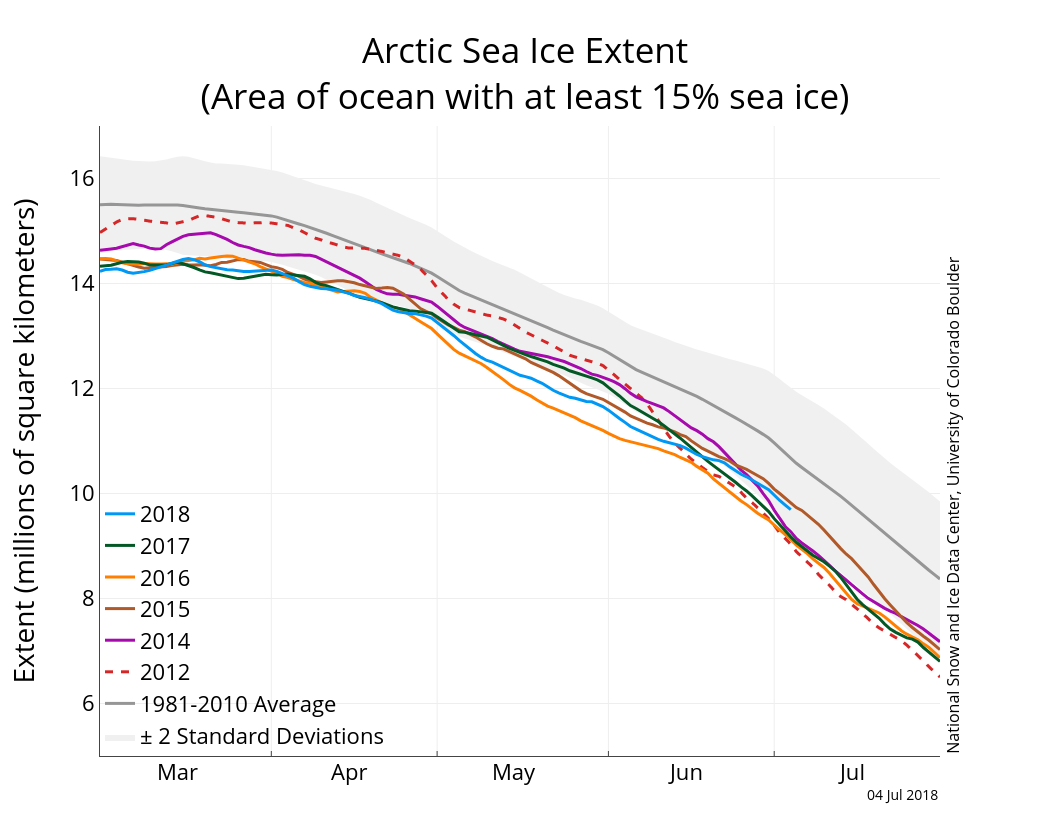
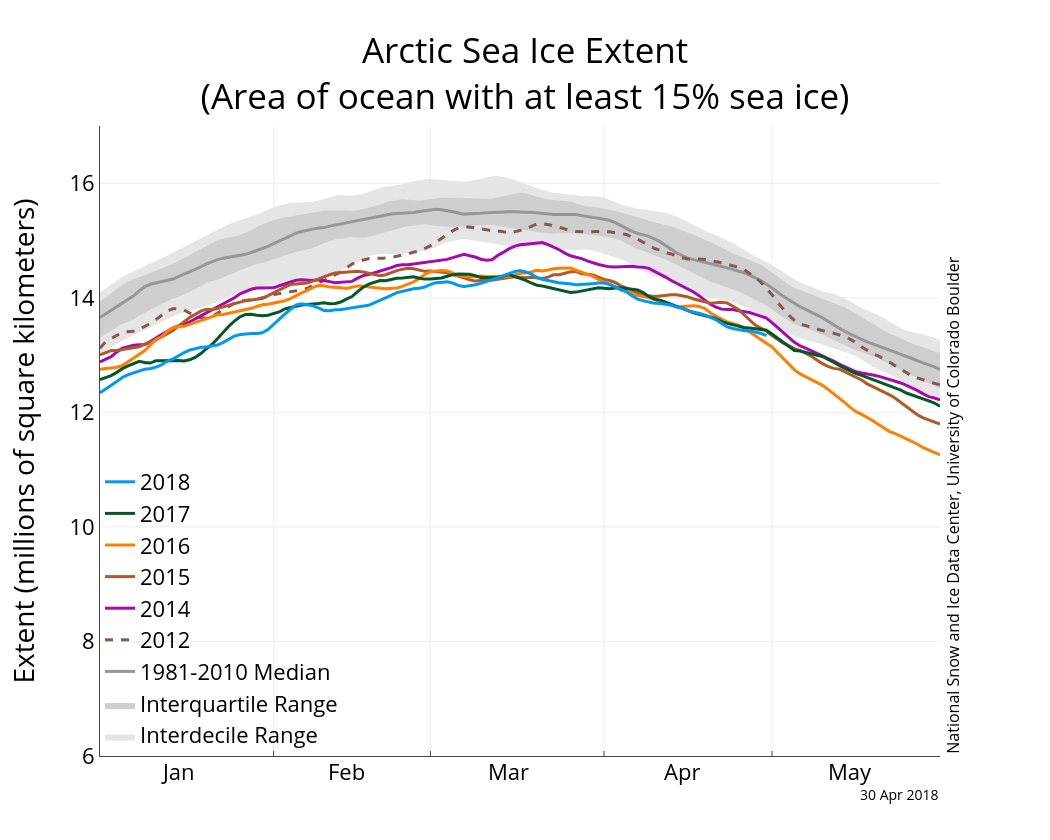
Figure 2. The graph above shows Arctic sea ice extent as of April 30, 2018, along with daily ice extent data for four previous years and 2012, the year with record low minimum extent. 2018 is shown in blue, 2017 in green, 2016 in orange, 2015 in brown, 2014 in purple, and 2012 in dotted brown. The 1981 to 2010 median is in dark gray. The gray areas around the median line show the interquartile and interdecile ranges of the data. Sea Ice Index data.
Credit: National Snow and Ice Data Center
High-resolution image
Overall, sea ice extent for April 2018 declined by 920,000 square kilometers (355,000 square miles). The amount of ice lost for the month was less than the 1981 to 2010 average of 1.1 million square kilometers (424,700 square miles). The ice edge retreated everywhere except in Hudson Bay and Baffin Bay/Davis Strait. The sea ice expanded slightly within Davis Strait during the month. Sea ice in the Hudson Bay usually does not begin to retreat until the end of May.
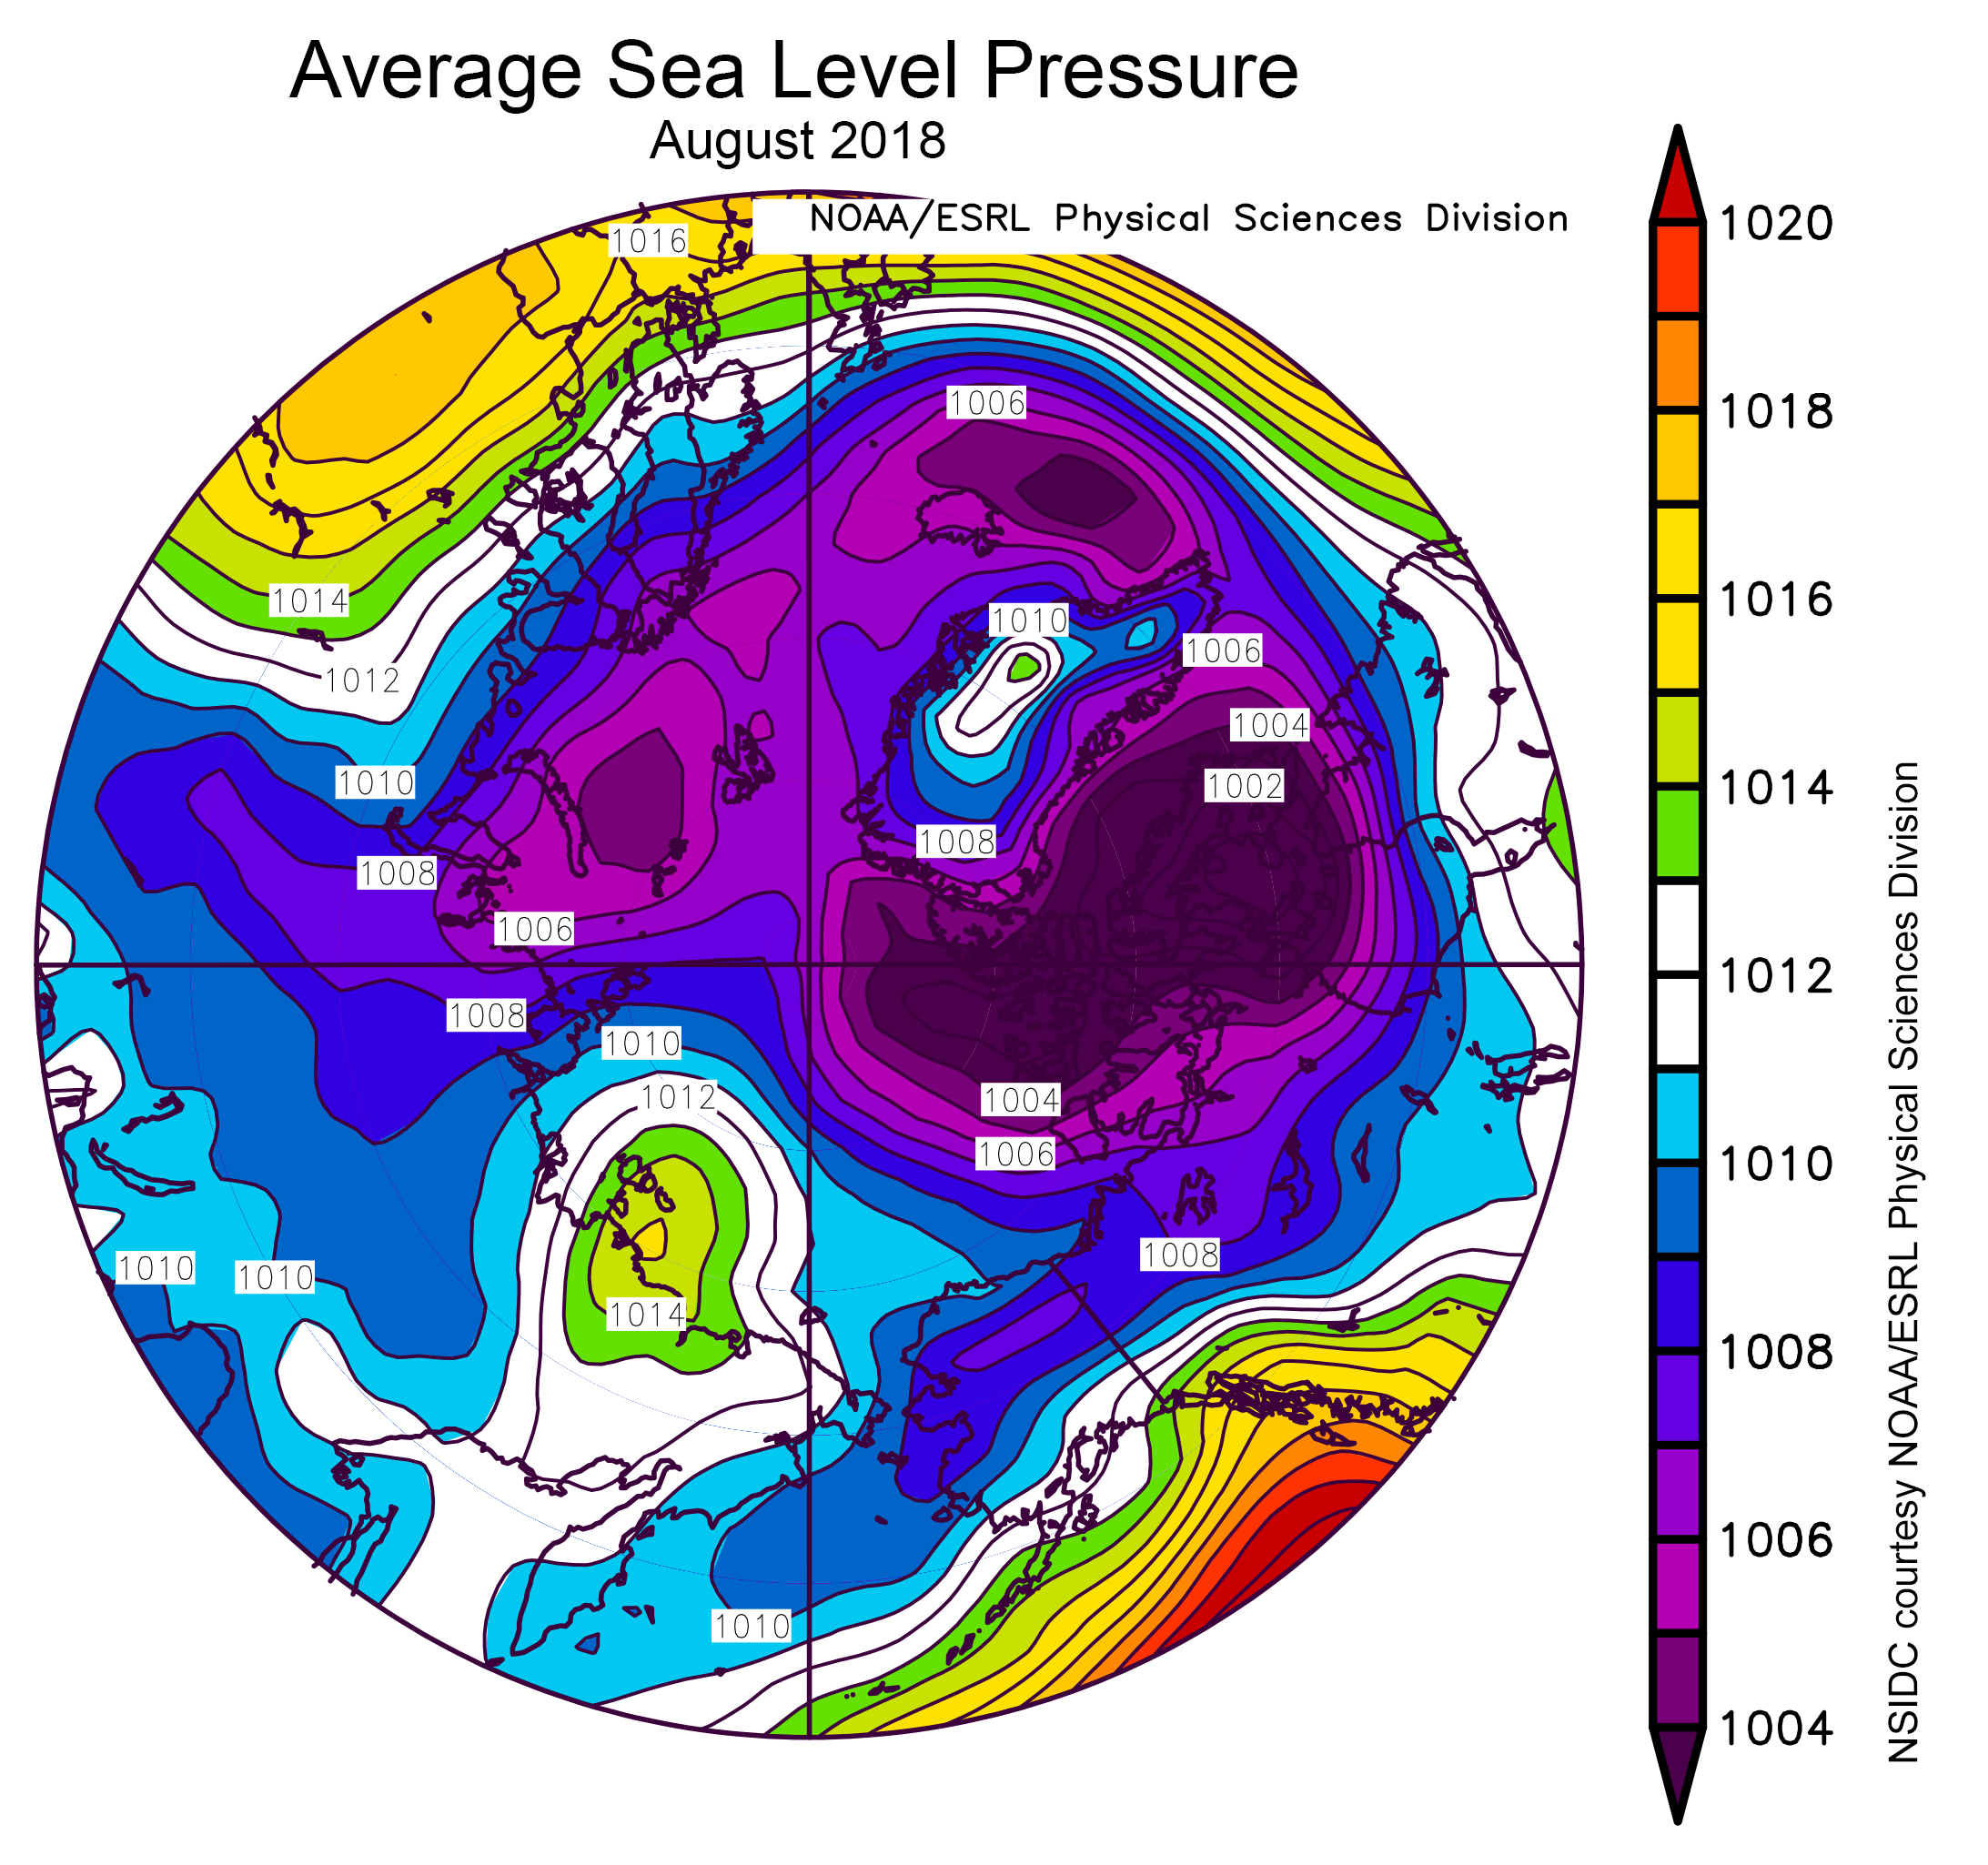
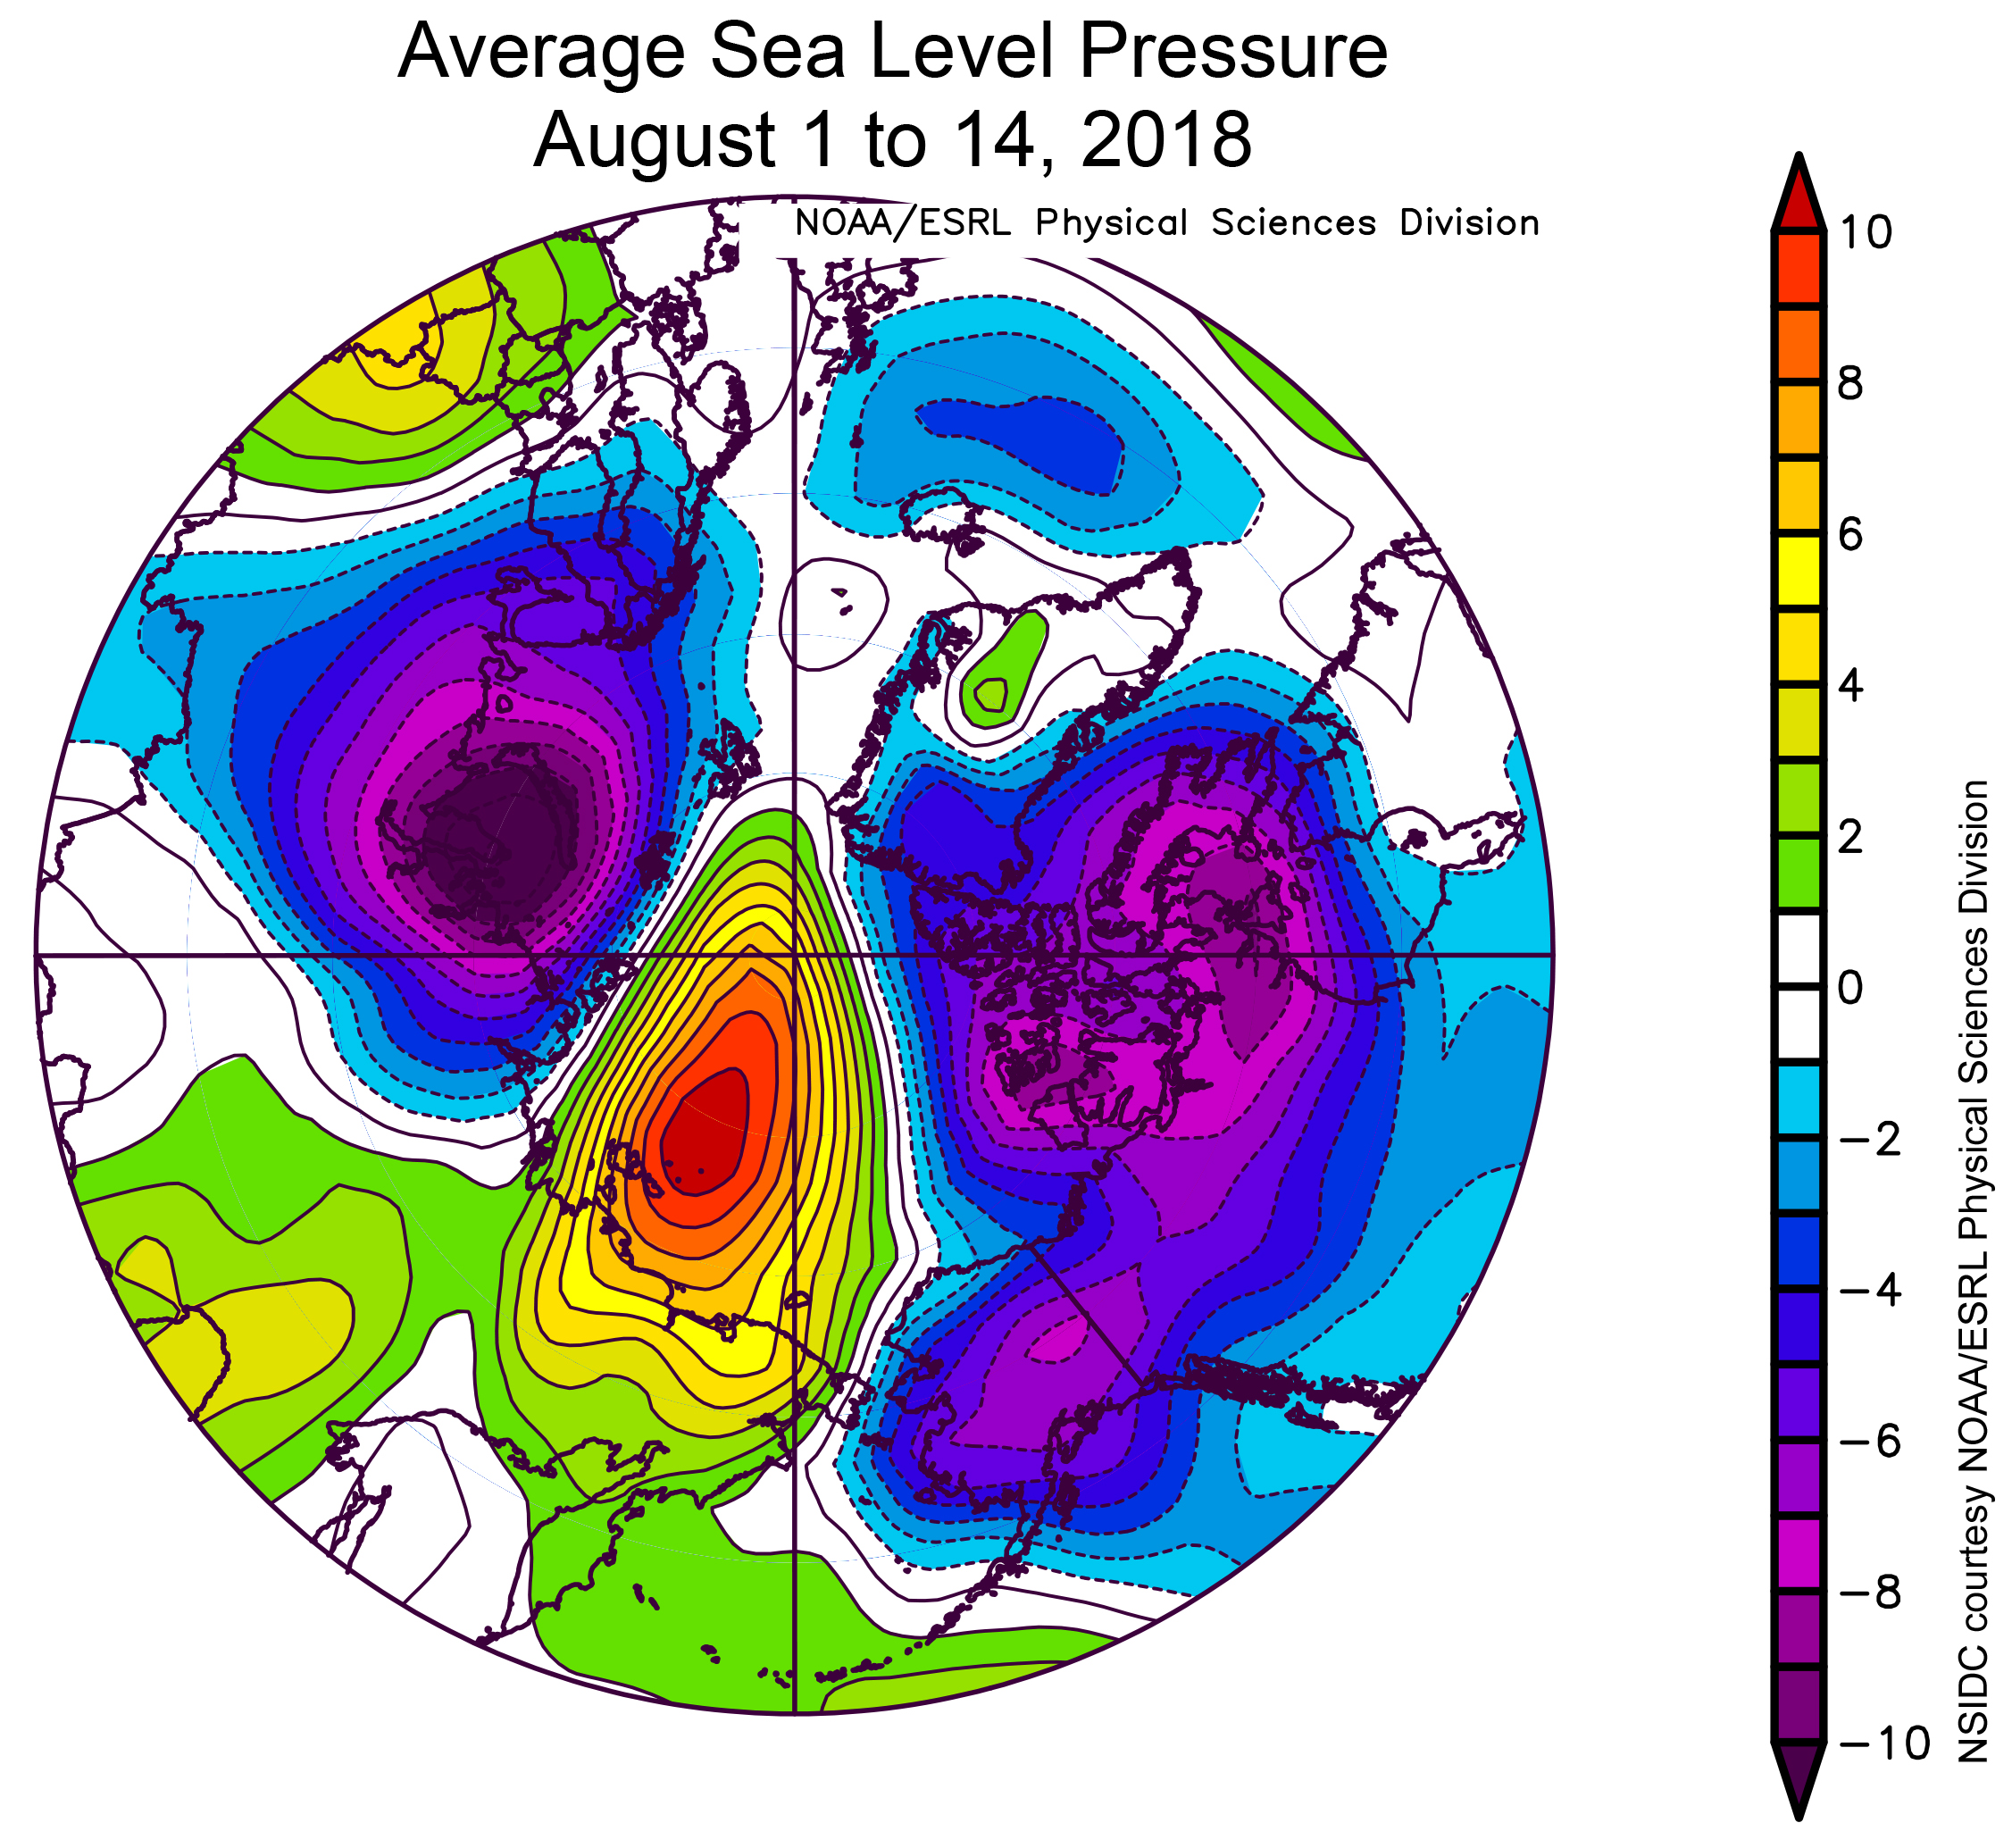
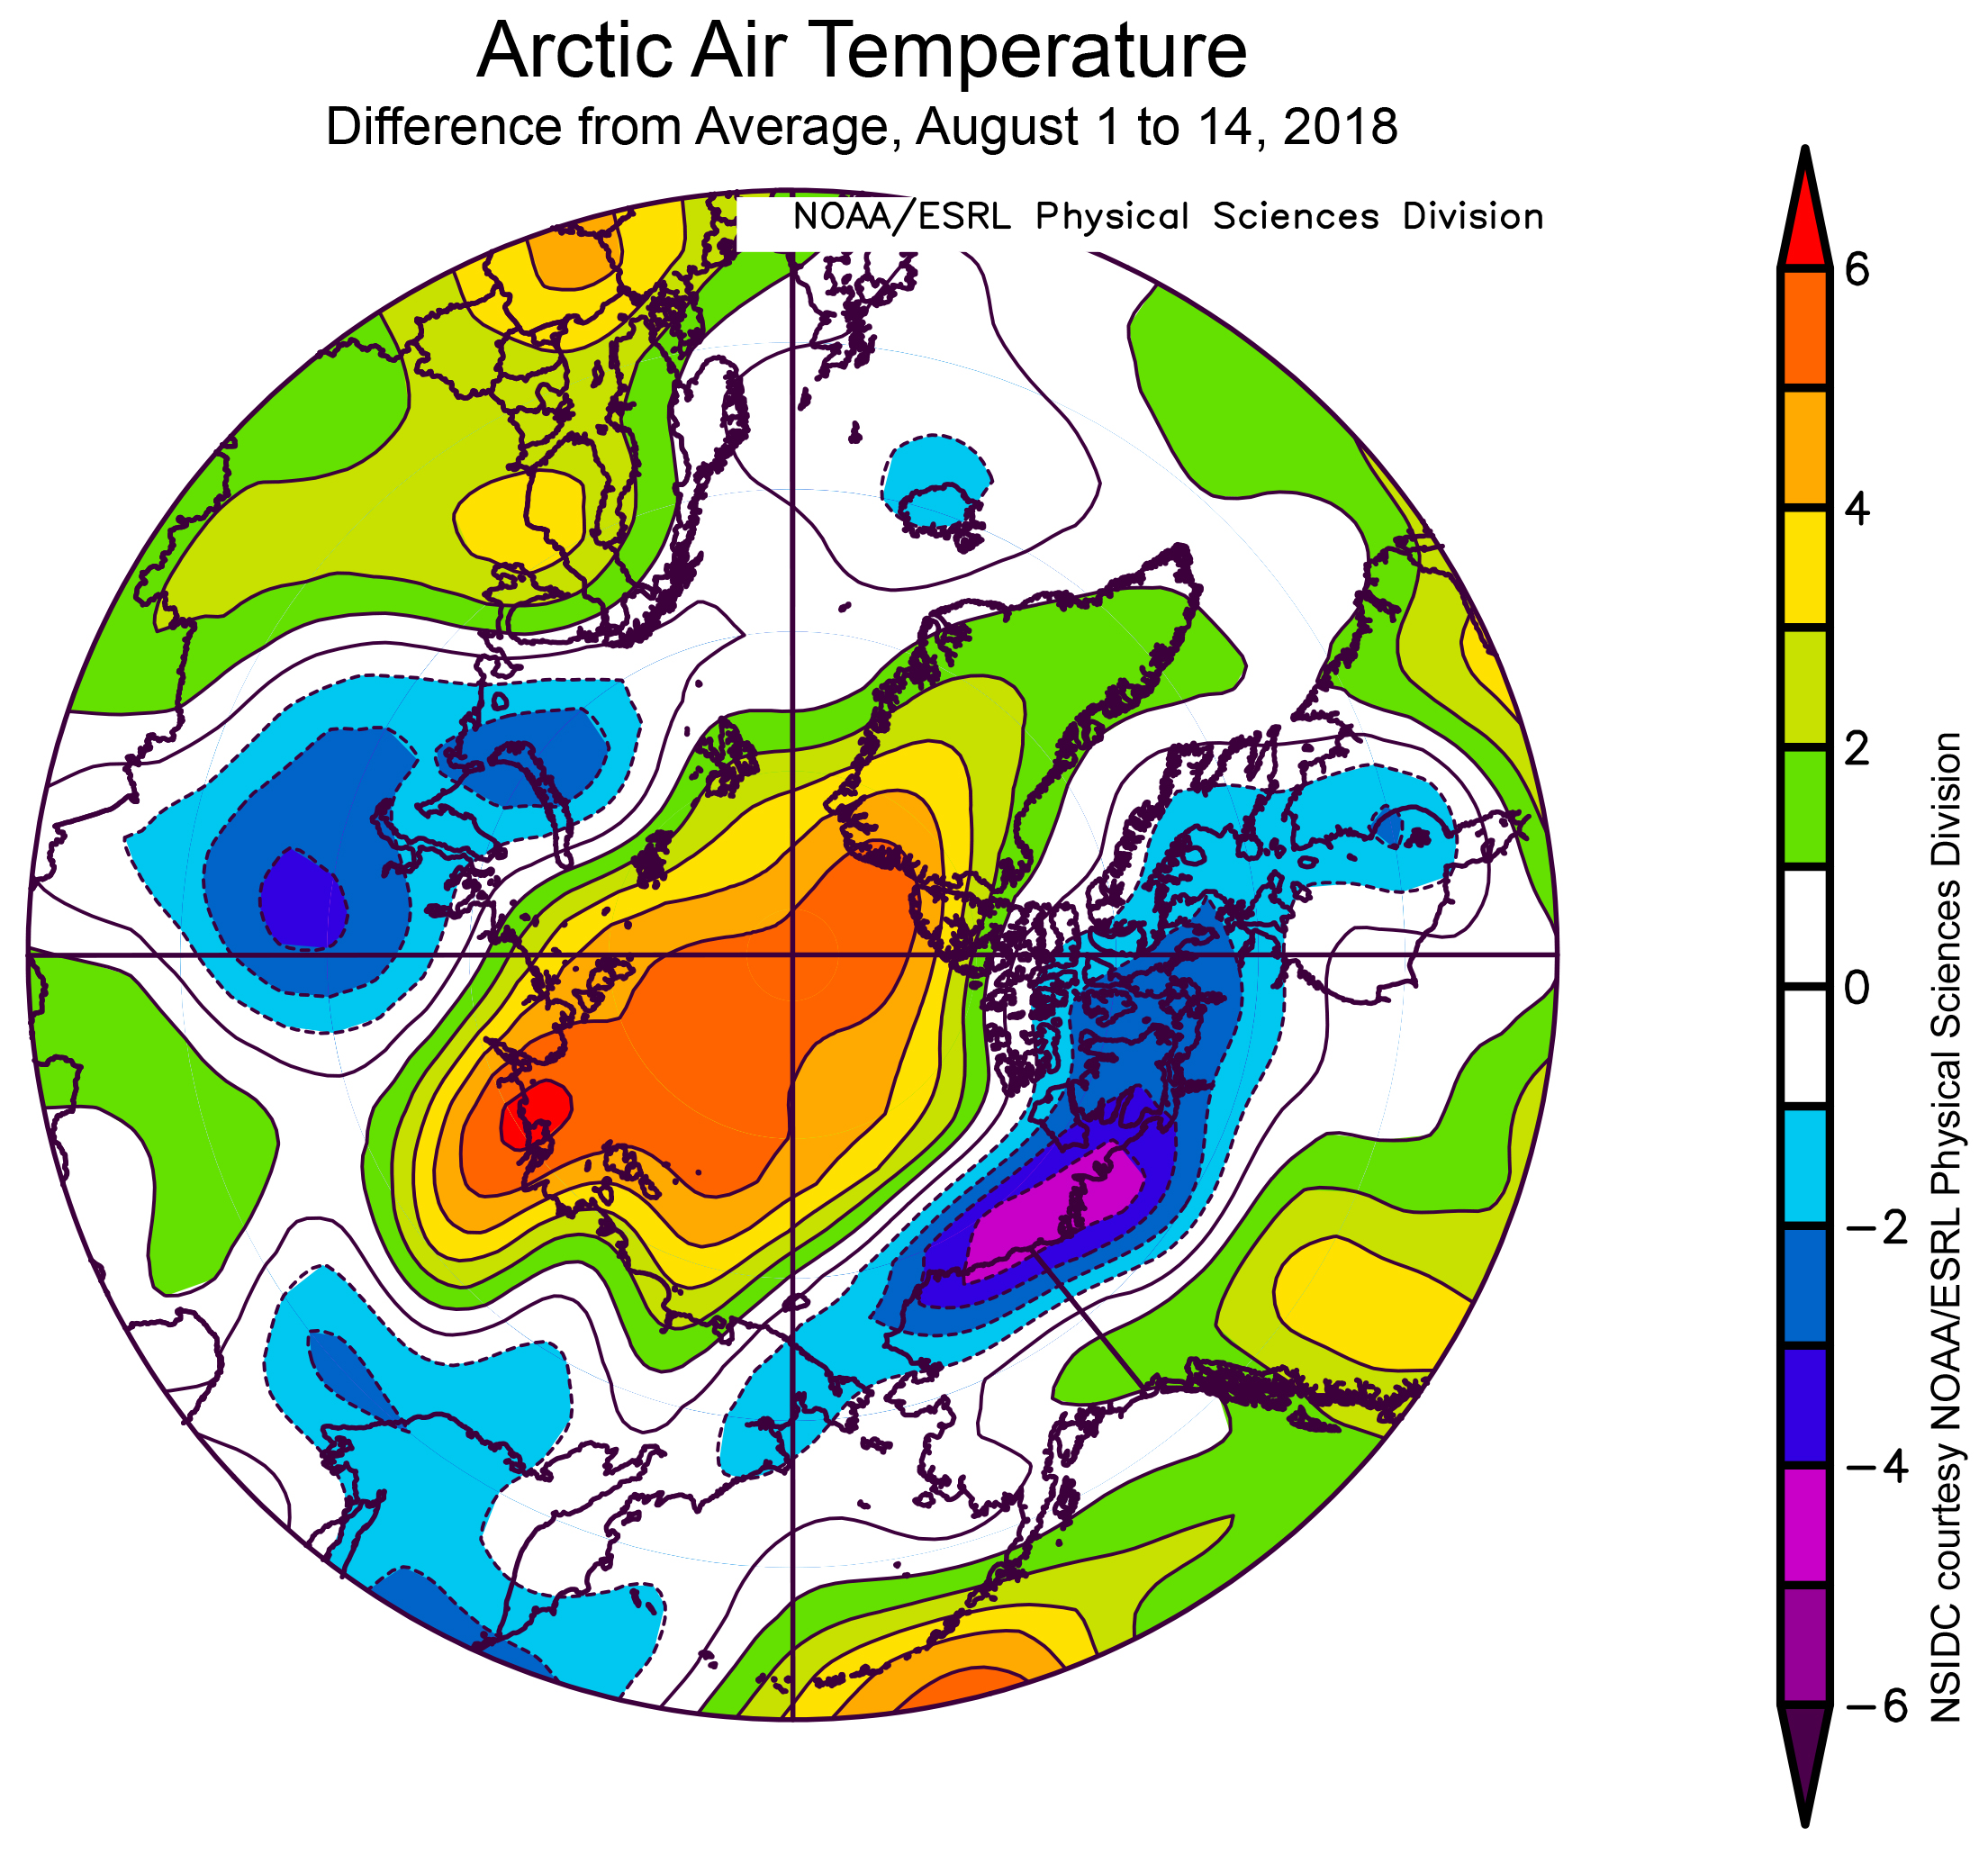
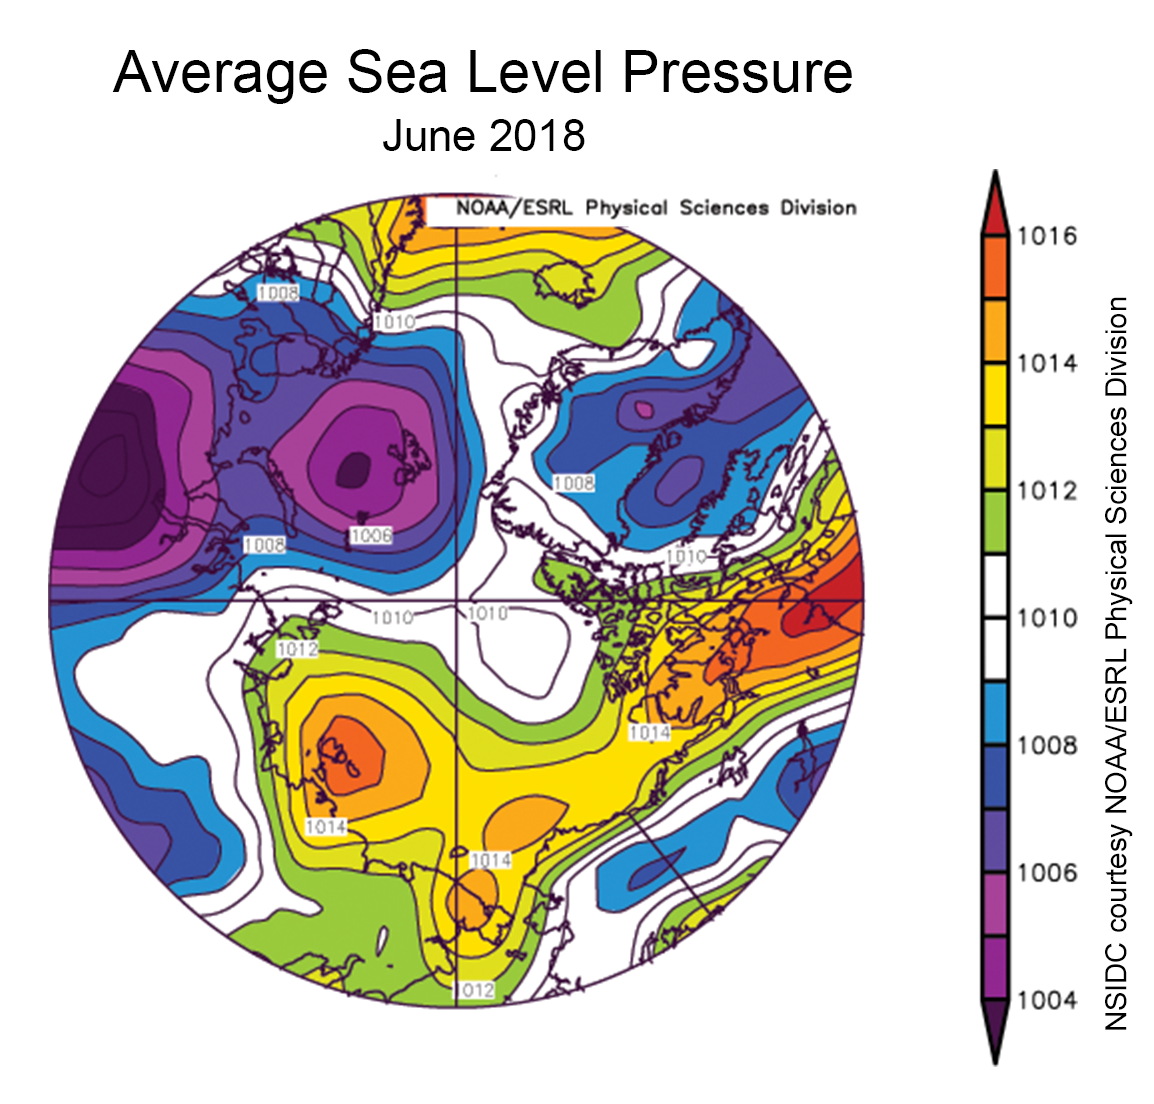
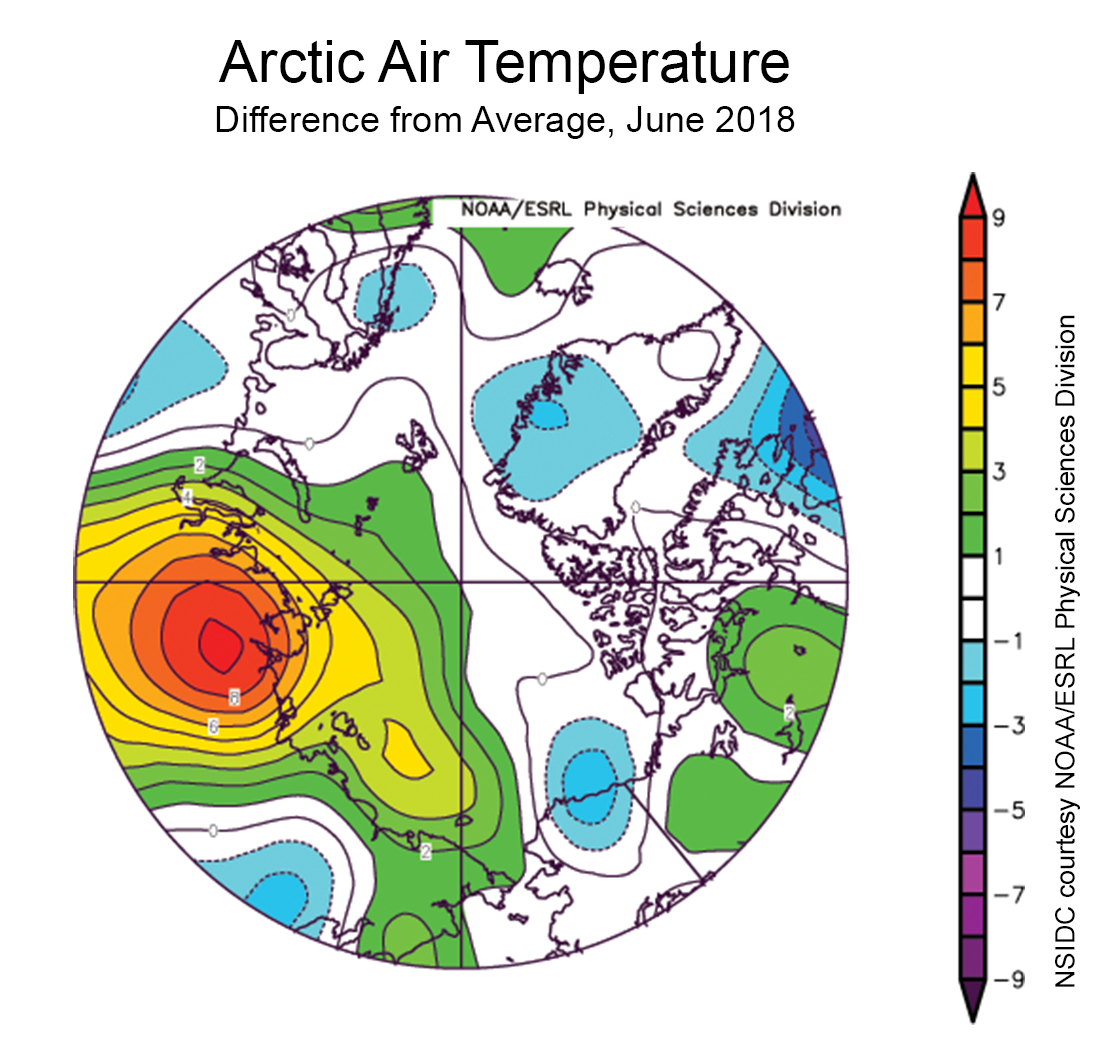
Air temperatures at 925 hPa (about 2,500 feet above sea level) for April were up to 10 degrees Celsius (18 degrees Fahrenheit) higher than average in the East Siberian Sea and stretching towards the pole. Air temperatures were also up to 5 degrees Celsius (9 degrees Fahrenheit) above average within the East Greenland Sea and 3 degrees Celsius (5 degrees Fahrenheit) above average over Baffin Bay. By contrast, air temperatures were near average within the Barents and Kara seas and lower than average over Canada and the Hudson Bay. The pattern of temperature departures from average resulted from higher than average sea level pressure over the Beaufort Sea as well as the North Atlantic, combined with below average sea level pressure over Eurasia and western Greenland through eastern Canada. On the Pacific side of the Arctic, this pressure pattern drove warm air from the south over the East Siberian and Chukchi Seas, while bringing cold air into northern Canada. The pattern of above average sea level pressure over the North Atlantic was combined with lower than average sea level pressure over western Greenland and the Canadian Archipelago, bringing in warm air in from the south over Greenland and Baffin Bay.
April 2018 compared to previous years
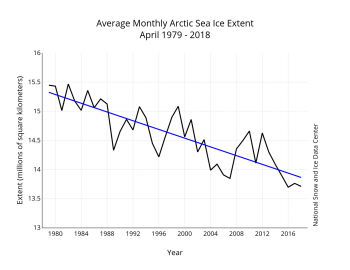
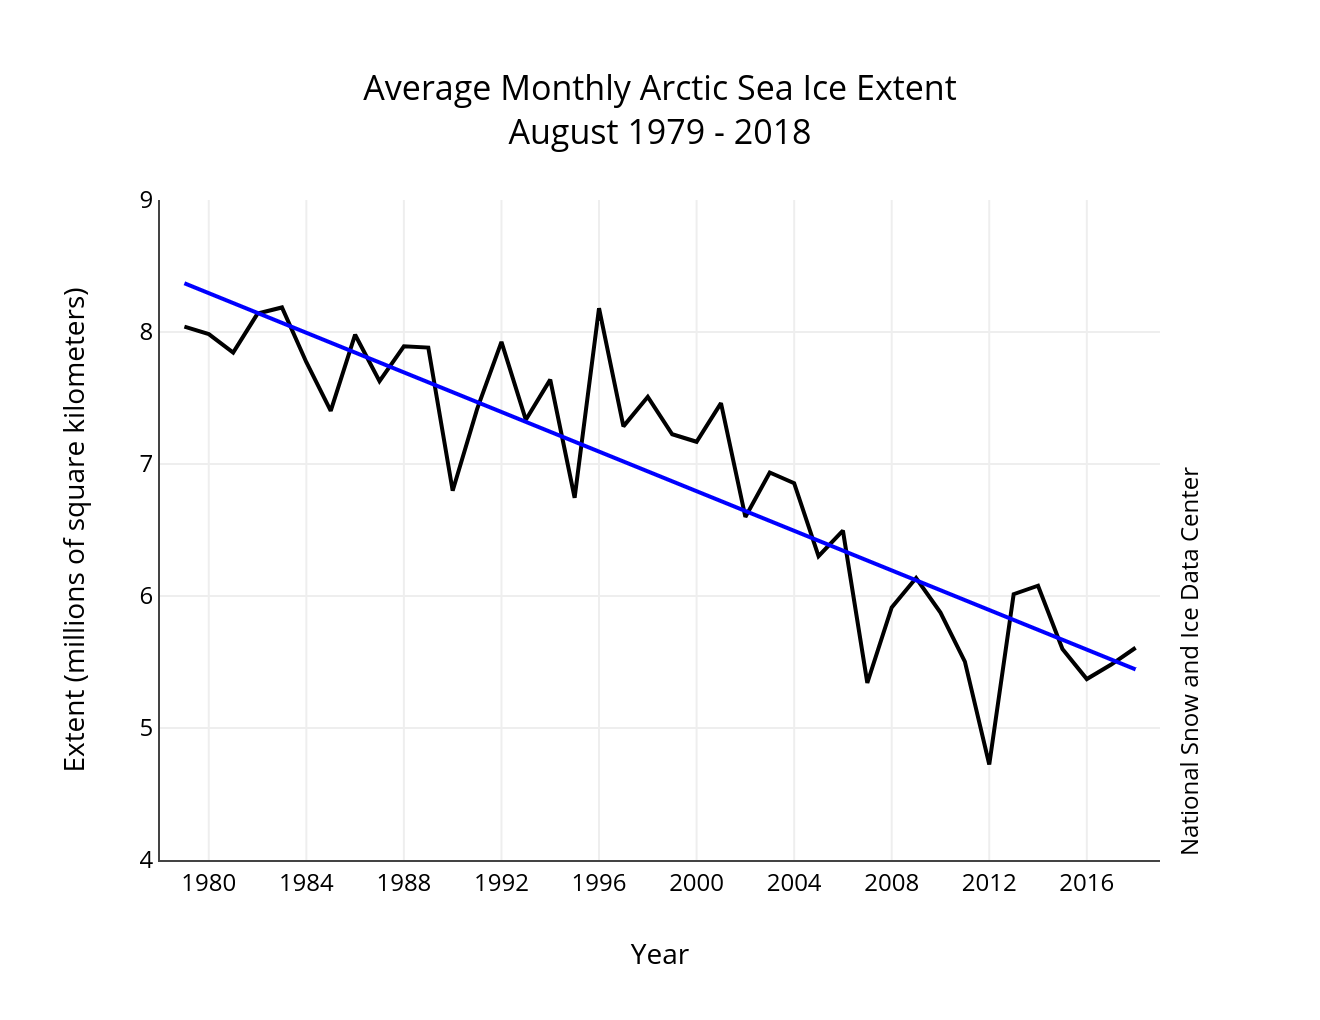
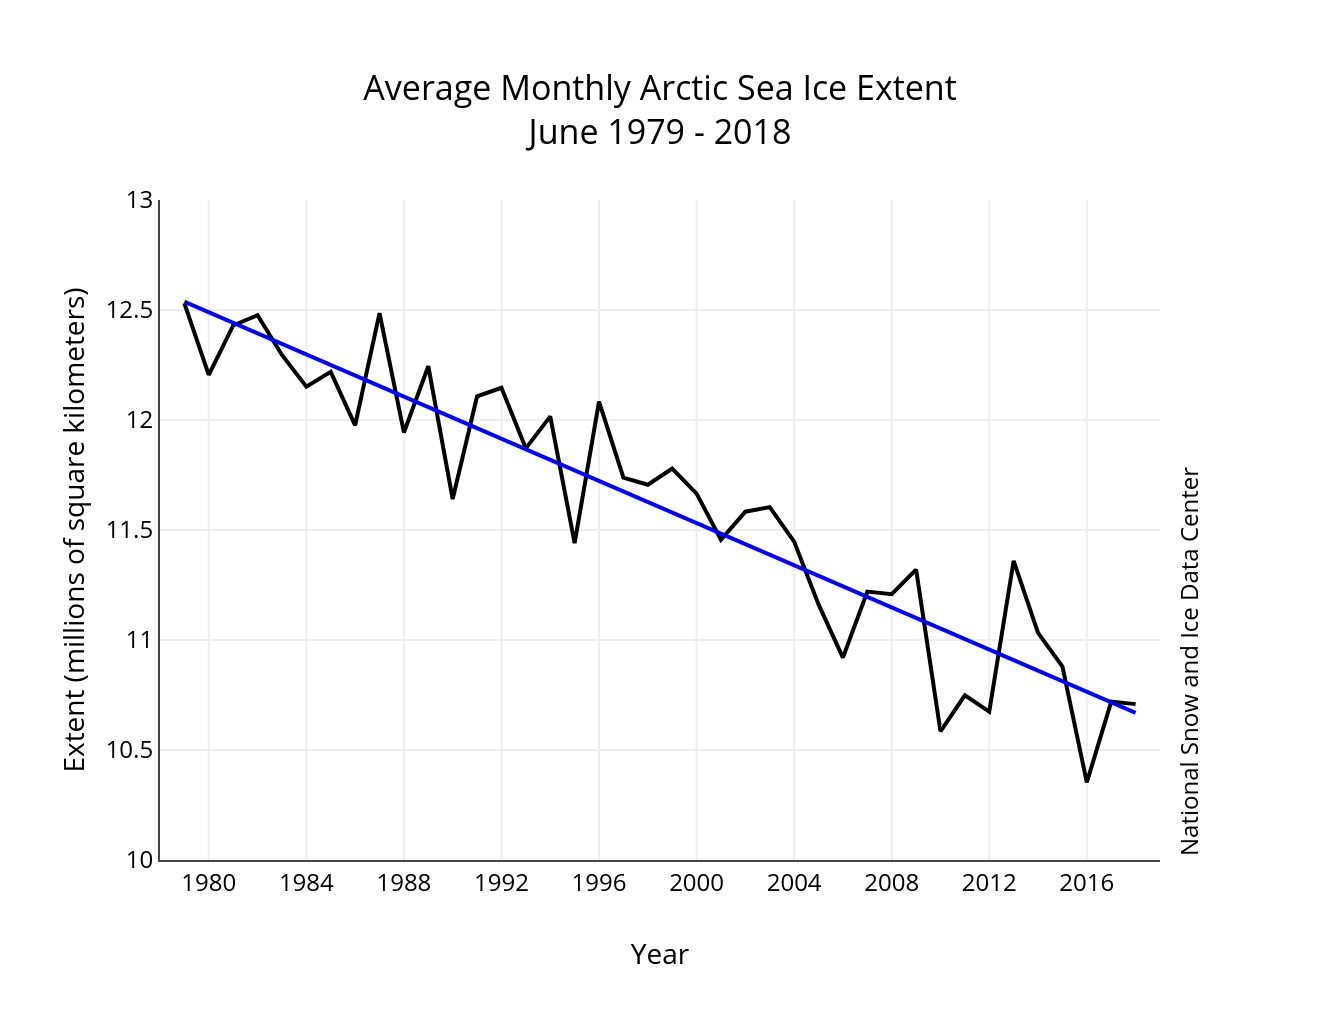
Figure 3. Monthly April ice extent for 1979 to 2018 shows a decline of 2.6 percent per decade.
Credit: National Snow and Ice Data Center
High-resolution image
The linear rate of decline for April sea ice extent is 37,500 square kilometers (14,500 square miles) per year, or 2.6 percent per decade relative to the 1981 to 2010 average.
Continued loss of the oldest sea ice, five-years or older
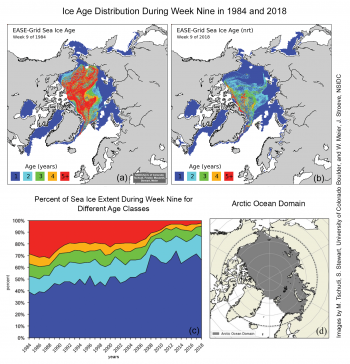
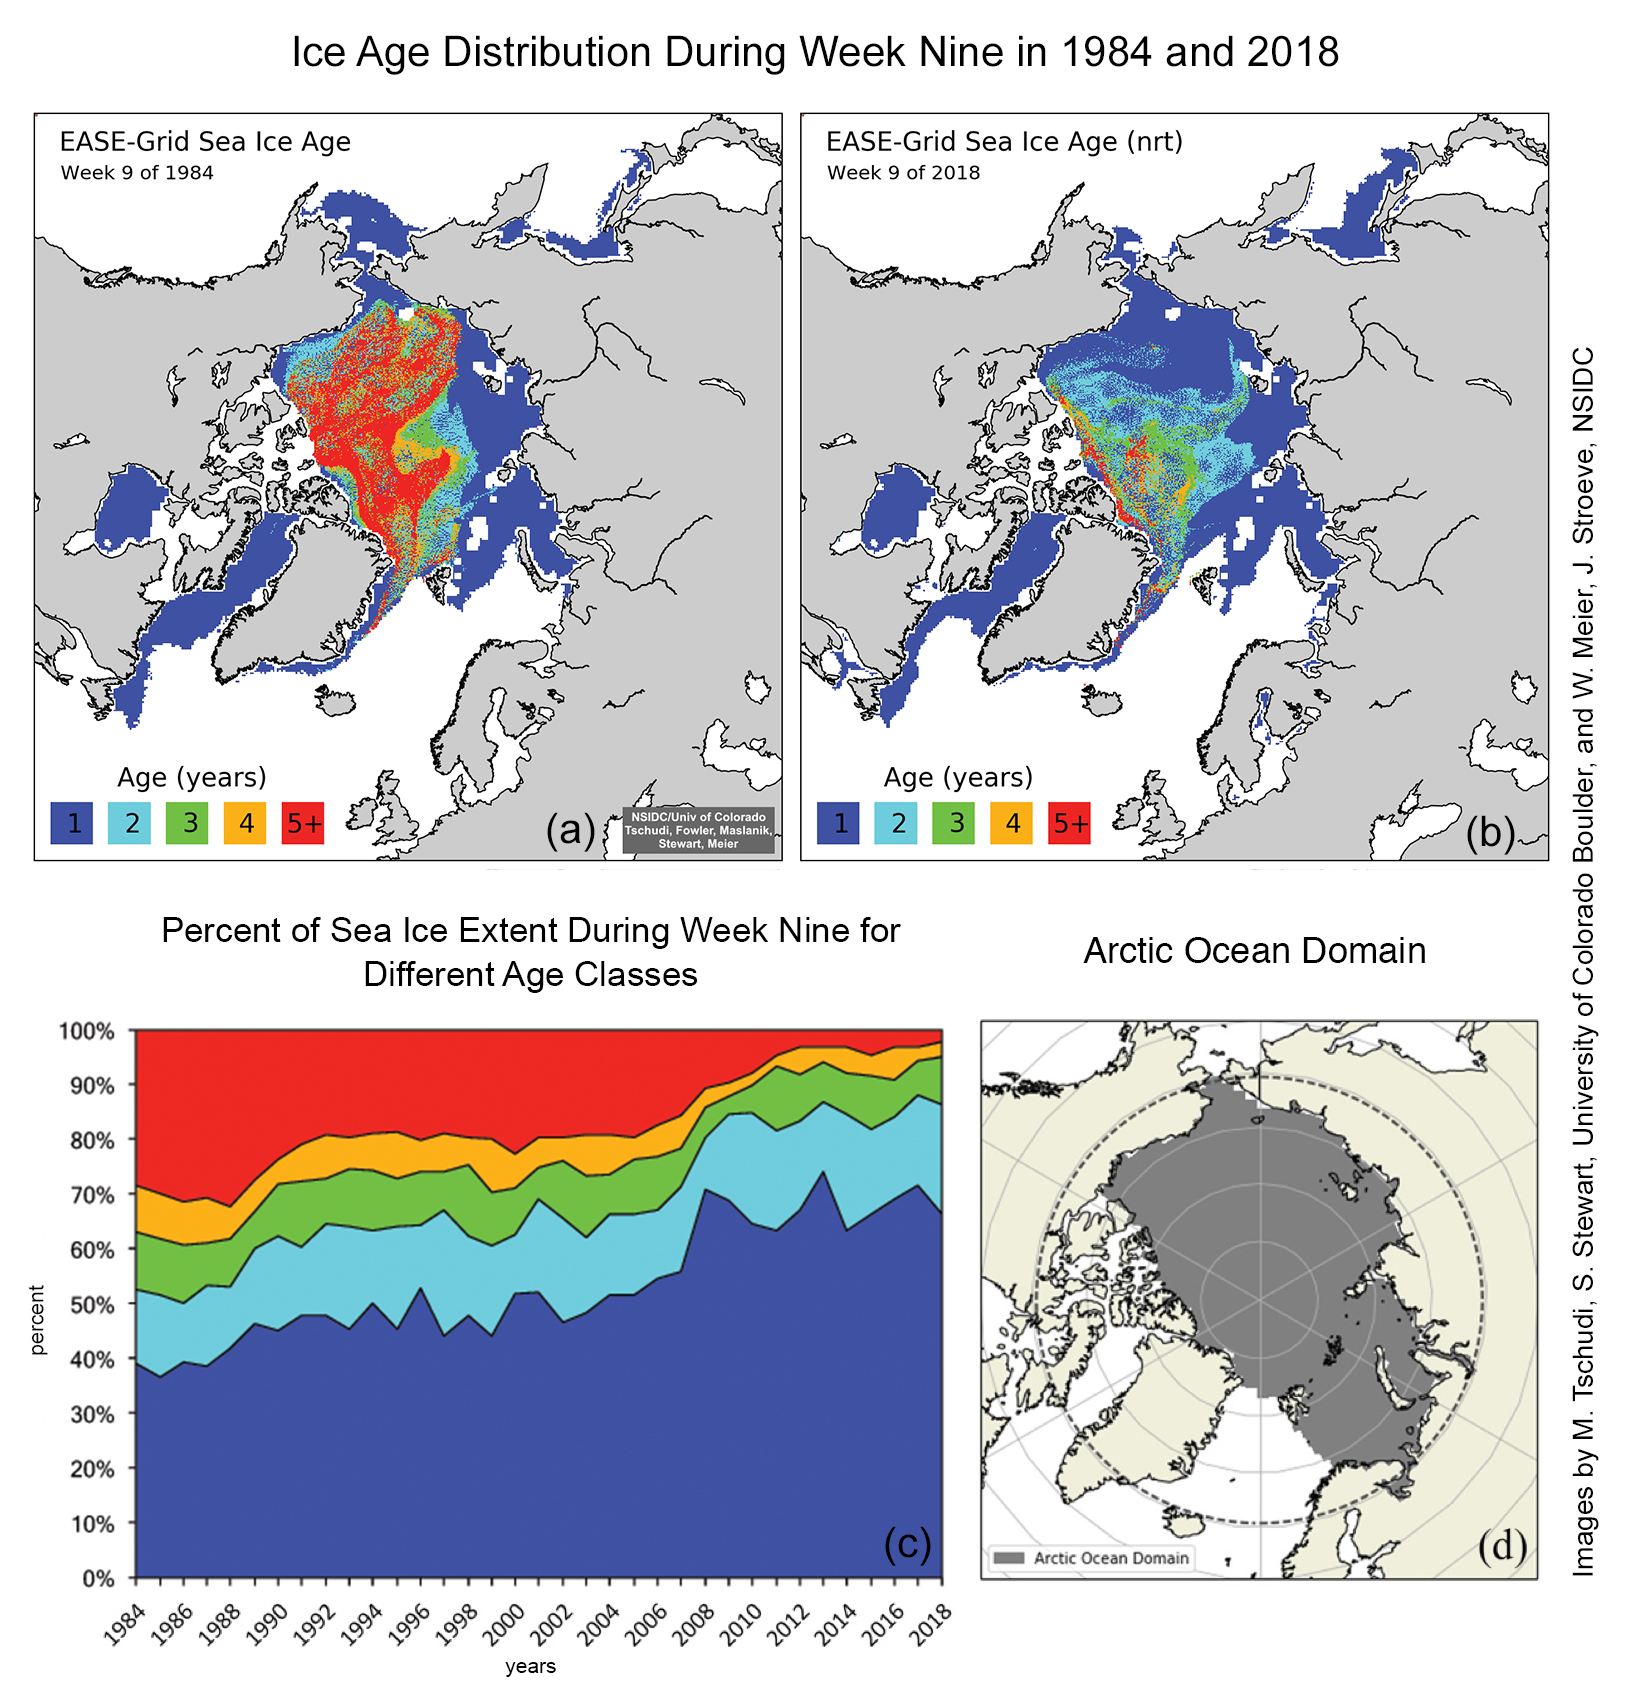
Figure 4a-d. These maps show the ice age distribution during week nine in 1984 (a) and 2018 (b). The time-series (c) shows total sea ice extent for different age classes as is outlined in the Arctic Ocean Domain (d).
Credit: Preliminary analysis courtesy M. Tschudi, University of Colorado Boulder. Images by M. Tschudi, S. Stewart, University of Colorado, Boulder, and W. Meier, J. Stroeve, NSIDC
High-resolution image
An updated assessment of ice age changes in the Arctic through week nine (early March) in 2018 shows a substantial amount of first-year ice within the Beaufort, Chukchi, East Siberian, Laptev, Kara and Barents Seas (Figure 4b). Multiyear ice near the Alaskan and Siberian coast is limited to scattered regions off shore in the Beaufort and Chukchi Seas. A tongue of second- and third-year ice extends from near the pole toward the New Siberian Islands, and a region of second-year ice extends toward Severnaya Zemlya. As averaged over the Arctic Ocean domain (Figure 4d), the multiyear ice cover has declined from 61 percent in 1984 to 34 percent in 2018. In addition, only 2 percent of the ice age cover is categorized as five-plus years, the least amount recorded during the winter period. While the proportion of first-year versus multiyear ice will largely depend on how much ice melted during summer, how much ice is exported out of Fram Strait each winter also plays a role. First-year ice grows to about 1.5 to 2 meters (5 to 6.5 feet) thick over a winter season, while older ice is often 3 to 4 meters (9.8 to 13.1 feet) thick.
Note: The ice age fields originally posted on Thursday, May 3, were incorrect. The ice age field has its “birthday” each September after the minimum, when all of the age values are incremented by one after the end of the summer melt season. For example, first-year ice becomes second-year ice after the minimum, second-year ice becomes third-year ice, and so on. However, in the original post, the near-real-time age fields were not incremented after the 2017 minimum. The ice age fields are now corrected (as of Monday, May 7). However, as these are near-real-time data, minor adjustments may occur during final processing. Final numbers will be available in the next few months.
Is winter warming resulting in less winter ice growth?
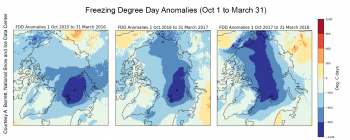
Figure 5a. These maps show the cumulative number of freezing degree day anomalies from the Climate Forecast System version 2 (CFSv2).
Credit: A. Barrett, National Snow and Ice Data Center
High-resolution image
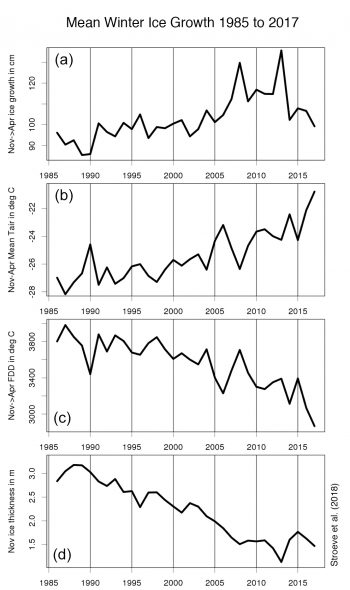
Figure 5b. This time-series (a) from 1985 to 2017 shows the mean winter ice growth (mid-November to mid-April) simulated by the Los Alamos sea ice model (CICE) forced by the National Center for Environmental Prediction (NCEP-2) atmospheric reanalysis. Also shown are the mean 2 meters NCEP-2 air temperature averaged over the Arctic Ocean (b), cumulative freezing degree days (FDDs) (c), and CICE-simulated November ice thickness (d).
See Stroeve et al. (2018) for more details.
High-resolution image
The last three winters have seen air temperatures at the North Pole surge above 0 degrees Celsius (32 degrees Fahrenheit). While heat transport associated with individual storms can result in high air temperatures persisting over several days, a more important metric in regard to how winter warming impacts the sea ice cover is the cumulative number of freezing degree days. This is defined as the number of days below freezing multiplied by the magnitude of the temperatures below the freezing point. Widespread reductions in the total number of freezing degree days (as compared to average) are apparent for the last three winters, being most pronounced this past winter (Figure 5a).
Previous studies evaluated how the low number of cumulative freezing degree days in the 2015 to 2016 winter over the Barents and Kara Seas impacted the ice thickness and sea ice extent in that region. A newer study looks at the effects of warm winters for a larger area. NSIDC scientist Julienne Stroeve found that in response to the warm winter of 2016 to 2017, ice growth over the Arctic Ocean was likely reduced by 13 centimeters (5 inches). Generally, one does not expect variations in winter air temperature to have a significant impact on winter ice growth—temperatures still generally remain well below freezing and the rate at which ice grows (thickens) is greater for thin ice than thick ice. Thus, despite an overall increase in winter air temperatures, thermodynamic ice growth over winter has generally increased in tandem with thinning at the end of summer (Figure 5b). However, since 2012, this relationship appears to be changing. Overall winter ice growth in the 2016 to 2017 winter was similar to that in 2003, despite having a mean November ice thickness well below that seen in 2003. A similar analysis is not yet available for the 2017 to 2018 winter, but given the very warm conditions, it is likely that thermodynamic ice growth was reduced compared to average.
Unusual polynya opening north of Greenland
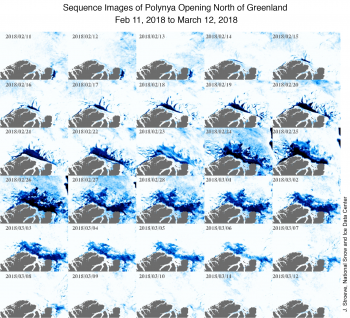
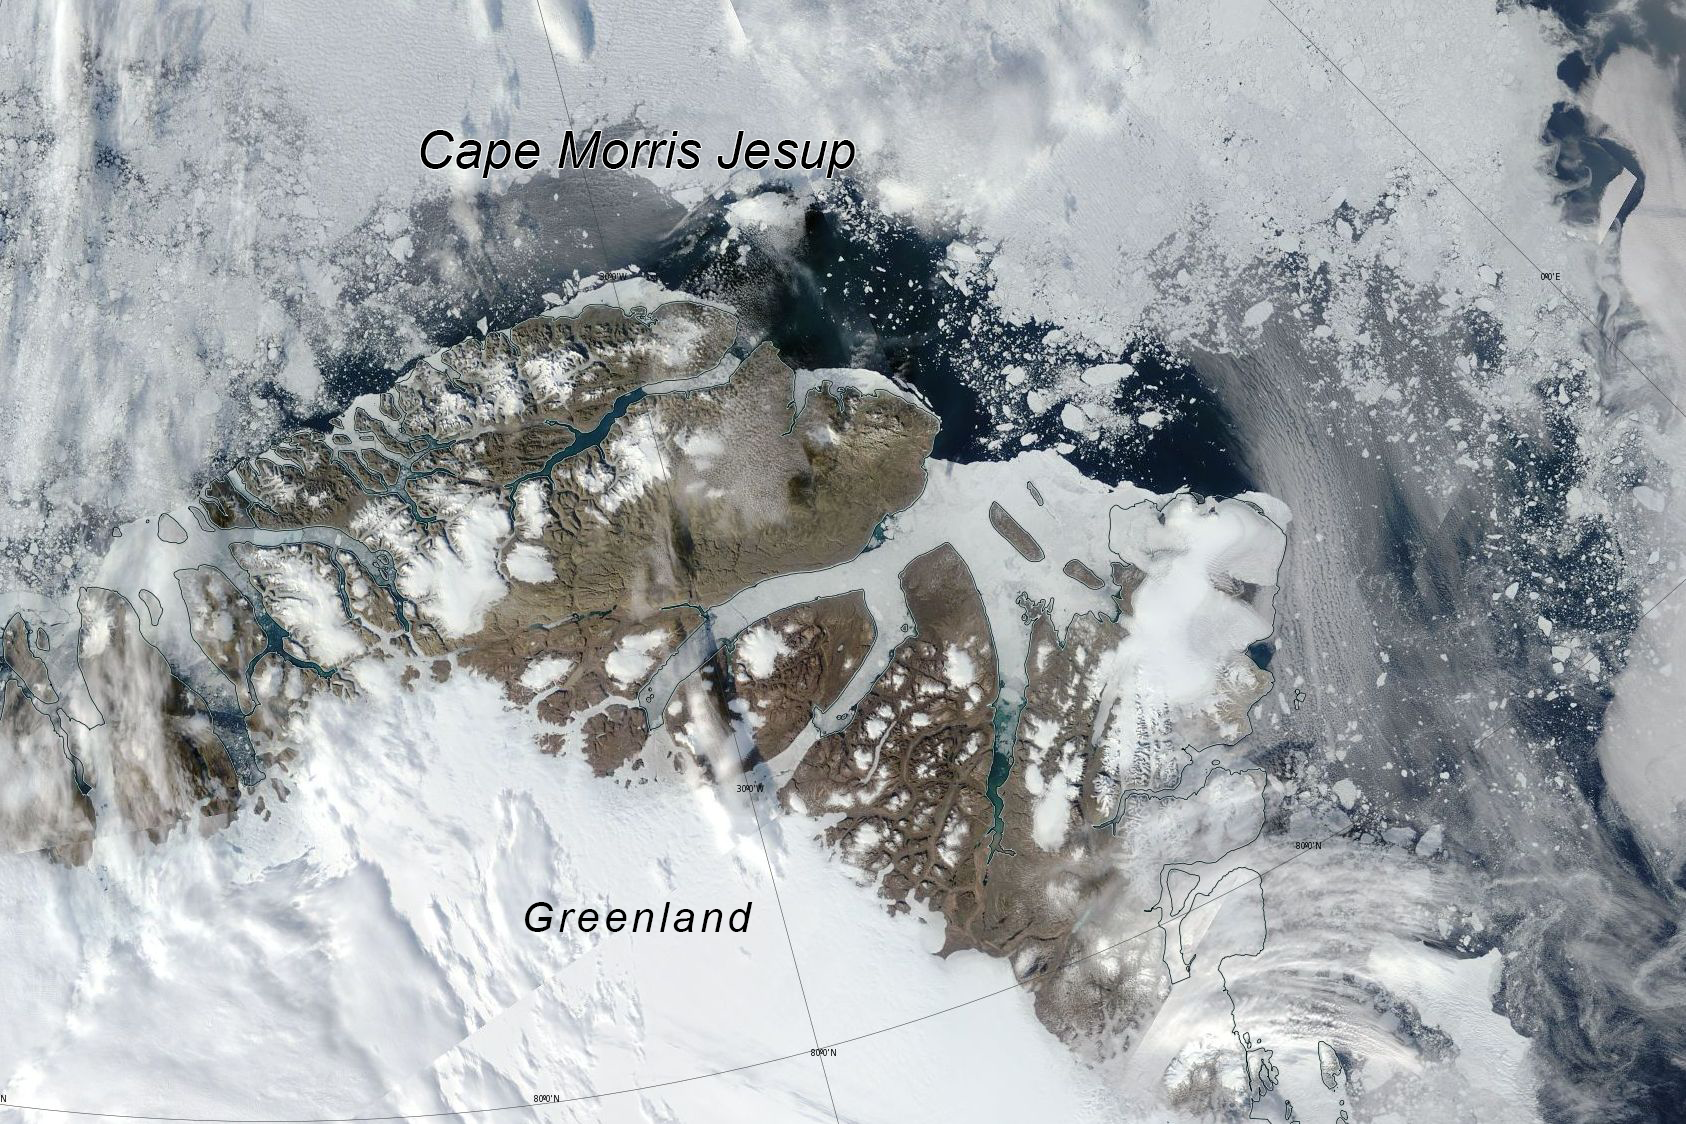
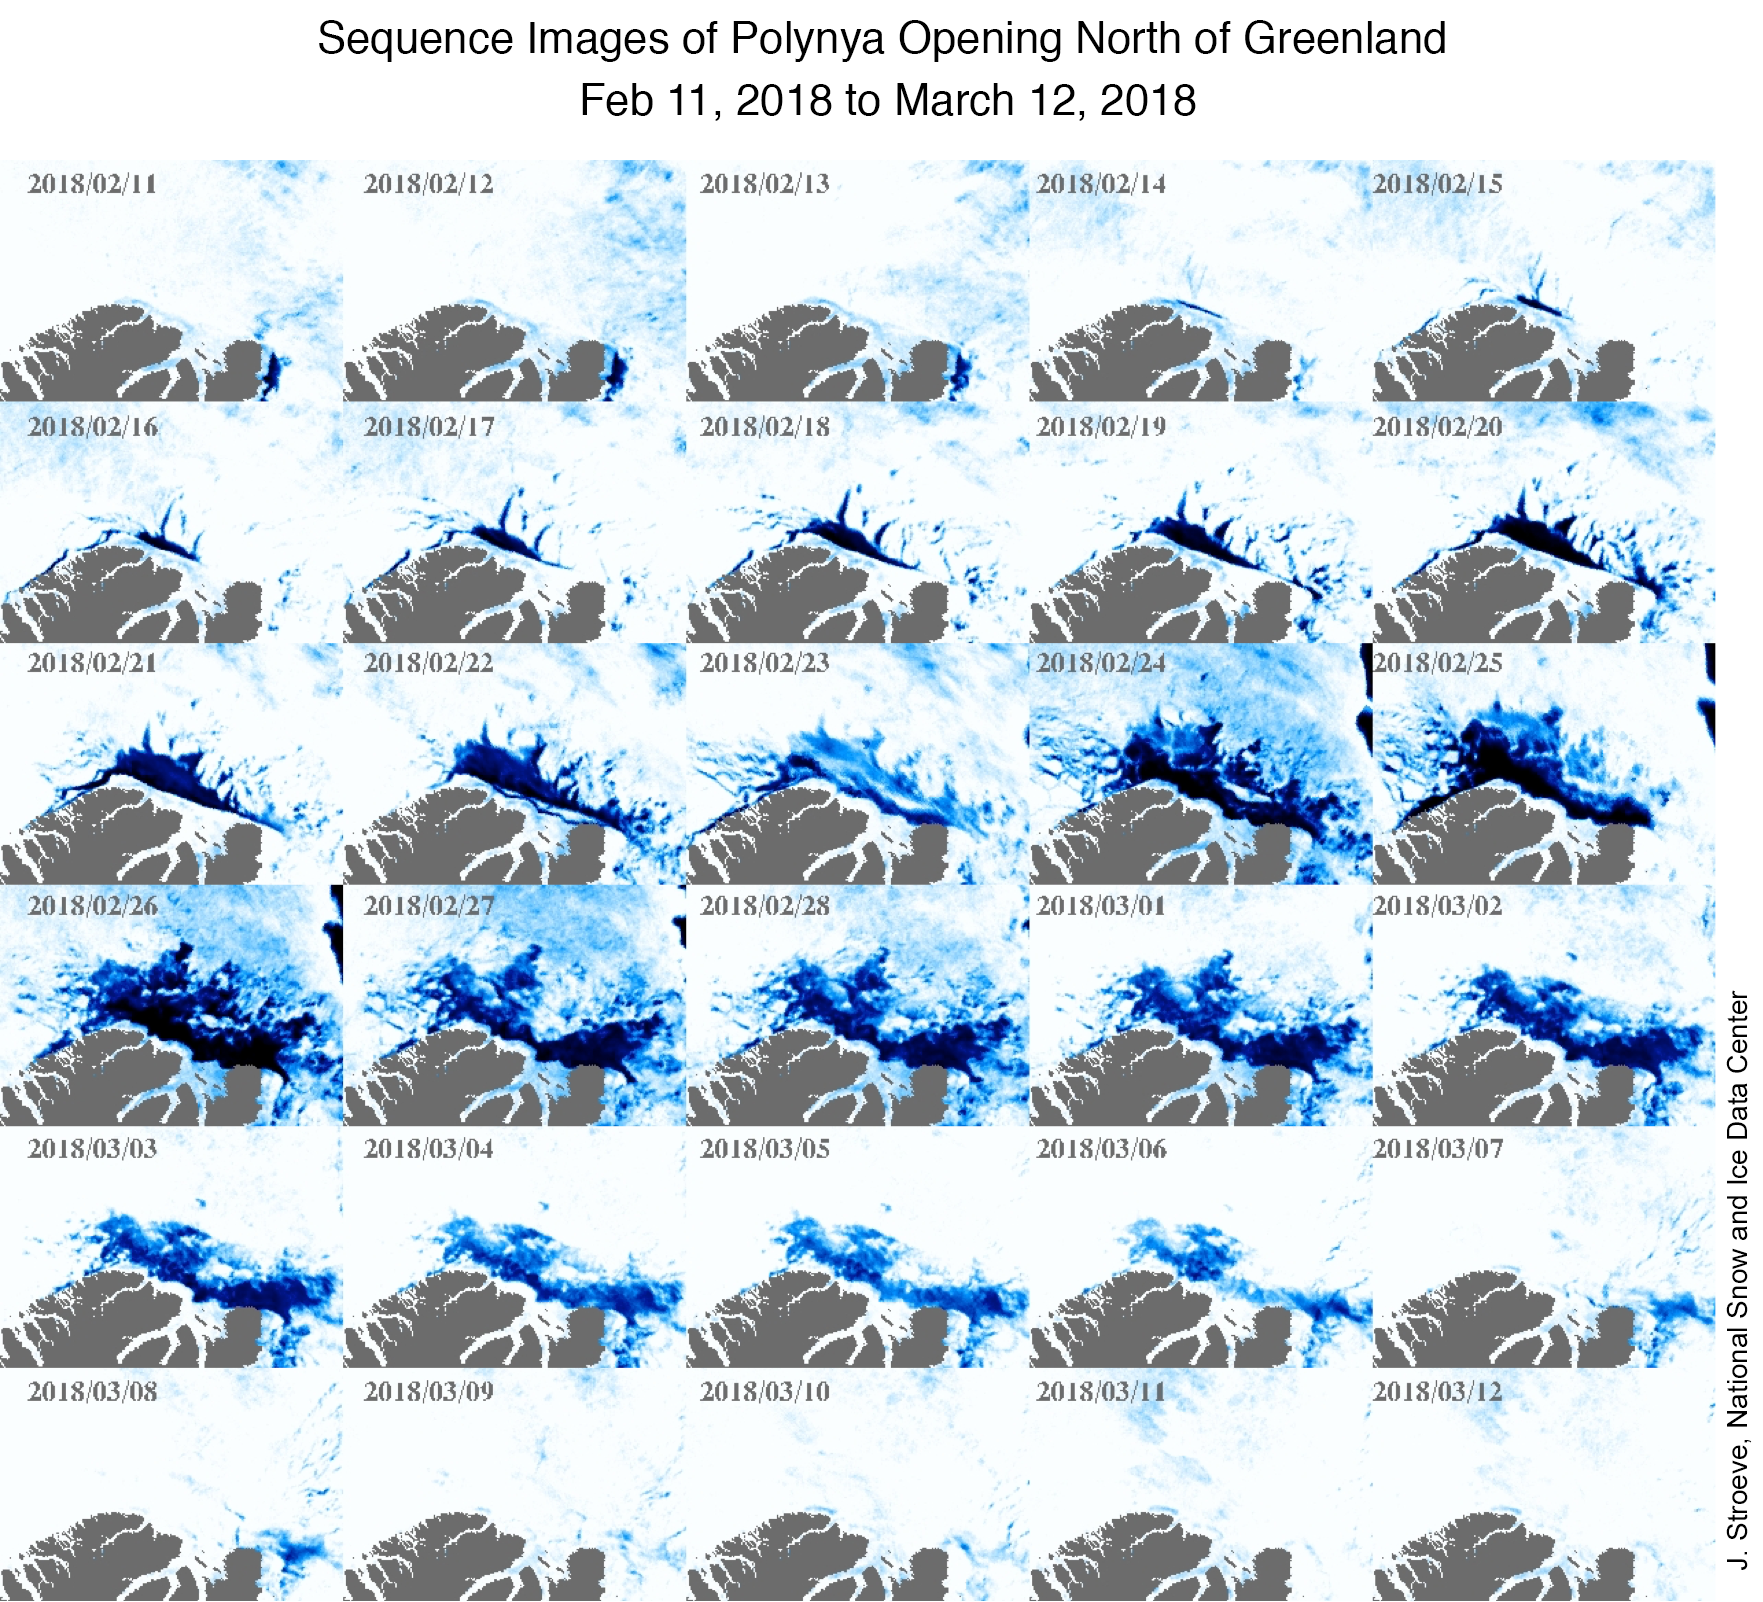
Figure 6a. This sequence of high-resolution images from the NASA Advanced Microwave Scanning Radiometer 2 (AMSR2) show the formation of a large polynya north of Greenland.
Credit: J. Stroeve, National Snow and Ice Data Center
High-resolution image
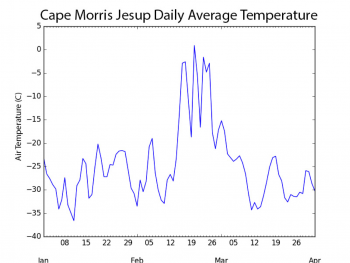
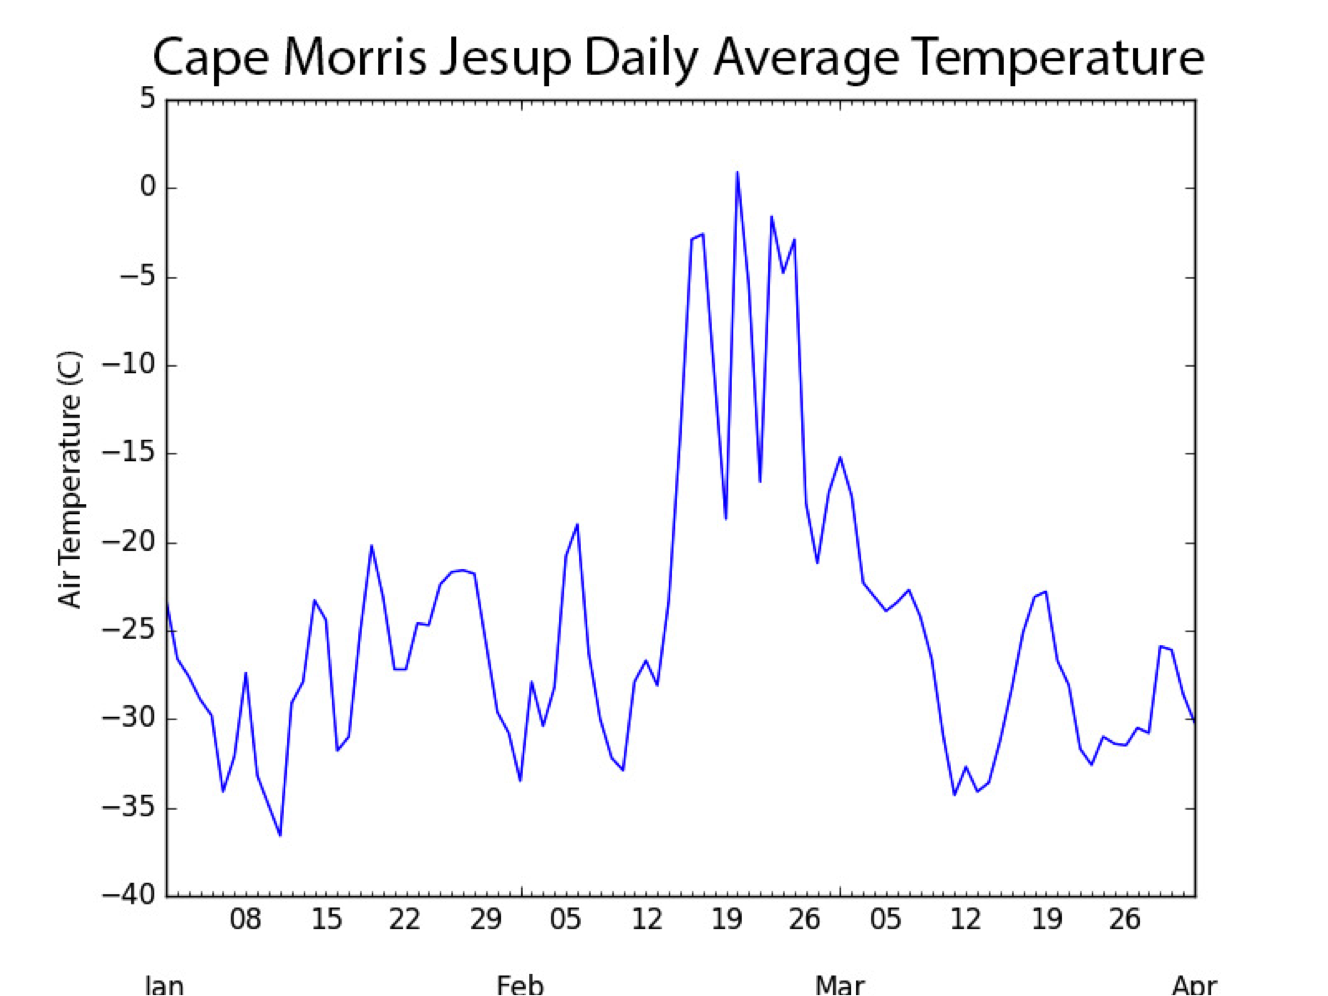
Figure 6b. This graph shows average daily temperatures at Cape Morris Jesup, Greenland’s northernmost station.
Credit: J. Stroeve, National Snow and Ice Data Center
High-resolution image
During the middle of February, a large polynya opened north of Greenland and persisted through the first week of March (Figure 6a). Development of the polynya was driven in part by strong winds from the south and unusually high air temperatures. On February 24, during the peak of the polynya opening, air temperatures at Cape Morris Jesup, Greenland’s northernmost station, surged well above freezing, reaching 6.1 degrees Celsius (43 degrees Fahrenheit), while the daily average temperature hovered just above freezing (Figure 6b). Such periods of extremely warm winter temperatures have been unusual since the beginning of the Cape Morris Jesup record in 1981. During the month of February, only a few years exhibited hourly air temperatures rising above 0 degrees Celsius (32 degrees Fahrenheit): once in 1997, five times in 2011, seven in 2017 and 59 times in 2018.
References
Beitsch, A., L. Kaleschke, and S. Kern. 2014. Investigating high-resolution AMSR2 sea ice concentrations during the February 2013 fracture event in the Beaufort Sea. Remote Sensing 6, 3841-3856, doi.org/10.3390/rs6053841.
Boisvert, L.N., A.A. Petty, and J. Stroeve. 2016. The impact of the extreme winter 2015/16 Arctic cyclone on the Barents–Kara Seas, Bulletin of the American Meteorological Society, doi:10.1175/MWR-D-16-0234.1.
Ricker, R., S. Hendricks, F. Girard-Ardhuin, L. Kaleschke, C. Lique, X. Tian-Kunze, M. Nicolaus, and T. Krumpen. 2017a. Satellite observed drop of Arctic sea ice growth in winter 2015-2015, Geophysical Research Letters, doi:10.1002/2016GL072244.
Stroeve, J., D. Schroeder, M. Tsamados, and D. Feltham. 2018. Warm winter, thin ice? The Cryosphere, doi:10.5194/tc-2017-287, accepted.
Further reading
Thompson, A. “Shock and thaw—Alaskan sea ice just took a steep, unprecedented dive.” Scientific American. https://www.scientificamerican.com/article/shock-and-thaw-alaskan-sea-ice-just-took-a-steep-unprecedented-dive.
Hansen, K. “Historic low sea ice in the Bering Sea.” NASA Earth Observatory. https://earthobservatory.nasa.gov/IOTD/view.php?id=92084.


