The seasonal decline in Arctic sea ice extent from mid-July onward has proceeded at a near average pace. Extent is currently well below average, but above that observed for recent years. Extent is particularly low in the Laptev Sea sector, but ice extends to near the shore further east. Depending on weather conditions, the southern route through the Northwest Passage may become open. An area of low concentration ice persists over the central Arctic Ocean, extending to near the North Pole, and Antarctic ice extent is still at a record low.
Overview of conditions
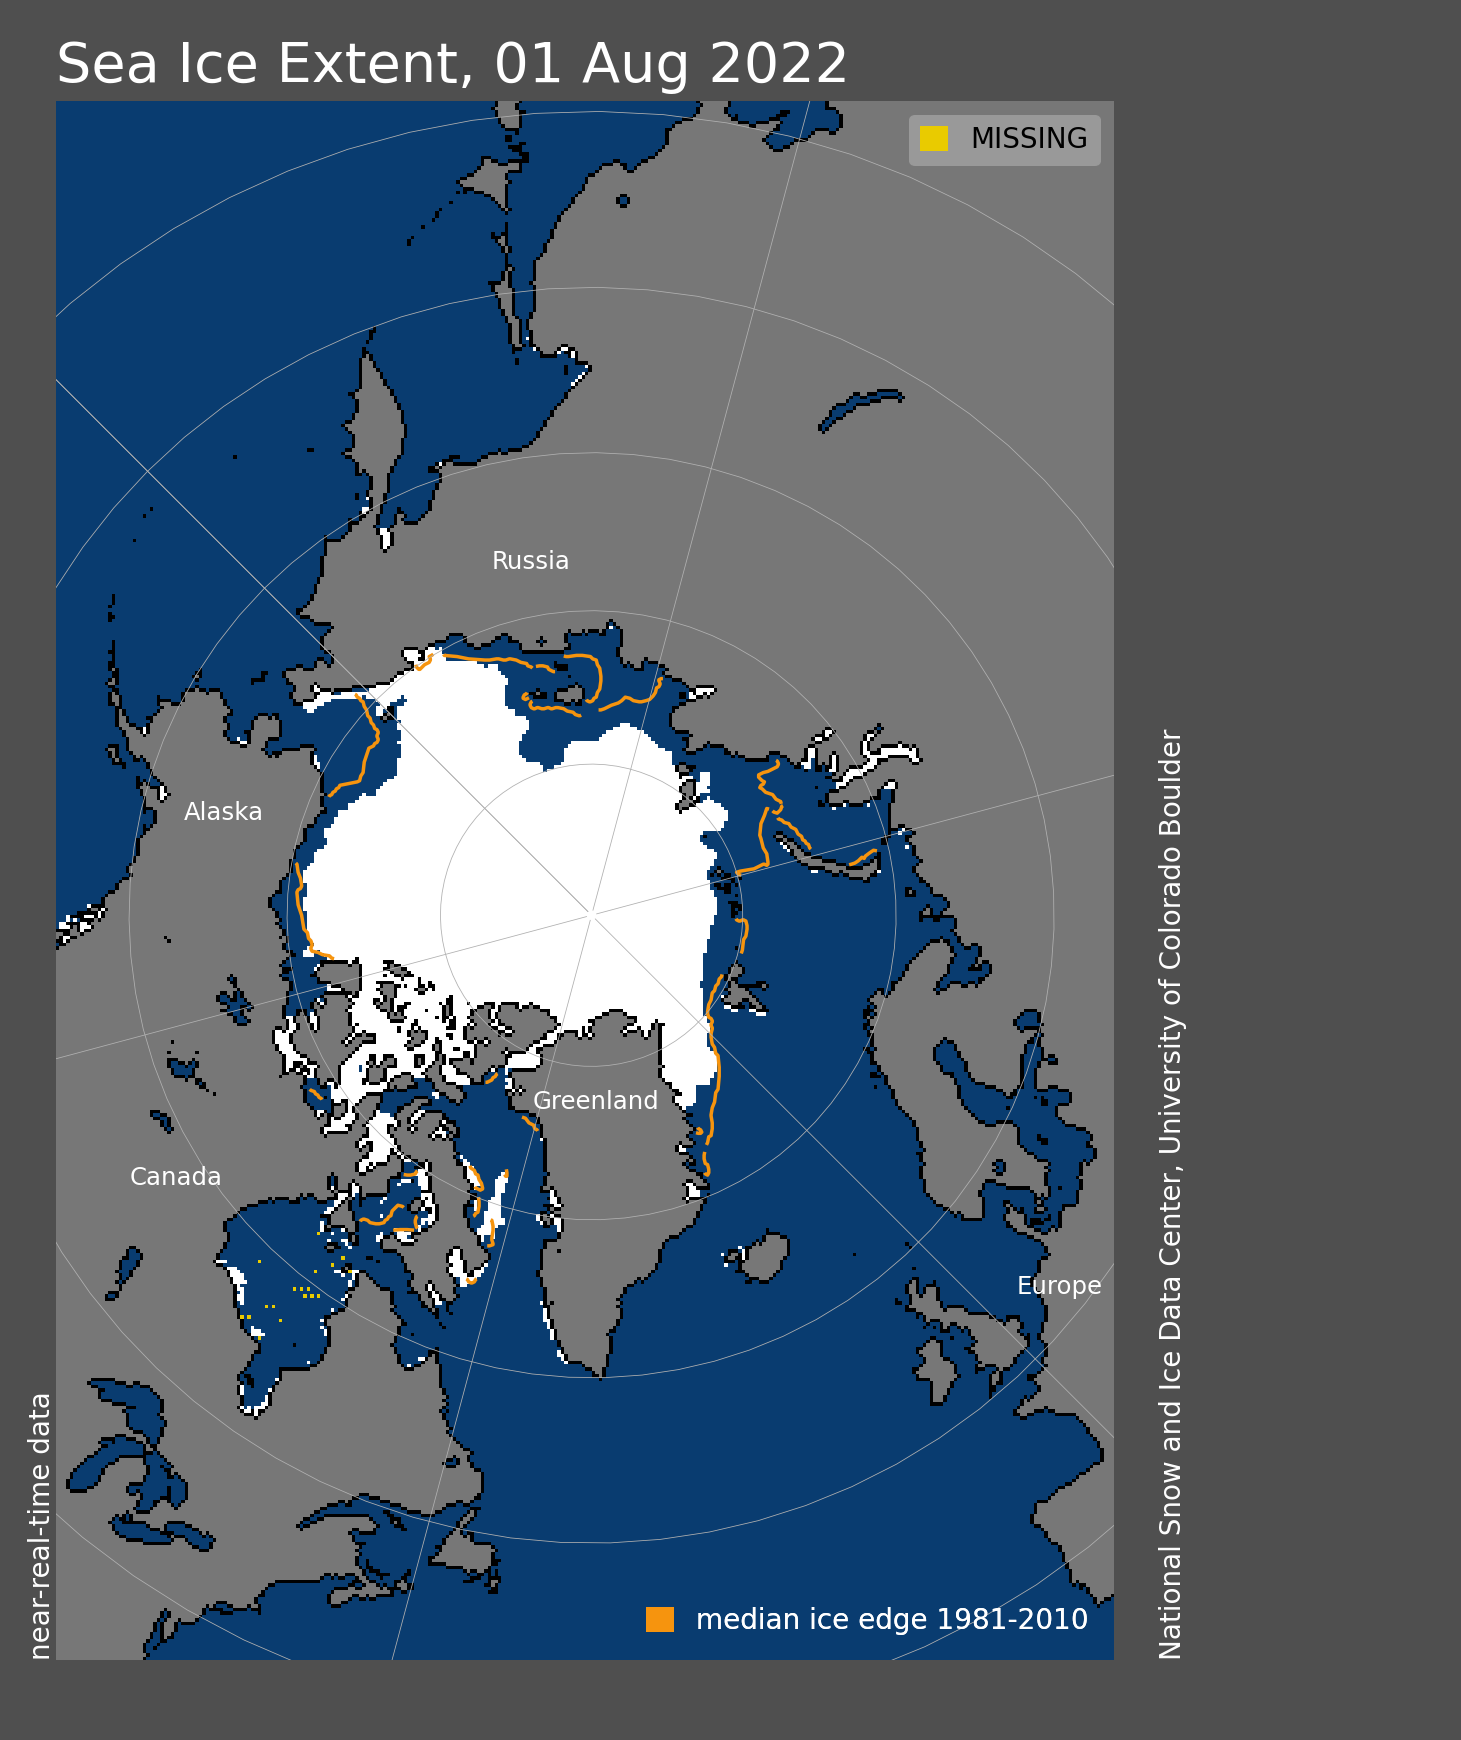
Figure 1a. Arctic sea ice extent for August 1, 2022 was 6.99 million square kilometers (2.70 million square miles). The orange line shows the 1981 to 2010 average extent for that day. Sea Ice Index data. About the data
Credit: National Snow and Ice Data Center
High-resolution image
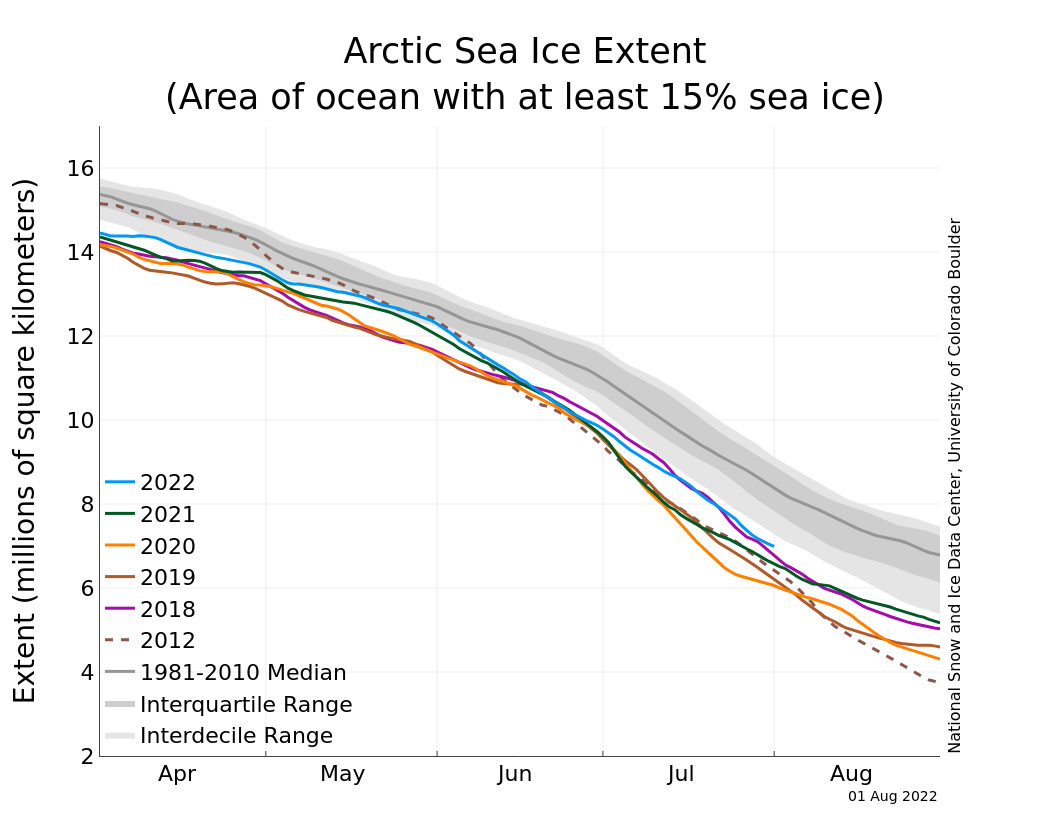
Figure 1b. The graph above shows Arctic sea ice extent as of August 1, 2022, along with daily ice extent data for four previous years and the record low year. 2022 is shown in blue, 2021 in green, 2020 in orange, 2019 in brown, 2018 in magenta, and 2012 in dashed brown. The 1981 to 2010 median is in dark gray. The gray areas around the median line show the interquartile and interdecile ranges of the data. Sea Ice Index data.
Credit: National Snow and Ice Data Center
High-resolution image

Figure 1c. This figure shows ice motion vectors at 62.5-kilometer spatial resolution from July 19 to 21, 2022, based on passive and active microwave satellite data from the European Organization for the Exploitation of Meteorological Satellites Ocean and Sea Ice Satellite Application Facilities low-resolution sea ice drift product. Strong on-shore ice motion during the third week of July in part explains the persistence of sea ice in the East Siberian Sea.
Credit: European Organization for the Exploitation of Meteorological Satellites Ocean and Sea Ice Satellite Application Facilities
High-resolution image
As of August 1, Arctic sea ice extent stood at 6.99 million square kilometers (2.70 million square miles) (Figure 1a). The decline rate of the extent through the second half of July was near the 1981 to 2010 average. Extent on August 1, while well below the 1981 to 2010 average, was the highest since 2014 and overall was twelfth lowest in the satellite record (Figure 1b). The average extent for the month of July as a whole was 8.25 million square kilometers (3.19 million square miles), the twelfth lowest in the satellite record.
As previously reported in our mid-July post, a notable aspect of this summer so far is the substantial amount of open water along the Eurasia Coast in the Laptev Sea sector. However, by sharp contrast, ice is extensive further east in the East Siberian Sea, extending to near the shore. Strong on-shore ice motion during the third week of July in part explains the persistence of sea ice in this region (Figure 1c). Extent continues to be below average in the Barents Sea. The area of low concentration ice over the central Arctic Ocean extending to near the pole persists.
While Russia makes use of the Northern Sea route year-round, over the past decade, this coastal route has become nearly or completely ice-free in late summer. Given the extensive ice in the East Siberian Sea, it seems unlikely that this will be the case in 2022. By contrast, as assessed from Advanced Microwave Scanning Radiometer 2 (AMSR2) satellite data, the southern route through the Northwest Passage, known as Amundsen’s route, may open in the next few weeks, depending on weather conditions.
Conditions in context
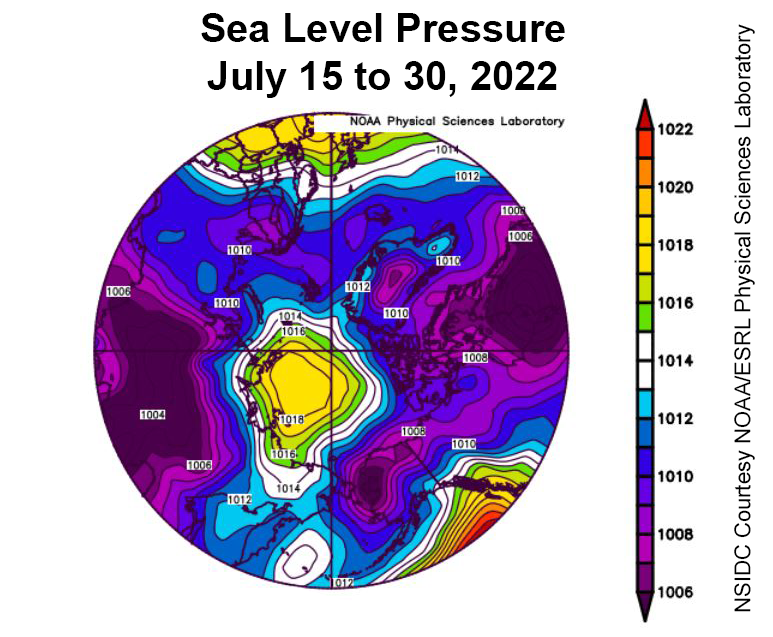
Figure 2a. This plot shows average sea level pressure in the Arctic in millibars from July 15 to July 30, 2022. Yellows and reds indicate high air pressure; blues and purples indicate low pressure.
Credit: NSIDC courtesy NOAA Earth System Research Laboratory Physical Sciences Laboratory
High-resolution image
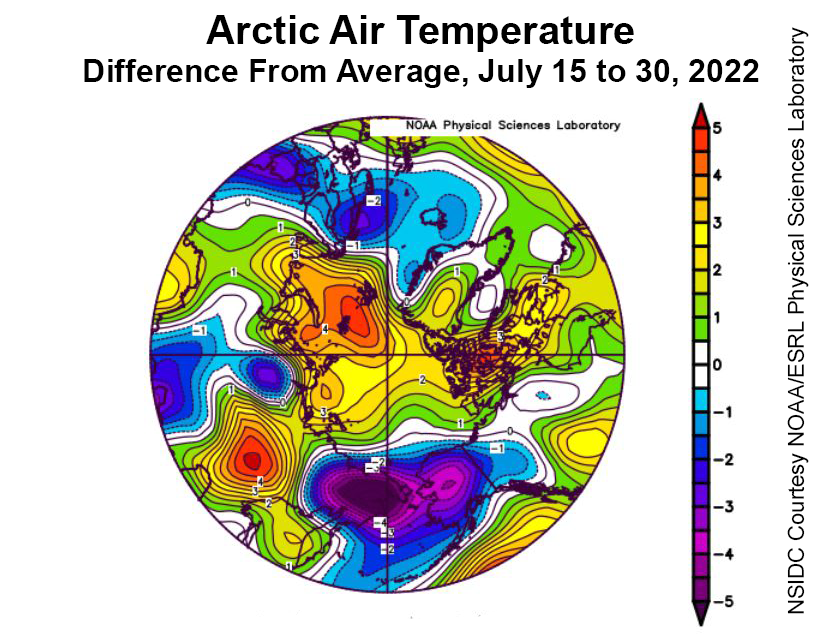
Figure 2b. This plot shows the departure from average air temperature, relative to the 1981 to 2020 reference period, in the Arctic at the 925 hPa level, in degrees Celsius, from July 15 to July 30, 2022. Yellows and reds indicate higher than average temperatures; blues and purples indicate lower than average temperatures.
Credit: NSIDC courtesy NOAA Earth System Research Laboratory Physical Sciences Laboratory
High-resolution image
The second half of July saw a shift in weather patterns. While the average sea level pressure pattern for the first half of the month featured a distinct area of low pressure centered over the central Arctic Ocean near the North Pole, the pattern for the second half of the month was one of high pressure (an anticyclone) centered north of the Laptev Sea, with low pressure centered near the Bering Strait between eastern Russia and Alaska (Figure 2a). This shift explains both the below average temperatures at the 925 mb level (about 2,500 feet above the surface) over the East Siberian Sea, where the implied winds between the high and low pressures have a component from the north, and the above average temperature north of the Barents Sea, where the implied winds on the eastern side of the anticyclone have an offshore component (Figure 2b).
July 2022 compared to previous years
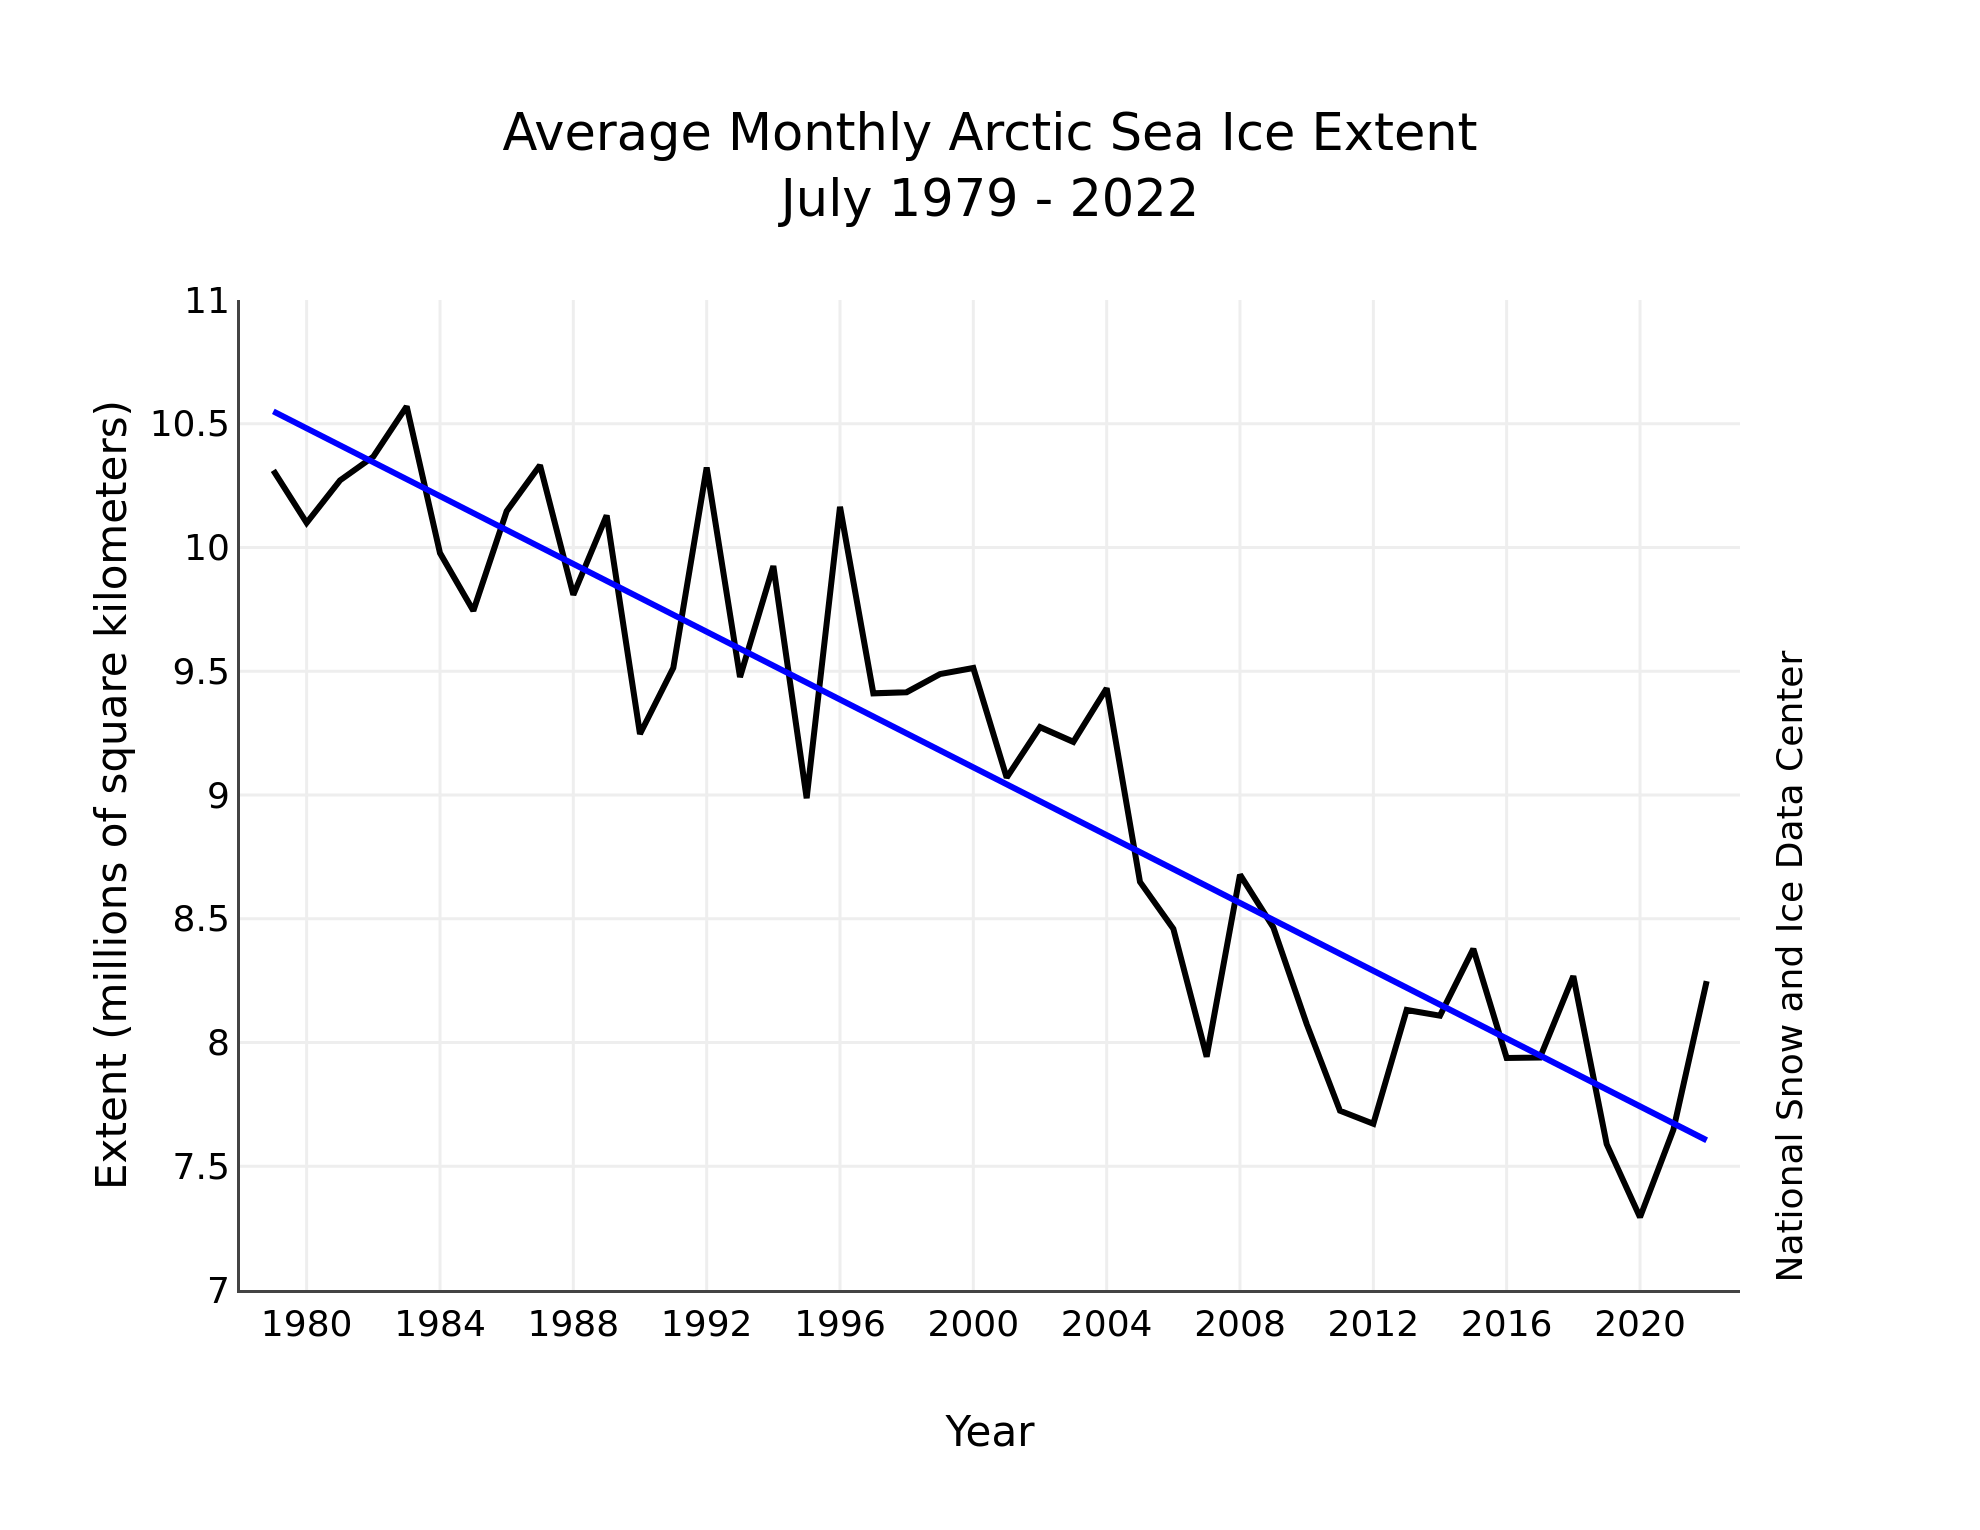
Figure 3. Monthly July ice extent for 1979 to 2022 shows a decline of 7.2 percent per decade.
Credit: National Snow and Ice Data Center
High-resolution image
Looking at the month as a whole, July sea ice extent declined by 2.42 million square kilometers (930,000 square miles), or at a rate of 78,100 square kilometers (30,200 square miles) per day, which was near the 1981 to 2010 average. This resulted in the average July extent ranking twelfth lowest in the satellite record. The downward linear trend in July sea ice extent over the 44-year-satellite record is 68,500 square kilometers (26,400 square miles) per year, or 7.2 percent per decade relative to the 1981 to 2010 average (Figure 3).
Antarctic sea ice
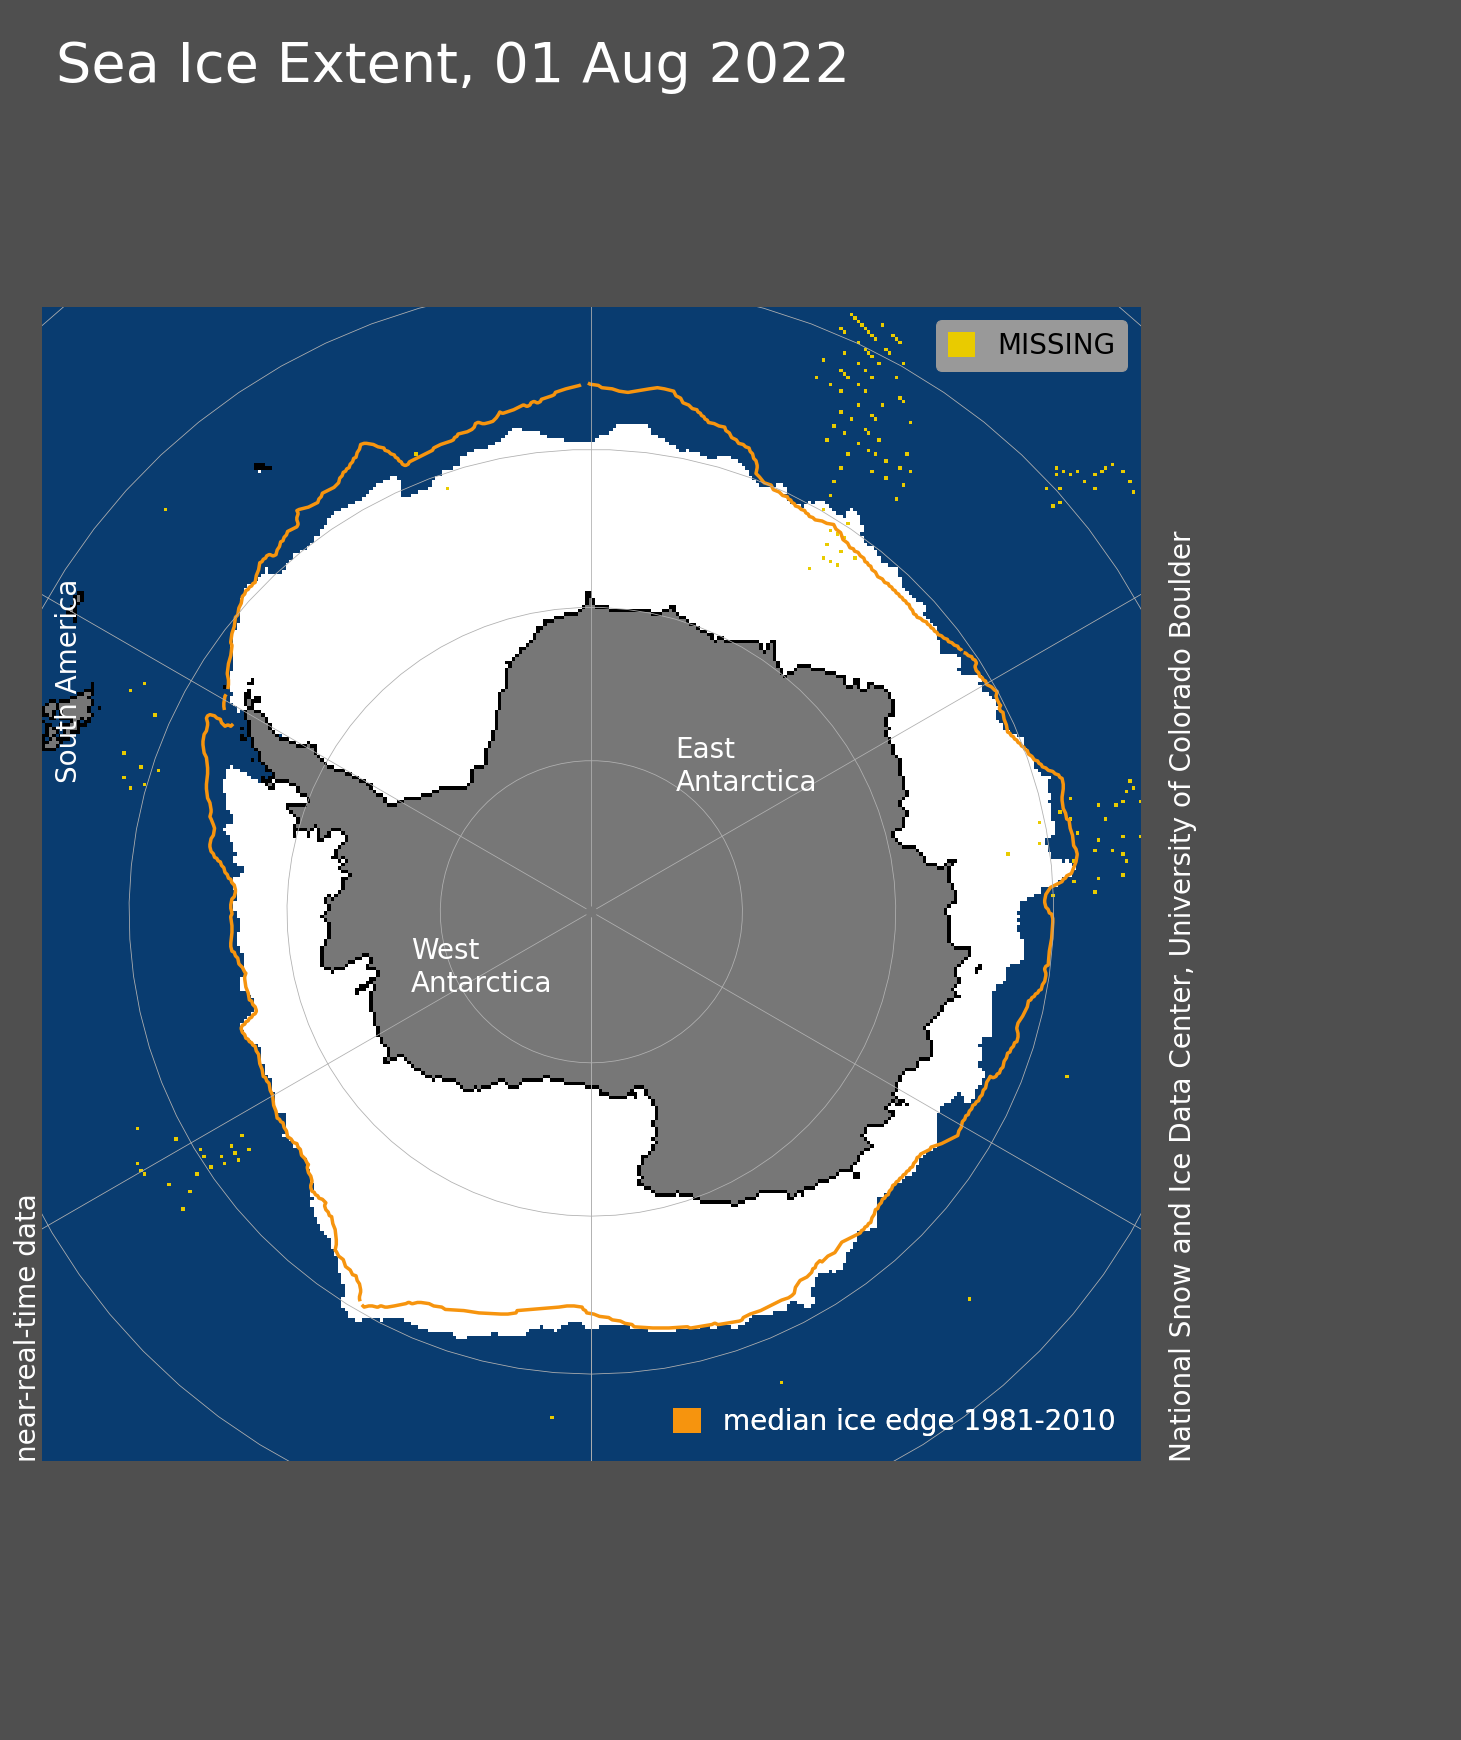
Figure 4. Antarctic sea ice extent for August 1, 2022 was 15.90 million square kilometers (6.14 million square miles). The orange line shows the 1981 to 2010 average extent for that day. Sea Ice Index data. About the data
Credit: National Snow and Ice Data Center
High-resolution image
As of this report, Antarctic sea ice extent persists at record low levels, with regional low ice extent along the Weddell Sea at its northern ice edge, much of the East Antarctic coast, and the Bellingshausen Sea. The summer has been marked by a strong Amundsen Sea Low, which tends to drive warmer air from the northwest across the Peninsula and into the northern Weddell Sea. A high pressure tendency over Queen Maud Land is also acting to bring warm air from the north across the eastern end of the Weddell Sea ice cover. Overall, conditions on the continent and adjacent seas are far warmer than is typical, with regions near the Peninsula up to 5 degrees Celsius (9 degrees Fahrenheit) above average for May through July, and temperatures in the Weddell Sea between 3 to 7 degrees Celsius (5 to 13 degrees Fahrenheit) above average. Above average temperatures extend across most of the continent and East Antarctic coast, where conditions are 1 to 4 degrees Celsius (2 to 7 degrees Fahrenheit) above average. Only the northern Ross Sea has significantly below average temperatures, of around 4 degrees Celsius (7 degrees Fahrenheit) below average.
A recent paper by our colleagues John Turner and others from British Antarctic Survey, along with co-authors from India and the U.S., looks at the conditions that led to the record low sea ice extent observed in February of this year. Overall, the authors attribute the low sea ice conditions to a combination of large-scale circulation patterns, including La Niña and a strong Amundsen Sea Low, and the impacts of severe regional storms moving ice away from the coast and into warmer waters and greater sunlight.
Effects of Arctic ozone depletion
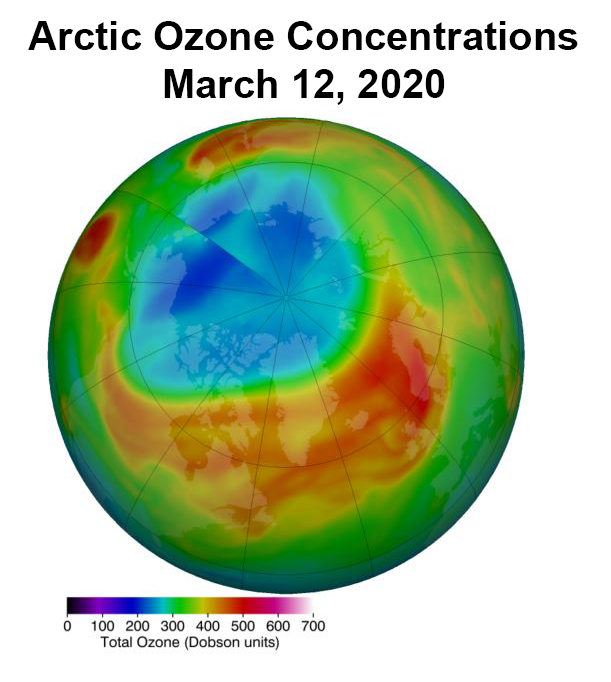
Figure 5. This figure shows record low Arctic ozone concentrations observed on March 12, 2020.
Credit: NASA Goddard Earth Observing System data assimilation system (DAS).
High-resolution image
While the Antarctic ozone hole that develops in austral spring is well known, stratospheric ozone depletion can also occur in the Arctic, though to a lesser extent. A recent study by Marina Friedel and colleagues, based on both observations and models, finds that springtime stratospheric ozone depletion over the Arctic is consistently followed by surface temperature and precipitation anomalies consistent with a positive Arctic Oscillation, an atmospheric pattern known to have significant impacts on climate conditions over the parts of the Northern Hemisphere as well as the Arctic. The authors argue that this is because ozone depletion leads to a reduction in short-wave radiation absorption, causing persistent negative temperature anomalies in the lower stratosphere and a delayed break up of the stratospheric polar vortex. When the Arctic Oscillation is positive, sea level air pressure is lower than average over the North Pole and higher than average over the mid-latitudes. This pressure pattern helps to keep cold air in the Arctic and favors warmer temperatures over the mid-latitudes. In 2020, Arctic ozone concentrations reached a record low on March 12 of 205 Dobson Units (Figure 5) compared to an average value of 240 Dobson Units for this time of year. At the same time, the Arctic Oscillation index reached a record high positive value. As a result, central and northern Europe were exceptionally warm and dry in spring 2020, whereas wet and cold conditions prevailed in the Arctic.
Further reading
Friedel, M., G. Chiodo, A. Stenke, et al. 2022. Springtime arctic ozone depletion forces northern hemisphere climate anomalies. Nature Geoscience. doi:10.1038/s41561-022-00974-7.
Lavergne, T., S. Eastwood, Z. Teffah, H. Schyberg, and L.-A. Breivik. 2010. Sea ice motion from low resolution satellite sensors: an alternative method and its validation in the Arctic. Journal of Geophysical Research. doi:10.1029/2009JC005958.
Turner, J., C. Holmes, T. Caton Harrison, T. Phillips, B. Jena, T. Reeves-Francois, R. Fogt, E. R. Thomas, C. C. Bajish. 2022. Record low Antarctic sea ice cover in February 2022. Geophysical Research Letters. doi:10.1029/2022GL098904.

