After reaching its seasonal maximum extent of 14.88 million square kilometers (5.75 million square miles) on February 25, the seasonal decline in Arctic sea ice extent through March proceeded in fits and starts. By the end of the month, extent saw little change, ending up at 14.50 million square kilometers (5.60 million square miles). The middle of March saw excitement, with several extreme warm events over the Arctic Ocean associated with large transports of water vapor into the region. The Antarctic region also experienced unusual warmth and break up of a small ice shelf.
Overview of conditions

Figure 1. Arctic sea ice extent for March 2022 was 14.59 million square kilometers (5.63 million square miles). The magenta line shows the 1981 to 2010 average extent for that month. Sea Ice Index data. About the data
Credit: National Snow and Ice Data Center
High-resolution image
Average Arctic sea ice extent for March 2022 was 14.59 million square kilometers (5.63 million square miles), ranking ninth lowest in the satellite record (Figure 1a). The 2022 March extent was 840,000 square kilometers (324,000 square miles) below the 1981 to 2010 average. While extent tracked below the interdecile range of the satellite record throughout the entire month, the total decline, after a series of small ups and downs, was only 250,000 square kilometers (96,500 square miles). Following the pattern seen in February, sea ice extent was below average in the Sea of Okhotsk. Extent in the Bering, Barents, and East Greenland Seas was near average for March.
Conditions in context
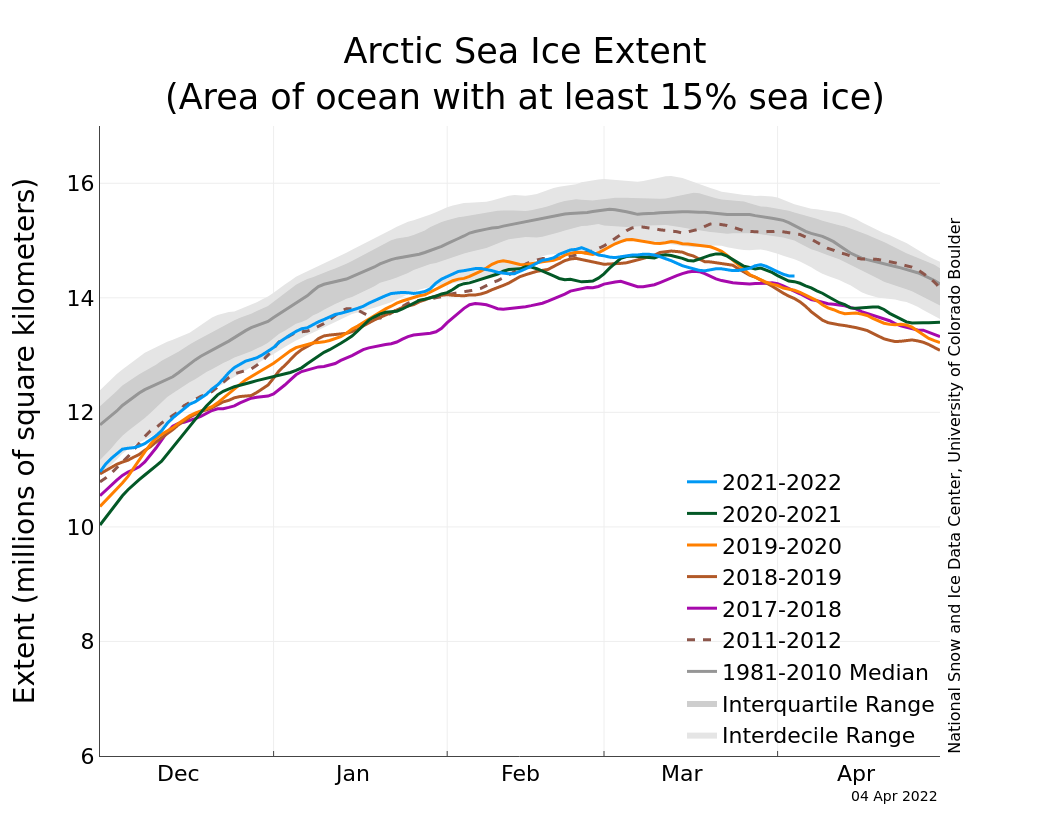
Figure 2a. The graph above shows Arctic sea ice extent as of April 4, 2022, along with daily ice extent data for four previous years and the record low year. 2021 to 2022 is shown in blue, 2020 to 2021 in green, 2019 to 2020 in orange, 2018 to 2019 in brown, 2017 to 2018 in magenta, and 2011 to 2012 in dashed brown. The 1981 to 2010 median is in dark gray. The gray areas around the median line show the interquartile and interdecile ranges of the data. Sea Ice Index data.
Credit: National Snow and Ice Data Center
High-resolution image

Figure 2b. This plot shows the departure from average air temperature in the Arctic at the 925 hPa level, in degrees Celsius, for March 2022. Yellows and reds indicate higher than average temperatures; blues and purples indicate lower than average temperatures.
Credit: NSIDC courtesy NOAA Earth System Research Laboratory Physical Sciences Laboratory
High-resolution image

Figure 2c. This plot shows average sea level pressure in the Arctic in millibars for March 2022. Yellows and reds indicate high air pressure; blues and purples indicate low pressure.
Credit: NSIDC courtesy NOAA Earth System Research Laboratory Physical Sciences Laboratory
High-resolution image
Counter to what might be expected given the very slow rate of sea ice loss over the month as a whole, air temperatures at the 925 millibar level (about 2,500 feet above the surface) were above average over all of the Arctic Ocean (Figure 2b). March temperatures were up to 9 degrees Celsius (16 degrees Fahrenheit) higher than average north of the Canadian Arctic Archipelago, up to 6 degrees Celsius (11 degrees Fahrenheit) above average in the East Siberian Sea, but up to 5 degrees Celsius (9 degrees Fahrenheit) above average over a wide area. The key features of the sea level pressure pattern were high pressure (an anticyclone) over the central Arctic Ocean, a trough of low pressure extending into the Barents Sea, and an unusually high pressure over Northern Europe (Figure 2c). While having an anticyclone over the central Arctic Ocean is quite typical for this time of year, the combination of the high pressure over northern Europe and the pressure trough to the west led to a strong pressure gradient, leading to strong winds from south through the Norwegian and Barents Seas. As discussed below, this can be tied to the extreme warm event over the Arctic Ocean seen in the middle of the month, associated with strong water vapor transport and the passage of several strong cyclones.
March 2022 compared to previous years
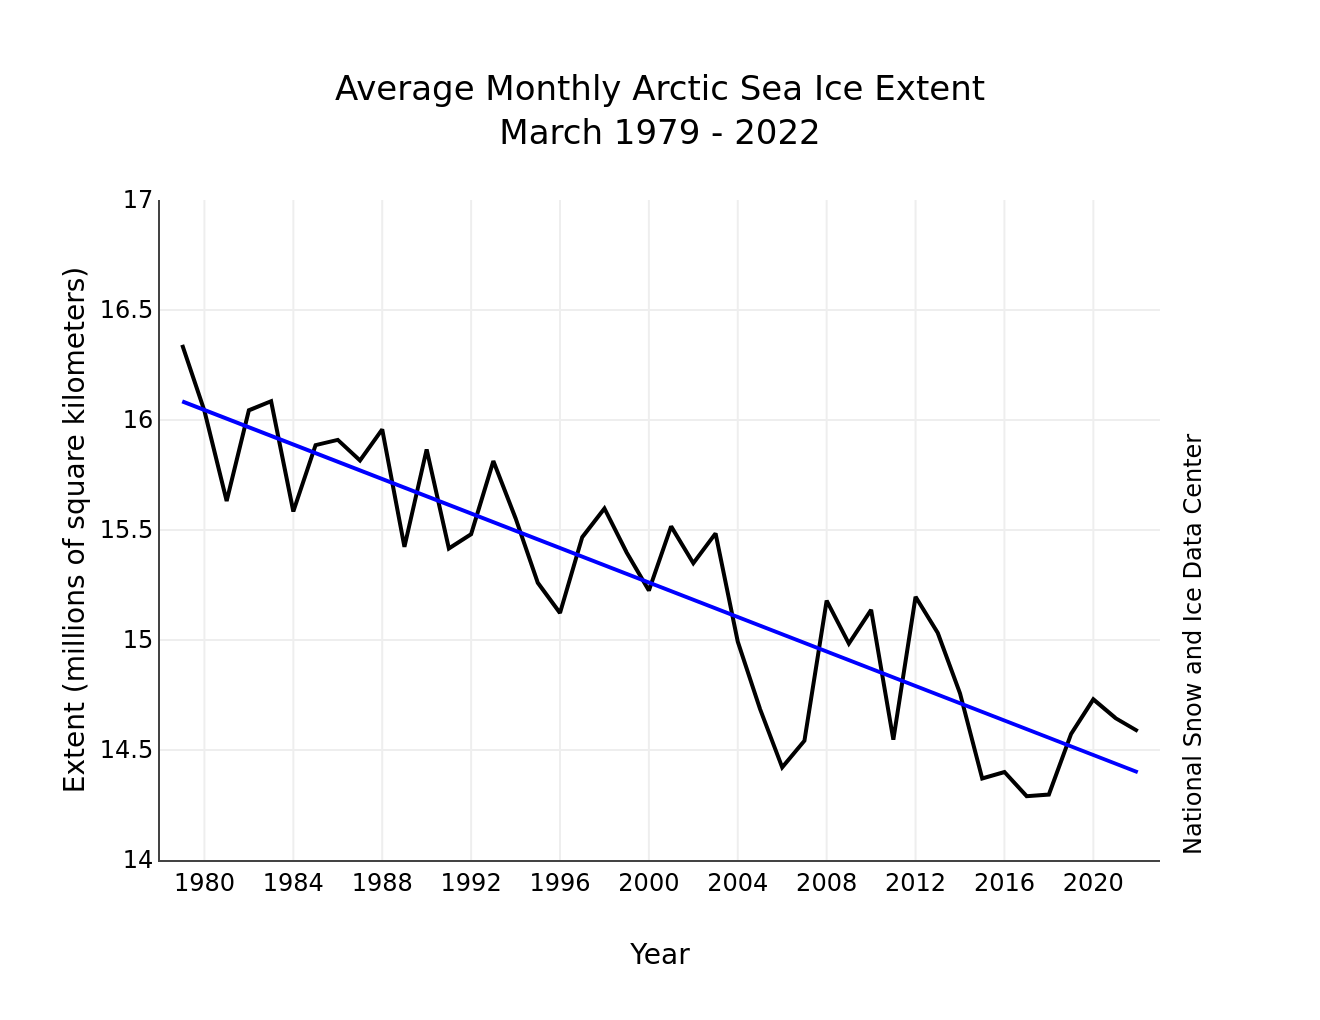
Figure 3. Monthly March ice extent for 1979 to 2022 shows a decline of 2.5 percent per decade.
Credit: National Snow and Ice Data Center
High-resolution image
The downward linear trend in March sea ice extent over the 44-year-satellite record is 39,200 square kilometers (15,100 square miles) per year, or 2.5 percent per decade relative to the 1981 to 2010 average. Based on the linear trend, since 1979, March has seen a loss of 1.74 million square kilometers (672,000 square miles). This is equivalent to about the size of Alaska.
Extreme events
Figure 4a. Click on the figure to view the animation of sea level pressure and integrated vapor transport (IVT) near the Greenland Sea. The animation runs from March 11, 2022, through March 17, 2022. Arrows indicate direction and magnitude of transport, while shading indicates the magnitude of the water vapor transport.
Credit: Jessica Voveris, University of Colorado Boulder
High-resolution image

Figure 4b. These maps show sea ice concentration off the eastern coast of Greenland in the Greenland Sea. The map on the left shows sea ice on March 13, 2022, prior to the atmospheric river event passing through. The map on the right is after the event past on March 17, 2022.
Credit: Gunnar Spreen, University of Bremen
High-resolution image
On March 14, air temperatures at the 925 hPa level northwest of Greenland were up to 15 degrees Celsius (27 degrees Fahrenheit) above average. This was part of a series of warm pulses of air moving into the Arctic Ocean from the northern North Atlantic. For example, on March 17, temperatures over the Kara Sea reached 15 degrees Celsius (27 degrees Fahrenheit) above average. Quite often, such warm events are tied to strong transport of water vapor and associated cloud cover. In the animation (Figure 4a-click to view), arrows indicate the direction and magnitude of the integrated vapor transport (IVT) along with sea level pressure from March 11 through March 17, 2022. The shading indicates the magnitude of the transport. Several periods of very strong vapor transport from the northern North Atlantic directly into the Arctic Ocean occurred mid-month; this is consistent with the pattern of strong surface winds from the south through the Norwegian and Barents Seas as implied by the monthly averaged sea level pressure field (Figure 2c). The periods of strong vapor transport are linked to the passage of cyclones (low pressure systems) into the Arctic Ocean. While further analysis is needed, the narrow ribbons of strong water vapor transport into the Arctic Ocean appears to be linked to what are known as atmospheric rivers, which can carry an amount of water vapor far in excess of the discharge of the Mississippi River at its mouth. Atmospheric rivers form in the warm subtropics. The atmospheric circulation pulls the water vapor and forms a narrow band that can be thousands of miles long. When atmospheric rivers reach a coast or flow inland over mountains, the moist air is forced upwards, the water vapor condenses, and heavy precipitation may fall as rain or snow.
There is also evidence, presented at the Arctic Science Summit Week by colleague Gunnar Spreen of the University of Bremen, that the cyclones associated with the strong vapor transport churned up the sea ice in the East Greenland Seas (Figure 4b). Ice concentrations from the University of Bremen AMSR2 product show lower ice concentrations on March 17 compared to March 13 as the passing cyclone broke up ice cover. The result was reduced sea ice concentration and the opening up of numerous leads in the area.
A further look at the Endurance using NSIDC’s Sea Ice Tracking Utility
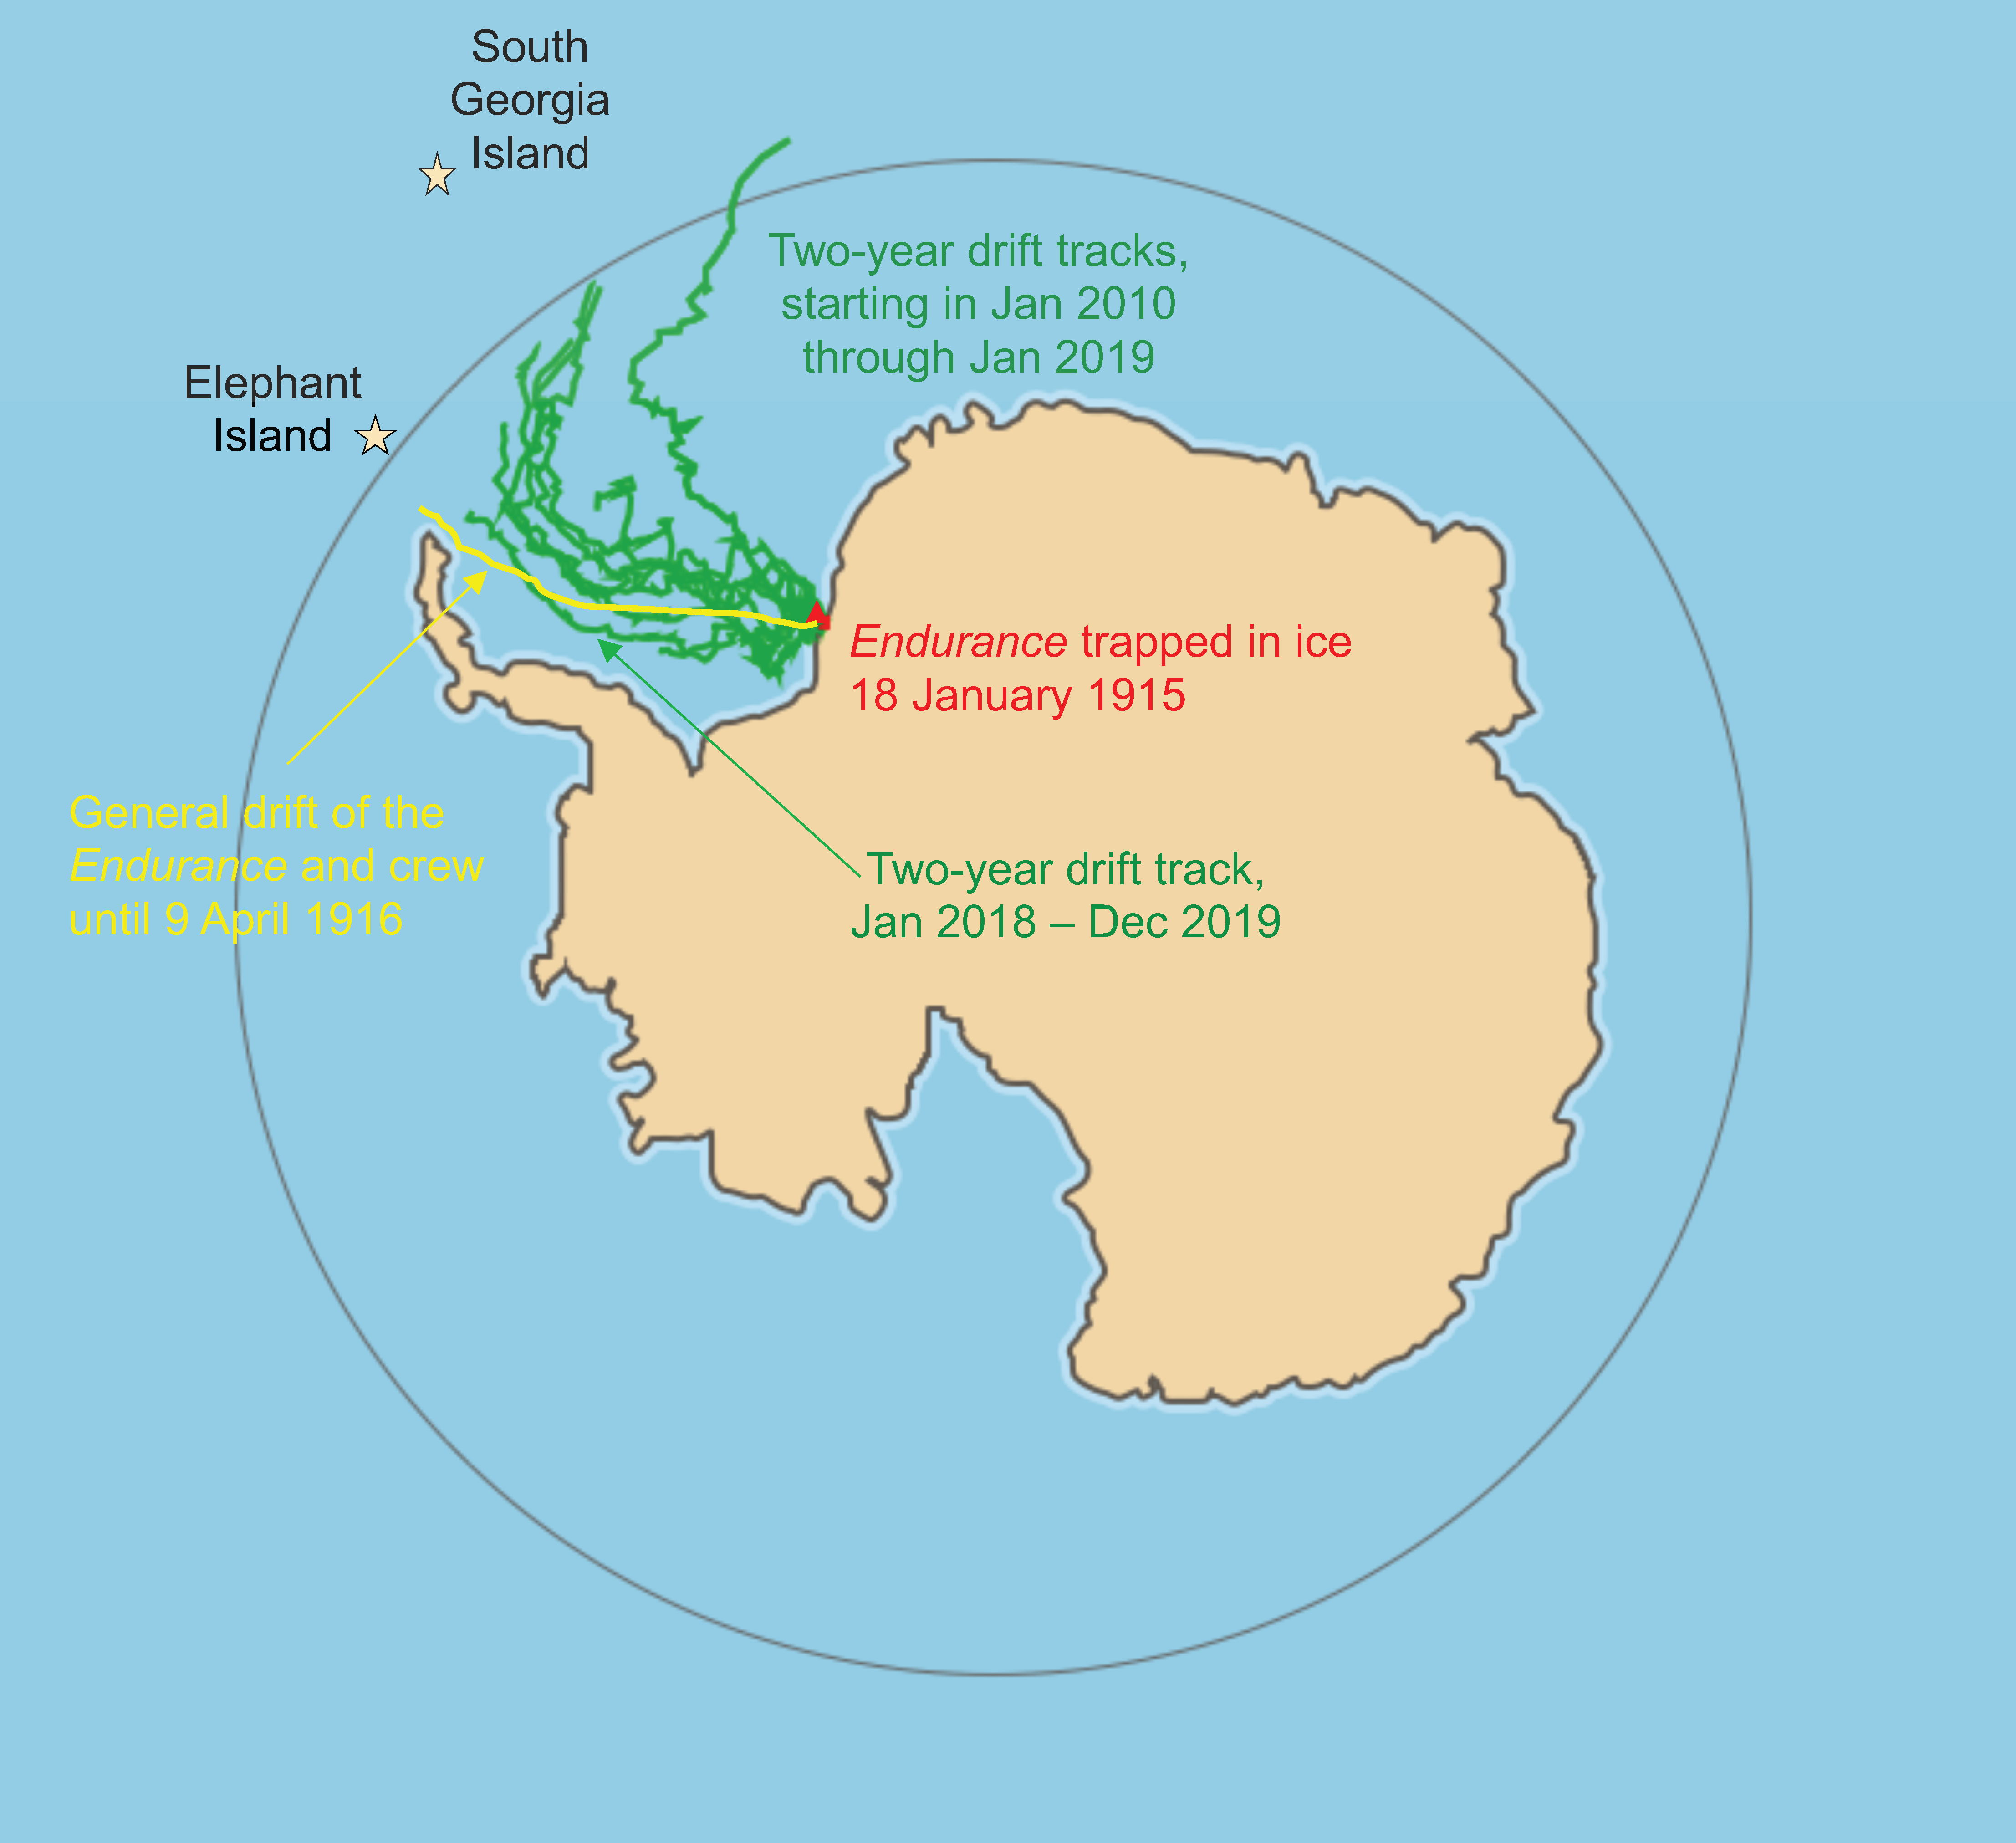
Figure 5. This map shows ice drift trajectories from January 2010 (green) using NSIDC’s Sea Ice Tracking Utility (SITU) tool. Each track encompasses a two-year period. The drift trajectories are based on observations over the last 40 years or more. The left-most track, for January 2018 through December 2019, follows the actual drift (yellow) of the Endurance in January 1915 to April 1916, but the recent drift tracks are considerably slower. The positions of Elephant Island, where the crew rowed to after leaving the ice, and South Georgia Island, where Shackleton and five others were eventually able to reach civilization, are denoted by stars.
Credit: Walt Meier, NSIDC
High-resolution image
As mentioned in last month’s post, the wreck of the Endurance was found on the floor of the Weddell Sea. The Endurance became trapped in the ice on January 18, 1915, at 76.57 degrees South latitude and 328.5 degrees East longitude. It drifted with the ice over the ensuing months until the ice closed in and began crushing the ship in October. The crew abandoned ship on October 27, 1915, and the Endurance finally sank on November 21, 1915, at 68.64 degrees South latitude, 53.0 West longitude. The crew camped and drifted with the ice until the ice began to break up. They launched lifeboats on April 9, 1916. Fortunately, they were close enough to row to the small uninhabited Elephant Island that at least provided some shelter. Expedition leader Earnest Shackleton and five others then sailed by lifeboat to South Georgia Island, several hundred miles away. After landing, they had to cross by foot over a mountain chain before finally reaching a whaling station. They were eventually able to secure a rescue ship to the rest of the crew on Elephant Island. All crew members were saved.
While the leadership of Earnest Shackleton and the fortitude of the crew where essential to their rescue, they were also fortunate in that the ice drift brought them west as well as north, putting them in proximity of islands off of the Antarctic Peninsula. NSIDC’s Sea Ice Tracking Utility (SITU) is a tool that allows us to investigate the drift of the ice based on observations over the last 40 or more years. The tool was developed at NSIDC in collaboration with colleagues Stephanie Pfirman (Arizona State University), Bruno Tremblay (McGill University), and Bob Newton (Columbia University). We can examine whether the drift of Shackleton’s ship was a common or rare occurrence using the SITU record. It appears that the drift of the Endurance was rare within the observational record. Starting from the location for the Endurance’s wreck, only one of the drift tracks in the SITU record, from January 2018 through December 2020, would have taken the crew so far north and west—toward the potential haven of Elephant Island. Other SITU tracks would have taken the crew further from land and toward the open ocean. Additionally, the drift of the Shackleton crew was particularly fast—they came out of the ice within about 14 months. The observed drift from 1979 through 2020 in SITU would keep them in the ice for at least two years. This means that the crew would not have been able to get to Elephant Island in late spring but would have had to winter over on the ice, possibly for several more months.
Strong warming event brings record-setting temperatures to East Antarctica
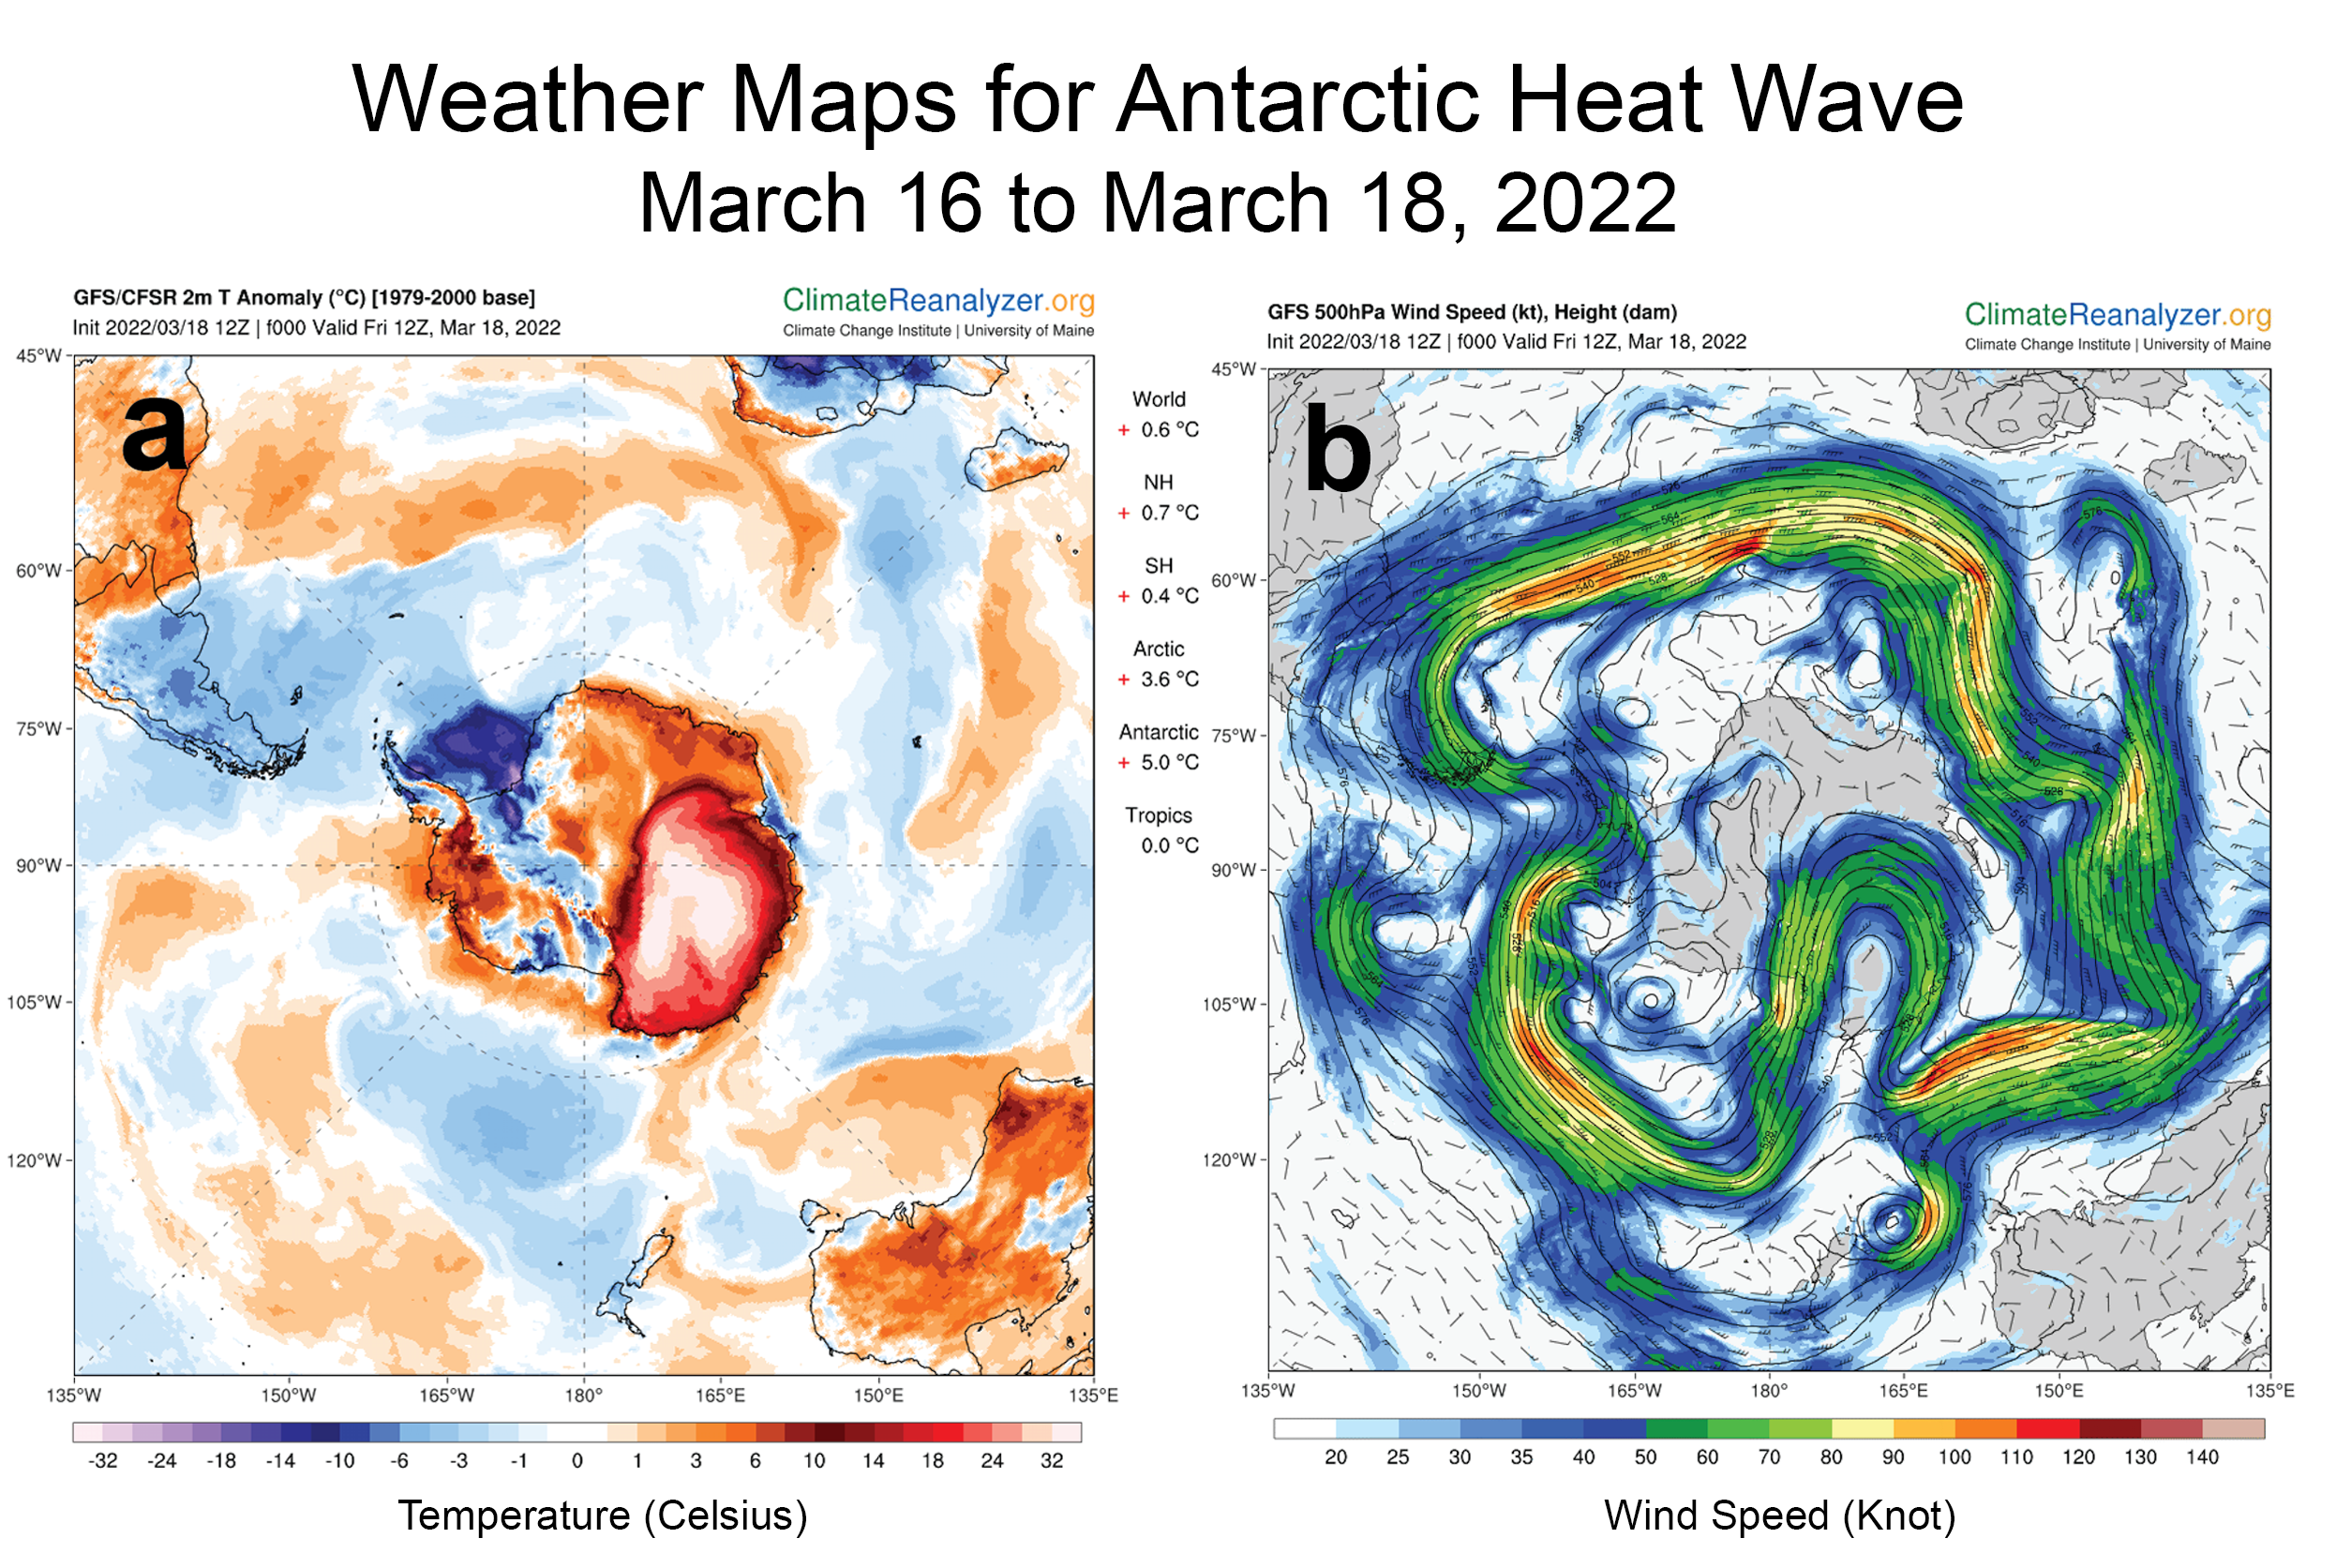
Figure 6a. These weather maps show the heat wave event of March 16 to 18 in Antarctica. Map (a) shows temperature difference from average for the date; map (b) shows wind pattern at 500 millibar (about 18,000 feet) showing the far southern excursion of the westerly wind belt over Wilkes Land and far up onto the East Antarctic Plateau.
Credit: University of Maine, National Oceanic and Atmospheric Administration (NOAA)
High-resolution image
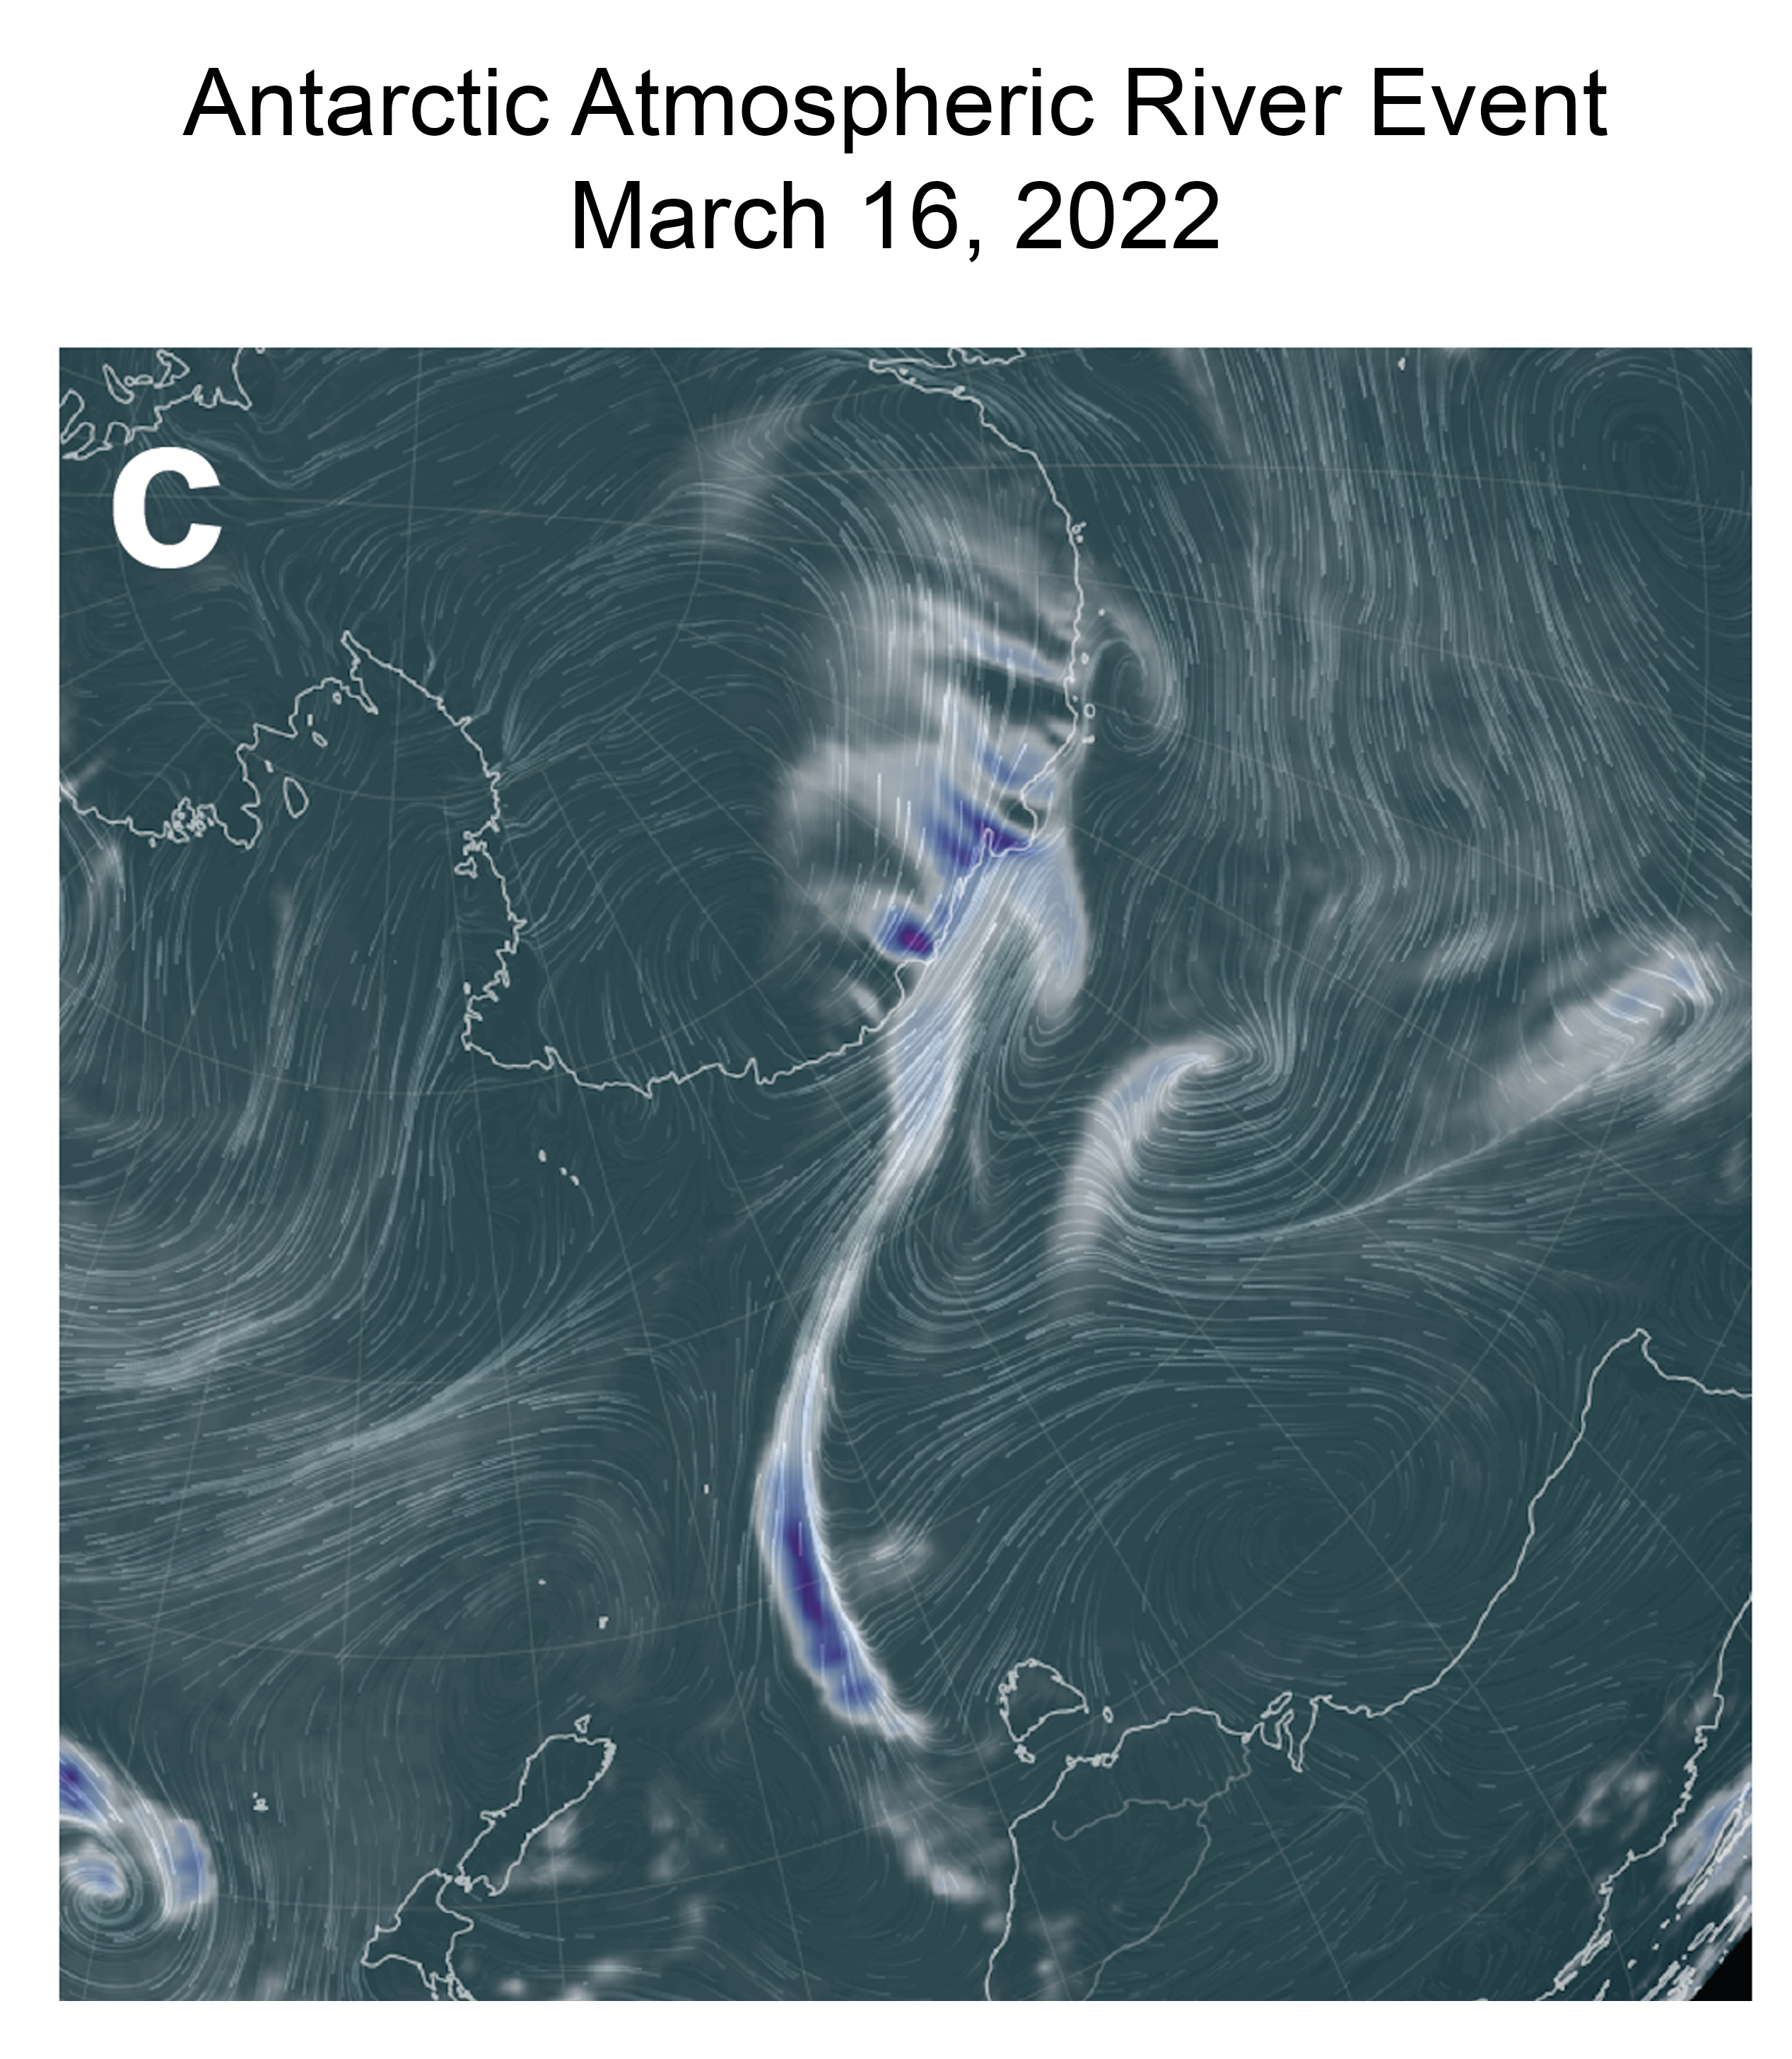
Figure 6b. This weather map shows the atmospheric river event over Antarctica on March 16, 2022. At 16:00 Coordinated Universal Time (UTC) the atmospheric river of water vapor flowed onto the East Antarctic coast.
Credit: University of Maine, National Oceanic and Atmospheric Administration (NOAA)
High-resolution image
Between March 16 and 18, a combination of an unusual high-pressure region southeast of New Zealand and a strong low pressure south of Perth, Australia, led to a pulse of warm and moist air from east Australia (the Tasman Sea) to the Antarctic coastline and up onto the East Antarctic Plateau (Figure 6a). As the pulse of air, another example of what appears to be an atmospheric river, reached the coast, sustained periods of above-freezing temperatures and rain were observed at the coastal bases (Figure 6b). Air temperatures at Casey and Dumont D’Urville Stations, were above freezing for nearly two days at 6 degrees Celsius (43 degrees Fahrenheit) and 4 degrees Celsius (39 degrees Fahrenheit), respectively. Because of the high moisture content of the air mass, temperatures remained high as the air climbed onto the ice sheet. Precipitation, and the heat released by condensation of moisture, kept the air warm as it moved up onto the plateau, bringing temperatures far above those typical for mid-March. Temperatures at high-elevation stations such as Russia’s Vostok Station and the European station at Dome Concordia, were more than 35 degrees Celsius (63 degrees Fahrenheit) above average for this time of year.
Ice shelf in eastern Wilkes Land breaks up
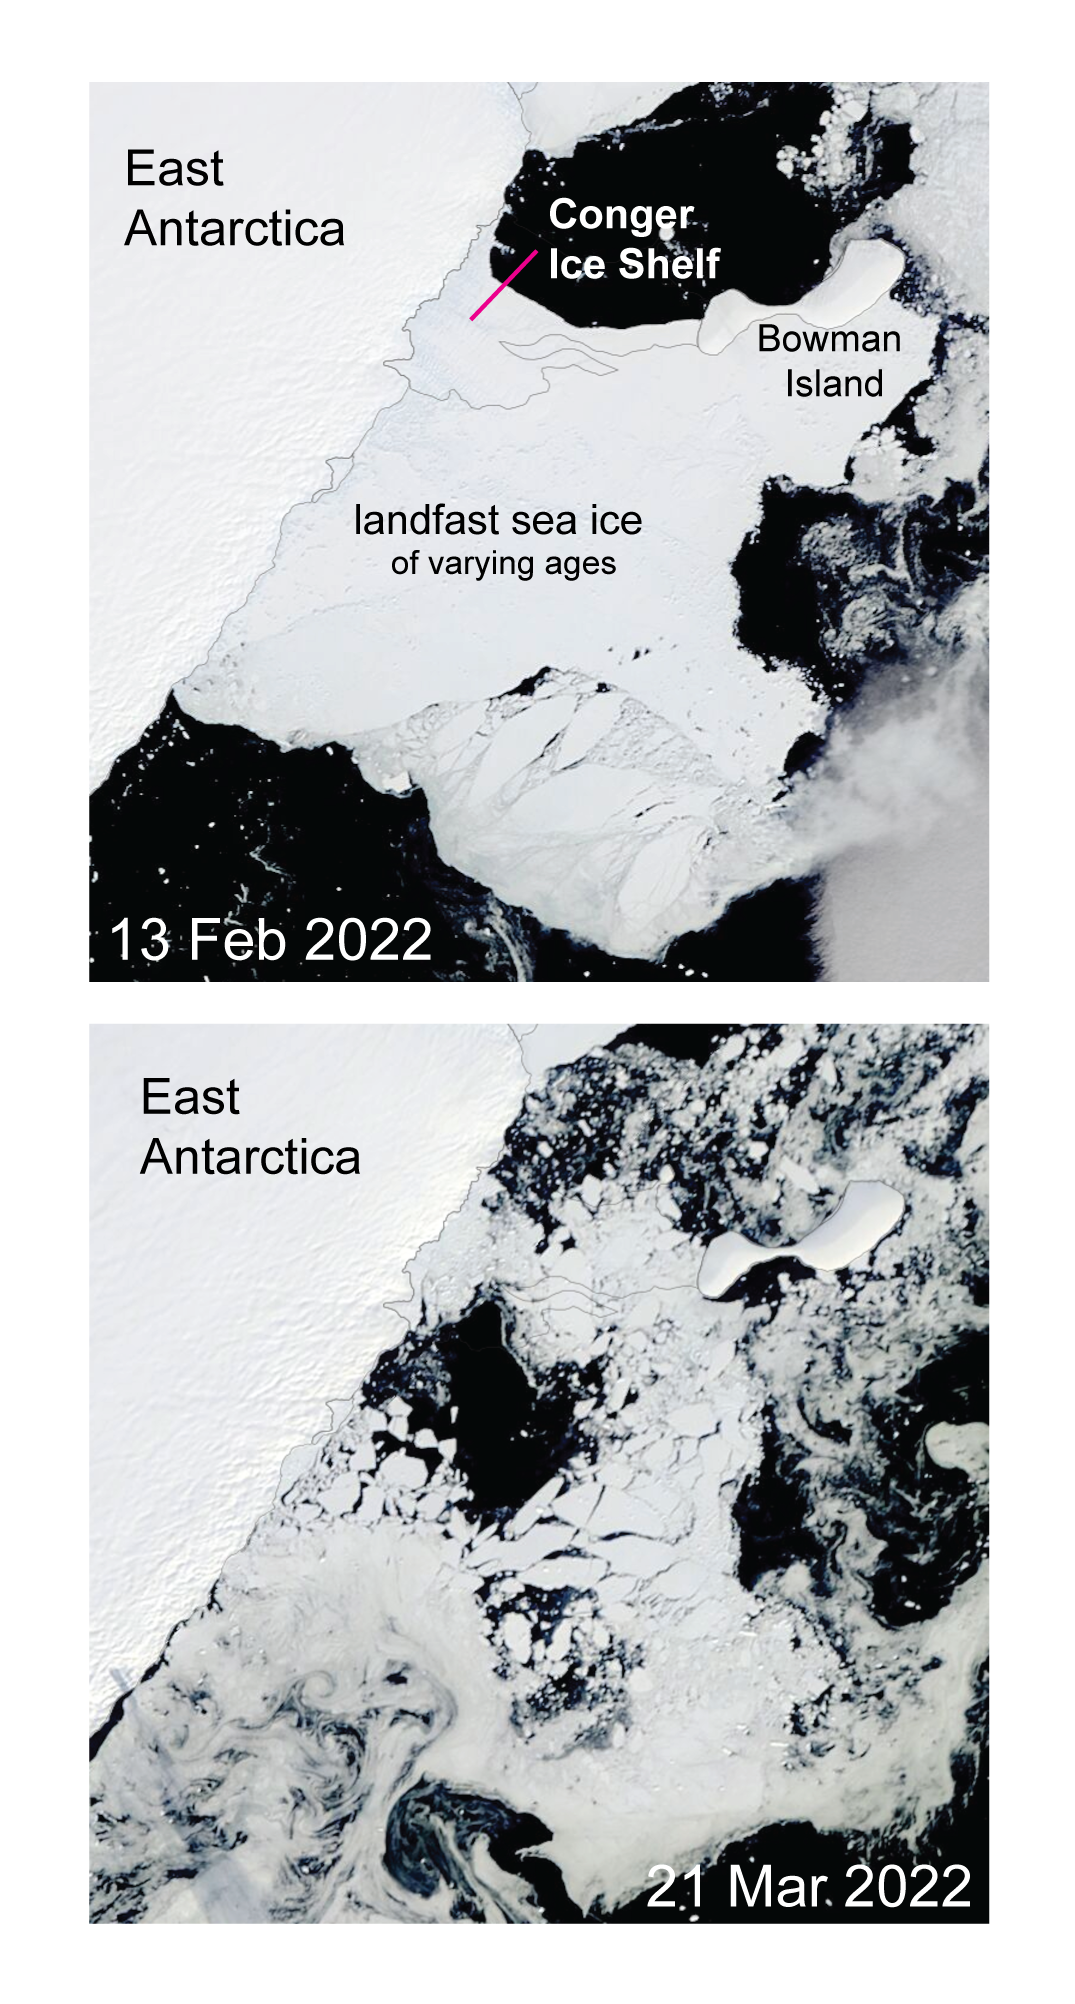
Figure 7. These images from the Moderate Resolution Imaging Spectroradiometer (MODIS) instrument on the NASA Terra Satellite show the before and after details of the Conger Ice Shelf break up. Images are 188 kilometers (117 miles) on a side, north is to the lower right. Conger Ice Shelf is near 66 degrees South, 103 degrees East longitude.
Credit: NASA Worldview
High-resolution image
After many years of rifting and small calvings, the Conger Ice Shelf, at the eastern end of the Wilkes Land coast and just east of the Shackleton Ice Shelf, has calved into several large pieces and two named icebergs, C-37 and C-38. The ice shelf was about 1,200 square kilometers (463 square miles) in area towards the end but had been losing area over several years. The flow of the glacier pushed the ice shelf front against a small island, Bowman Island, just off the coast of Antarctica. The stress of the floating ice shelf being pushed against the snow-covered rock island caused large rifts to form and eventually forced pieces to break away. This is an example of what happens when a strong force (continental ice sheet flow) impinges on an immovable object (a rocky island). The event does not appear to be directly related to the recent record low sea ice extent in Antarctica, or the recent heat wave. In fact, the break up occurred just before the warm event.
Reference
Campbell, G. G., S. Pfirman, B. Tremblay, R. Newton, P. DeRepentigny, W. Meier, and C. Fowler. The Ice Tracker. http://icemotion.labs.nsidc.org/SITU

