The sea ice extent has been quickly growing, and by the end of October, ice covered most of the Arctic Ocean. Overall, the ice extent remained below average for this time of year in the Barents and Kara Seas, as well as within northern Baffin Bay and the East Greenland Sea.
Overview of conditions
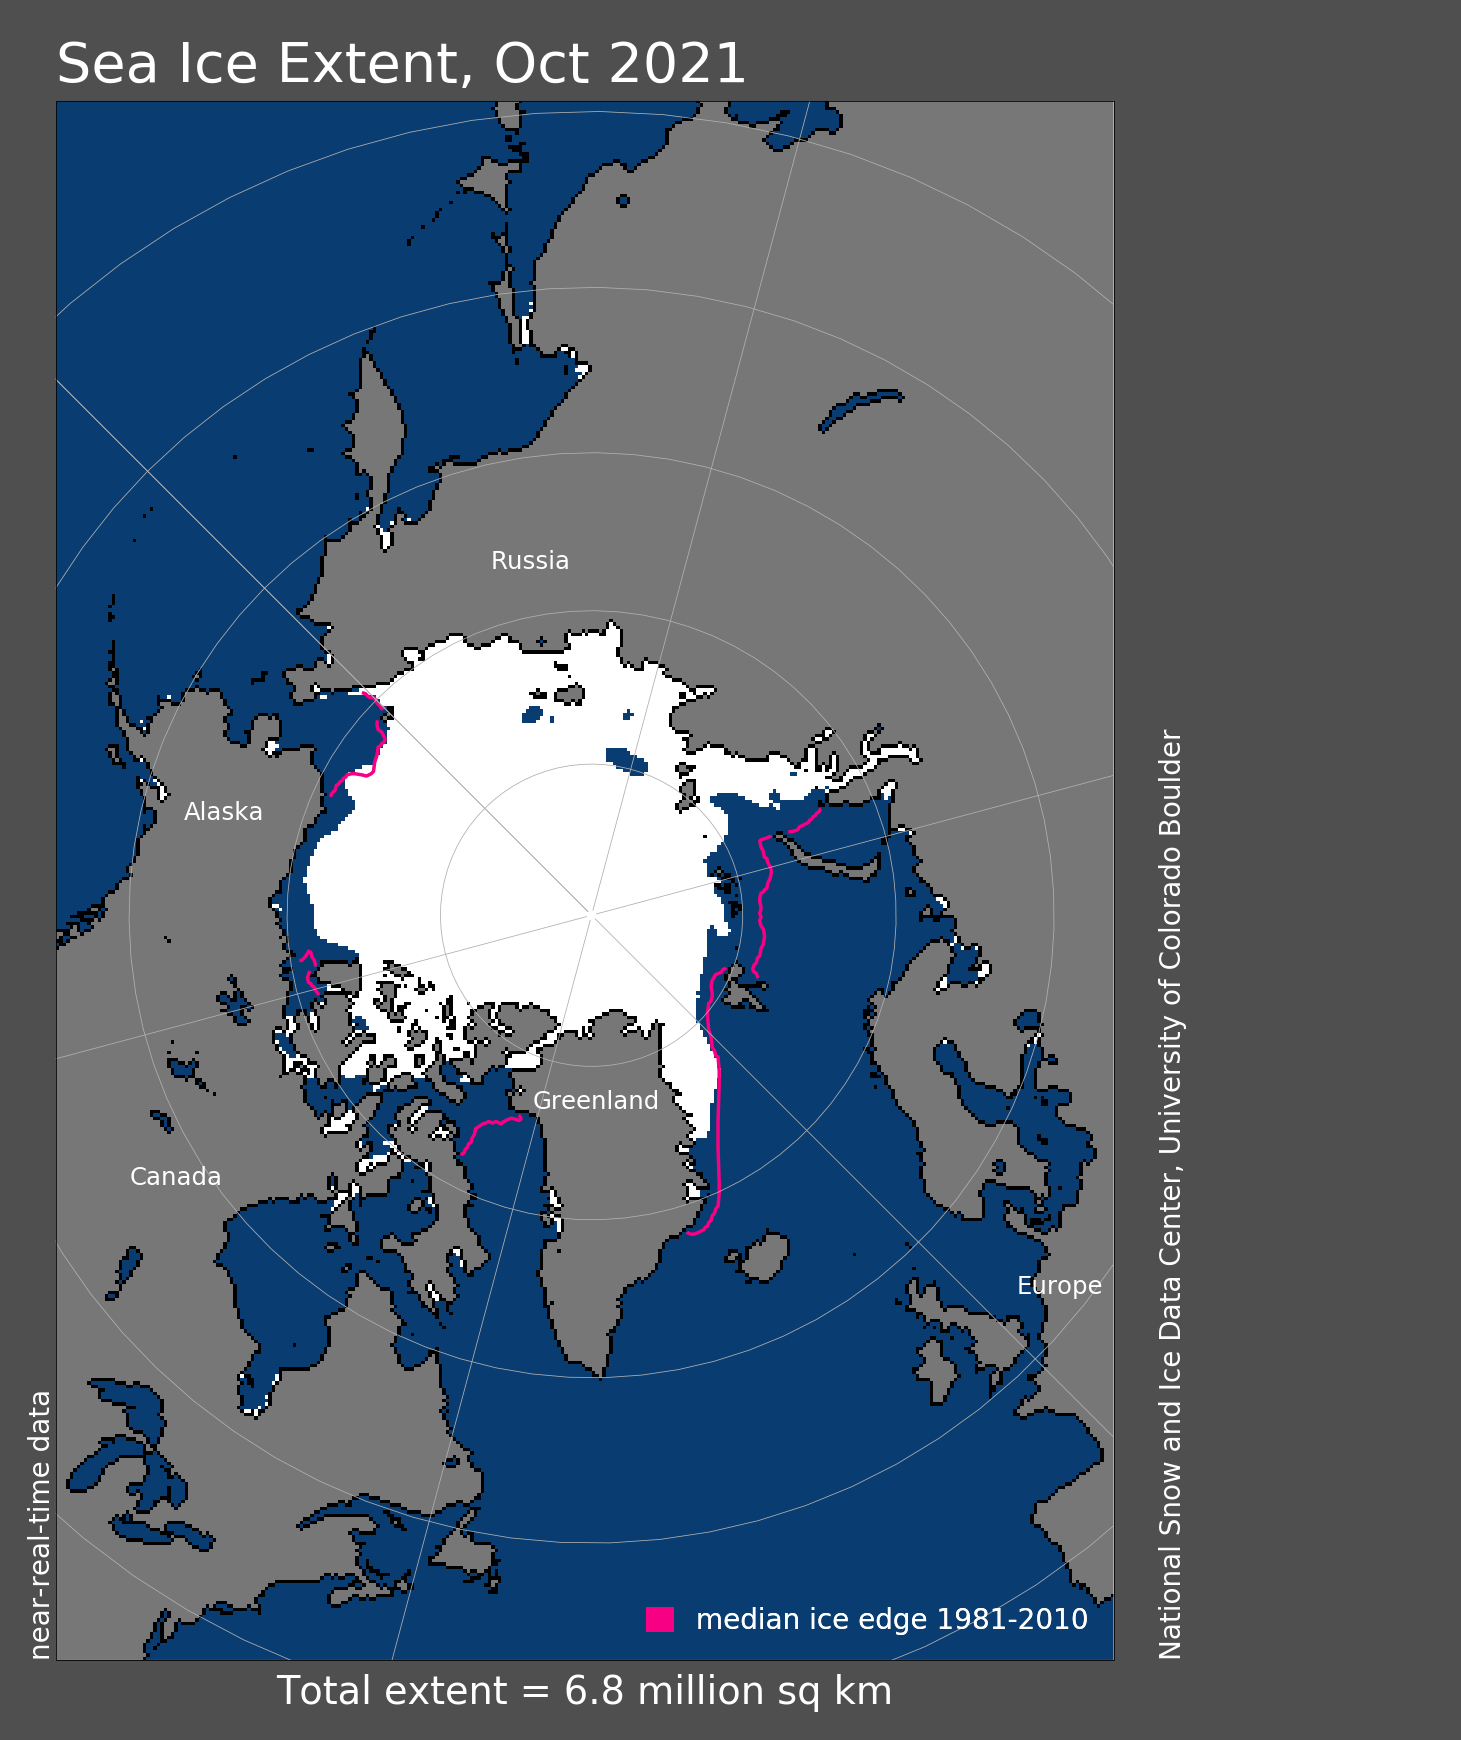
Figure 1. Arctic sea ice extent for October 2021 was 6.77 million square kilometers (2.61 million square miles). The magenta line shows the 1981 to 2010 average extent for that month. Sea Ice Index data. About the data
Credit: National Snow and Ice Data Center
High-resolution image
The monthly average extent for October 2021 was 6.77 million square kilometers (2.61 million square miles). This ranked eighth lowest in the long-term satellite data record, tied with 2017. It was 1.44 million square kilometers (556,000 square miles) greater than the record low of 5.33 million square kilometers (2.06 million square miles) recorded in 2020, and 1.58 million square kilometers (610,000 square miles) below the 1981 to 2010 long-term average. Ice growth was robust across the Eurasian side of the Arctic, including the East Greenland Sea, but there was little expansion of ice southwards within the eastern Beaufort Sea.
Conditions in context
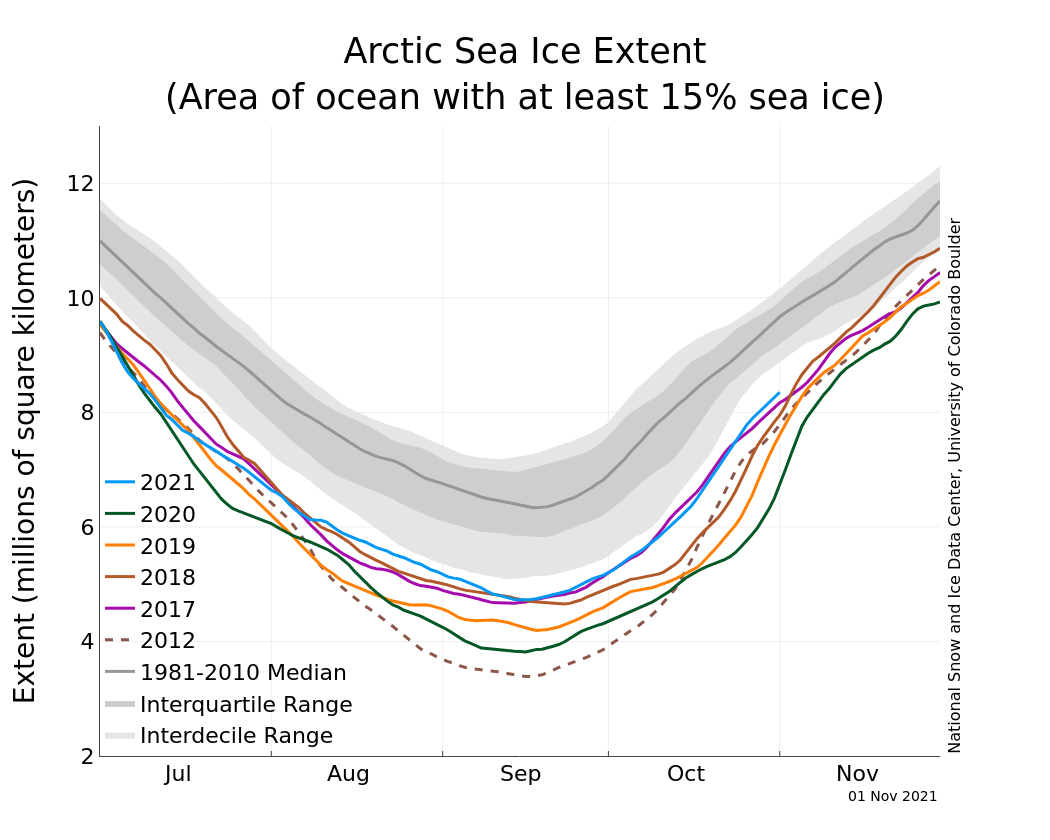
Figure 2a. The graph above shows Arctic sea ice extent as of November 1, 2021, along with daily ice extent data for four previous years and the record low year. 2021 is shown in blue, 2020 in green, 2019 in orange, 2018 in brown, 2017 in magenta, and 2012 in dashed brown. The 1981 to 2010 median is in dark gray. The gray areas around the median line show the interquartile and interdecile ranges of the data. Sea Ice Index data.
Credit: National Snow and Ice Data Center
High-resolution image
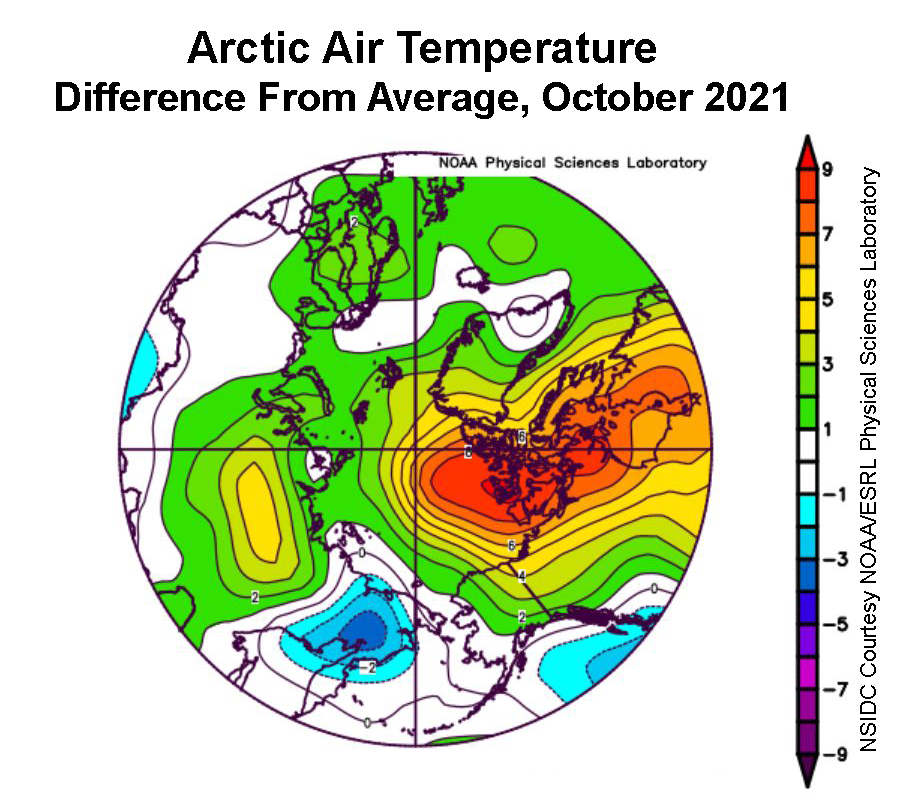
Figure 2b. This plot shows the departure from average air temperature in the Arctic at the 925 hPa level, in degrees Celsius, for October 2021. Yellows and reds indicate higher than average temperatures; blues and purples indicate lower than average temperatures.
Credit: NSIDC courtesy NOAA Earth System Research Laboratory Physical Sciences Laboratory
High-resolution image
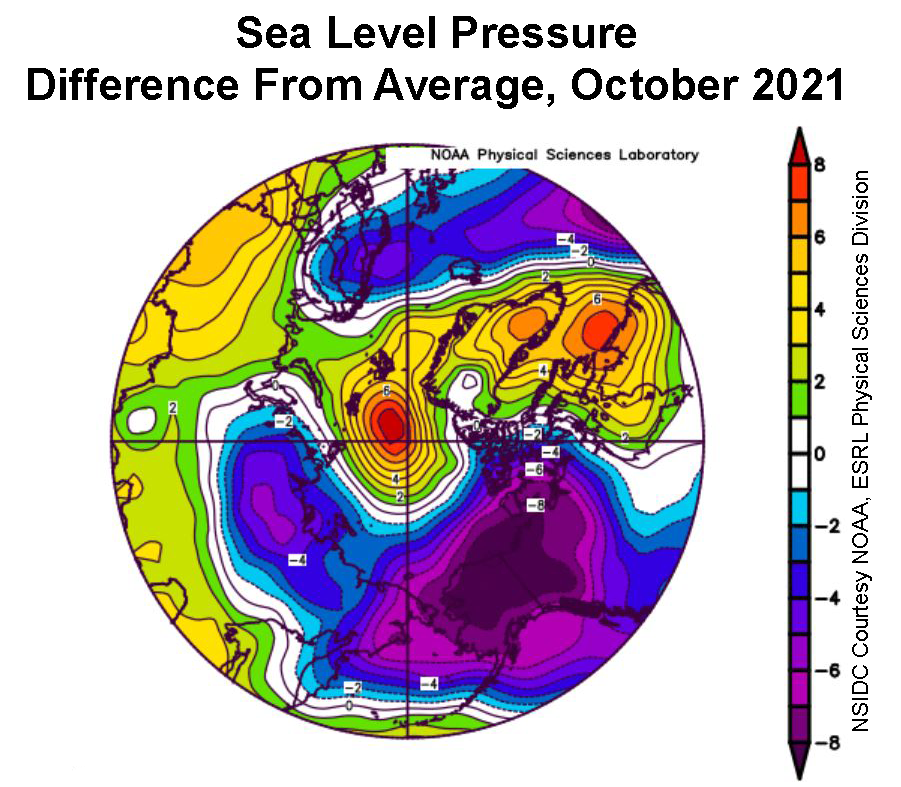
Figure 2c. This plot shows the departure from average sea level pressure in the Arctic at the 925 hPa level, in degrees Celsius, for October 2021. Yellows and reds indicate higher than average air pressures; blues and purples indicate lower than average air pressures.
Credit: NSIDC courtesy NOAA Earth System Research Laboratory Physical Sciences Laboratory
High-resolution image
As of October 31, sea ice extent is tracking higher than any year since 2015, as well as higher than observed in 2007, 2011, and 2012 (Figure 2a).
Average monthly air temperatures were well below freezing across much of the Arctic Ocean in October, the exceptions being along the coastal regions of the Barents Sea and across the North Atlantic region. Nevertheless, air temperatures at the 925 hPa level (about 2,500 feet above the surface) were above the 1981 to 2010 average, up to 8 degrees Celsius (14 degrees Fahrenheit) above average north of Greenland and the Canadian Archipelago (Figure 2b).
Above average temperatures were related in part to unusually low sea level pressure extending from Siberia across to Alaska, coupled with above average sea level pressure northeast of Greenland extending down towards Baffin Bay. In particular, the strong sea level pressure gradient between the low and high sea level pressure near the Canadian Arctic Archipelago helped to funnel winds from the south over Baffin Bay, which is still ice-free, northwards towards the central Arctic Ocean (Figure 2c).
Overall, ice extent increased by 99,700 square kilometers (38,500 square miles) per day during the month of October. This rate of increase was larger than the 1981 to 2010 average of 89,200 square kilometers (34,400 square miles) per day.
October 2021 compared to previous years
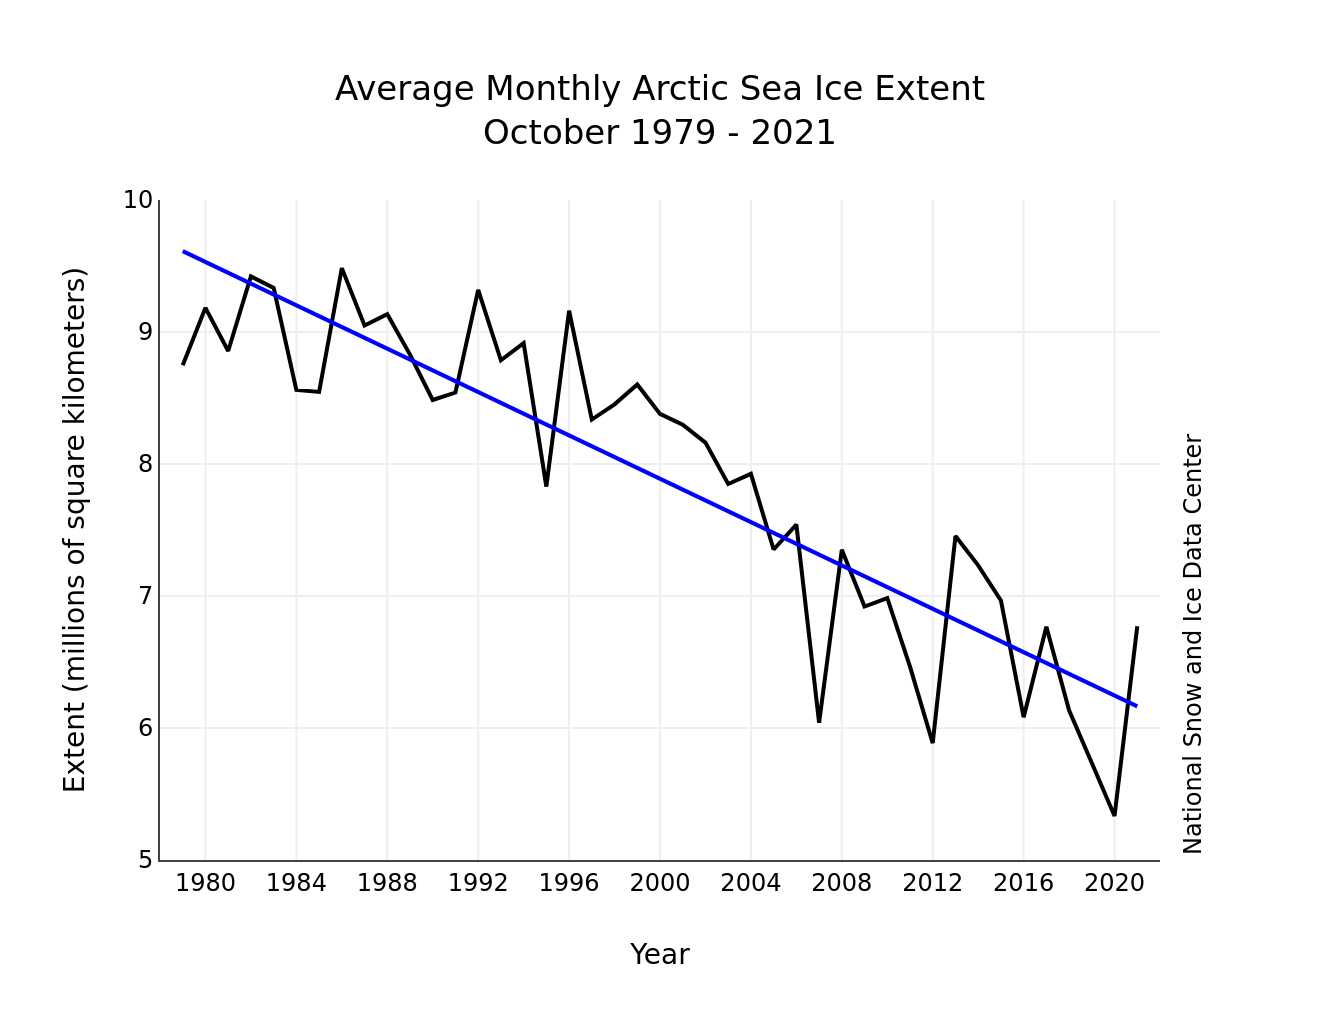
Figure 3. Monthly October ice extent for 1979 to 2021 shows a decline of 9.8 percent per decade.
Credit: National Snow and Ice Data Center
High-resolution image
The downward linear trend in October sea ice extent over the satellite record is 82,100 square kilometers (31,700 square miles) per year, or 9.8 percent per decade relative to the 1981 to 2010 average (Figure 3). While percentagewise, the overall long-term trend is largest in September, the actual amount (based on the linear trend) of ice lost per year is larger in October: 82,100 square kilometers (31,700 square miles) versus 81,200 square kilometers (31,400 square miles) in September.
Overall, since 1979, October has lost 3.45 million square kilometers (1.33 million square miles) of ice, based on the linear trend. This is equivalent to twice the size of the state of Alaska.
Last ice refuge continues to show signs of weakness
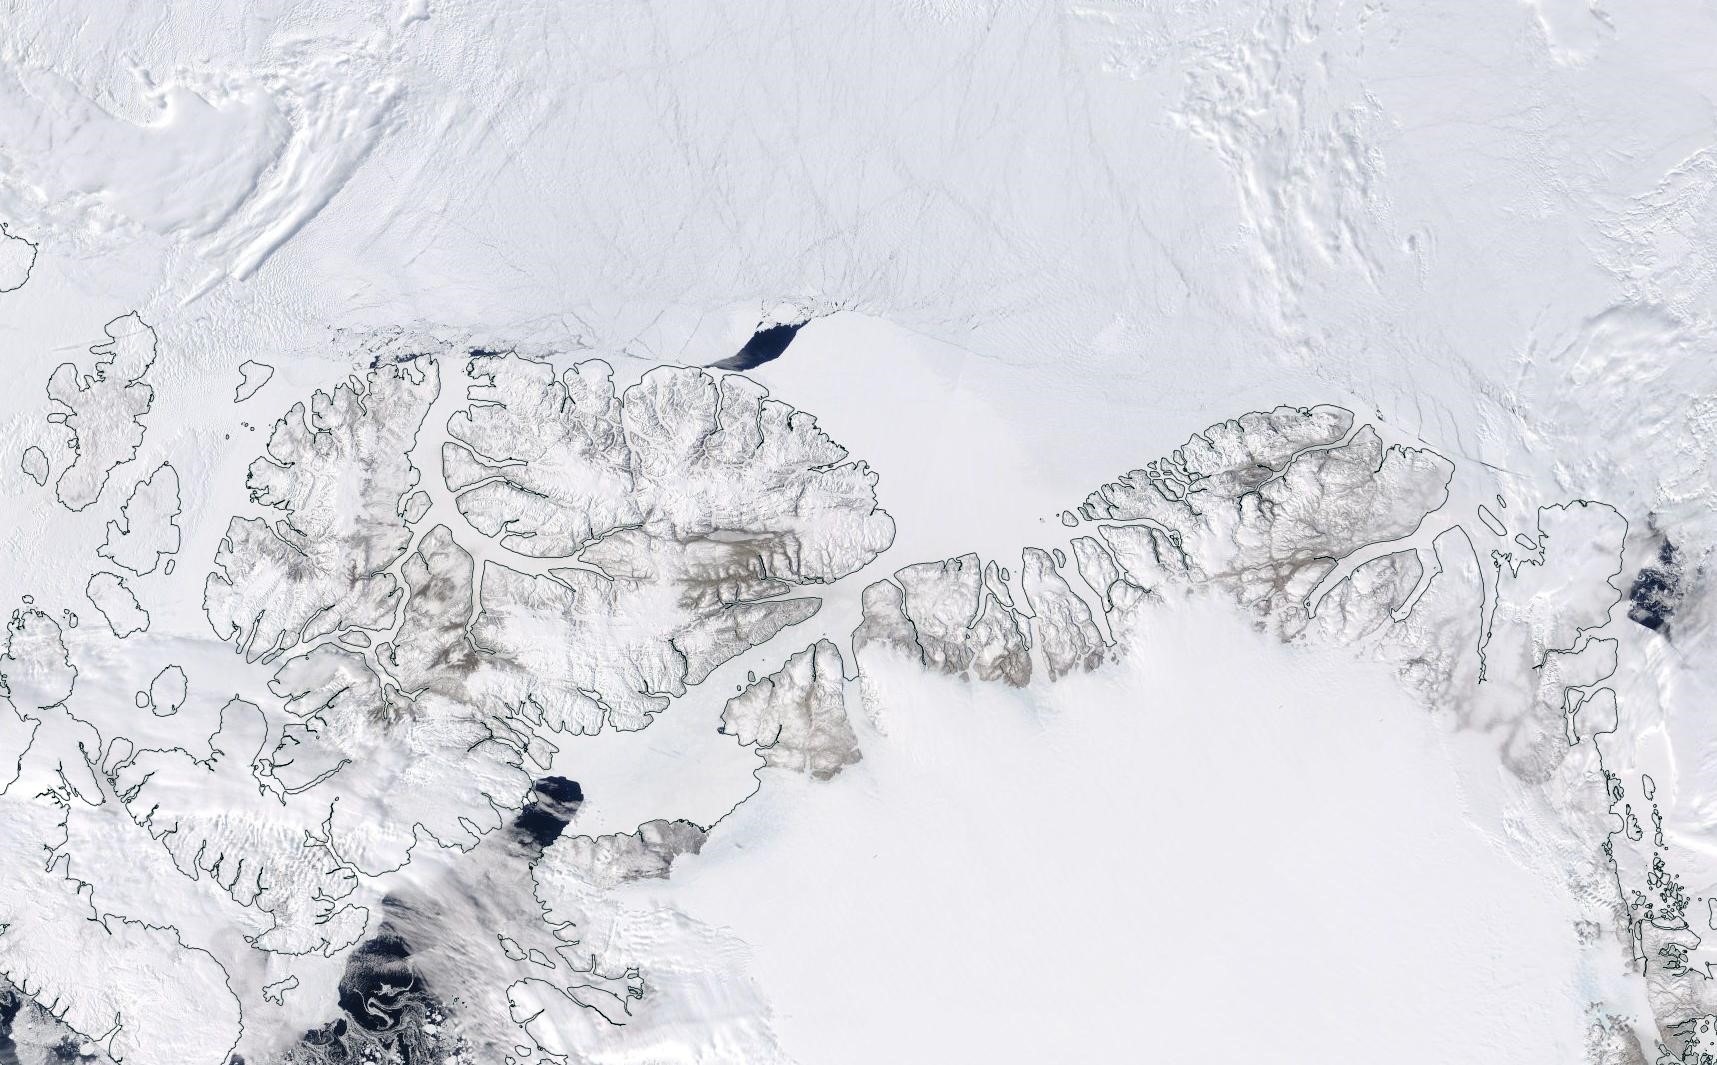
Figure 4. This NASA Moderate Resolution Imaging Spectroradiometer (MODIS) image from May 20, 2020, shows a large polynya, or open water region, that formed north of Ellesmere Island in Canada.
Credit: NASA
High-resolution image
In February 2018, a large polynya (open water region) formed northeast of Greenland. In May 2020, another large polynya formed north of Ellesmere Island (Figure 4). This region contains the oldest and thickest ice in the Arctic Ocean, a result of the Beaufort Gyre circulation, which pushes the ice towards the coasts of Greenland and the Canadian Archipelago, where it compresses along the coasts. However, during the polynya formation events, winds helped to push the ice away from the shores, leaving open water for several days. While such events have occurred before, they are rare. However, as the ice cover continues to thin, the ice will become more vulnerable to disruption by winds that can form such polynyas and seaward ridging and rafting of the ice.
Seeing daylight in the Antarctic
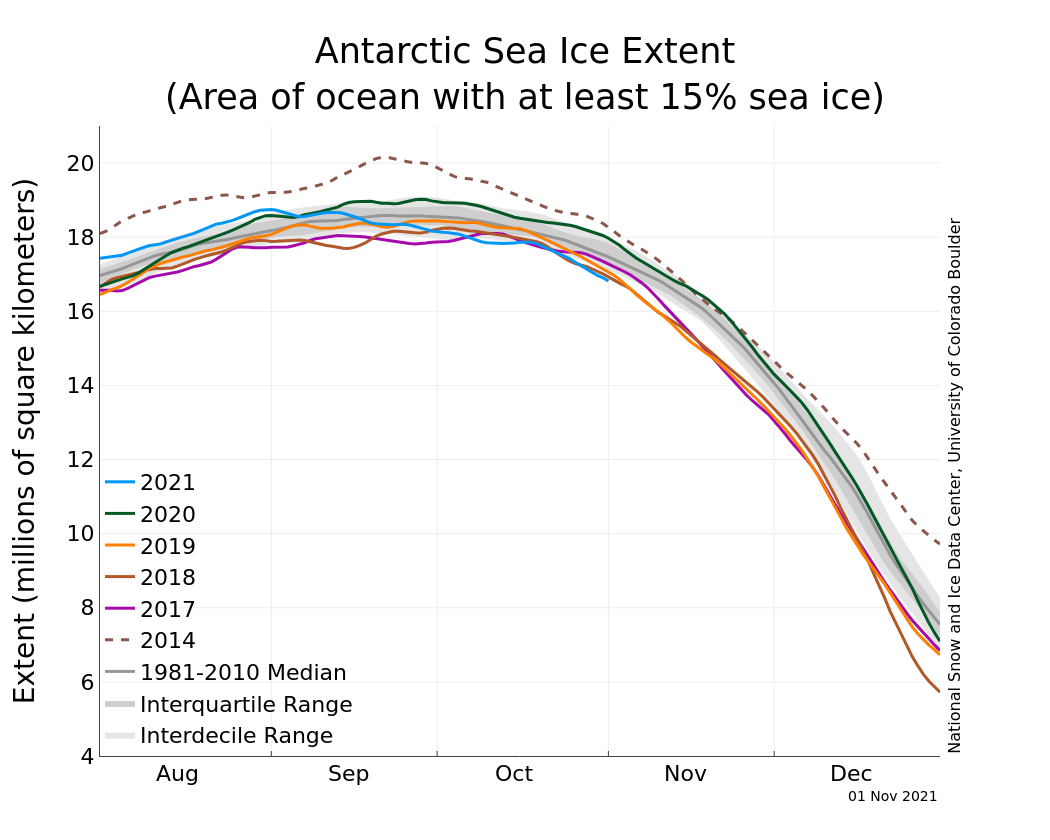
Figure 5. The graph above shows Antarctic sea ice extent as of November 1, 2021, along with daily ice extent data for four previous years and the record low year. 2021 is shown in blue, 2020 in green, 2019 in orange, 2018 in brown, 2017 in magenta, and 2014 in dashed brown. The 1981 to 2010 median is in dark gray. The gray areas around the median line show the interquartile and interdecile ranges of the data. Sea Ice Index data.
Credit: National Snow and Ice Data Center
High-resolution image
Since the Antarctic maximum sea ice extent was reached on September 1, 2021, ice extent has been in a steep decline. Extent went from being above the interdecile (ninetieth percentile) range to being below the tenth percentile for most of October. As a result, sea ice extent in the Antarctic is currently tracking as the third lowest, behind only 2016 and 1986. Sea ice extent is particularly low along the western side of the Antarctic Peninsula, including the northern Weddell Sea and the central Indian Ocean sector. Air temperatures at the 925 hPa level (about 2,500 feet above the surface) were up to 6 degrees Celsius (11 degrees Fahrenheit) above average within the Weddell Sea. A strong low pressure feature in the Amundsen Sea and above average air pressure in the area south of Australia drove winds that led to the pattern of sea ice extent around the continent.
References
Moore, G. W. K., S. E. L. Howell, and M. Brady. 2021. First observations of a transient polynya in the Last Ice Area north of Ellesmere Island. Geophysical Research Letters. doi: 10.1029/2021GL095099

