Sea ice extent increased at a faster than average pace through November and by the end of the month, extent was just within the interdecile range. Extent was above average in the Bering Sea, but Hudson Bay remained unusually ice free through the month.
Overview of conditions
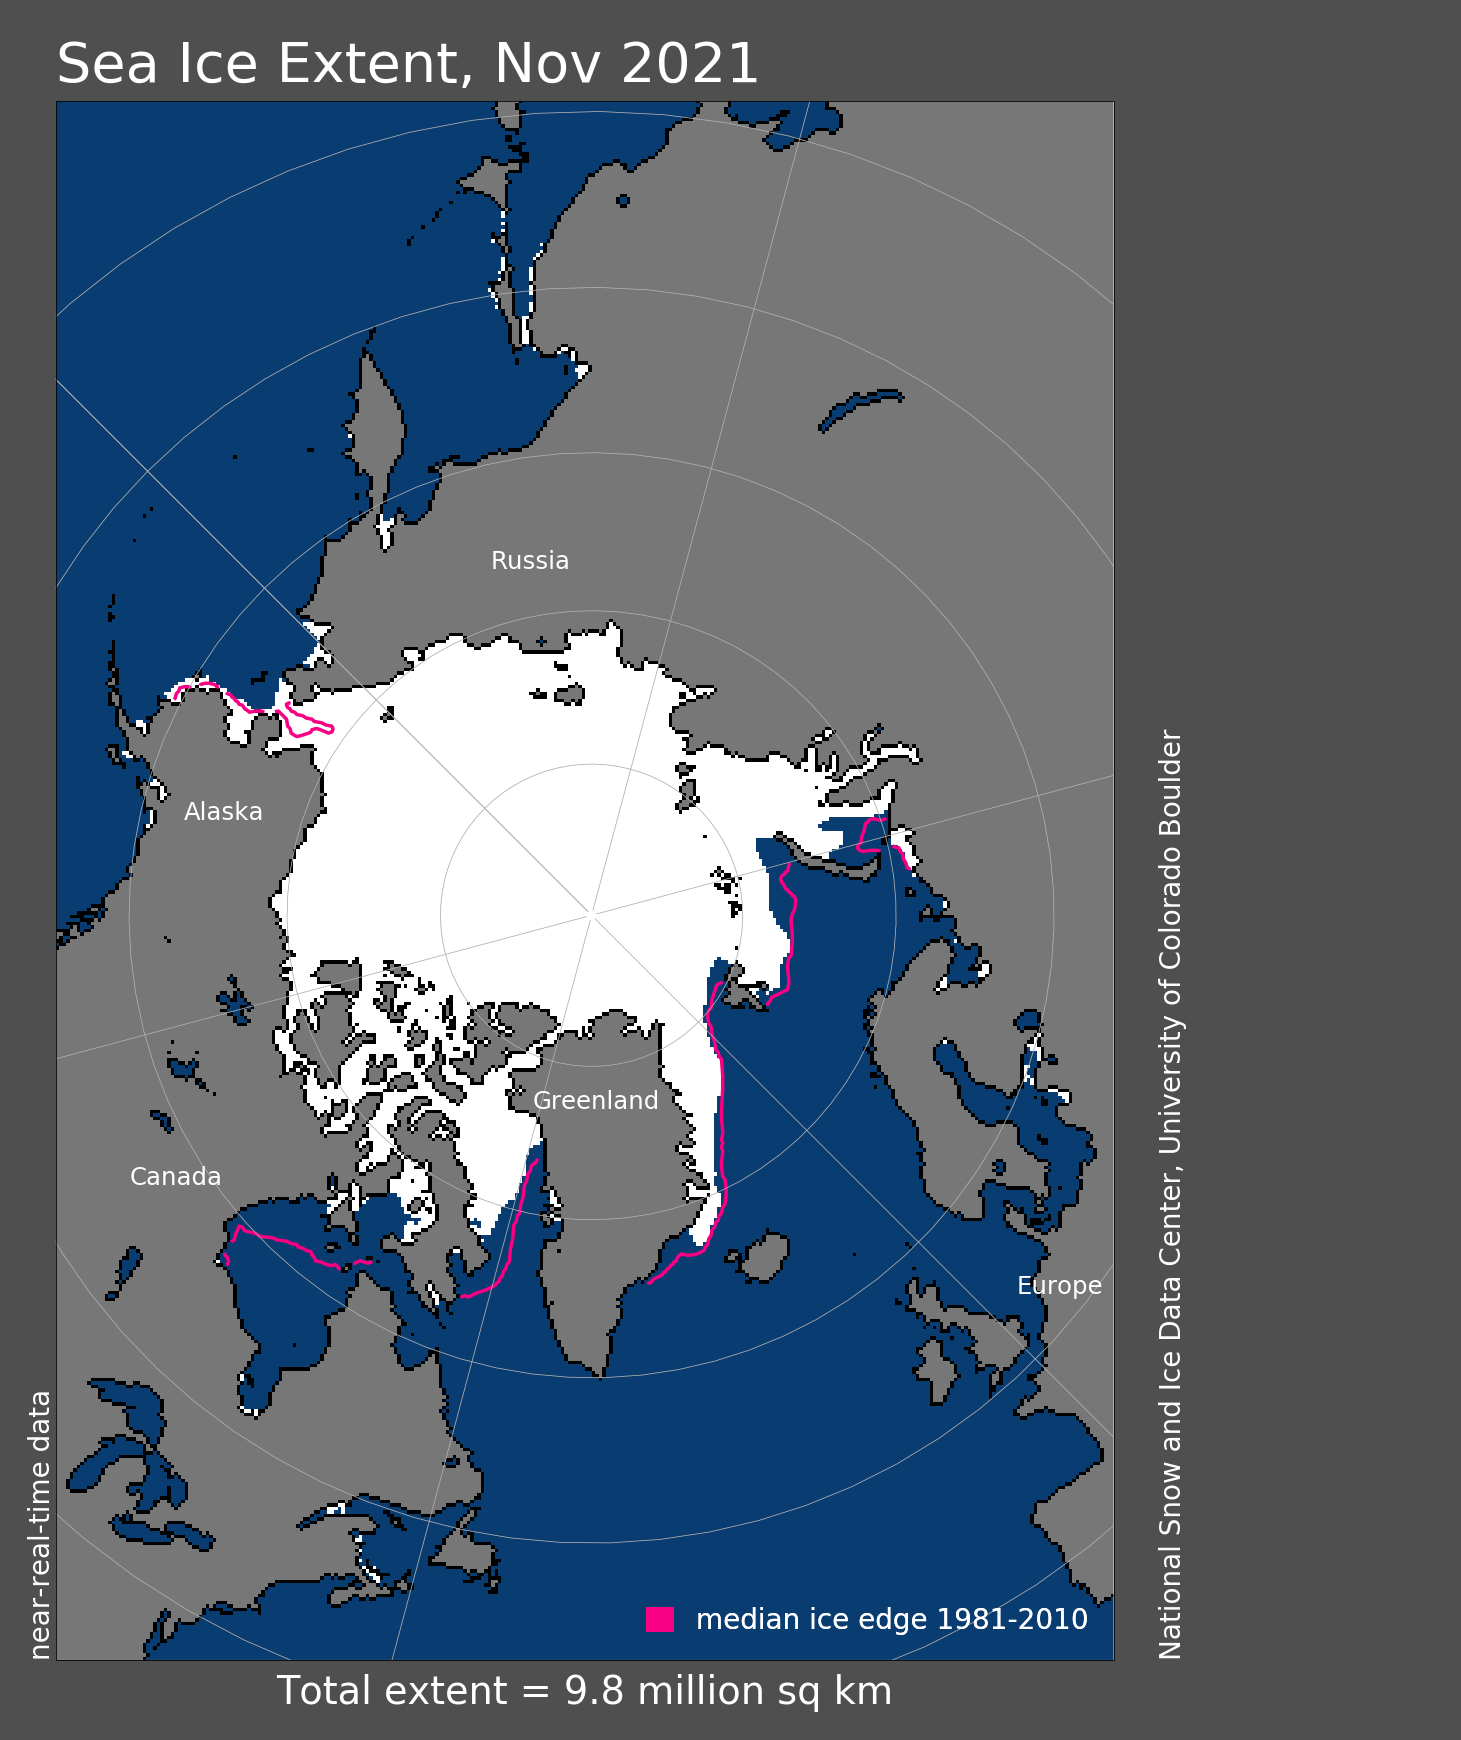
Figure 1. Arctic sea ice extent for November 2021 was 9.77 million square kilometers (3.77 million square miles). The magenta line shows the 1981 to 2010 average extent for that month. Sea Ice Index data. About the data
Credit: National Snow and Ice Data Center
High-resolution image
The November 2021 monthly average extent was 9.77 million square kilometers (3.77 million square miles), which ranked tenth lowest in the satellite record. The 2021 extent was 930,000 square kilometers (359,000 square miles) below the 1981 to 2010 long-term average. Extent was higher than average in the Bering Sea, but is extremely low in Hudson Bay.
Conditions in context
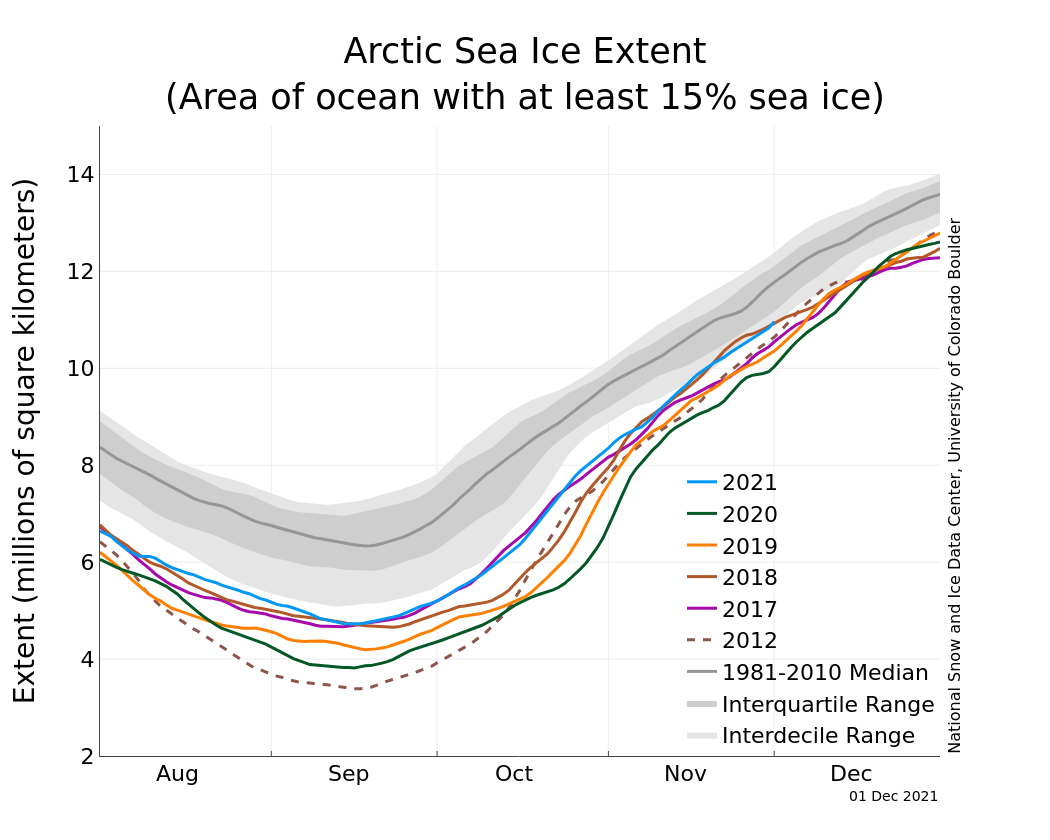
Figure 2a. The graph above shows Arctic sea ice extent as of December 1 2021, along with daily ice extent data for four previous years and the record low year. 2021 is shown in blue, 2020 in green, 2019 in orange, 2018 in brown, 2017 in magenta, and 2012 in dashed brown. The 1981 to 2010 median is in dark gray. The gray areas around the median line show the interquartile and interdecile ranges of the data. Sea Ice Index data.
Credit: National Snow and Ice Data Center
High-resolution image
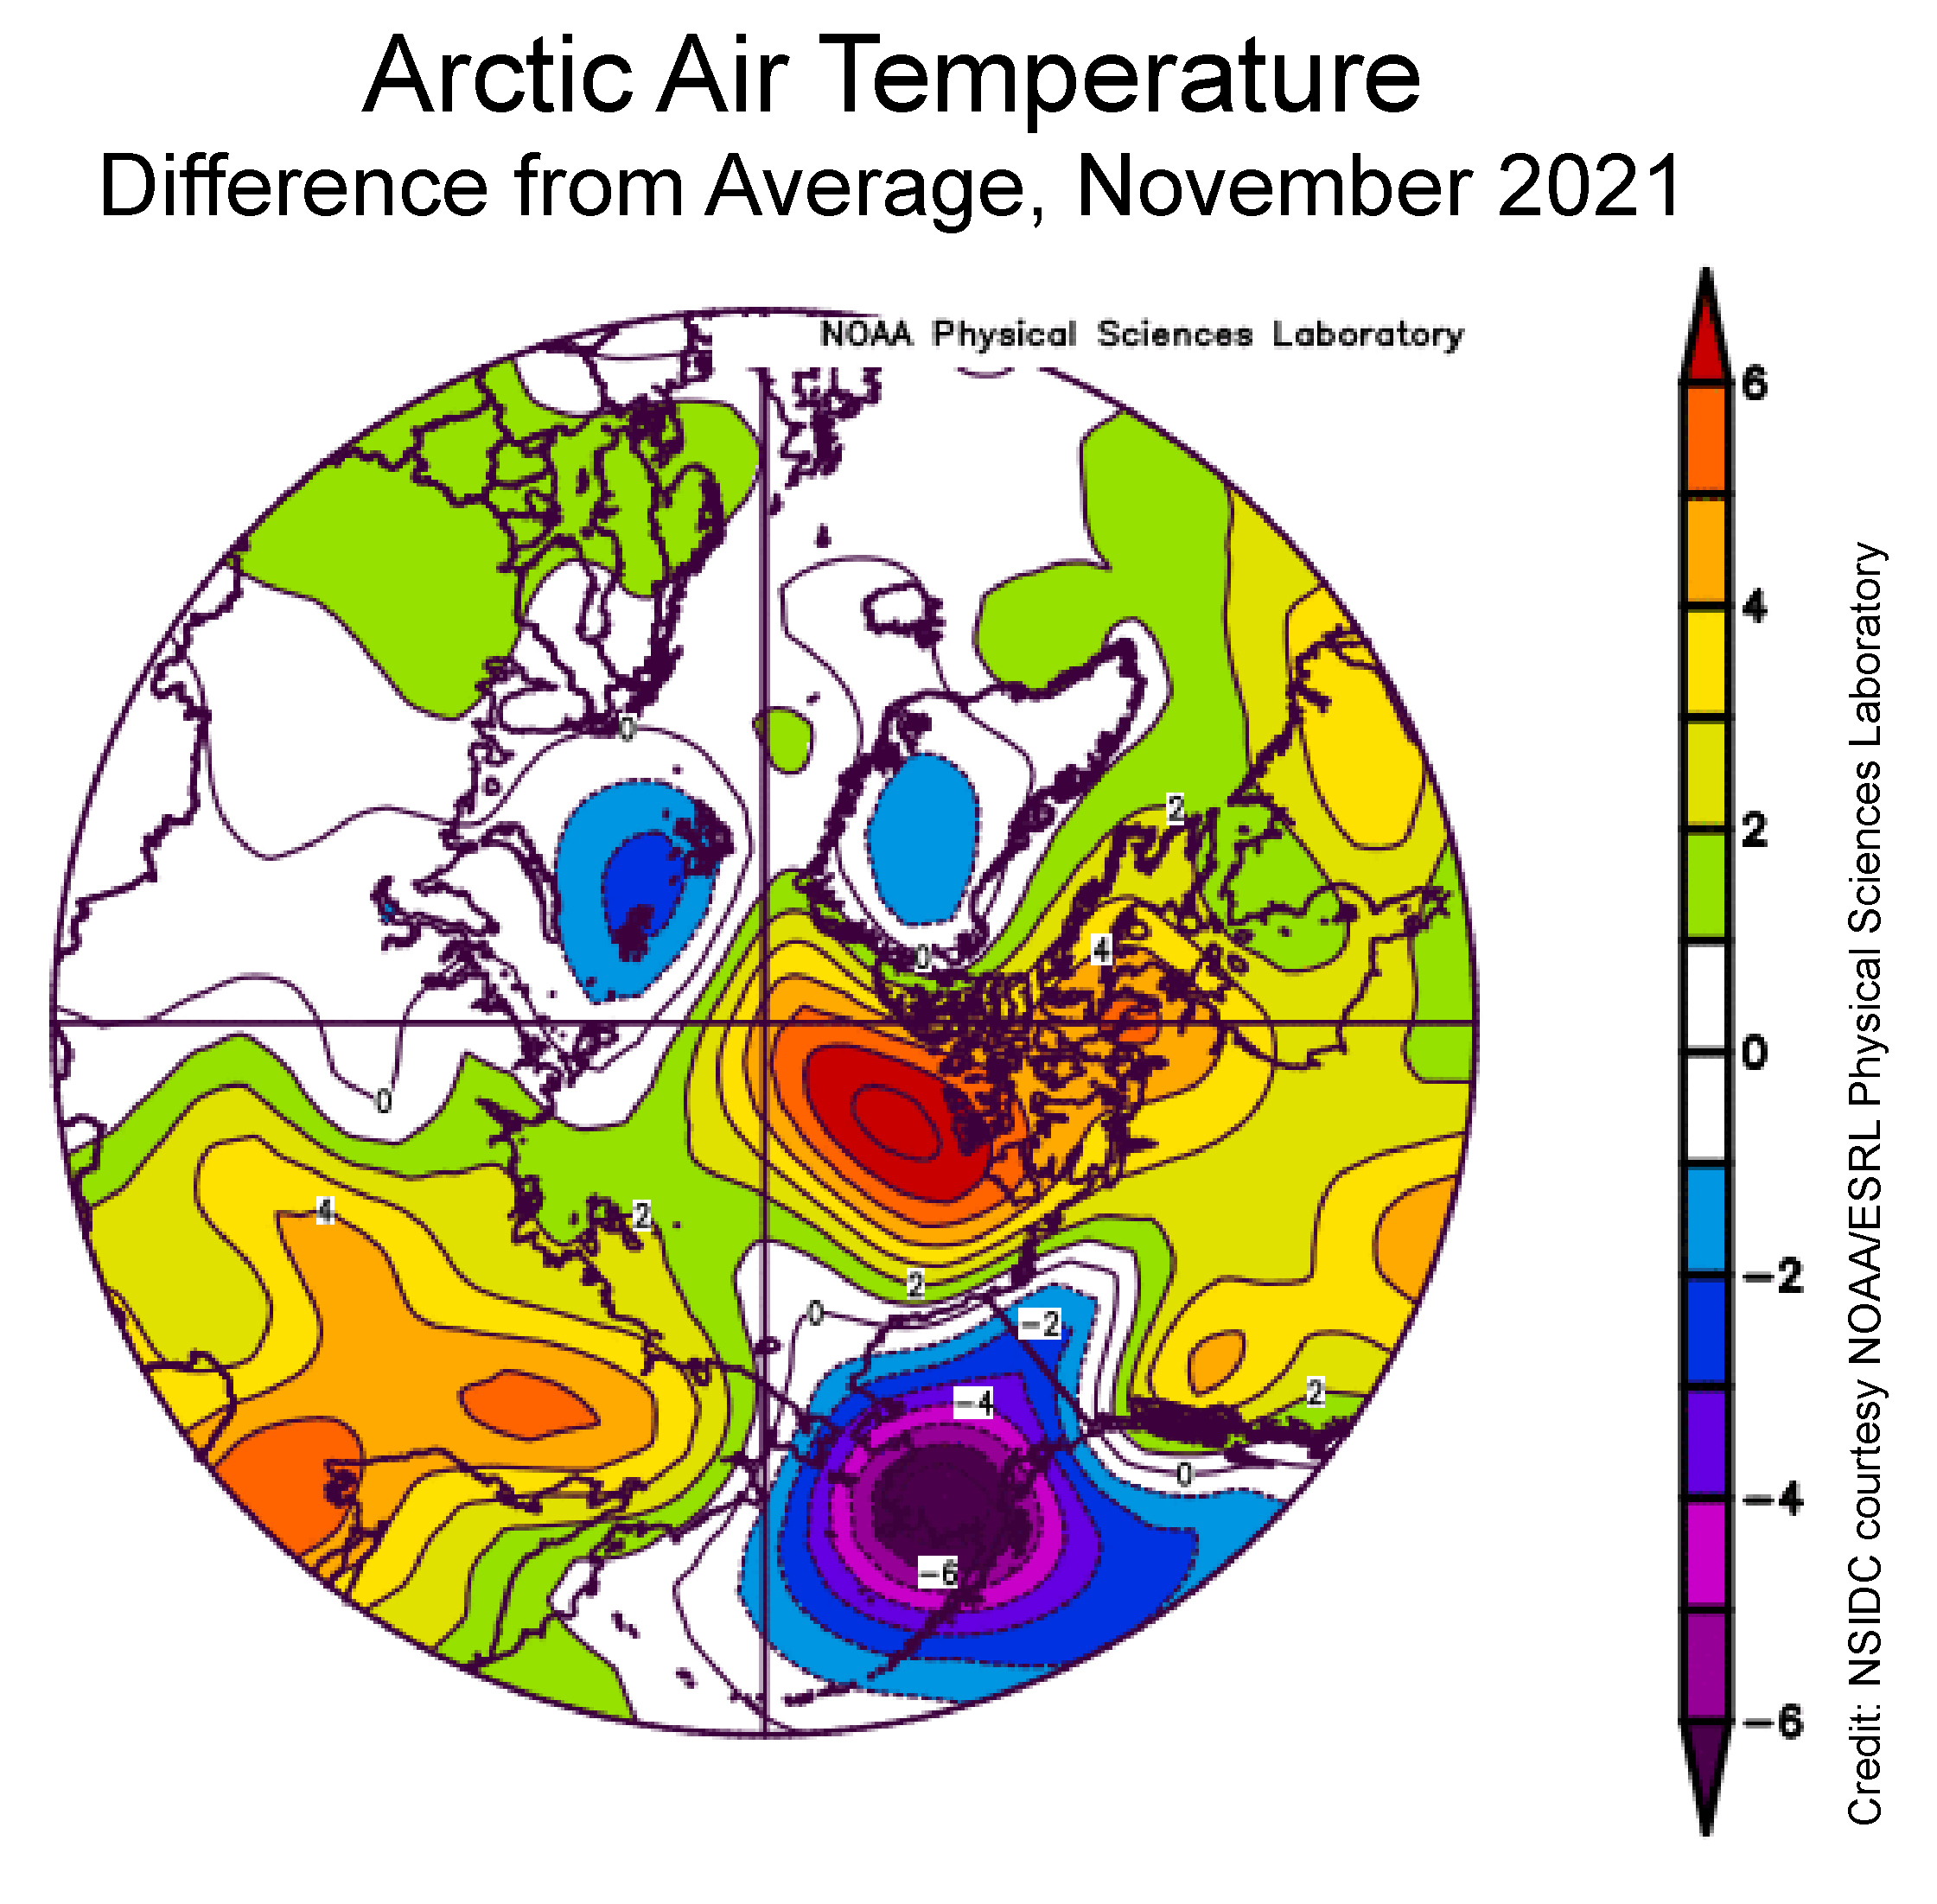
Figure 2b. This plot shows the departure from average air temperature in the Arctic at the 925 hPa level, in degrees Celsius, for November 2021. Yellows and reds indicate higher than average temperatures; blues and purples indicate lower than average temperatures.
Credit: NSIDC courtesy NOAA Earth System Research Laboratory Physical Sciences Laboratory
High-resolution image
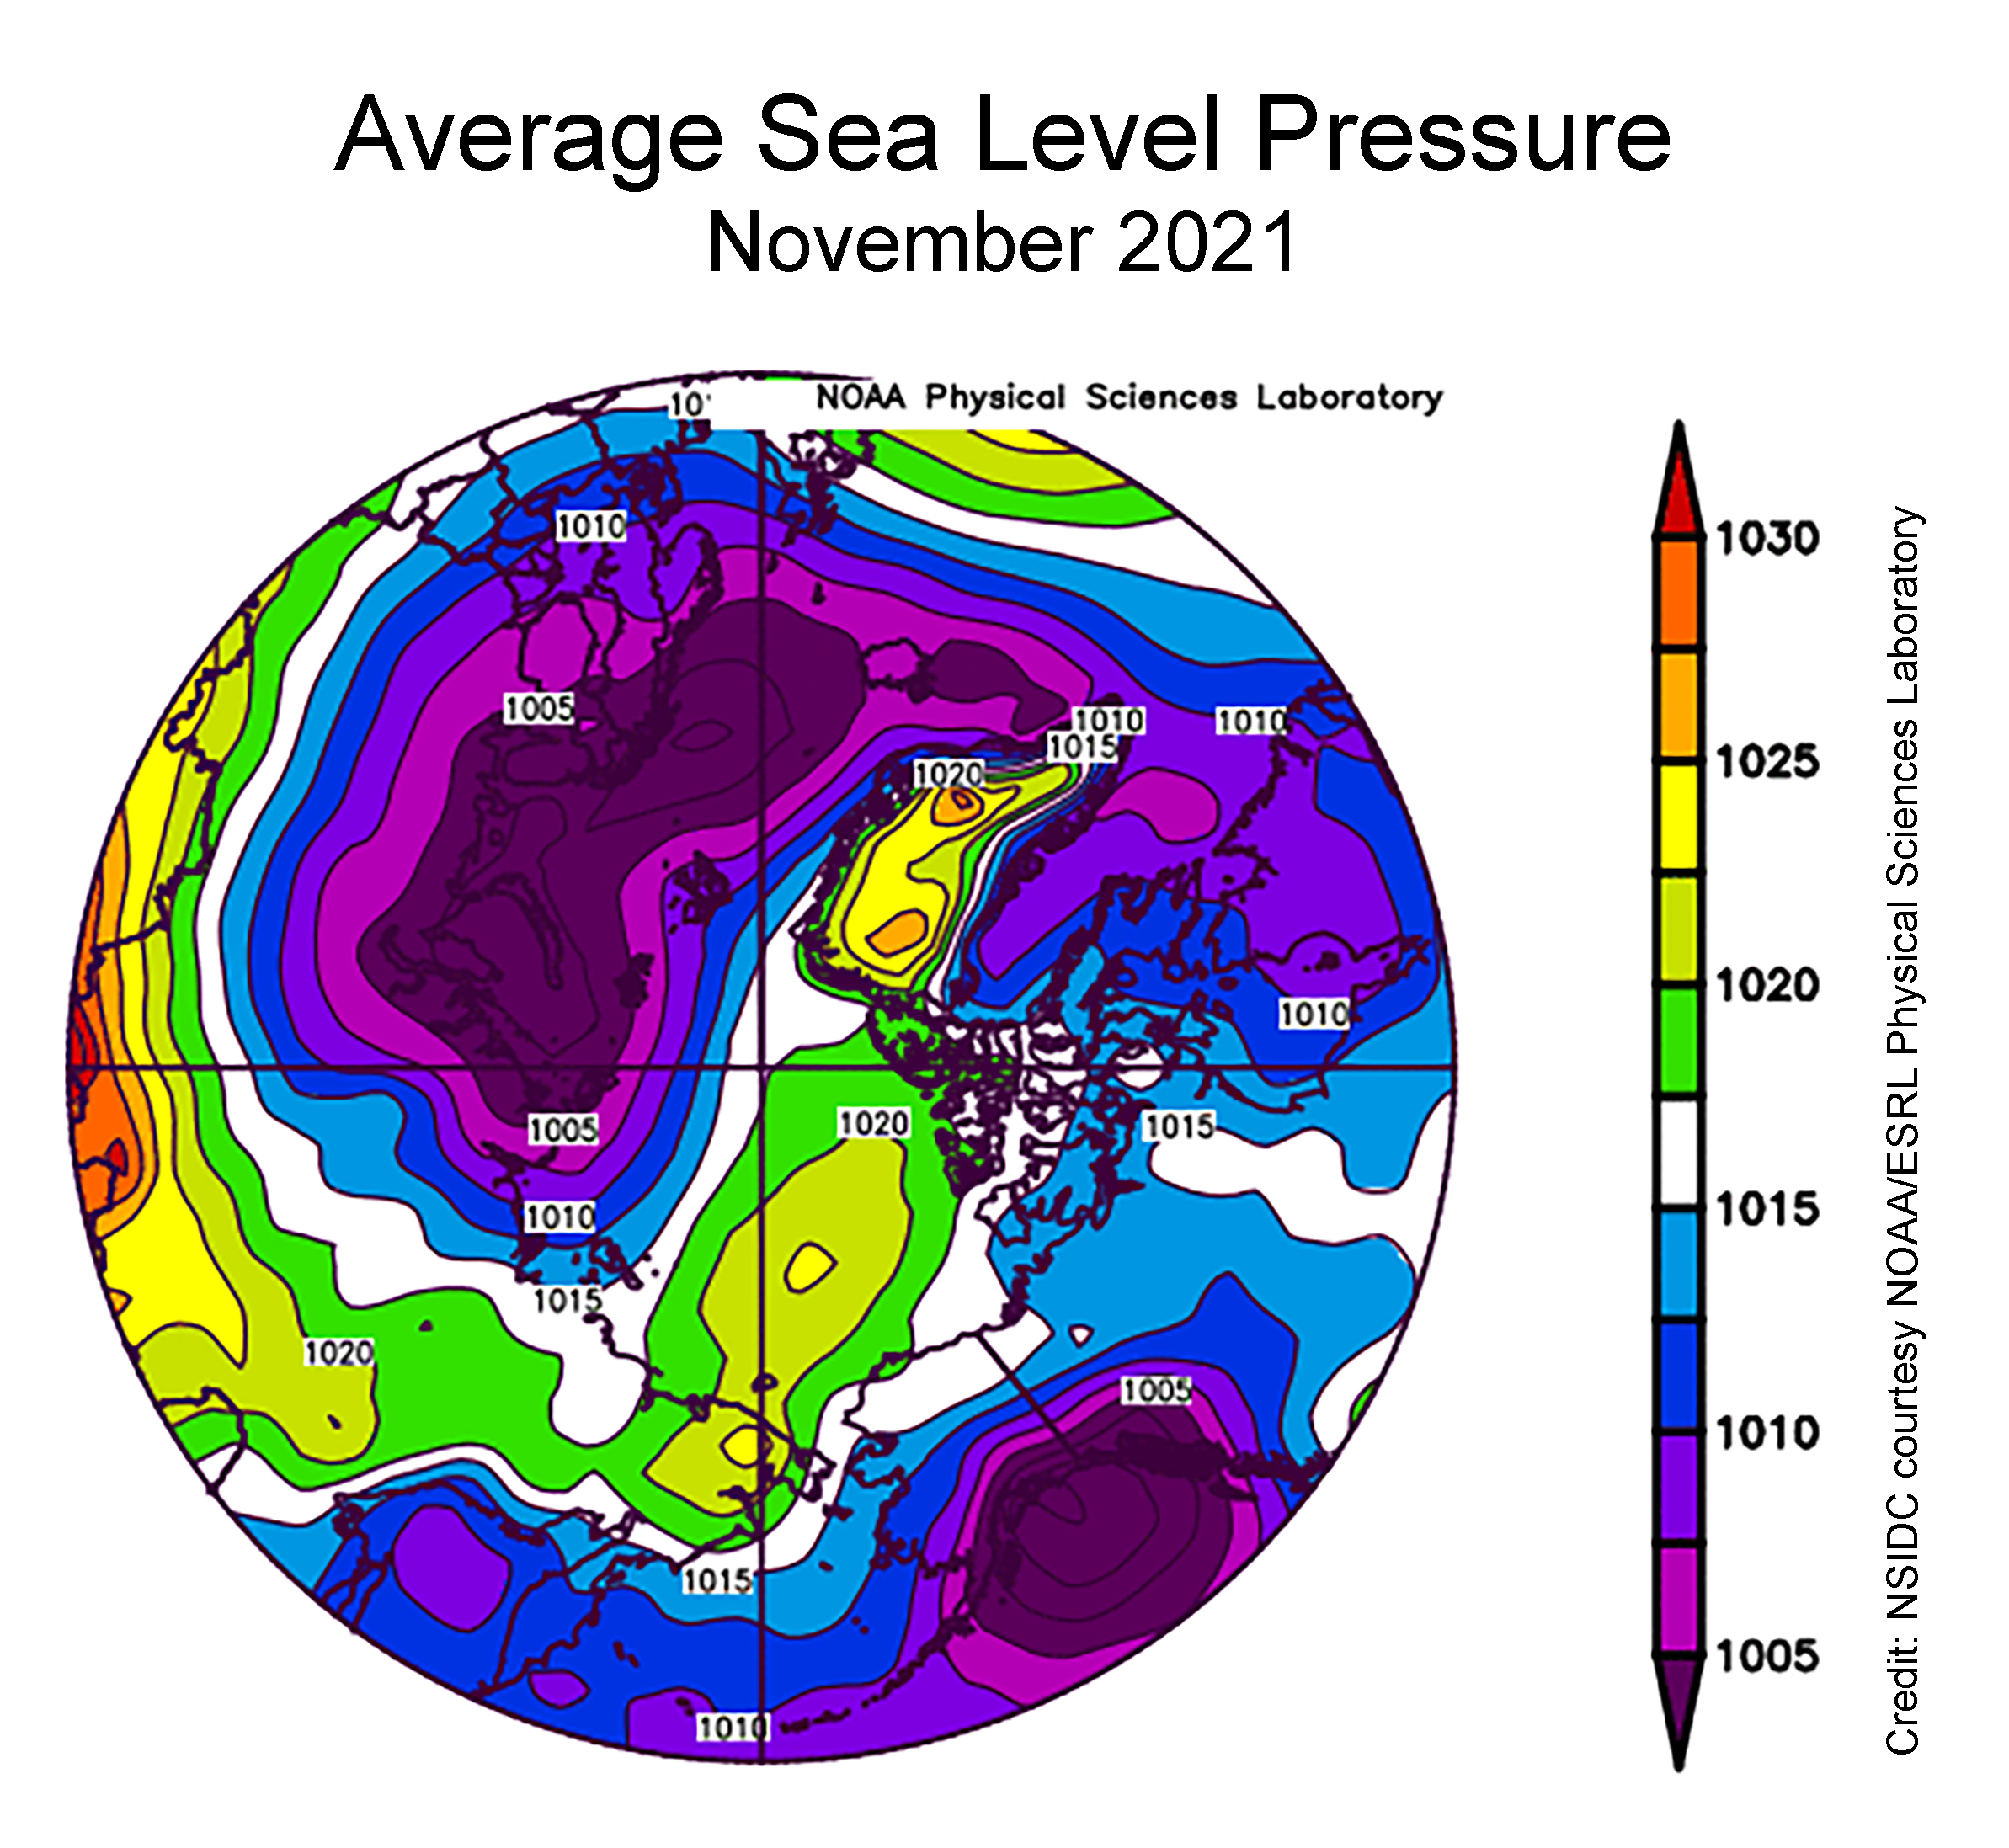
Figure 2c. This plot shows average sea level pressure in the Arctic in millibars for November 2021. Yellows and reds indicate high air pressure; blues and purples indicate low pressure.
Credit: NSIDC courtesy NOAA Earth System Research Laboratory Physical Sciences Laboratory
High-resolution image
Air temperatures at the 925 millibar level (about 2,500 feet above the surface) were well above average north of the Canadian Archipelago, by as much as 6 degrees Celsius (11 degrees Fahrenheit). Conversely, temperatures over southwest Alaska and the eastern sector of the Bering Sea were as much as 6 degrees Celsius (11 degrees Fahrenheit) below average (Figure 2b).
The sea level pressure pattern for November featured widespread low pressure over the Atlantic side of the Arctic and extending into the Barents and Kara Seas, paired with a moderately strong Beaufort Sea High (Figure 2c). Strong low pressure over the Gulf of Alaska resulted in a circulation pattern in the eastern Bering Sea that brought cold air from the north. This pattern was favorable for sea ice growth, and can explain the above average ice extent in the region.
November 2021 compared to previous years
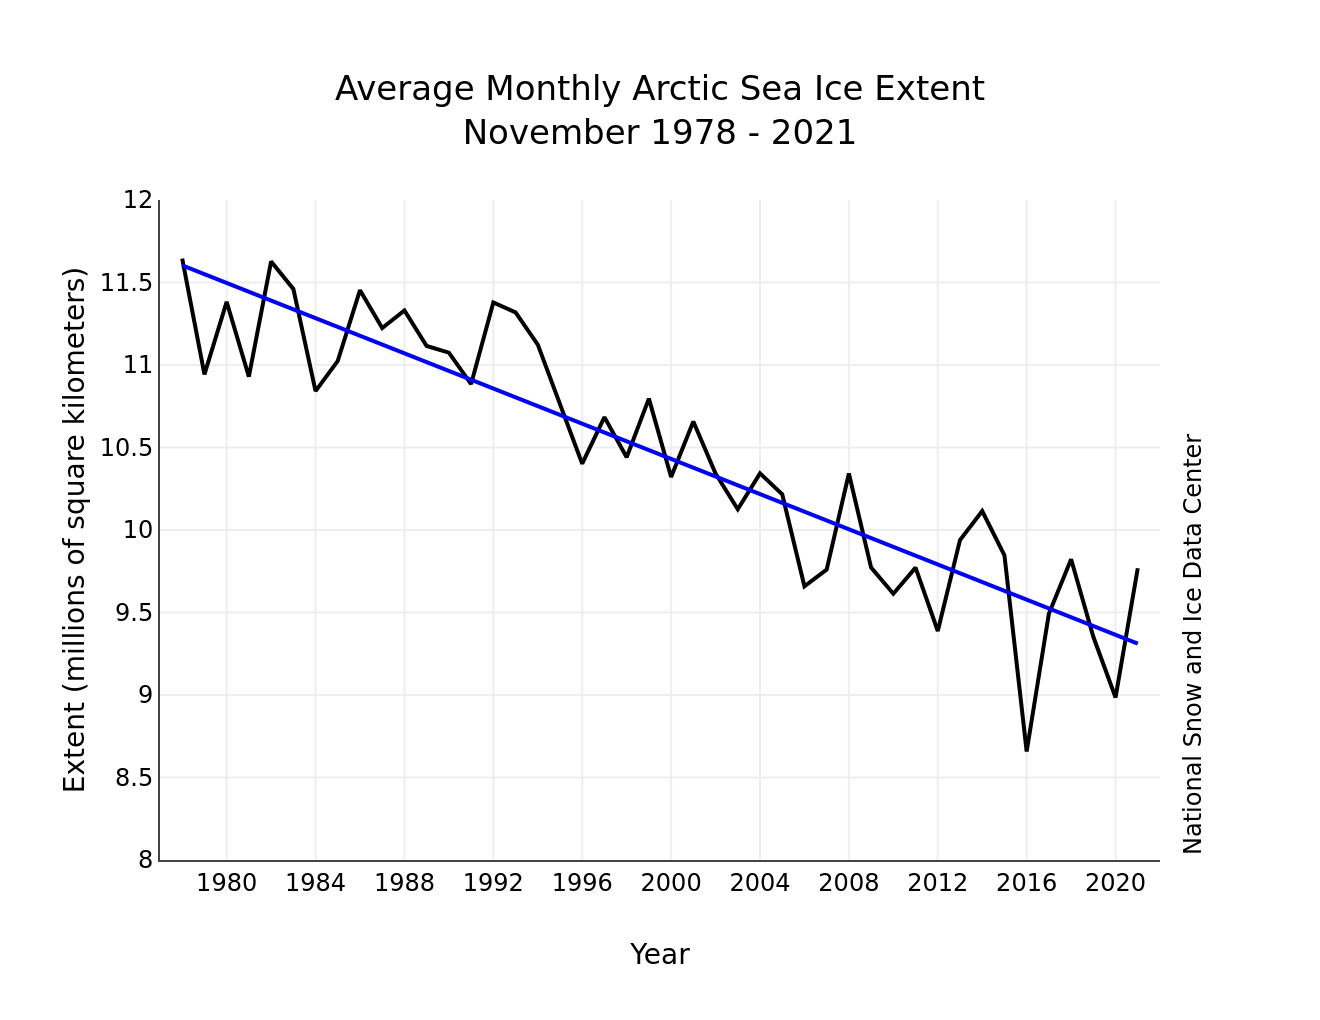
Figure 3. Monthly November ice extent for 1979 to 2021 shows a decline of 5.0 percent per decade.
Credit: National Snow and Ice Data Center
High-resolution image
The downward linear trend in November sea ice extent over the 43-year satellite record is 53,300 square kilometers (20,600 square miles) per year, or 5 percent per decade relative to the 1981 to 2010 average. Also based on the linear trend, since 1979, November has lost 2.2 million square kilometers (849,000 square miles). This is equivalent to about three times the size of Texas.
No freeze in Hudson Bay
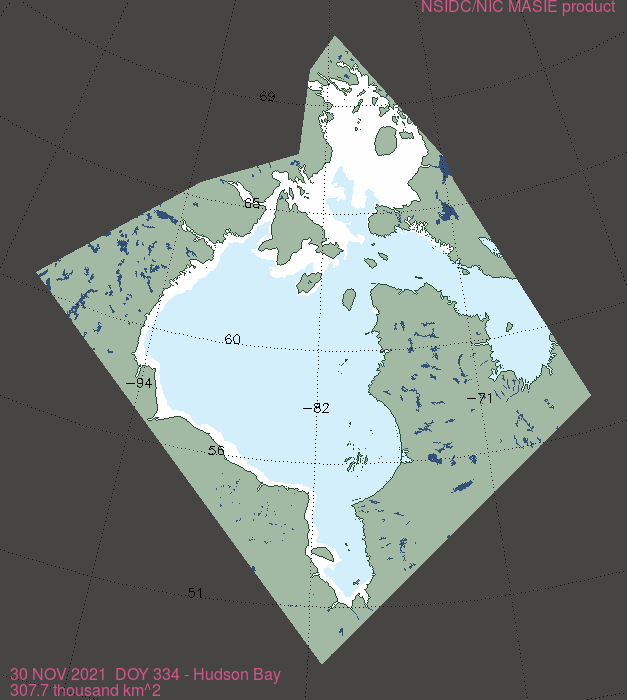
Figure 4. This map of Hudson Bay shows sea ice extent as of November 30, 2021. The US National Ice Center/NSIDC Multisensor Analyzed Sea Ice Extent (MASIE) product provides the data for this map.
Credit: US National Ice Center and National Snow and Ice Data Center
High-resolution image
Typically, Hudson Bay begins freezing up by the beginning of November. By the end of the month, the northern half of the bay is usually completely iced over. However, as of the end of November 2021, only the far north has frozen over; the rest of the bay is ice free except for a narrow band of ice along the western coastline. According to the NSIDC Sea Ice Index, this is the second lowest extent in Hudson Bay at this time, above only 2010.
The USNIC/NSIDC Multisensor Analyzed Sea Ice Extent (MASIE) product provides a more detailed view (Figure 4). It also shows ice only in the far north of the region and along the western coast. The lack of ice has potential ramifications for polar bears in the region that must wait for the bay to freeze over to hunt. While the lack of ice in Hudson Bay at this time of year is extreme, the bay will eventually freeze over through the coming winter.
Frozen in the Northern Sea Route

An early freeze of sea-ice has led to logistical chaos on the Northern Sea Route.
Credit: Rosatomflot via The Independent Barents Observer
High-resolution image
The story on the opposite side of the Arctic stands in sharp contrast to Hudson Bay. Ice formed along the eastern part of the Siberian coast relatively early, at least compared to recent years. This caught ships transiting through the Northern Sea Route by surprise. Several have become frozen in and are awaiting icebreakers to free them. In addition to the surprisingly early freeze up, winds also pushed ice together into ridges (piled up ice) that are much more difficult to navigate through. Supplies to northern Siberian cities have been delayed.
Springtime in the South
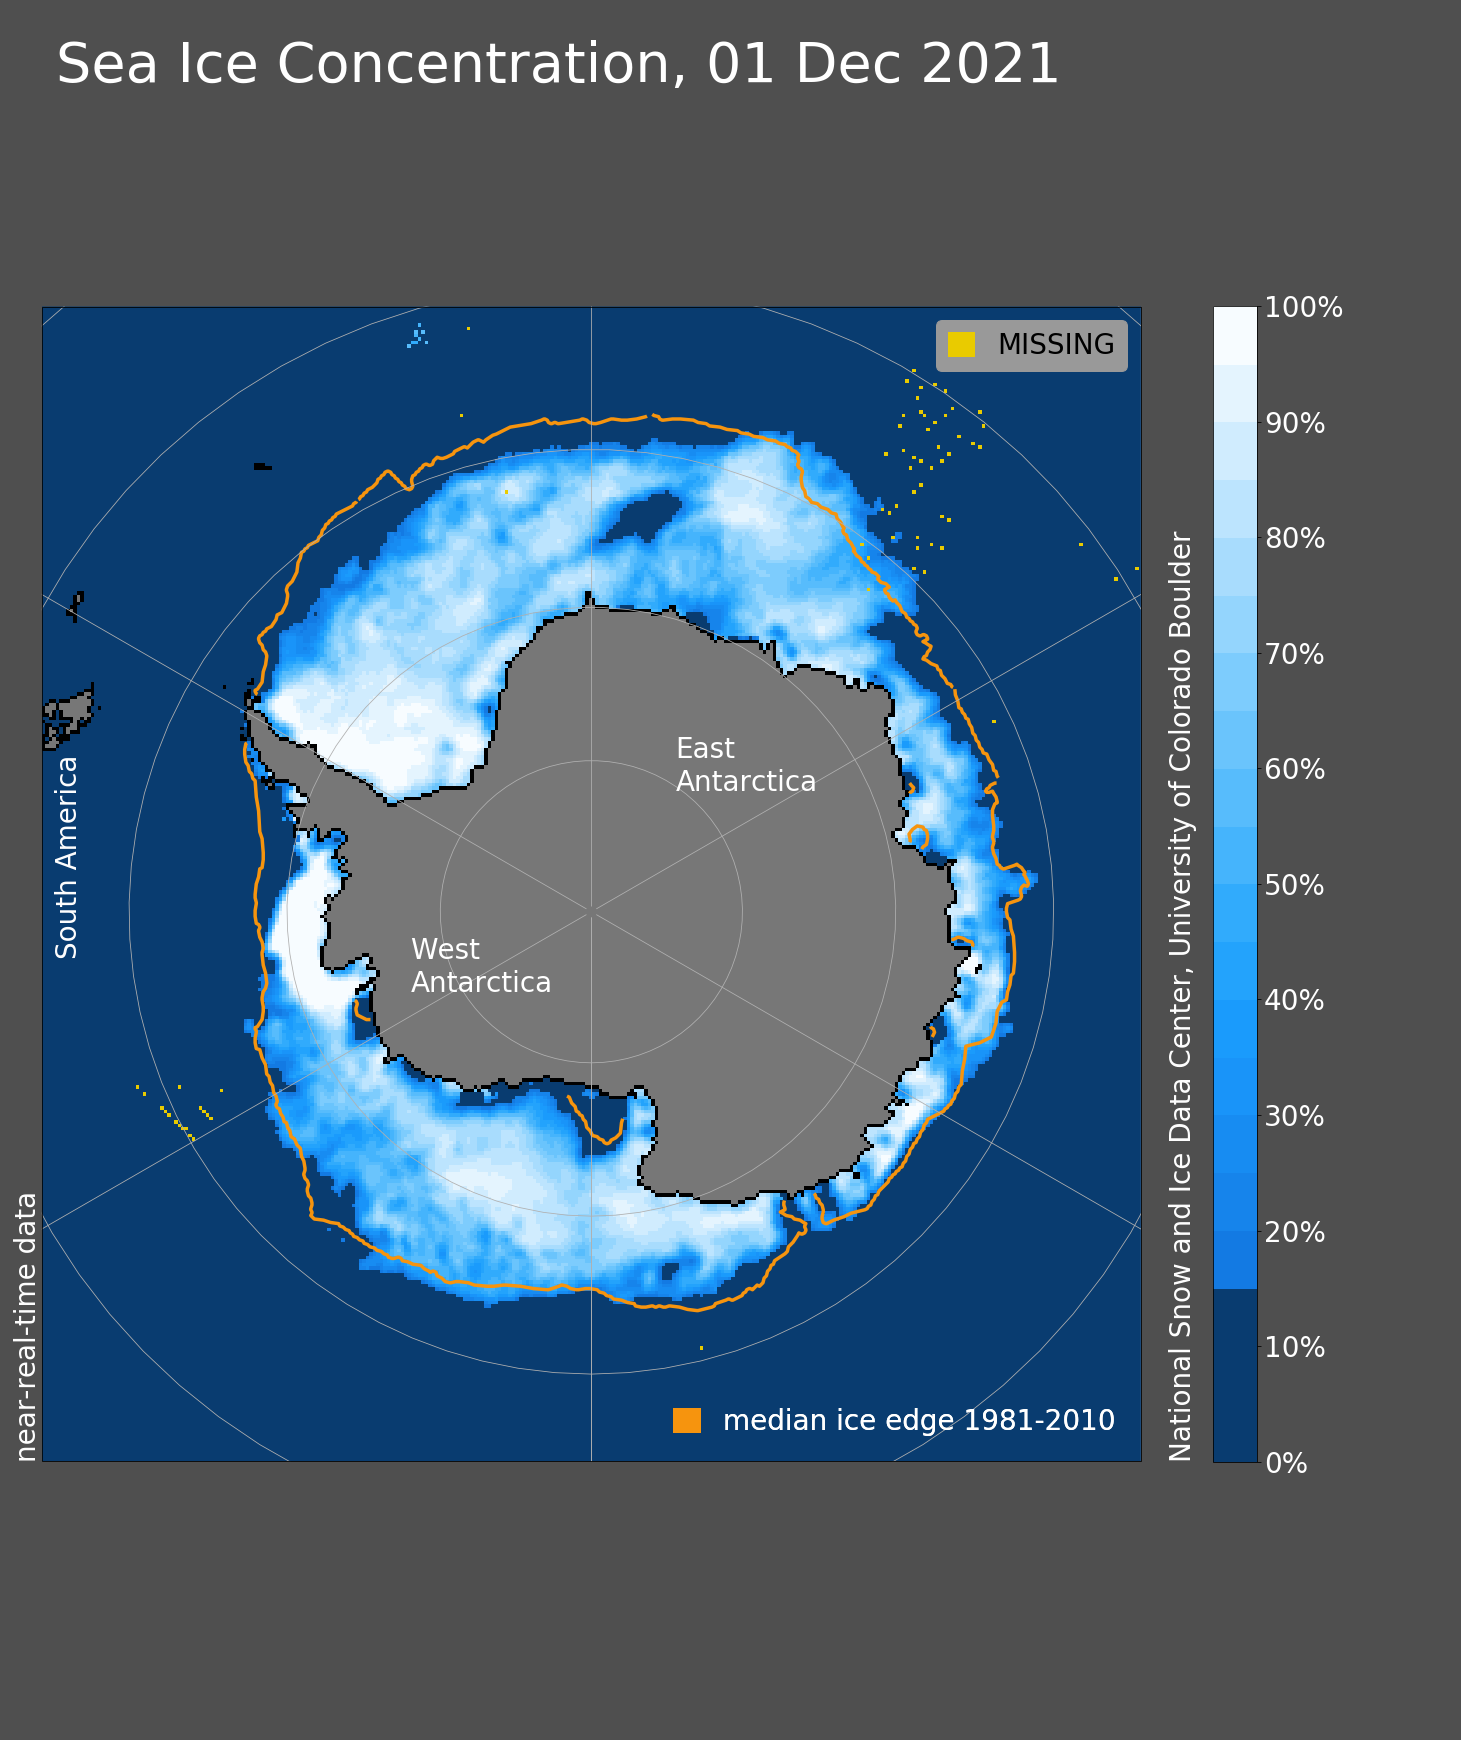
Figure 5. This maps shows Antarctic sea ice concentration on December 1, 2021. The yellow area shows missing data. The orange line shows the 1981 to 2010 average extent for that day. Sea Ice Index data. About the data
Credit: National Snow and Ice Data Center
High-resolution image
In the Antarctic, ice extent declined relatively rapidly during the austral spring. By the end of November, extent was the second lowest in the satellite record, bested only by the extreme low recorded in 2016. Extent was particularly low in the Bellingshausen and Weddell Seas as well as in the Indian Ocean sector, north of Enderby Land. The Maud Rise polynya has once again formed. This feature was not seen for many years after the 1970s, but has started to form in recent years.
ASINA team member Ted Scambos is currently on his way to Antarctica for field work.
Reference
US National Ice Center and National Snow and Ice Data Center. Compiled by F. Fetterer, M. Savoie, S. Helfrich, and P. Clemente-Colón. 2010, updated daily. Multisensor Analyzed Sea Ice Extent – Northern Hemisphere (MASIE-NH), Version 1. Boulder, Colorado USA. NSIDC: National Snow and Ice Data Center. doi:10.7265/N5GT5K3K.

