Arctic sea ice extent declined rapidly the latter half of July, despite the persistence of low sea level pressure over the Arctic Ocean and generally cool conditions. At the same time, unusually high sea level pressure persisted over the United Kingdom and Scandinavia, where several new record high temperatures were reached, fostering extensive wildfires.
Overview of conditions
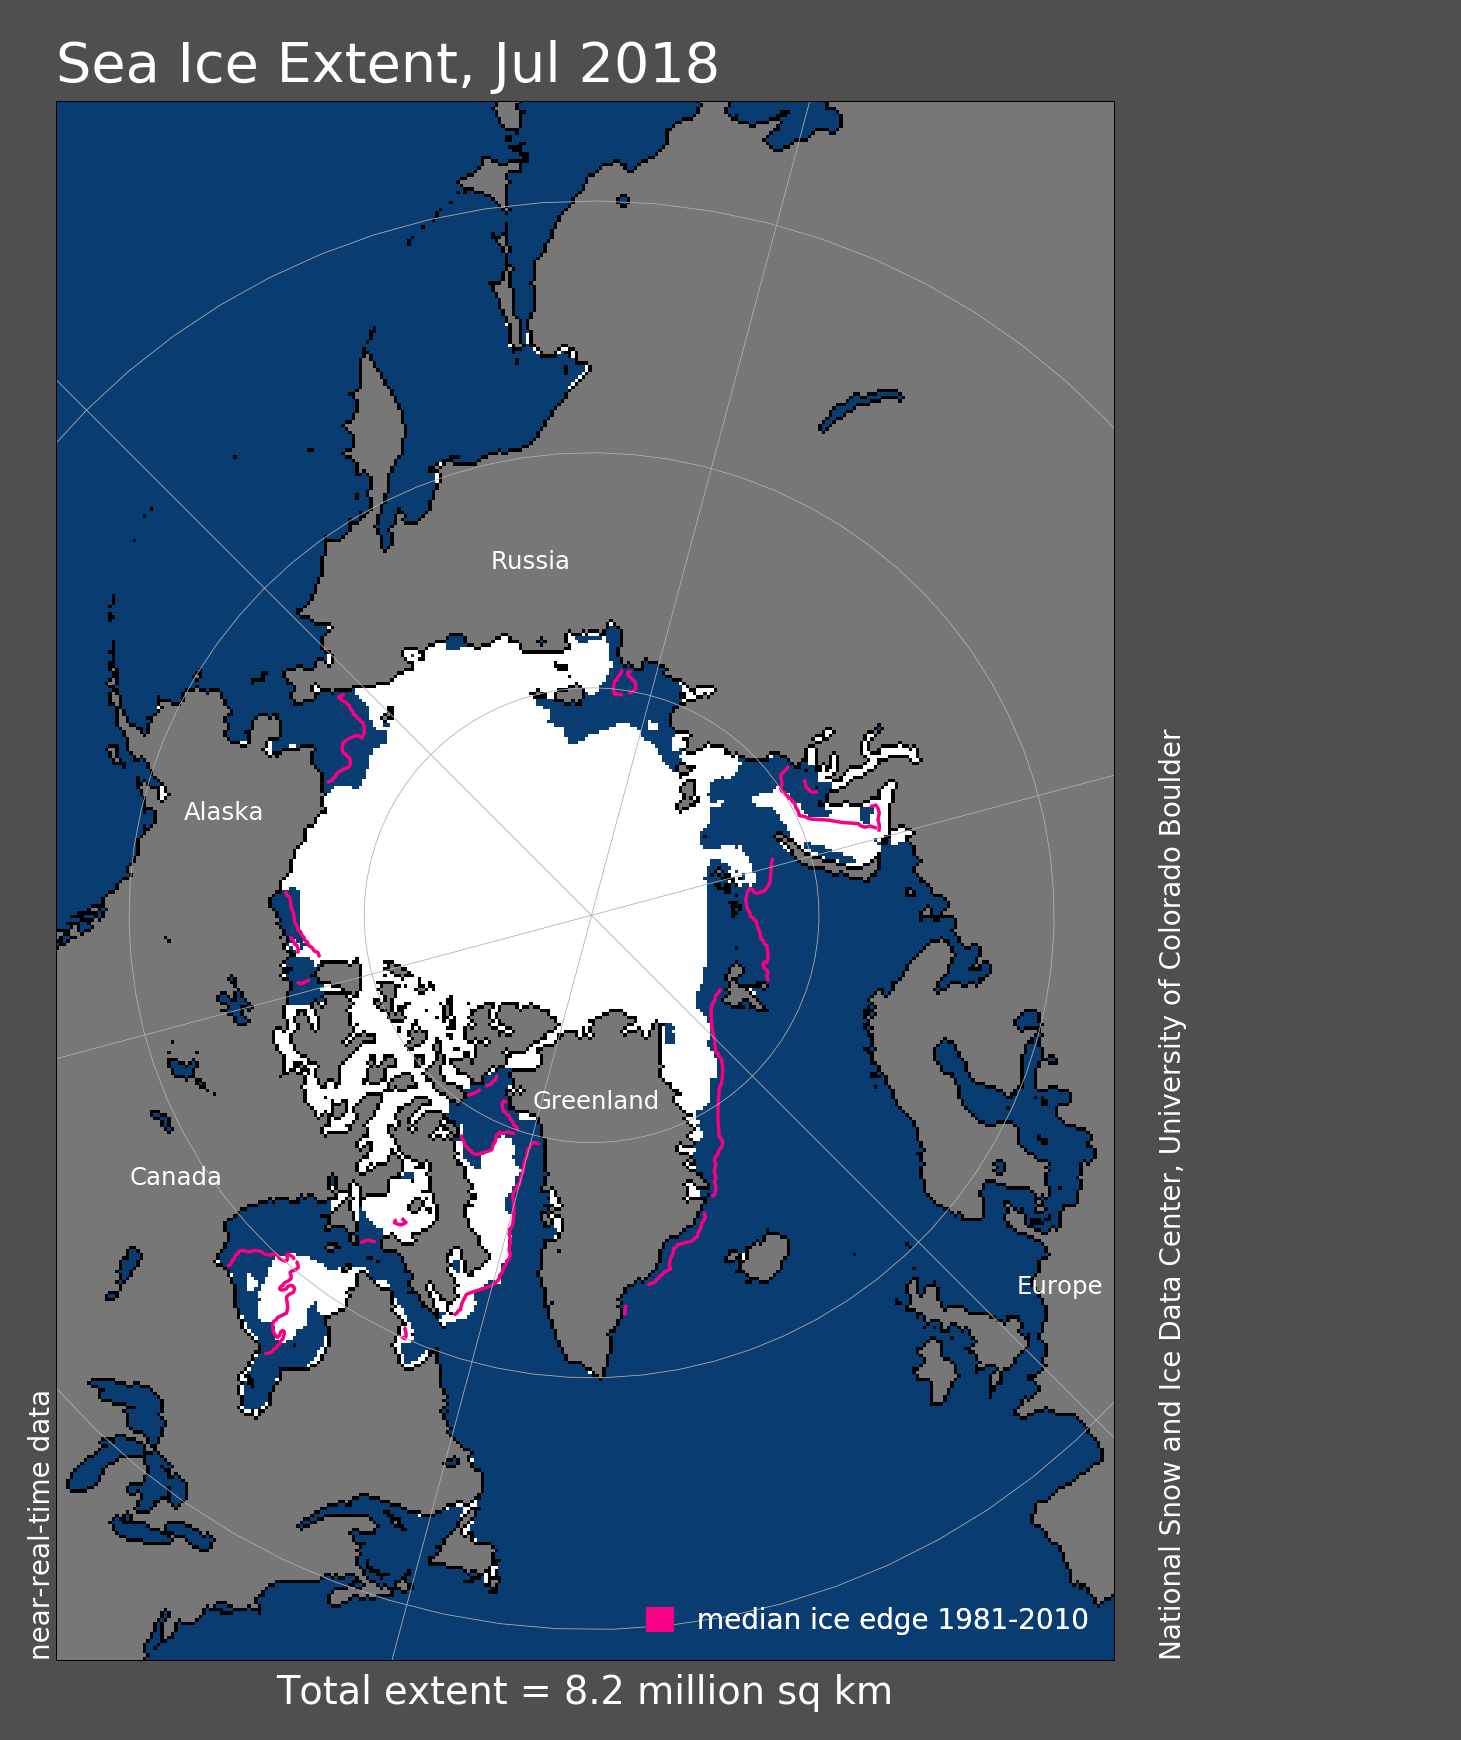
Figure 1. Arctic sea ice extent for July 2018 was 8.22 million square kilometers (3.20 million square miles). The magenta line shows the 1981 to 2010 average extent for that month. Sea Ice Index data. About the data
Credit: National Snow and Ice Data Center
High-resolution image
Arctic sea ice extent for July 2018 averaged 8.22 million square kilometers (3.20 million square miles). This was 1.25 million square kilometers (483,000 square miles) below the 1981 to 2010 long-term average sea ice extent, and 550,000 square kilometers (212,000 square miles) above the record low for the month set in July 2012. July 2018 was the ninth lowest July extent in the satellite record.
Despite finishing ninth lowest in the monthly average, ice loss was rapid during the month. As a result, by July 31 daily extent tracked fourth lowest in the satellite record, just below the extent seen last year at this time, and also just above that seen in 2007, 2011, and 2012. Extent remained unusually low in the Atlantic sector of the Arctic, including the Barents, Kara, Laptev, and East Greenland Seas, whereas the ice edge in the Beaufort and East Siberian Seas remained near average. By the end of July, the ice within Hudson Bay had all melted out and the ice edge in the Chukchi Sea had also retreated far north of its average position for this time of year. This pattern is in stark contrast to last year when by July’s end, the ice edge was located far north of its usual position in the Beaufort and East Siberian Seas while with ice on the Atlantic side, extent was near average.
Conditions in context
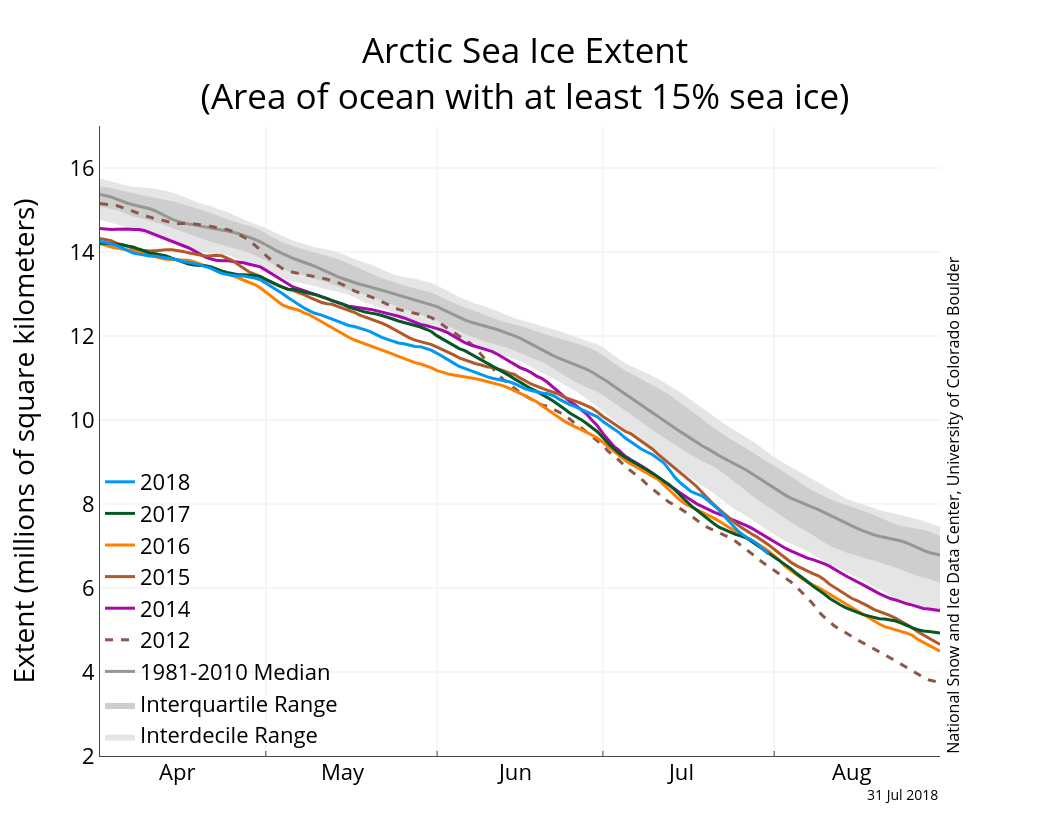
Figure 2. The graph above shows Arctic sea ice extent as of July 31, 2018, along with daily ice extent data for four previous years and the record low year. 2018 is shown in blue, 2017 in green, 2016 in orange, 2015 in brown, 2014 in purple, and 2012 in dotted brown. The 1981 to 2010 median is in dark gray. The gray areas around the median line show the interquartile and interdecile ranges of the data. Sea Ice Index data.
Credit: National Snow and Ice Data Center
High-resolution image
Total ice loss during July was 3.27 million square kilometers (1.26 million square miles), or a rate of -105,400 square kilometers (-41,000 square miles) per day. This was faster than the 1981 to 2010 long-term average rate of retreat for the month of -86,800 square kilometers (-34,000 square miles) per day. Ice retreat occurred primarily within Hudson Bay and the Kara, Laptev, and Chukchi Seas, and to a lesser extent within Baffin Bay, the East Greenland Sea and the East Siberian coastal regions. In contrast, ice expanded slightly in parts of the Beaufort Sea. While there was little overall change in ice extent in the Beaufort Sea, ice concentration remained low over much of the region, with large areas of open water developing between ice floes. Open water areas between floes readily absorb the sun’s energy and help to enhance lateral (from the side) and basal (from the bottom) melting. However, by the end of July the sun is lower in the sky as compared to June, so this effect is diminishing.
Continuing the pattern of the last two summers, low sea level pressure persisted over the central Arctic Ocean during July, a pattern that historically has tended to slow summer ice loss. Low sea level pressure also persisted over Greenland, paired with high sea level pressure over northern Europe and Siberia to the east, and high sea level pressure over Alaska and Canada to the west. This led to air temperatures at the 925 hPa level (approximately 2,500 feet above the surface) ranging from -0.5 to -4.0 degrees Celsius (-0.9 to -7.0 degrees Fahrenheit) below average over the Kara and Laptev, and from -0.5 to -2.0 degrees Celsius (-0.9 to -4.0 degrees Fahrenheit) over the Beaufort Sea. Near the pole, air temperatures were near average or slightly above average (+0.5 to +1.0 degrees Celsius or +0.9 to +2.0 degrees Fahrenheit). Air temperatures -0.5 to -3 degrees Celsius (-0.9 to +5.0 degrees Fahrenheit) below average also persisted over central and northern Greenland.
Meanwhile, over in Scandinavia several new record high temperatures were observed during the month. In Turku, Finland, temperatures soared to 33.3 degrees Celsius (91.9 degrees Fahrenheit) on July 17, the highest temperature recorded since 1914. In central Norway, the Trondheim airport reported a temperature of 32.4 degrees Celsius (90.3 degrees Fahrenheit) on July 16, the highest on record, while Bardufoss, just south of Tromsø within the Arctic circle, saw a new record of 33.5 degrees Celsius (92.3 degrees Fahrenheit) on July 18. In Sweden, more than forty forest fires raged across the country during the unprecedented heatwave in mid-July. Fires were also burning within Lapland and Latvia. However, it was not only Scandinavia experiencing hot and dry conditions. Western Europe continued to experience prolonged heatwaves. Wildfires in Greece have already killed nearly ninety people, while Japan declared their extreme heatwave as a natural disaster, as more than sixty-five people have died and 22,000 have been treated in hospitals.
July 2018 compared to previous years
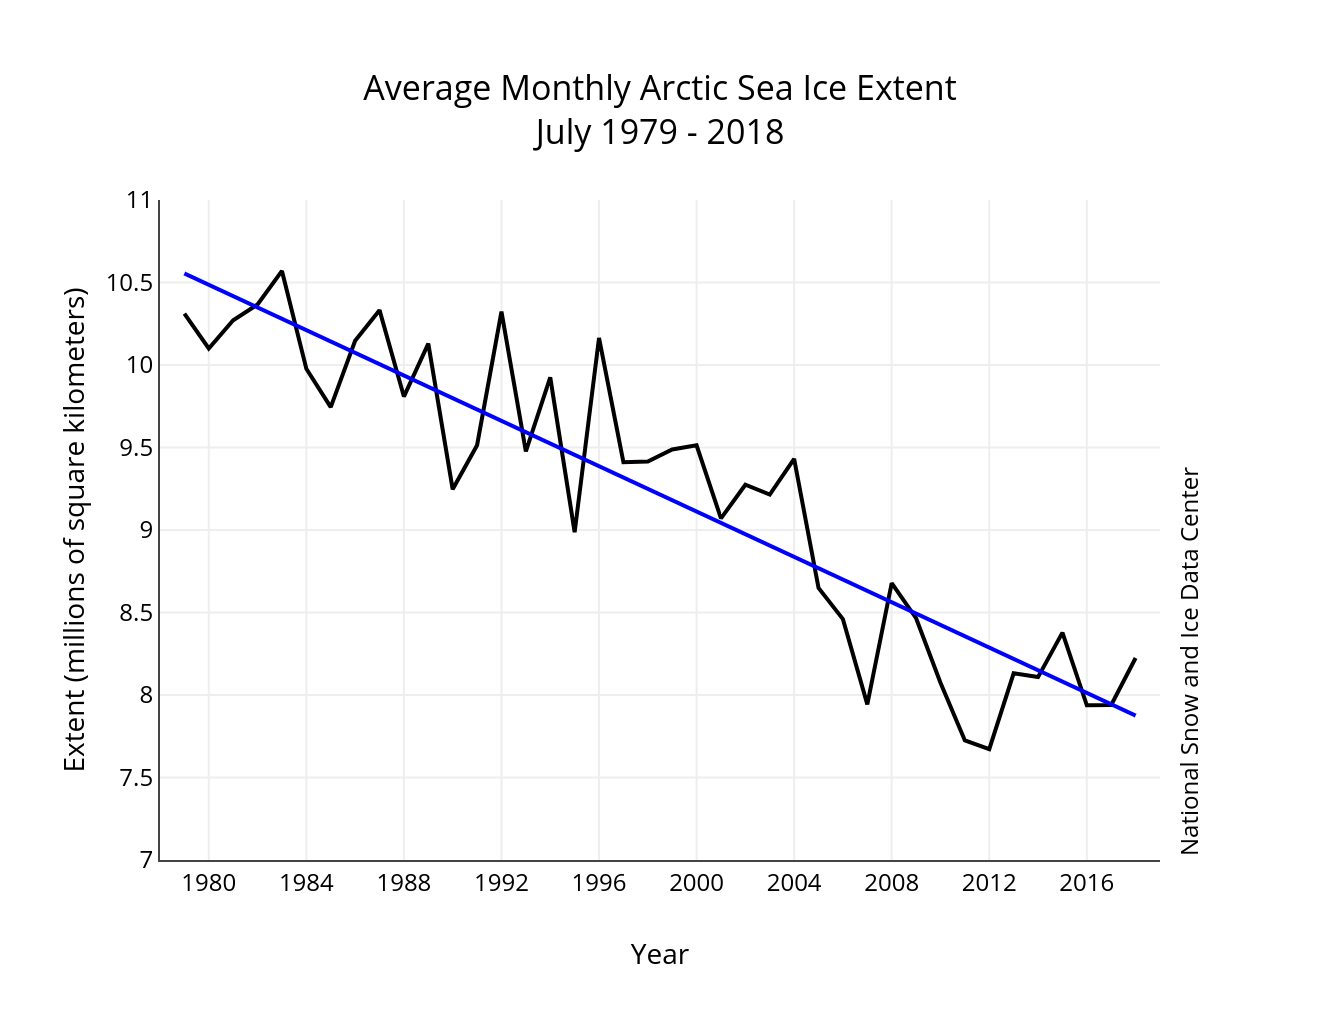
Figure 3. Monthly July ice extent for 1979 to 2018 shows a decline of 7.2 percent per decade.
Credit: National Snow and Ice Data Center
High-resolution image
The linear rate of decline for July sea ice extent is 68,700 square kilometers per year (27,000 square miles per year) or 7.2 percent per decade relative to the 1981 to 2010 average.
Beaufort on the brink?

Figure 4a. This shows a true color composite image of the Beaufort Sea in the Arctic, taken by the Moderate Resolution Imaging Spectroradiometer (MODIS) sensor on the NASA Terra satellite.
Credit: W. Meier, NSIDC/NASA
High-resolution image
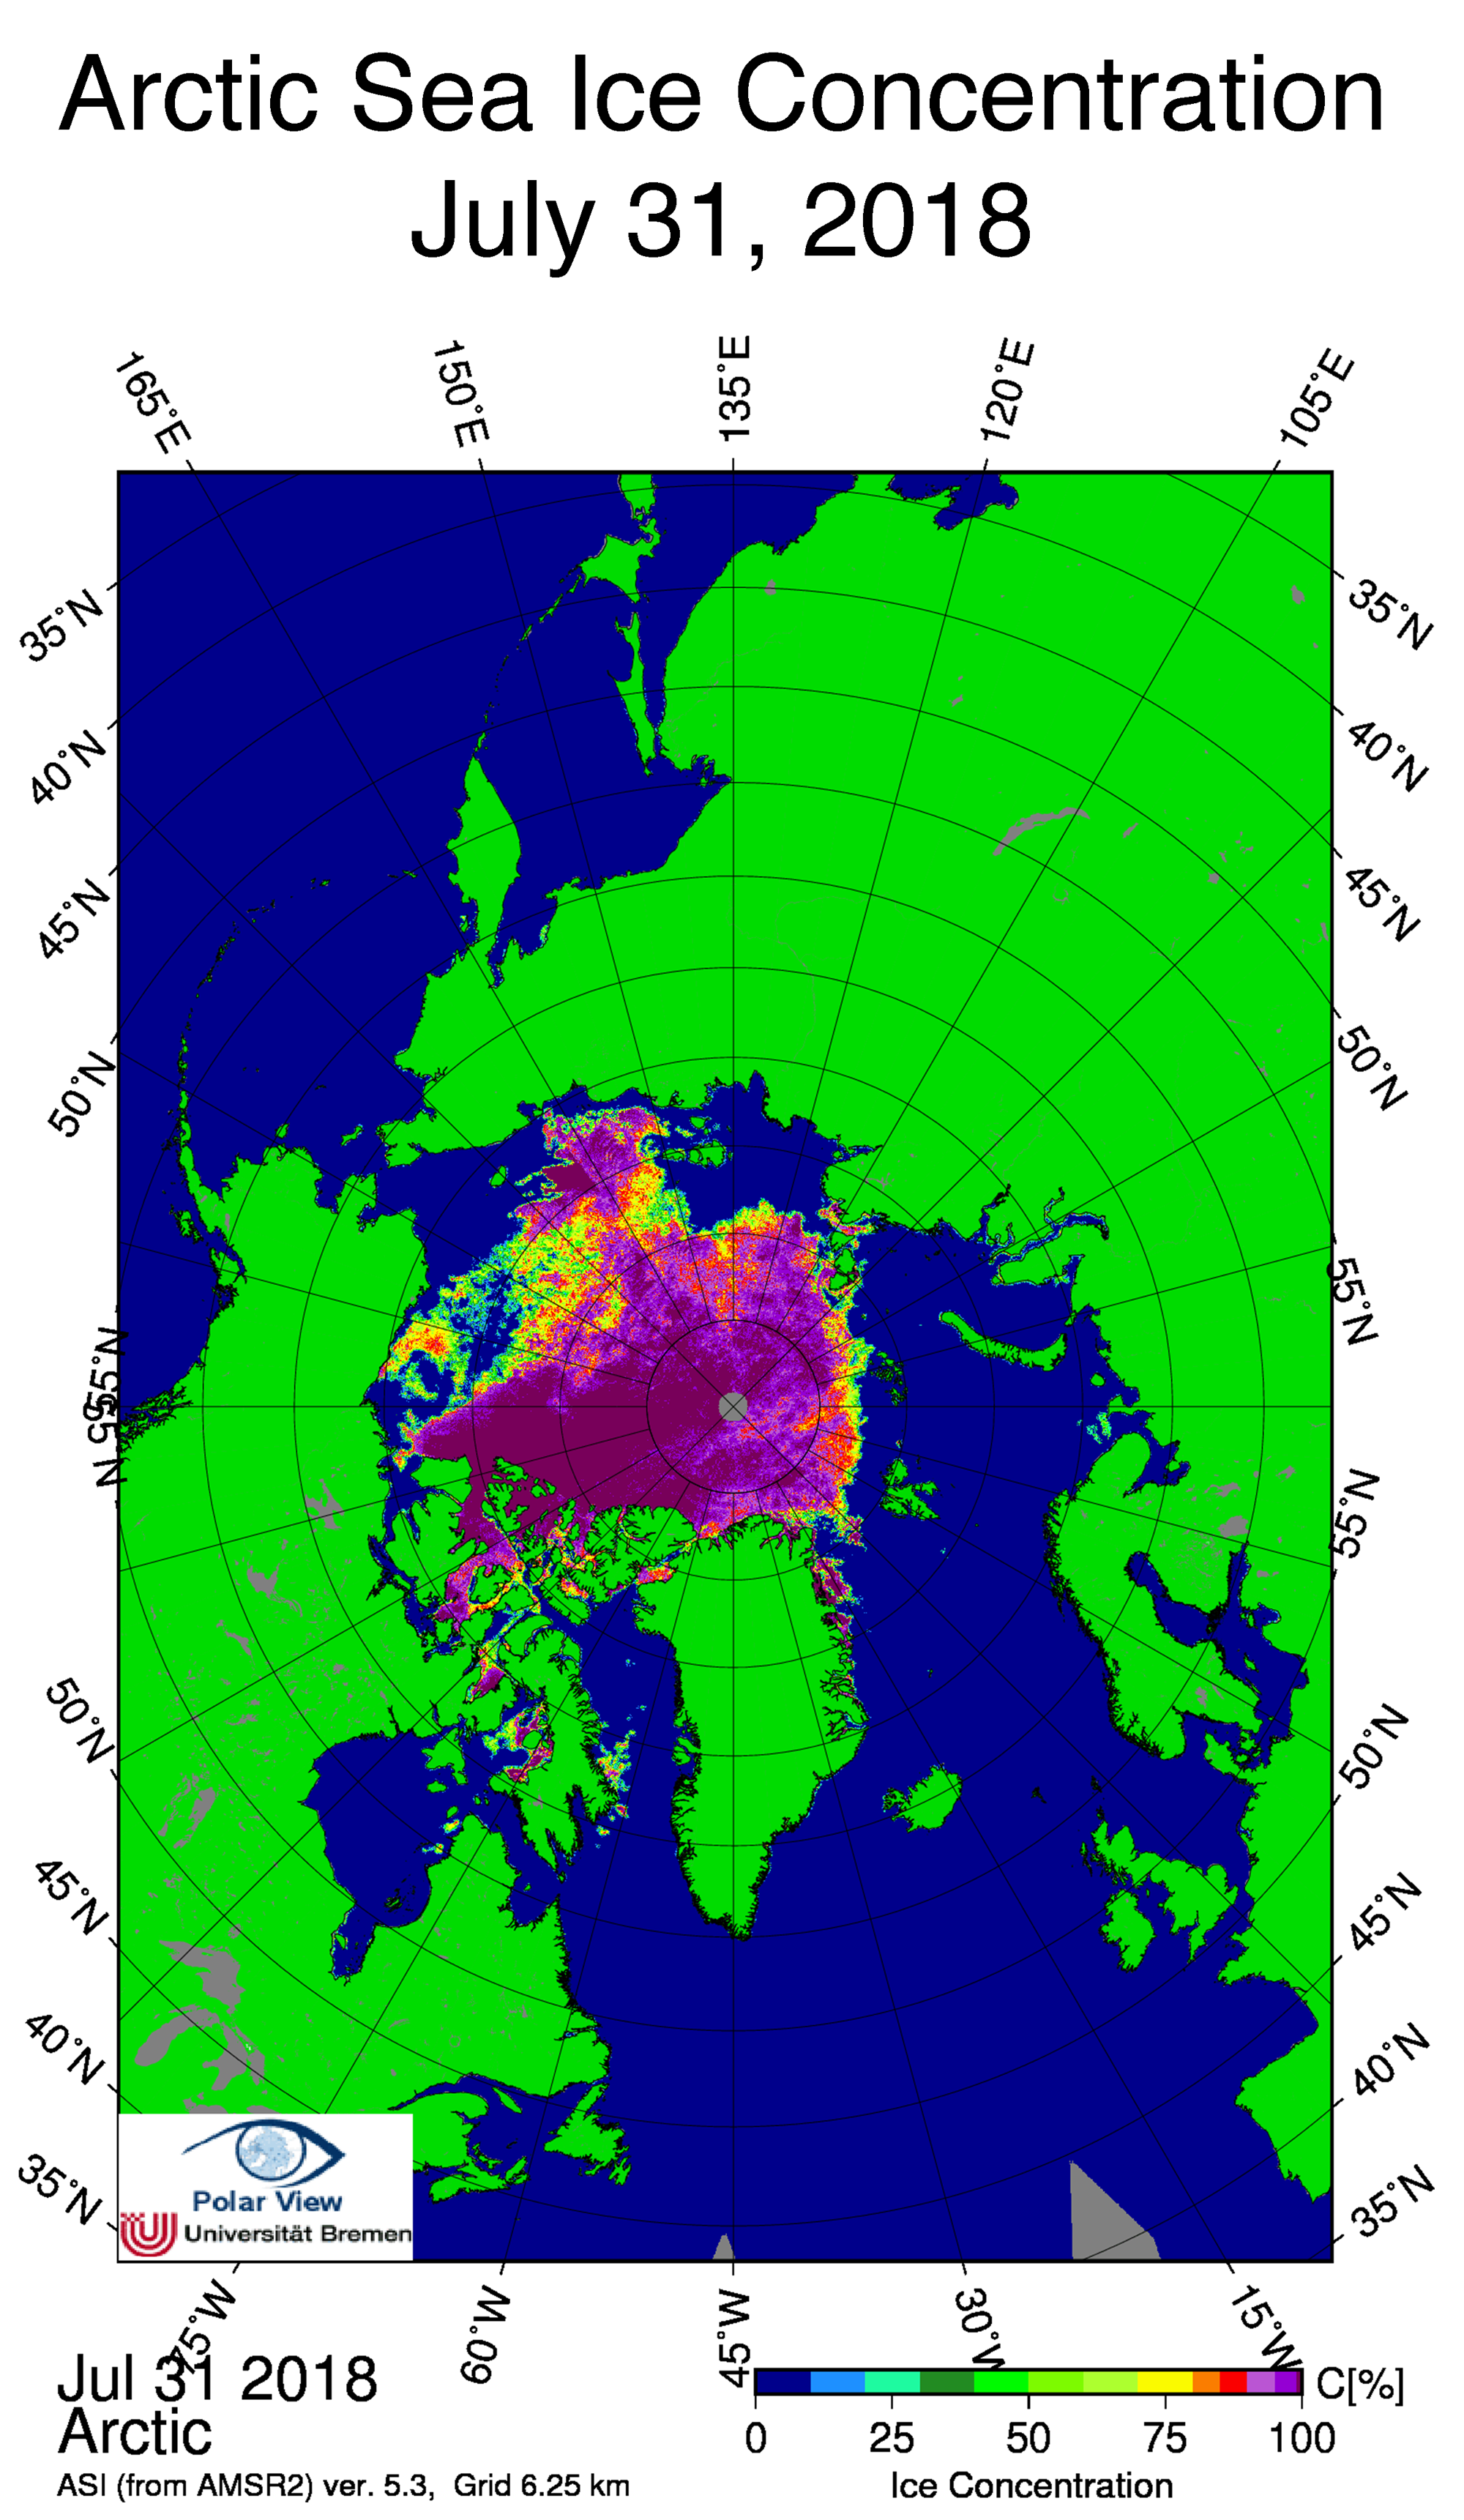
Figure 4b. This image shows sea ice concentration in the Arctic, based on data from the Japan Aerospace Exploration Agency (JAXA) Advanced Microwave Scanning Radiometer 2 (AMSR2).
Credit: University of Bremen
High-resolution image
Ice concentration over much of the Beaufort Sea has rapidly declined over the past couple of weeks. July 27 imagery from the Moderate Resolution Imaging Spectroradiometer (MODIS) sensor on the NASA Terra satellite showed a large off-shore region with broken-up ice and small ice floes vulnerable to rapid melt by the surrounding ocean (Figure 4a). Sea ice concentration data provided by the University of Bremen from the higher resolution Japan Aerospace Exploration Agency (JAXA) Advance Microwave Scanning Radiometer 2 (AMSR2) showed an expanding open water area within the ice pack between mid-July and August 1 (Figure 4b). By August 1, substantial open water was found throughout the Beaufort. On the other hand, near the coast to the east of Utqiaġvik (formerly Barrow), more compact and likely thicker ice remains, which is less likely to rapidly melt away. How much of the Beaufort ice cover survives the summer and how much more melts away will depend considerably on the weather conditions over the next four to six weeks.
Melt onset a mixed bag
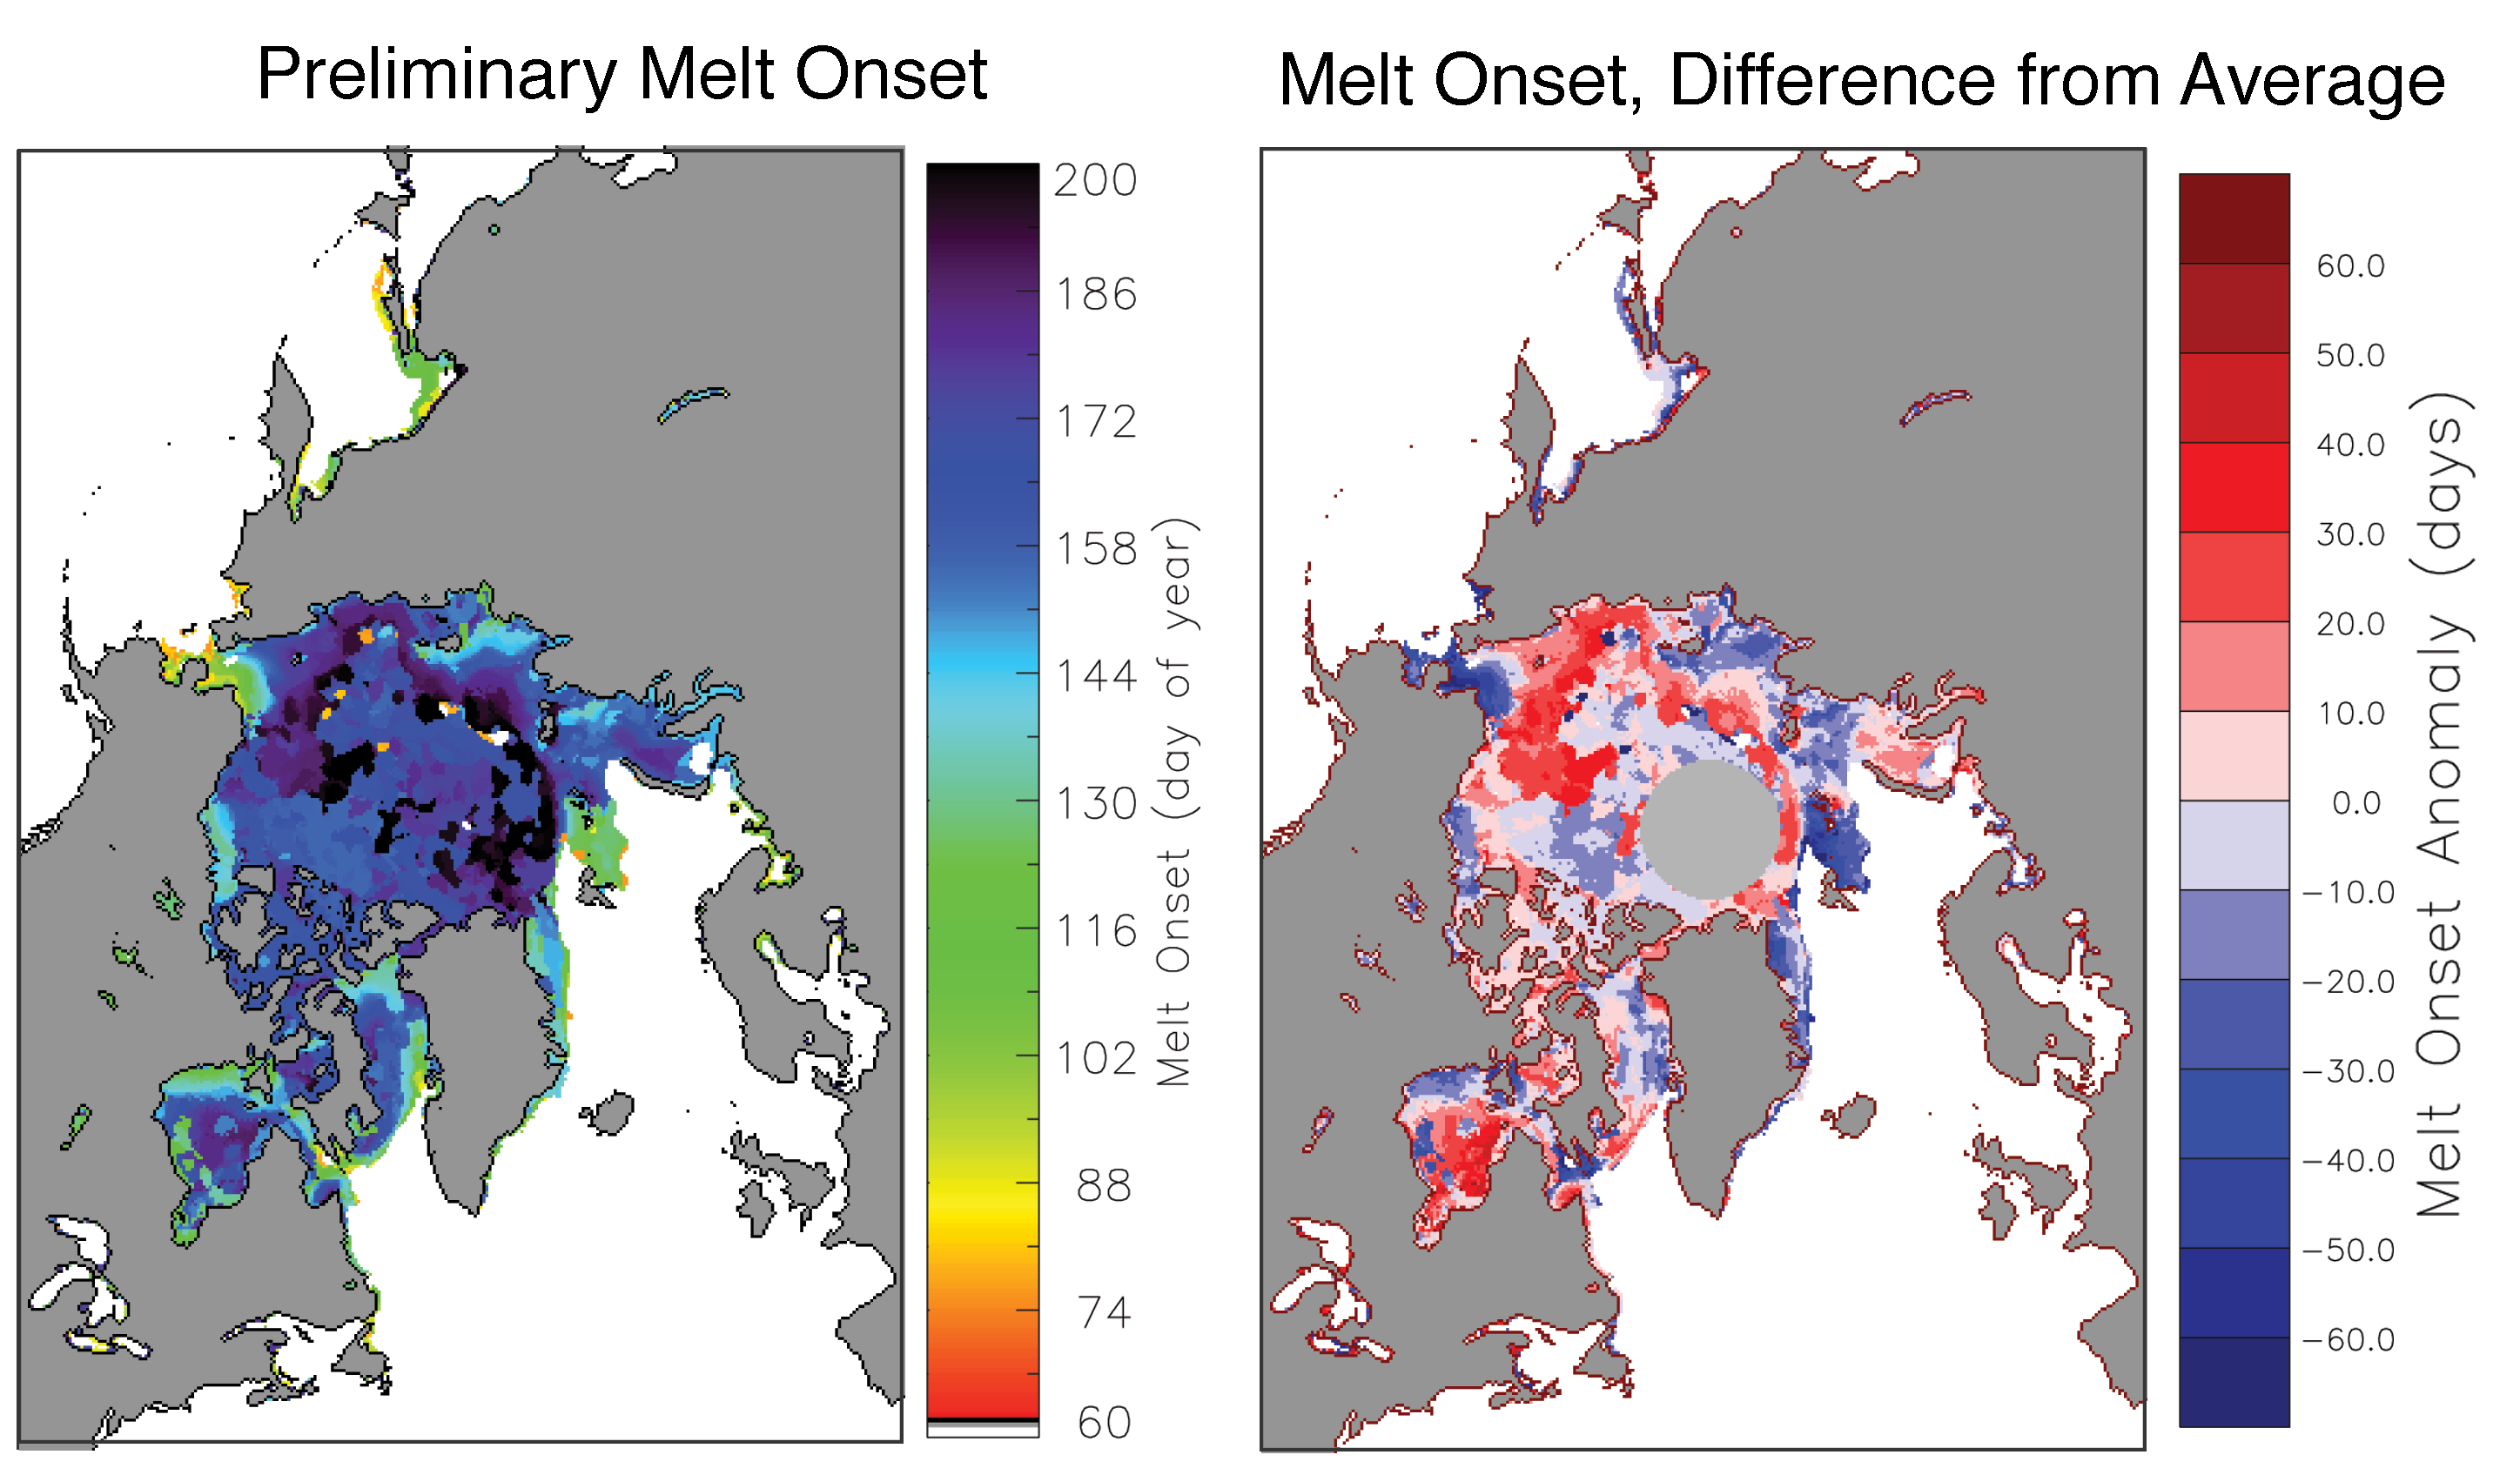
Figure 5. These maps show preliminary melt onset (left) and melt onset difference from average (right) in the Arctic relative to the 1981 to 2010 average. White areas are open ocean or areas with no melt detected.
Data courtesy Jeffrey Miller, NASA GSFC.
High-resolution image
This summer the ice retreated quite early in the Bering Sea in late April and early May, leading to record low extent in the region. This is partly because the melt started nearly two months earlier than average in certain parts of the Bering Sea, while the regional average melt onset date was 38 days earlier. Melt also began several weeks earlier than average in the Barents Sea, stretching up through the Kara Sea and the southern Laptev Sea. In contrast, melt was later than average in most of the Chukchi and East Siberian Seas as well as parts of the Beaufort Sea. While melt onset generally happens earlier in the southern parts of the Arctic and later as one moves further north, exceptions do occur. For example, already in March some melt onset was detected over the central Arctic Ocean, but it did not continuously melt since that date.
Reconstructing sea ice extent in the Kara and Barents Seas
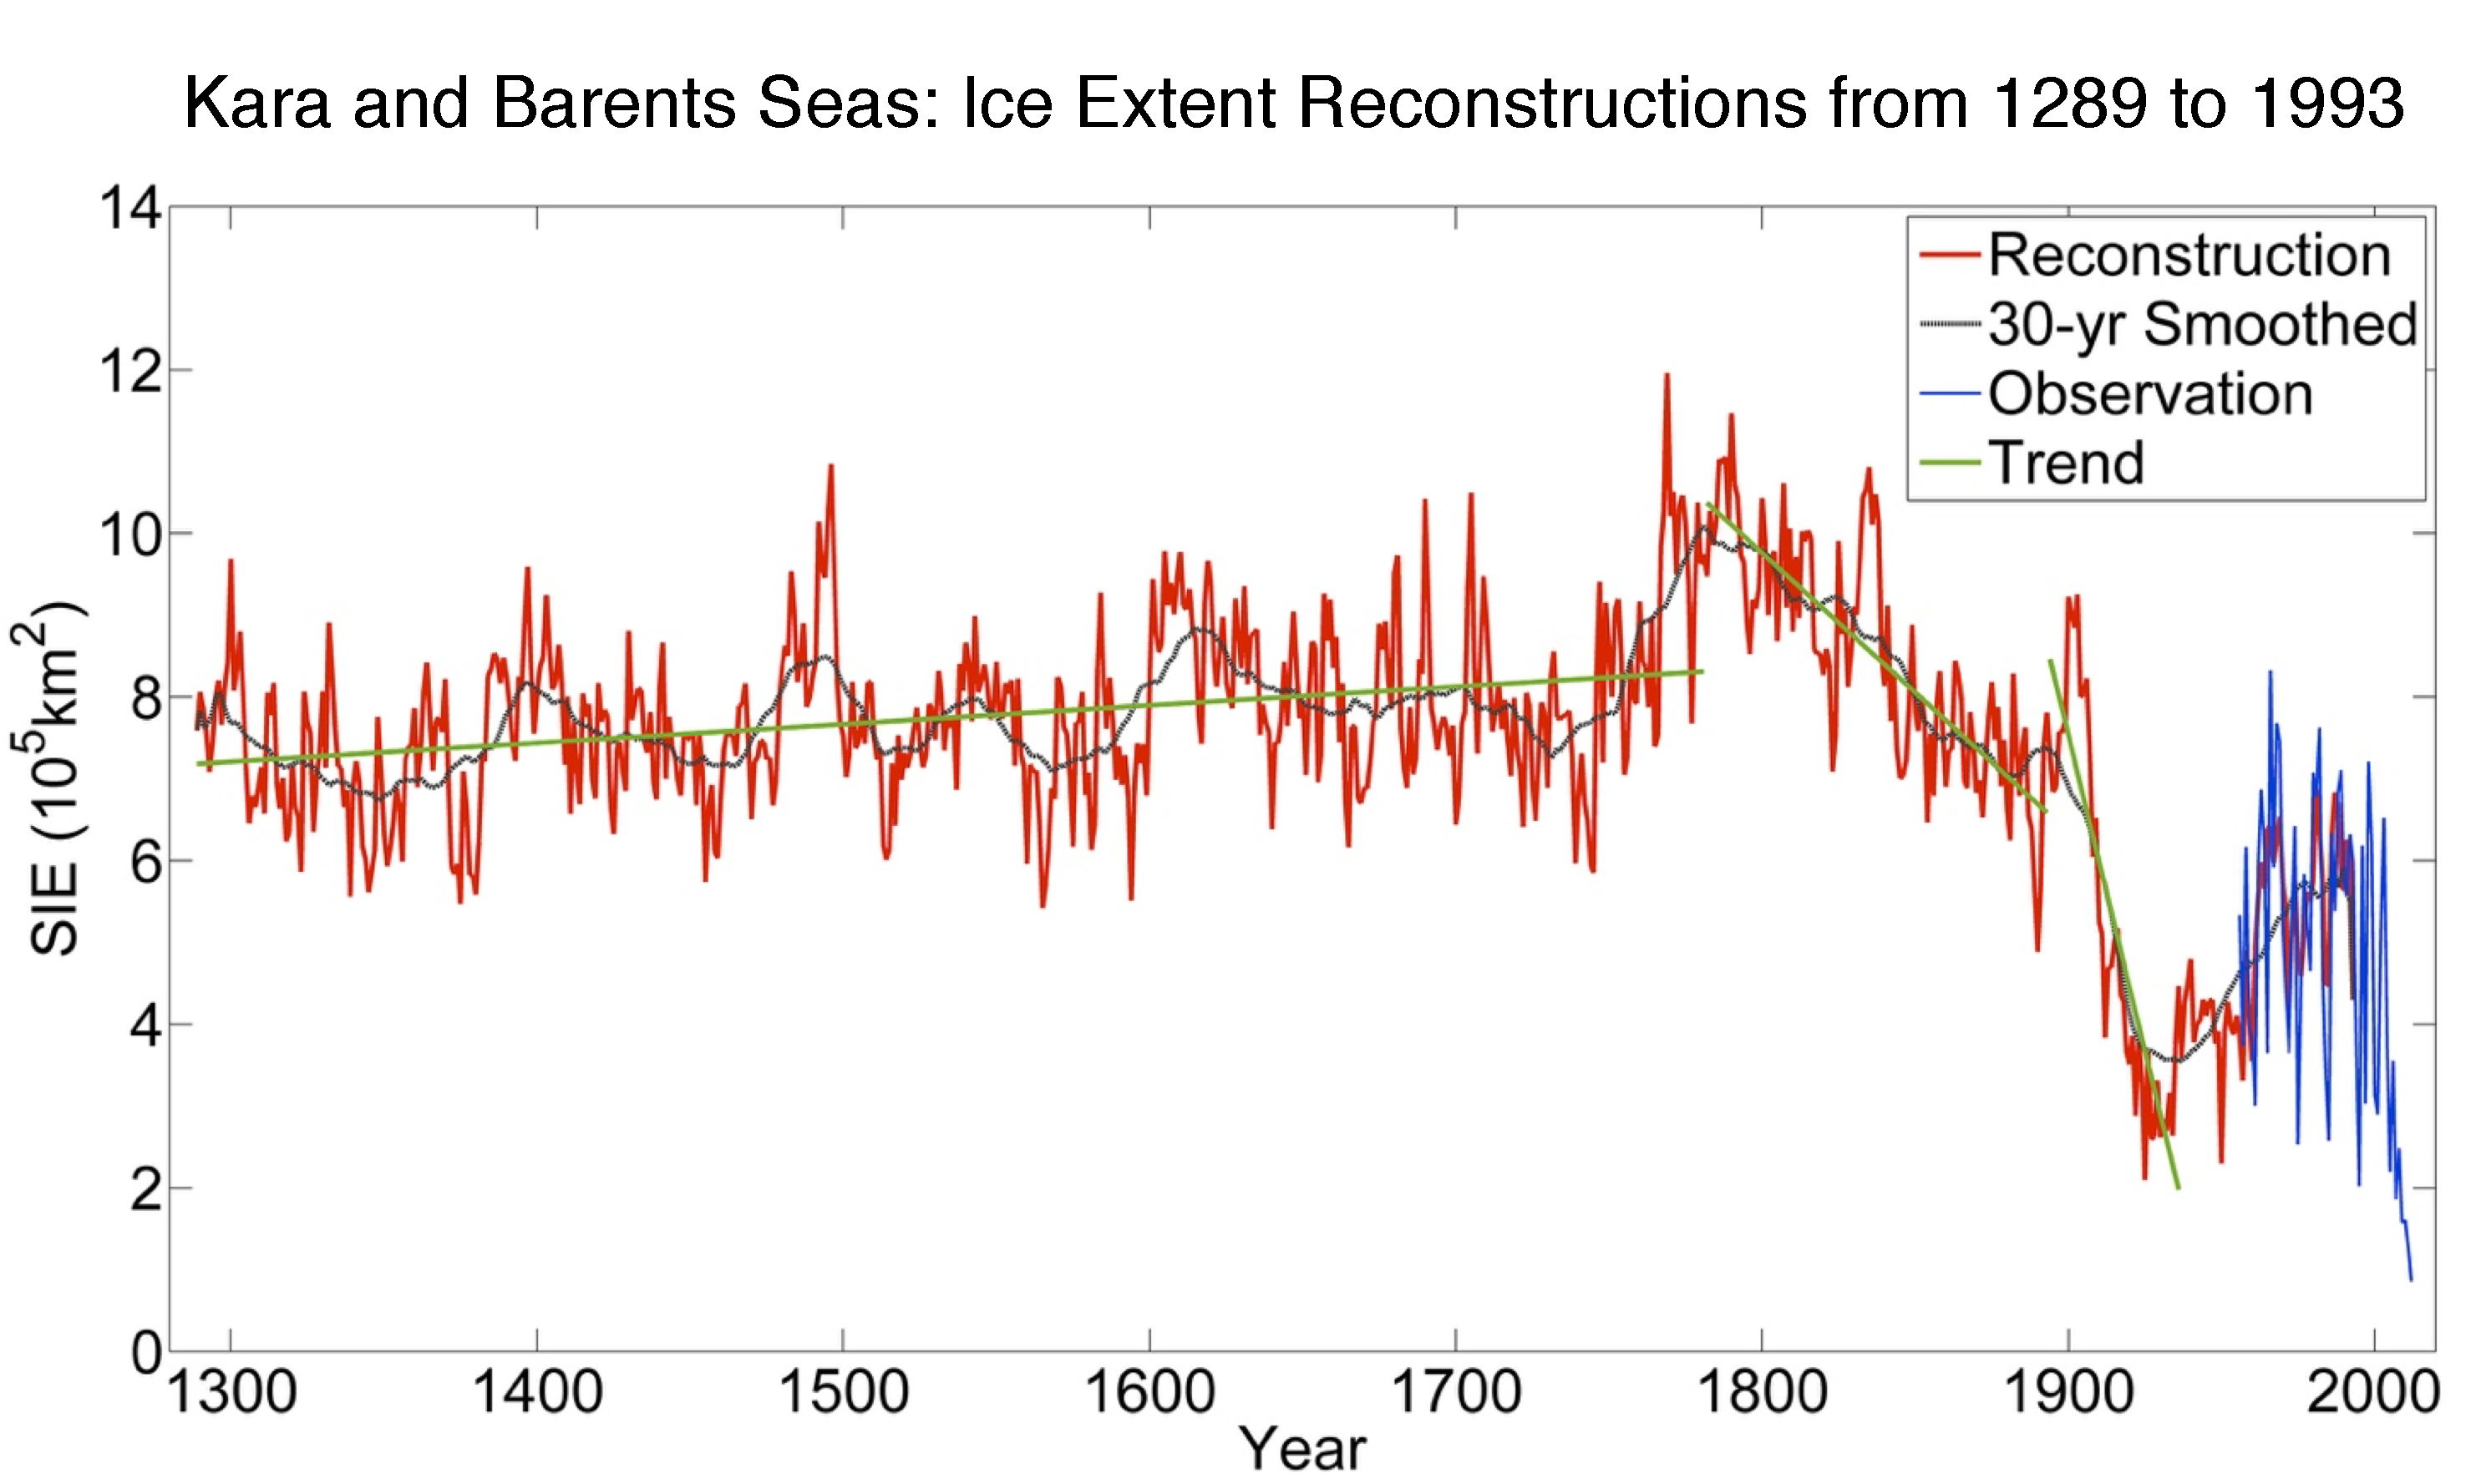
Figure 6. This graph shows reconstructions of sea ice extent in the Kara and Barents Seas from 1289 to 1993 (red line). The gray line shows the 30-year average, the blue line shows observed sea ice extent, and the green line shows the trend.
Credit: Qi Zhang (Institute of Polar Meteorology, Chinese Academy of Meteorological Sciences, Bejing, China) and Cunde Xiao (Stake Key Laboratory of Earth Surface and Resources Ecology, Beijing Normal University, Bejing, China)
High-resolution image
While we now have forty years of consistent sea ice observations from satellite, this data record is still relatively short, especially for trying to better understand drivers of current sea ice loss and issues such as potential impacts on mid-latitude weather. A new study from a team of Chinese researchers relied on climate proxies from ice cores and tree ring data from coastal forests to provide estimates of autumn sea ice within the Kara and Barents Seas back to 1289. This new data record suggests that between the 13th and 18th centuries, sea ice extent in the Kara and Barents Seas was more extensive than today and was increasing slightly. This period coincides with the Little Ice Age. After the end of the 18th century, sea ice in this region began to decline and the downward trend became significant during the second half of the 19th century until about the 1930s to 1940s. The sea ice then expanded until the 1970s, after which it has continually declined. Based on this reconstruction, current ice loss in the Kara and Barents Seas is viewed as unprecedented, both in duration and rate of change. While the study is only regional and does not indicate overall Arctic-wide sea ice changes, it provides useful context for the recent decline relative to the long-term variability.
Antarctic sea ice update
Sea ice in the Southern Hemisphere grew at a slightly faster-than-average pace from June through mid-July, but then slowed through the second half of July. At mid-July, ice extent was near average in all sectors except the region north of Dronning Maud Land. In the last two weeks of July, an area of below-average ice extent developed north of Wilkes Land in response to warm winds from the northeast, reducing the overall ice growth and bringing the Southern Hemisphere ice extent down relative to the 1981 to 2010 average (below the range of 90 percent of the past observational years). Above average temperatures at the 925 hPa level (about 2,500 feet above sea level) of 4 to 5 degrees Celsius (7 to 9 degrees Fahrenheit) occurred over the northern West Antarctic coast and the southern Peninsula, where the Peninsula high pressure ridge brought winds from the north. Temperatures 3 to 6 degrees Celsius (5 to 11 degrees Fahrenheit) above average also occurred along the Wilkes Land coast.
References
Divine, D. V. and C. Dick. 2007. March through August ice edge positions in the Nordic Seas, 1750-2002, Version 1. Boulder, Colorado USA. NSIDC: National Snow and Ice Data Center. doi: https://doi.org/10.7265/N59884X1.
Zhang, Q., C. Xiao, M. Ding, and T. Dou. 2018. Reconstruction of autumn sea ice extent changes since AD1289 in the Barents-Kara Sea, Arctic. Science China Earth Sciences, doi:10.1007.s11430-017-9196.4.

