The Arctic summer of 2014 is nearing an end. Overall, the rate of ice loss during August was near average. Regions of low concentration ice remain in the Beaufort and East Siberian seas that may yet melt out or compress by wind action. While the Northwest Passage continues to be clogged with ice and is unlikely to open, the Northern Sea Route along the Siberian coasts appears open except for some ice around Severnaya Zemlya. As the end of the southern winter draws closer, Antarctic sea ice extent remains higher than average.
Overview of conditions

Figure 1. Arctic sea ice extent for August 2014 was 6.22 million square kilometers (2.40 million square miles). The magenta line shows the 1981 to 2010 median extent for that month. The black cross indicates the geographic North Pole. Sea Ice Index data. About the data
Credit: National Snow and Ice Data Center
High-resolution image
Sea ice extent in August 2014 averaged 6.22 million square kilometers (2.40 million square miles). This is 1.00 million square kilometers (386,000 square miles) below the 1981 to 2010 August average, but well above the 2012 August average of 4.71 million square kilometers (1.82 million square miles). Extent was below average throughout the Arctic except for a region in the Barents Sea, east of Svalbard. The ice edge continued to retreat north of the Laptev Sea, and is now within 5 degrees latitude of the North Pole.
Conditions in context
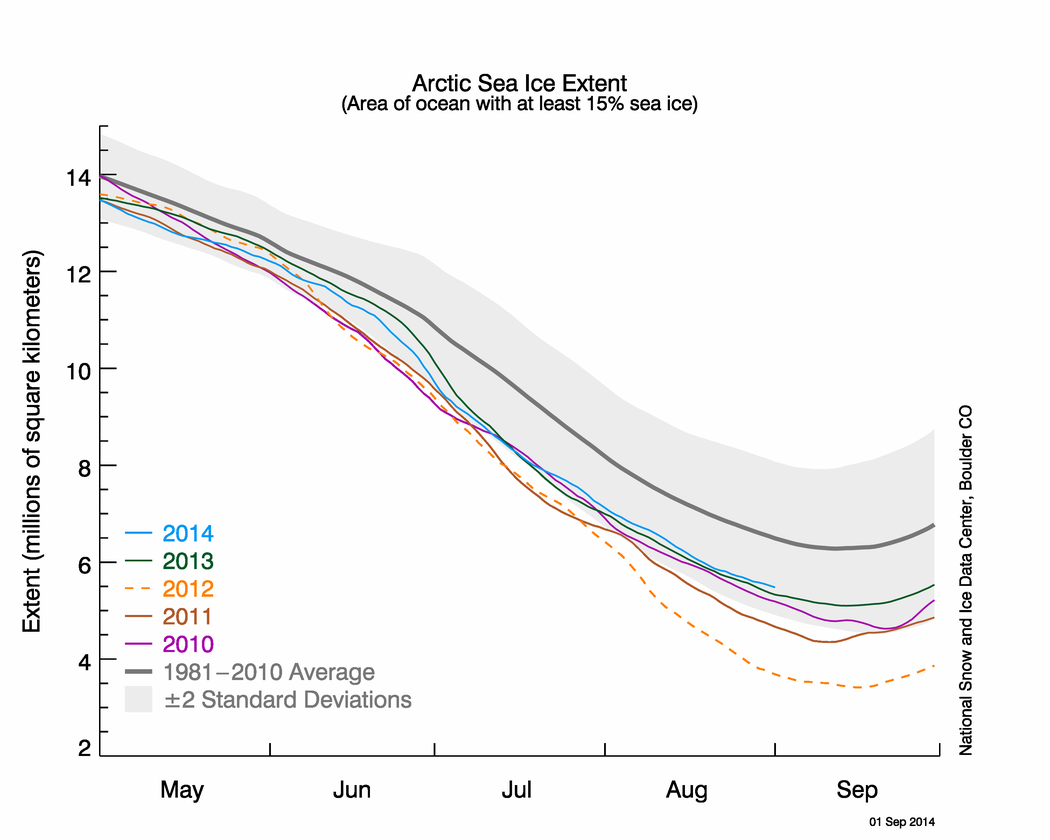
Figure 2. The graph above shows Arctic sea ice extent as of September 1, 2014, along with daily ice extent data for four previous years. 2014 is shown in blue, 2013 in green, 2012 in orange, 2011 in brown, and 2010 in purple. The 1981 to 2010 average is in dark gray. Sea Ice Index data.
Credit: National Snow and Ice Data Center
High-resolution image
August ice extent declined at an average rate of 54,300 square kilometers (21,000 square miles) per day. This was slightly less than the average rate for the month. Generally, the decline slows in August as the Arctic sun dips lower in the sky. Recent years have been an exception, with relatively fast ice loss rates in August.
August 2014 compared to previous years

Figure 3. Monthly August ice extent for 1979 to 2014 shows a decline of 10.3% per decade relative to the 1981 to 2010 average.
Credit: National Snow and Ice Data Center
High-resolution image
Despite the near-average rate of decline in ice extent through the month, August 2014 ended up with the 7th lowest extent in the satellite record. It is 1.51 million square kilometers (583,000 square miles) above the record low for August 2012 and is also higher than August of 2007, 2008, 2010, 2011, and 2013. The monthly linear rate of decline for August over the satellite record is now 10.3 percent per decade.
The Northwest Passage: closed for business

Figure 4. This time series shows the total sea ice area for selected years within the Western Parry Channel route of the Northwest Passage. The cyan line shows 2014, and other colors show ice conditions in different years.
Credit: S. Howell/Environment Canada
High-resolution image
Several recent years have seen remarkably open conditions in the Northwest Passage by the end of August. This year, however, much of the passage is clogged with ice, and even the circuitous Amundsen route is not entirely open. (Note that Amundsen required two summers to navigate this route in 1905; Amundsen wintered over in the hamlet of Gjoa Haven—now called Uqsuqtuuq).
The recent openings of the Northwest Passage in 2007, 2008, 2010, and 2011 were associated with high sea level pressure anomalies over the Beaufort Sea and Canadian Basin. This atmospheric pattern essentially displaces the polar pack away from the M’Clure Strait, resulting in minimal ice inflow from the Arctic Ocean. In contrast, weather patterns this year have been more moderate, and as a result, more ice remains in the Northwest Passage. As of the end of August 2014, ice area in the passage was tracking above the 1981 to 2010 average. Ice area over the summer of 2013 tracked slightly below the 1981 to 2010 average, but was considerably higher than the years prior. The summer of 2011 saw the lowest ice area in the Northwest Passage since 1968.
On the other side of the Arctic Ocean, conditions are much more open along the Northeast Passage (also known as the Northern Sea Route). There are wide areas of open water along much of the Russian Arctic coast, the lone exception being the area around Severnaya Zemlya.
Reference
Howell, S. E. L., T. Wohlleben, M. Dabboor, C. Derksen, A. Komarov, and L. Pizzolato. 2013. Recent changes in the exchange of sea ice between the Arctic Ocean and the Canadian Arctic Archipelago, J. Geophys. Res. Oceans, 118, 3595-3607, doi:10.1002/jgrc.20265.

