Arctic sea ice extent is well below average, and large areas of low concentration ice are observed in the Beaufort Sea and along the Siberian coast. However, it is highly unlikely to set a record low at the end of this year’s melt season. Antarctic sea ice extent remains at record highs.
Overview of conditions
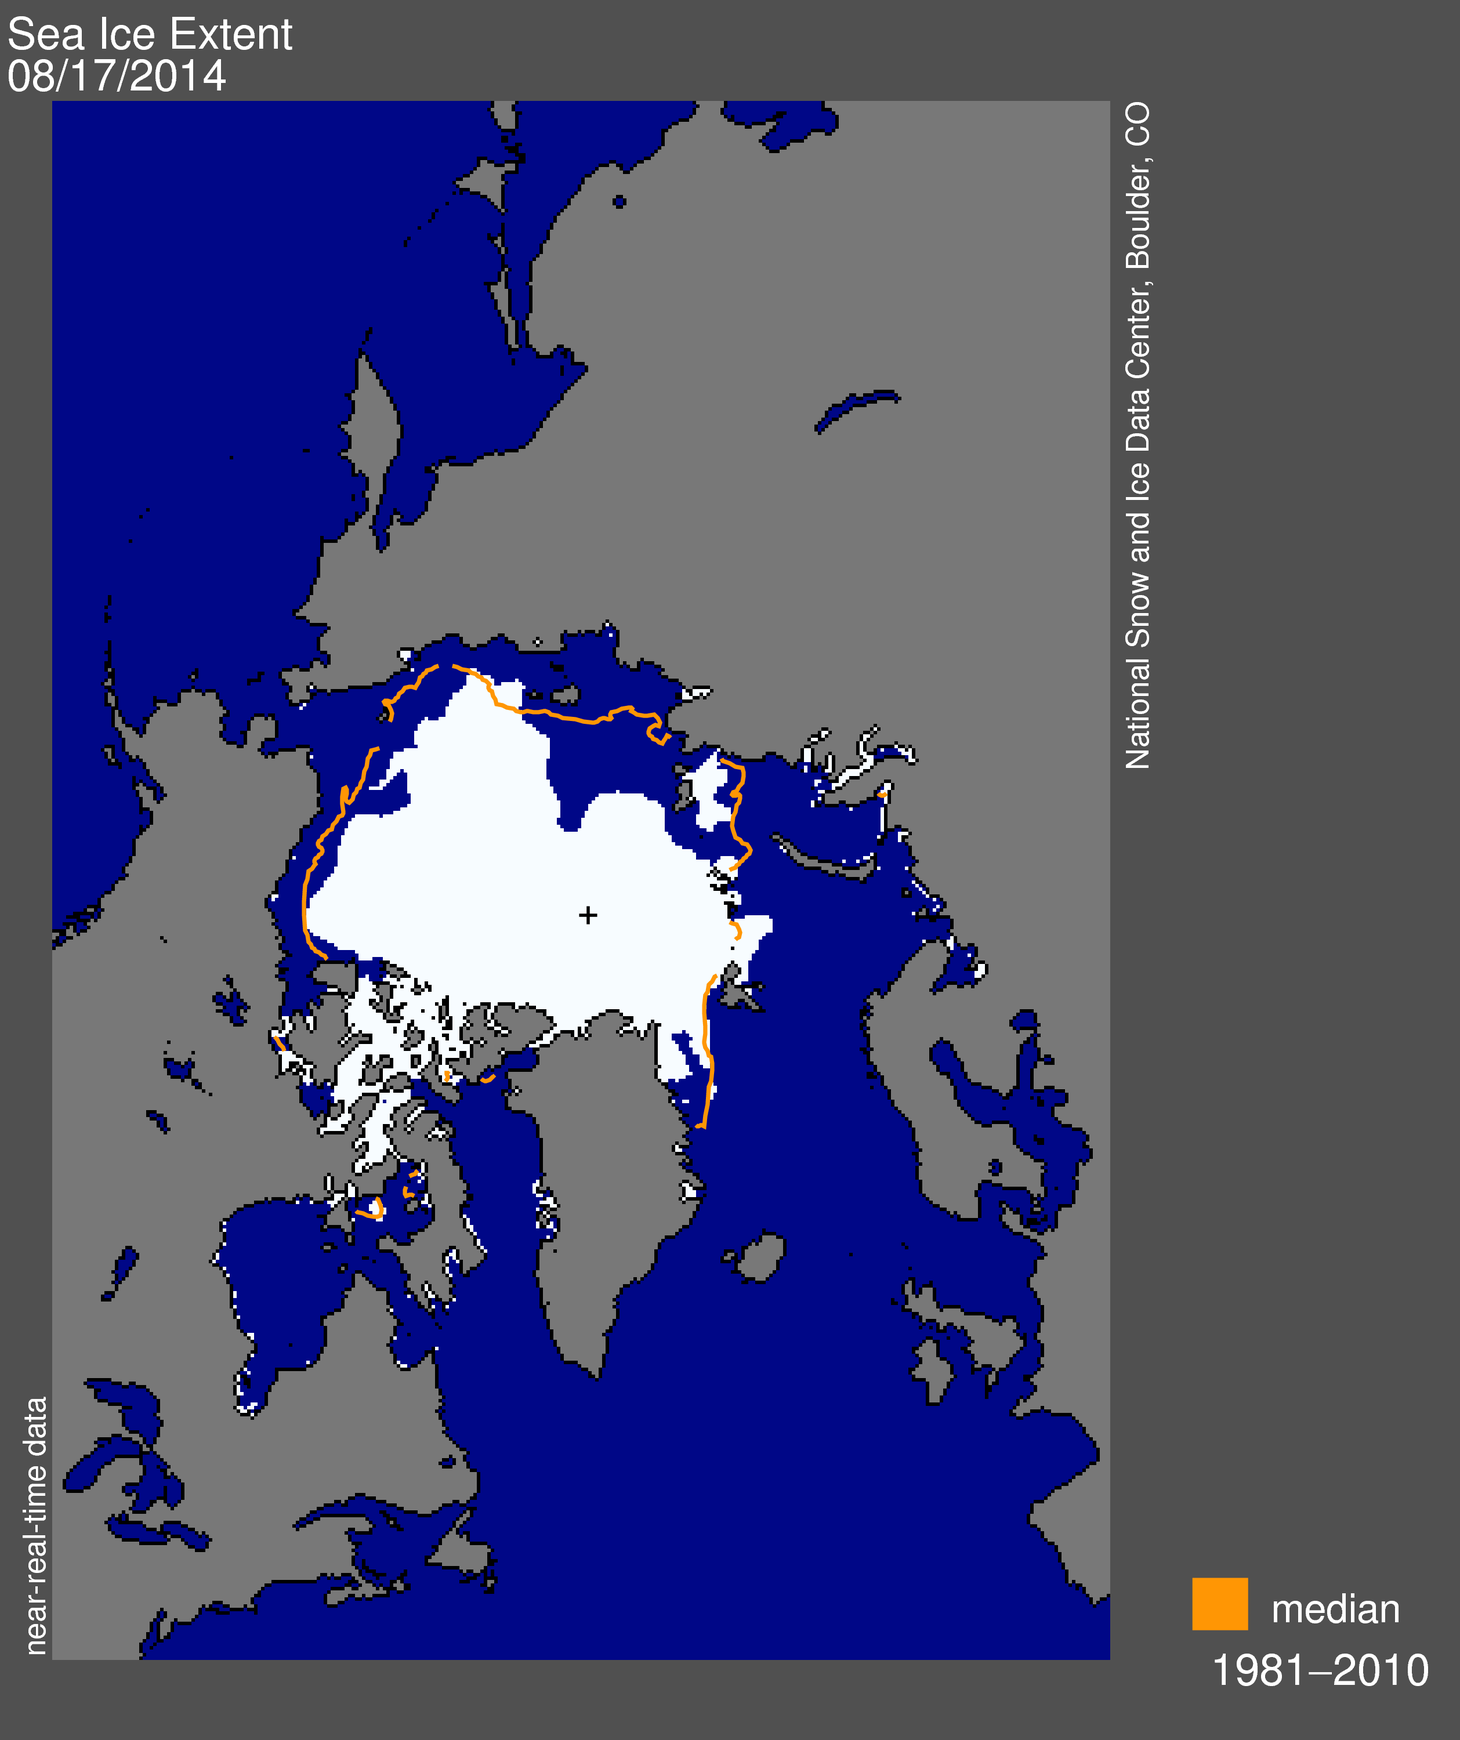
Figure 1. Arctic sea ice extent for August 17, 2014 was 6.11 million square kilometers (2.36 million square miles). The orange line shows the 1981 to 2010 median extent for that day. The black cross indicates the geographic North Pole. Sea Ice Index data. About the data
Credit: National Snow and Ice Data Center
High-resolution image
Sea ice declined at slightly slower than average rates through the first part of August. By mid-August, extent was similar to this time last year, which makes it unlikely that this year’s minimum extent will approach the record low level observed in September 2012. On August 17, sea ice extent was 1.03 million square kilometers (398,000 square miles) below the 1981 to 2010 long-term average and 1.42 million square kilometers (548,000 square miles) above that observed in 2012 on the same date. Ice extent remains below average everywhere, except near Franz Joseph Land and in the northern part of the Barents Sea. Extent is particularly low in the Laptev Sea where open water now extends to about 85 degrees latitude, less than 560 kilometers (350 miles) from the North Pole. This is the one region of the Arctic where ice loss has been exceptional in 2014 compared to recent summers. Ice extent is also very low in the East Greenland Sea, possibly as a result of reduced ice transport through Fram Strait.
Conditions in context

Figure 2. The graph above shows Arctic sea ice extent as of August 17, 2014, along with daily ice extent data for the record year. 2014 is shown in blue and 2012 in green. The 1981 to 2010 average is in dark gray. Sea Ice Index data.
Credit: National Snow and Ice Data Center
High-resolution image
The first part of August was dominated by anomalously low sea level pressure over the Kara Sea, combined with anomalously high pressure over the central Arctic Ocean and Greenland, as well as the Beaufort and Chukchi seas. This led to warm air advection from the south over the East Siberian and Chukchi seas and extending into the central Arctic Ocean, with air temperatures at the 925 millibar height being nearly 8 degrees Celsius (14 degrees Fahrenheit) higher than average off the coast of Siberia near the New Siberian Islands. Sea ice concentrations in this region dropped compared to the beginning of August, and the waters along the coast of eastern Siberia are now mostly ice free. Ice concentrations are also low in the Beaufort Sea. Ice has continued to break up in the Kara Sea where it has been slow to melt out this summer. Nevertheless, air temperatures in the Kara Sea remain lower than average by 2 to 4 degrees Celsius (4 to 7 degrees Fahrenheit). As of mid-August, sea ice extent remains on track to end up somewhere between the sixth and the tenth lowest sea ice minimum.
Low ice concentration as seen from MODIS
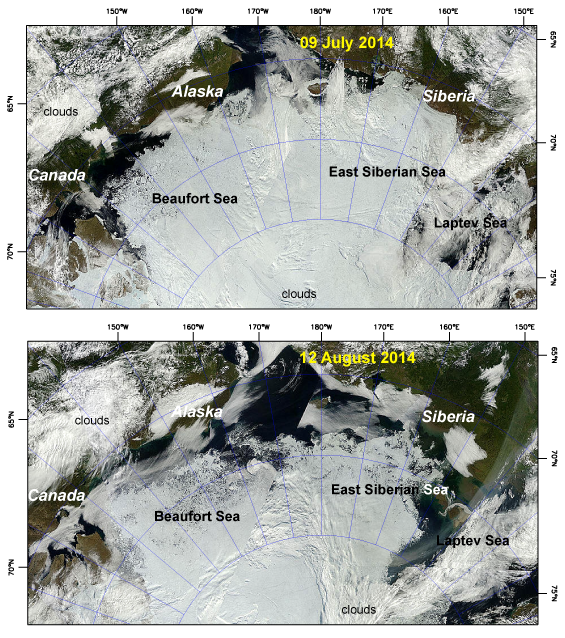
Figure 3. This image shows true-color composites of the Arctic for July 9, 2014 and August 12, 2014 from the NASA Moderate Resolution Imaging Spectroradiometer (MODIS).
Credit: Land Atmosphere Near-Real Time Capability for EOS (LANCE) System, NASA/GSFC
High-resolution image
Visible satellite imagery from NASA’s Moderate Resolution Imaging Spectroradiometer (MODIS) reveal a diffuse ice cover in the Beaufort Sea, as well as in areas of the Laptev and East Siberian seas. Despite low ice concentrations, ice extent is right at the long-term average for the region, in stark contrast to 2012 when the ice edge had already retreated to north of 75 degrees latitude. Ice remains extensive in the Northwest Passage through the channels of the Canadian Arctic Archipelago. On the Eurasian side, the Northern Sea Route is mostly open except that some ice still blocks Vilkitsky Strait, the narrow strait between the Siberian coast and the islands of Severnya Zemlya separating the Kara and Laptev seas.
No new record low in 2014
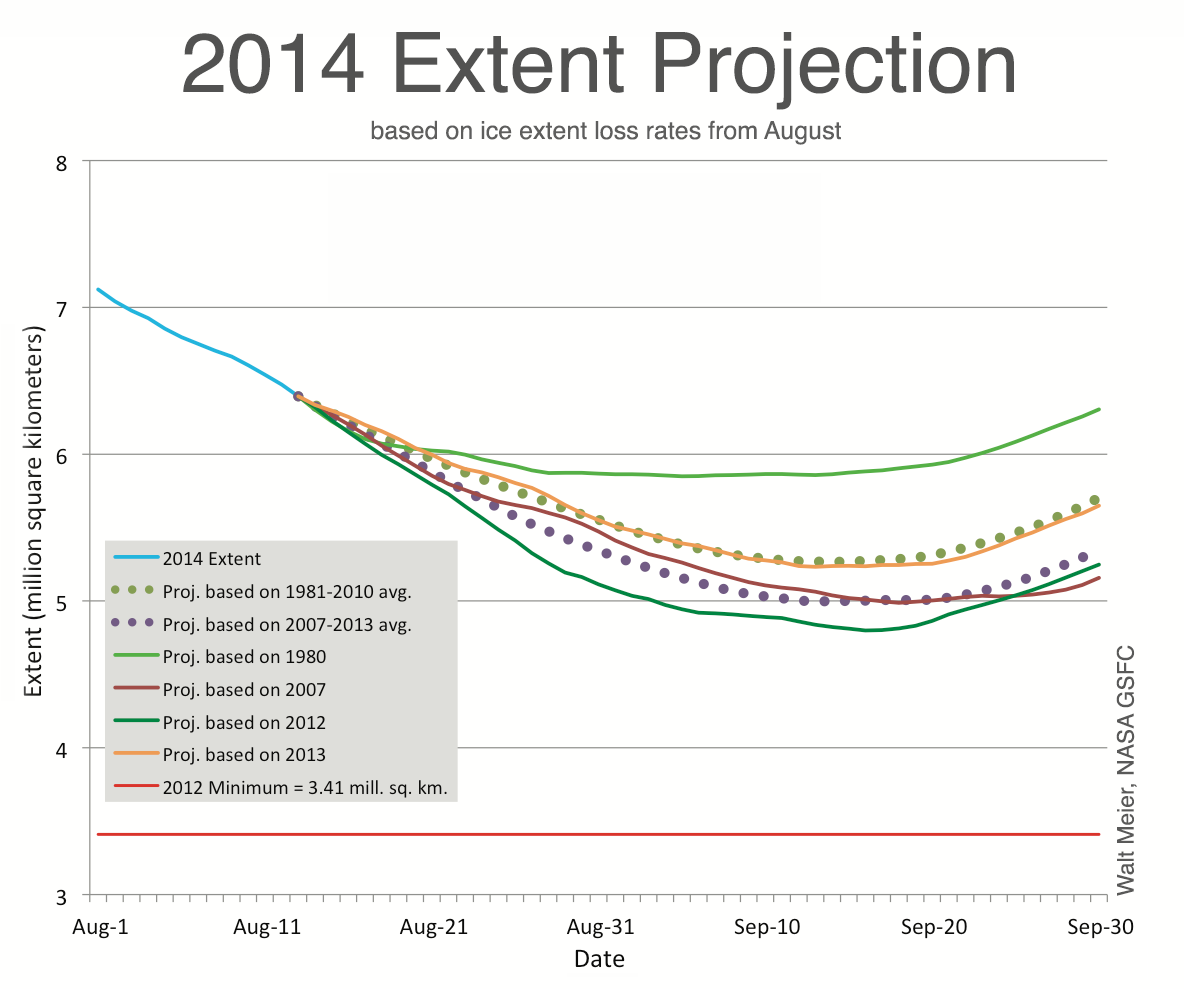
Figure 4. The graph above shows projections of ice extent from August 1 through September 30 based on previous years’ observed retreat rates appended to the August 12, 2014 ice extent. Sea Ice Index data. About the data
Credit: Walt Meier, NASA GSCF
High-resolution image
During August, sea ice extent declines more slowly as the sun starts to set in the Arctic and the sea ice minimum approaches. Thus, the window is closing on potential ice loss through the remaining summer. A simple way to estimate how much ice loss may occur during the rest of the summer is to extrapolate daily ice loss, using rates of ice loss from previous years. The approach provides a reasonable bracket on possible scenarios through September. Using the 1980 rate of ice loss yields the highest potential minimum this year, because the end of summer rate of ice loss in 1980 was very slow. The lowest potential minimum is estimated using the 2012 rate of ice loss, as there was rapid ice loss in 2012. No scenario suggests a minimum near the record low year of 2012. Most likely this year’s minimum will be between 5.0 and 5.5 million square kilometers (1.9 and 2.1 million square miles).
Antarctic sea ice trend
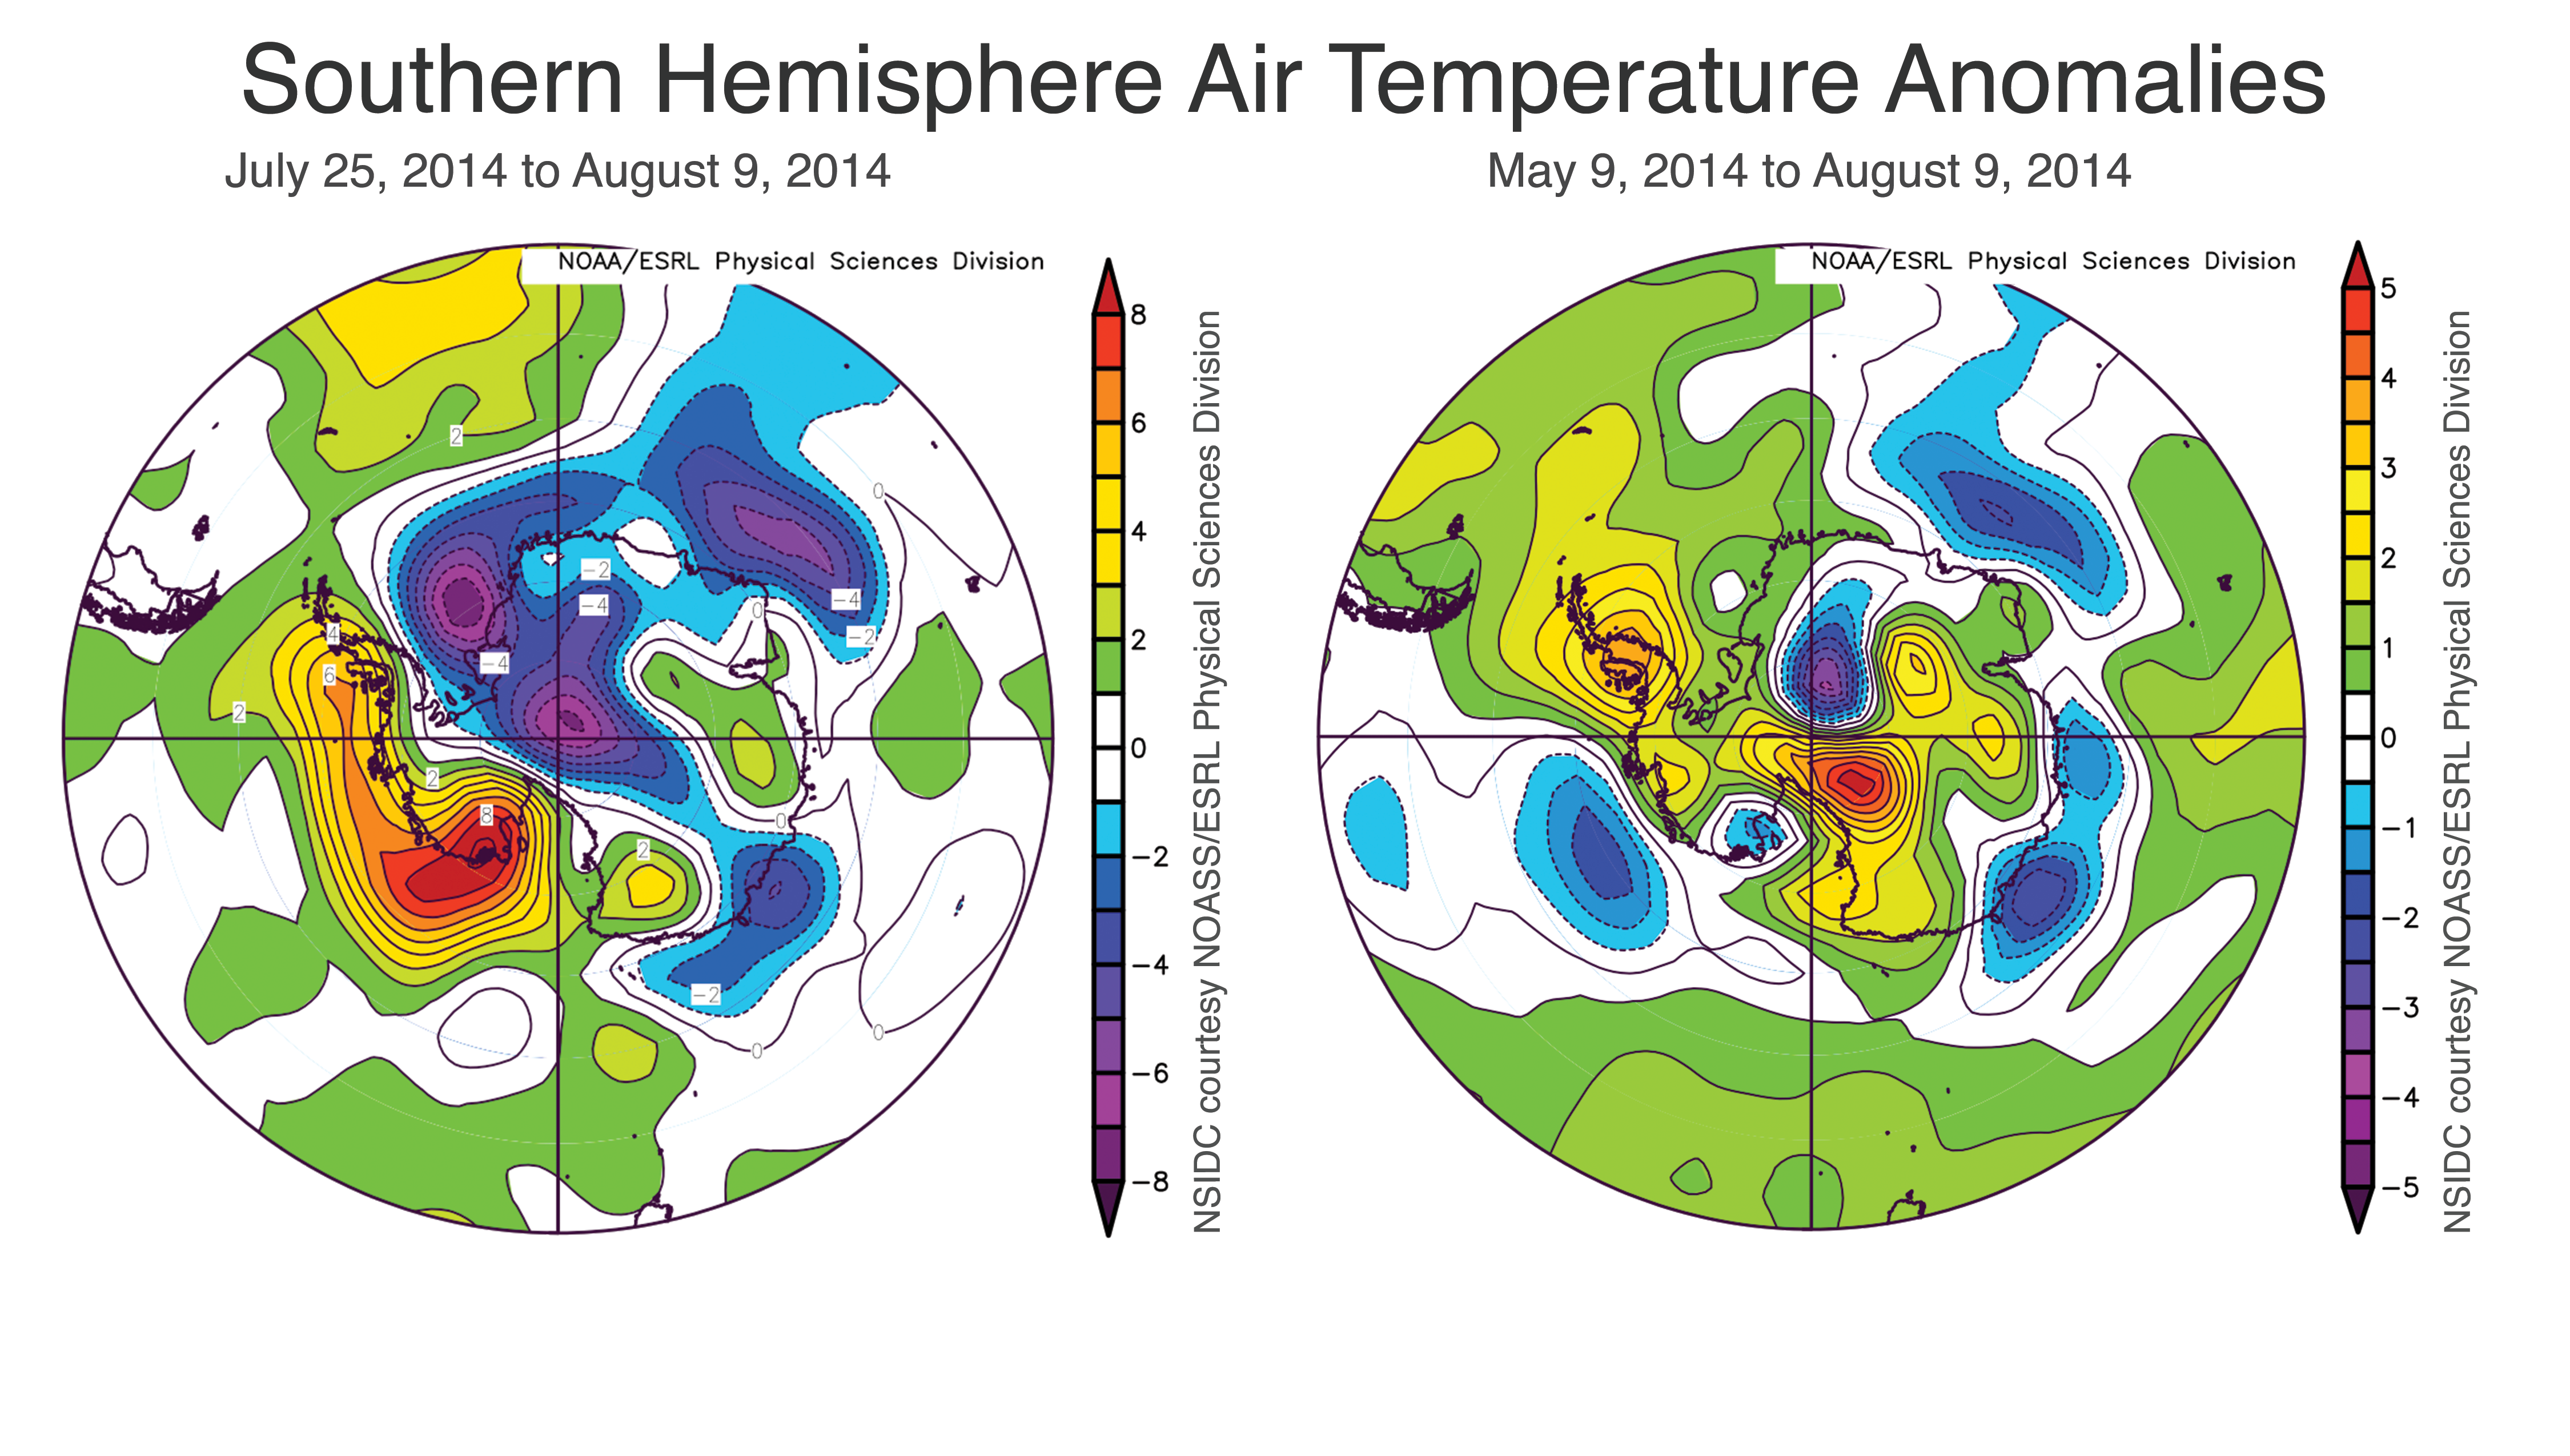
Figure 5. These images show air temperatures in the Southern Hemisphere at 925 mb (about 2500 feet above sea level) for July 25 to August 9, 2014 (left) and May 9 to August 9, 2014 (right) compared to the long-term average.
Credit: NSIDC courtesy NOAA Earth System Research Laboratory Physical Sciences Division
High-resolution image
Antarctic sea ice remains at a daily record high, and 1.19 million square kilometers (459,000 square miles) above the 1981 to 2010 average. Sea ice extent is now higher than average nearly everywhere around the continent, except for a portion of the northwestern Weddell Sea. This has occurred despite the fact that air temperatures at the 925 hPa level in the Ross and western Amundsen Sea have been much higher than average, by up to 8 degrees Celsius (14 degrees Fahrenheit), for the past two weeks. Longer term, the preceding three months (mid-May to mid-August) have been slightly warmer than average over most of the Antarctic sea ice areas. This supports the idea that the record or near record high Antarctic ice extents of 2014 have been driven by wind patterns and ocean conditions as discussed in our July post.

