The Arctic sea ice cover appears to have reached its minimum extent for the year, the second-lowest extent recorded since the dawn of the satellite era. While above the record minimum set on September 16, 2007, this year further reinforces the strong negative trend in summertime ice extent observed over the past thirty years. With the minimum behind us, we will continue to analyze ice conditions as we head into the crucial period of the ice growth season during the months to come.

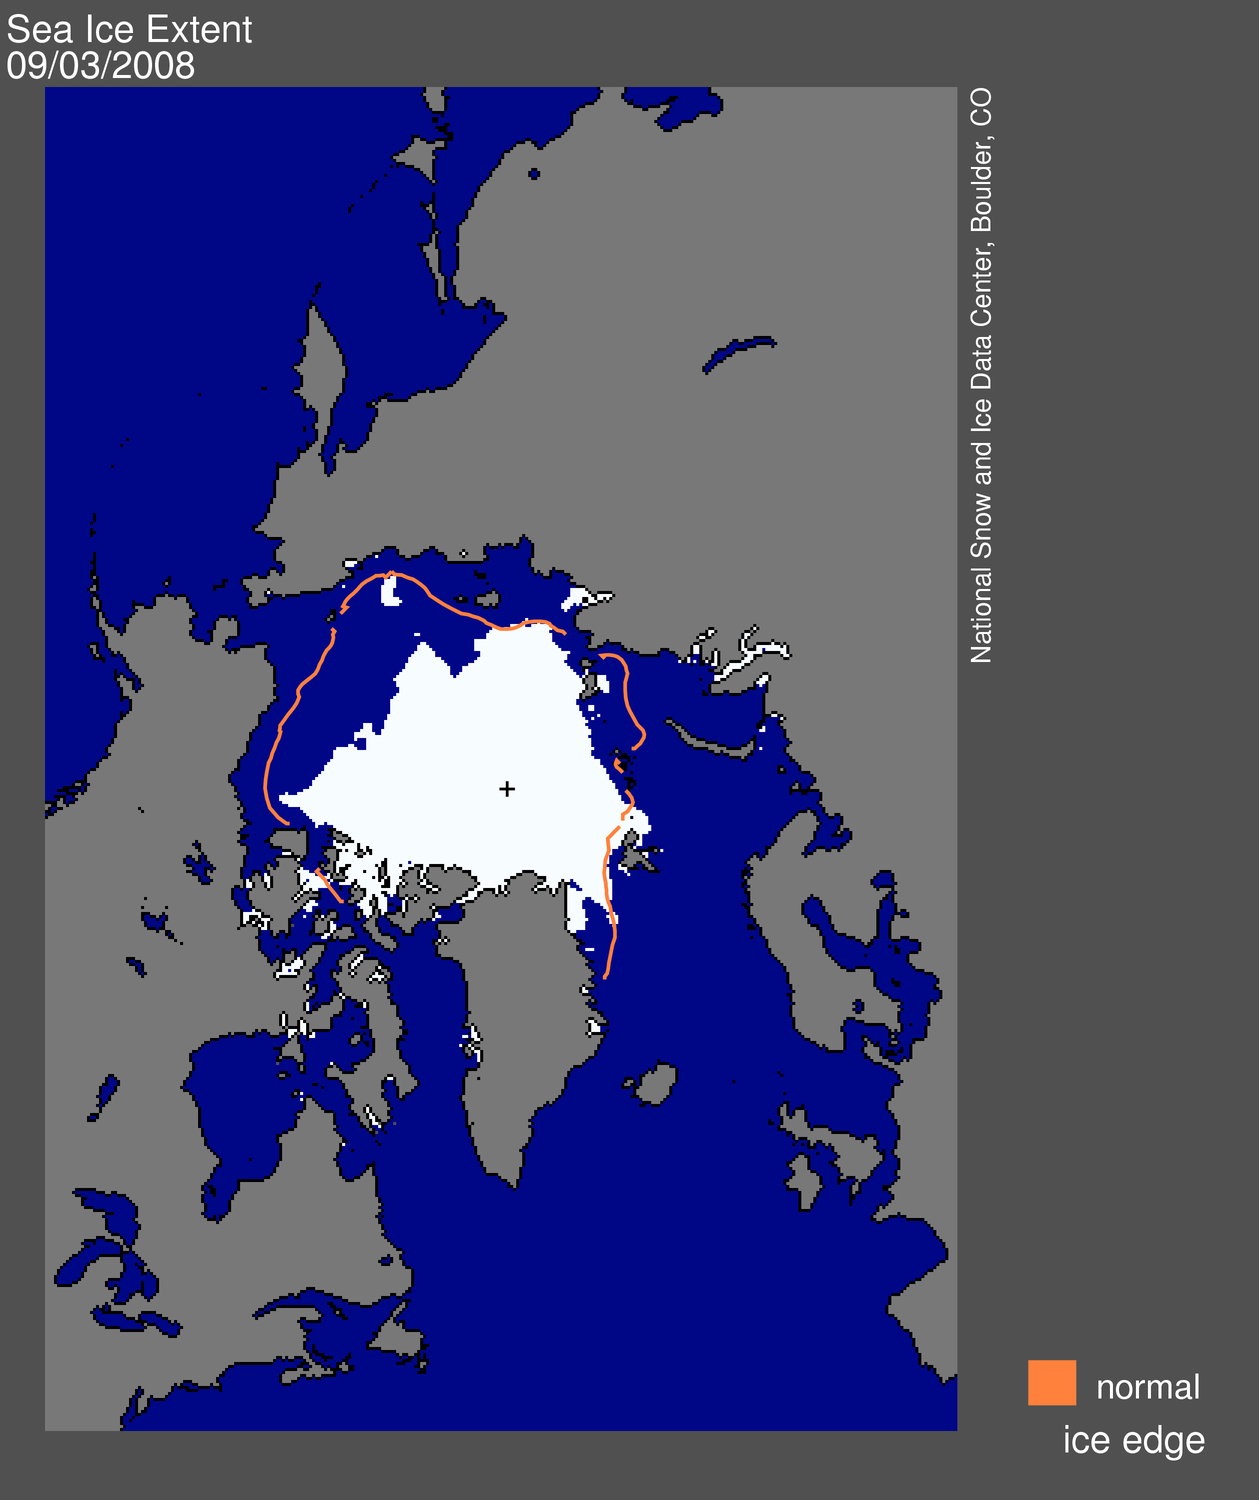
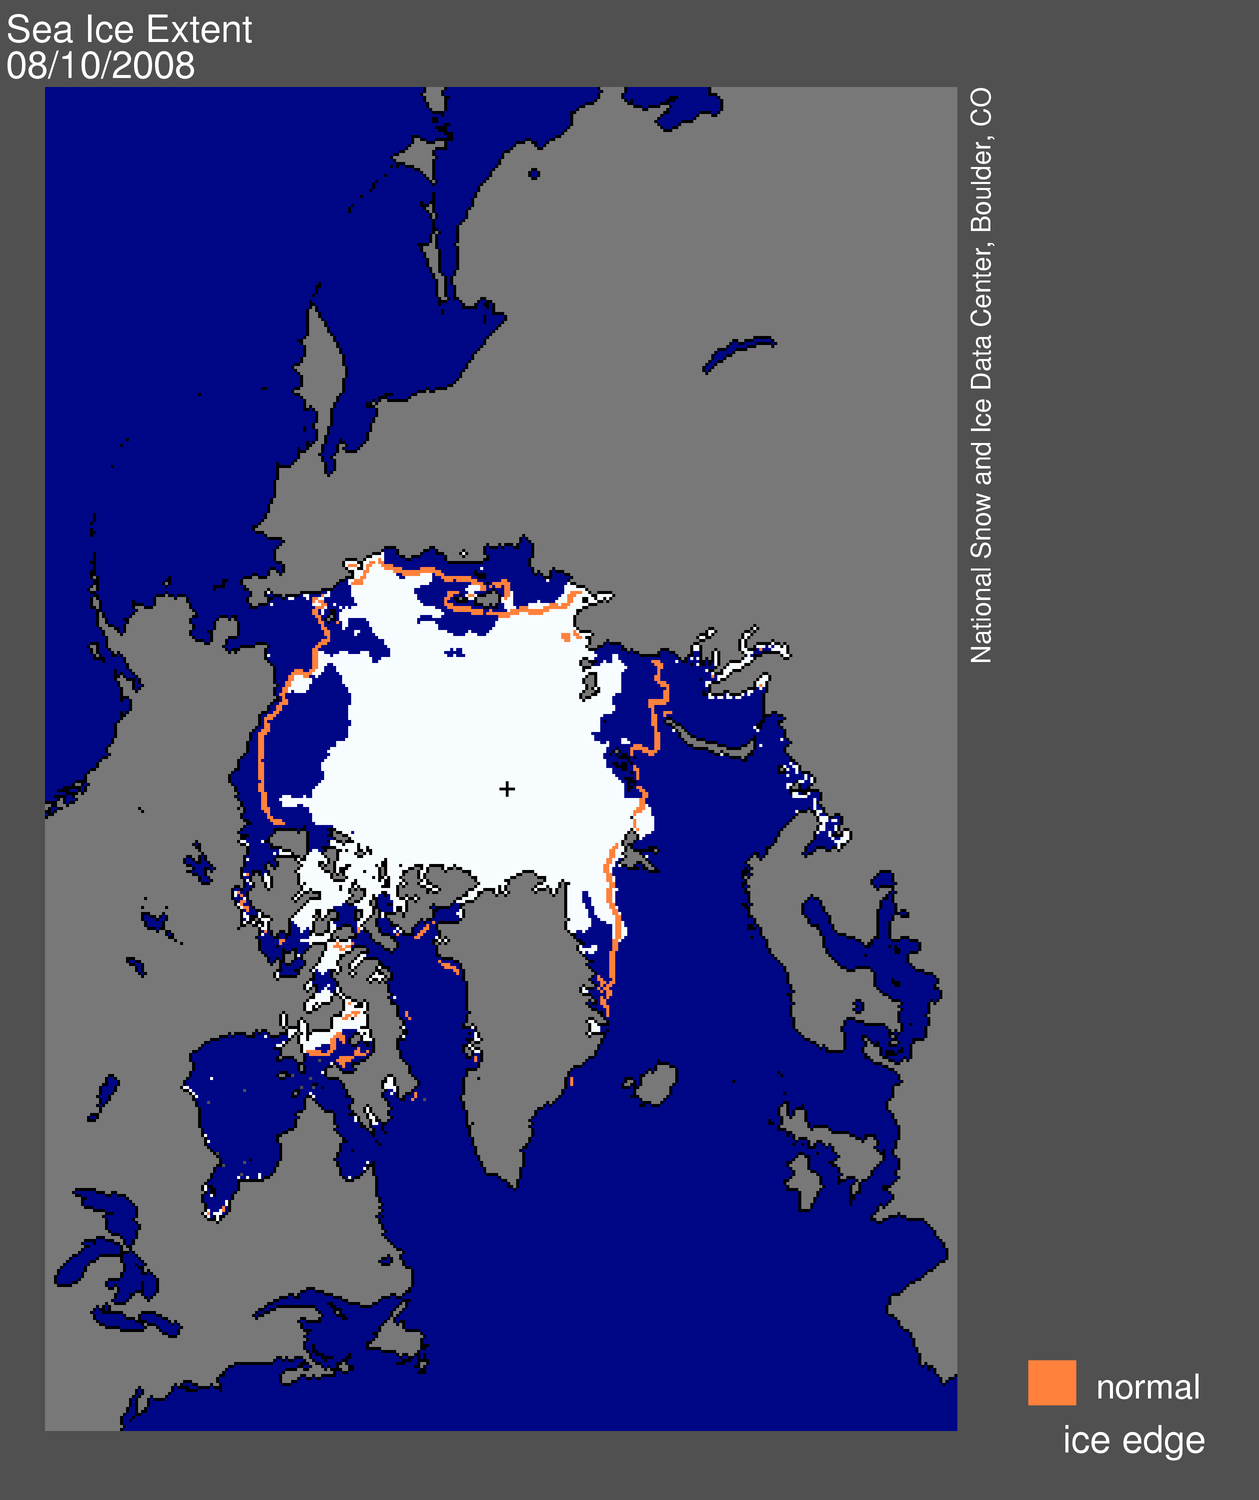
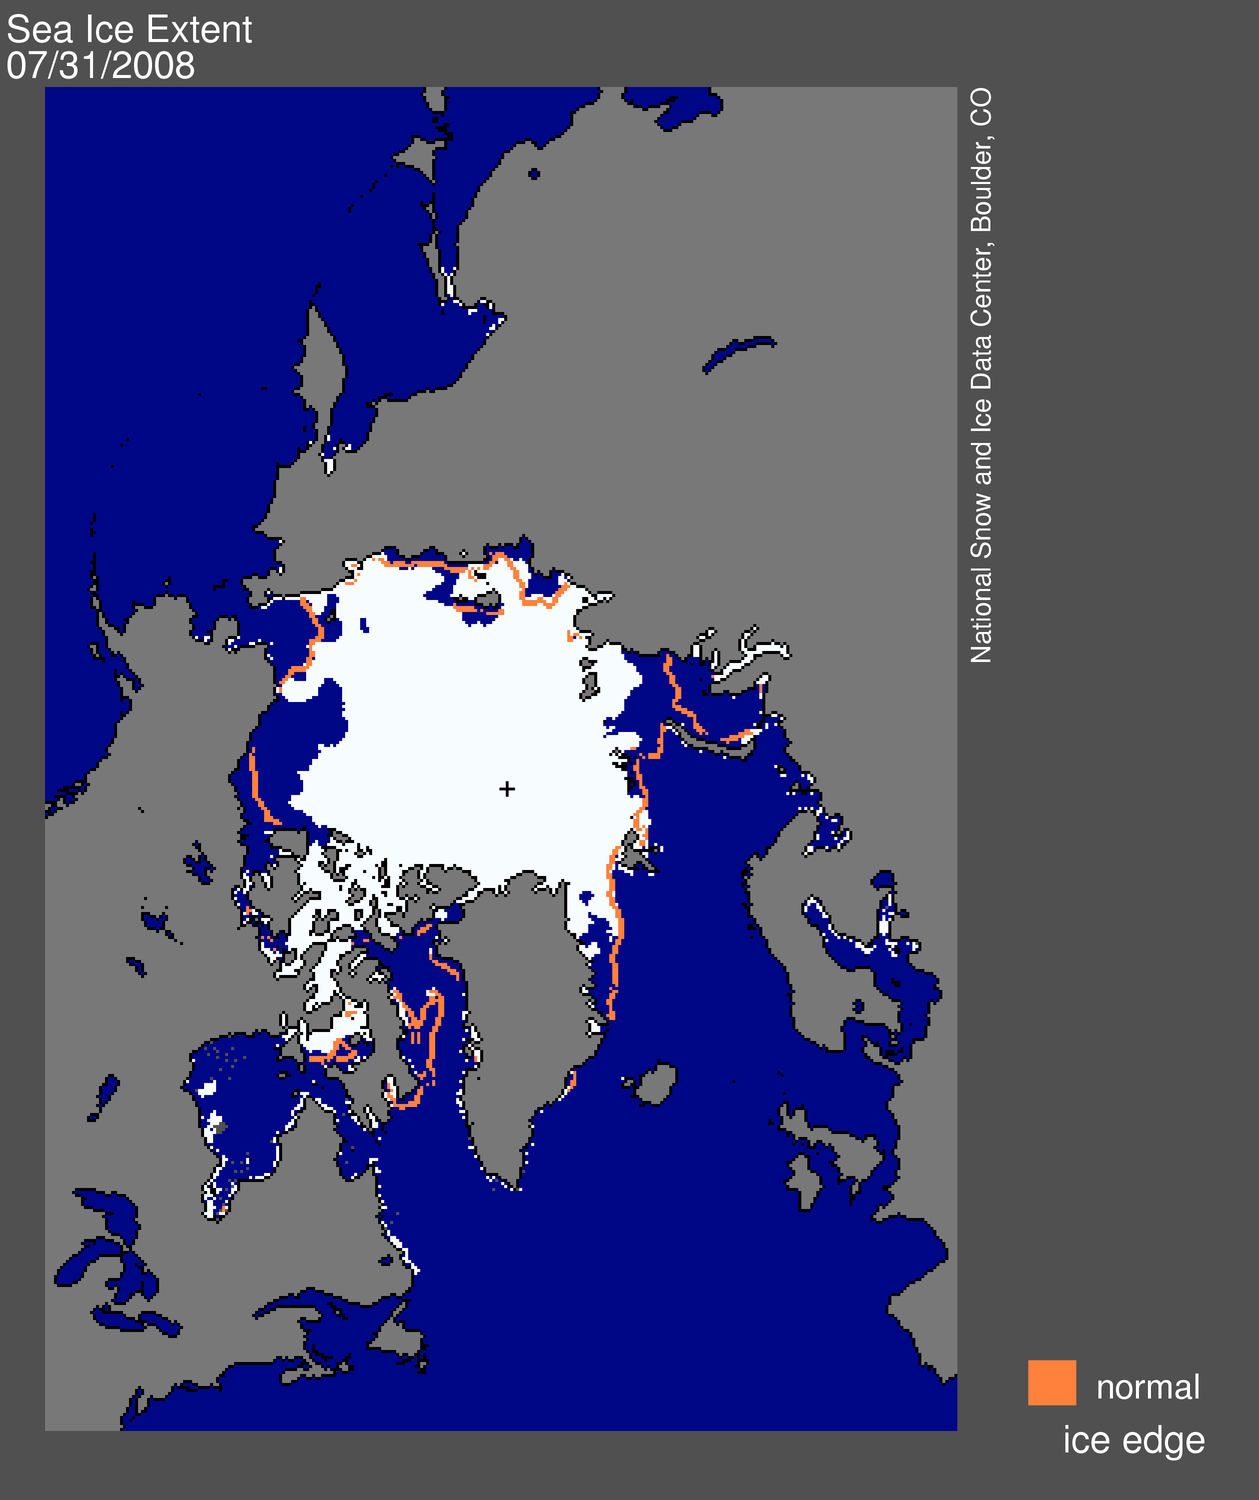
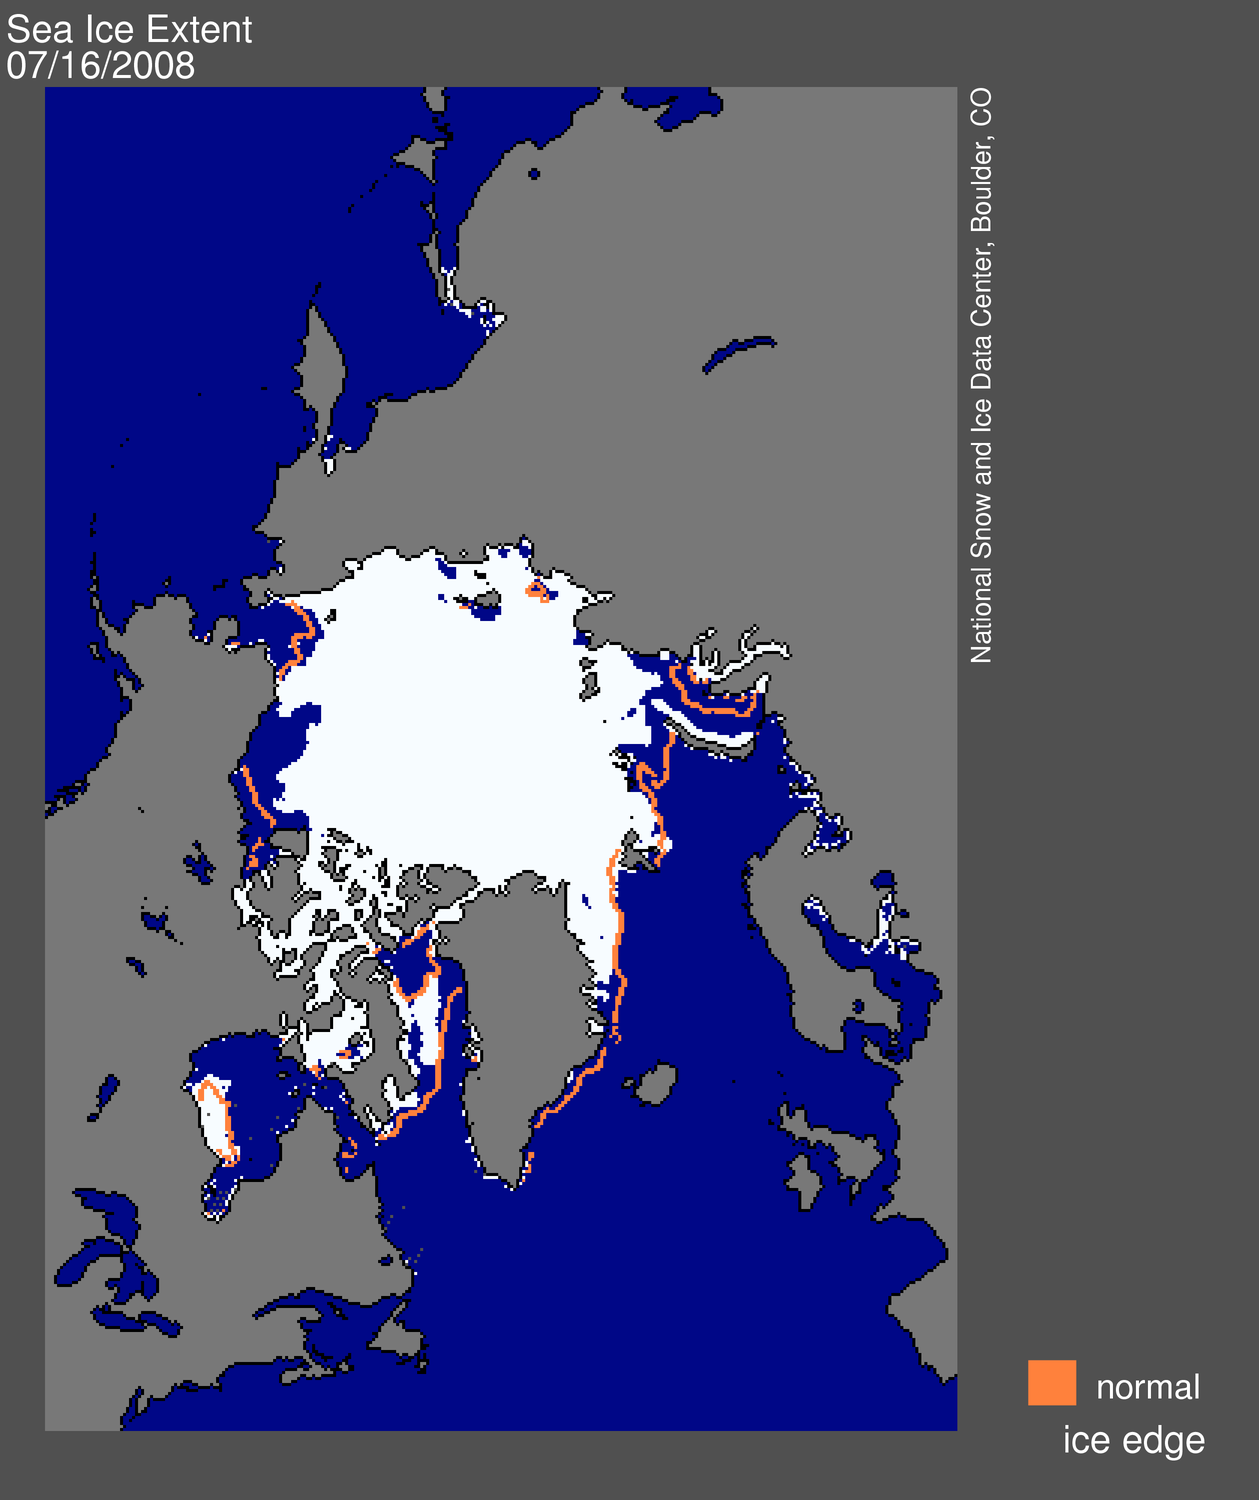
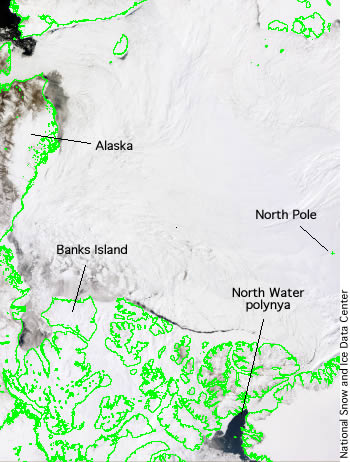
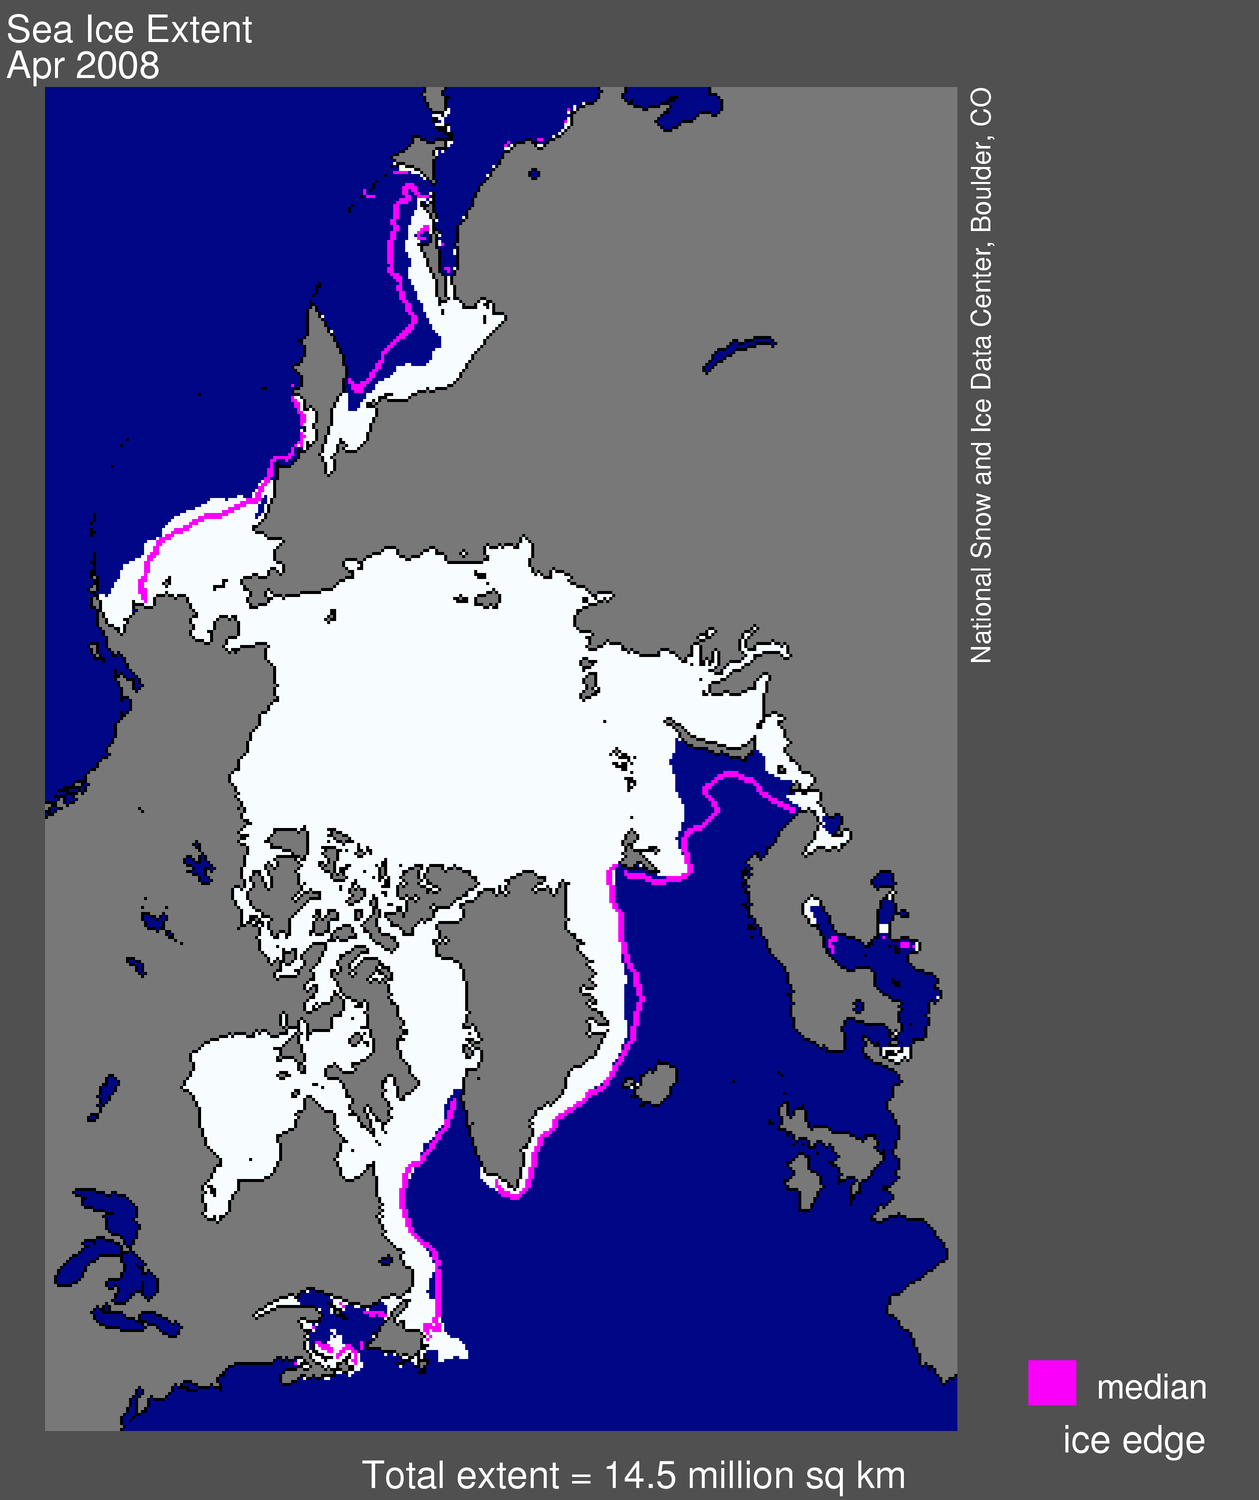
Figure 1. Daily Arctic sea ice extent for September 12, 2008, was 4.52 million square kilometers (1.74 million square miles). The orange line shows the 1979 to 2000 average extent for that day. The black cross indicates the geographic North Pole. Sea Ice Index data. About the data.
—Credit: National Snow and Ice Data Center
High-resolution image
Overview of conditions
On September 12, 2008 sea ice extent dropped to 4.52 million square kilometers (1.74 million square miles). This appears to have been the lowest point of the year, as sea has now begun its annual cycle of growth in response to autumn cooling.
The 2008 minimum is the second-lowest recorded since 1979, and is 2.24 million square kilometers (0.86 million square miles) below the 1979 to 2000 average minimum.
Update 8:00 am MT October 2:
Final analysis indicates that the 2008 Arctic sea ice minimum occurred on September 14, 2008. For more information see the NSIDC press release: Arctic Sea Ice Down to Second-Lowest Extent; Likely Record-Low Volume.
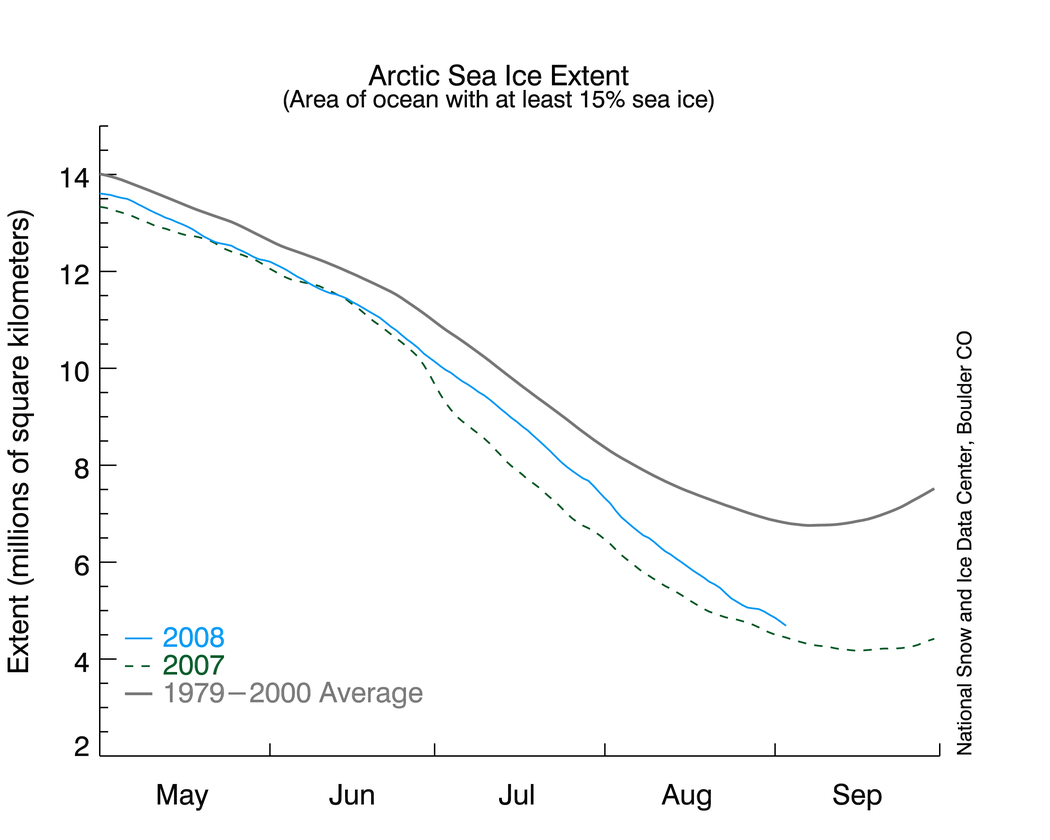
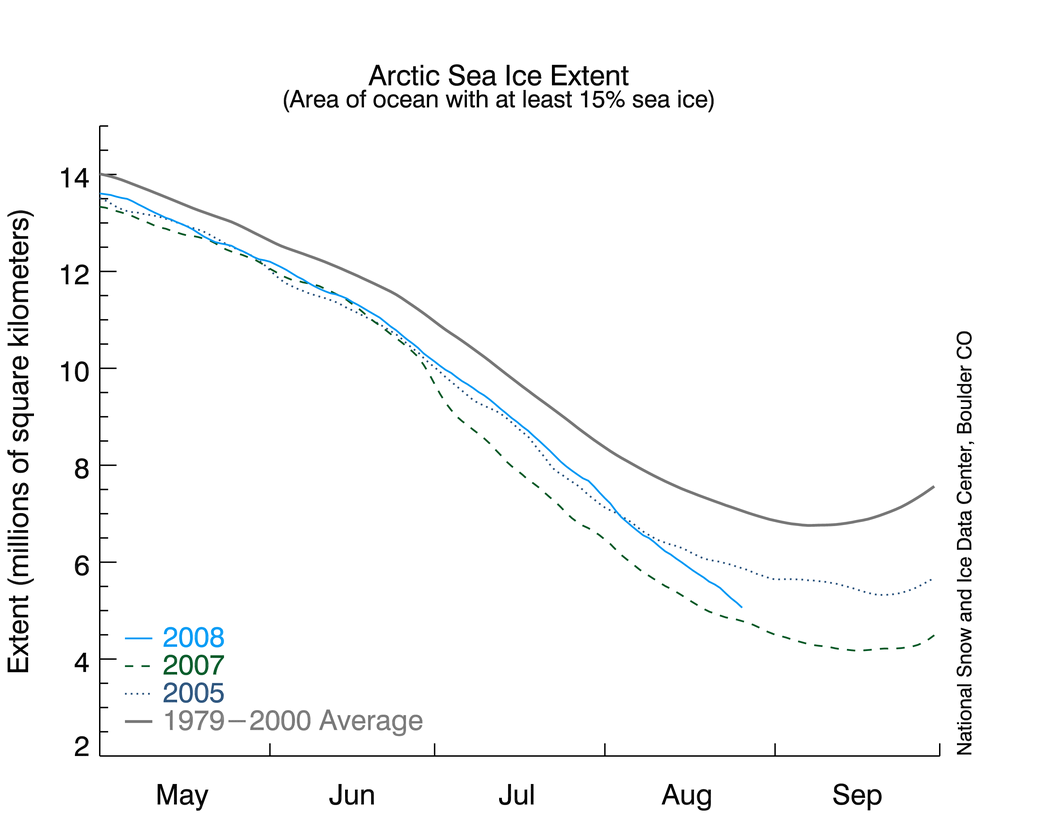
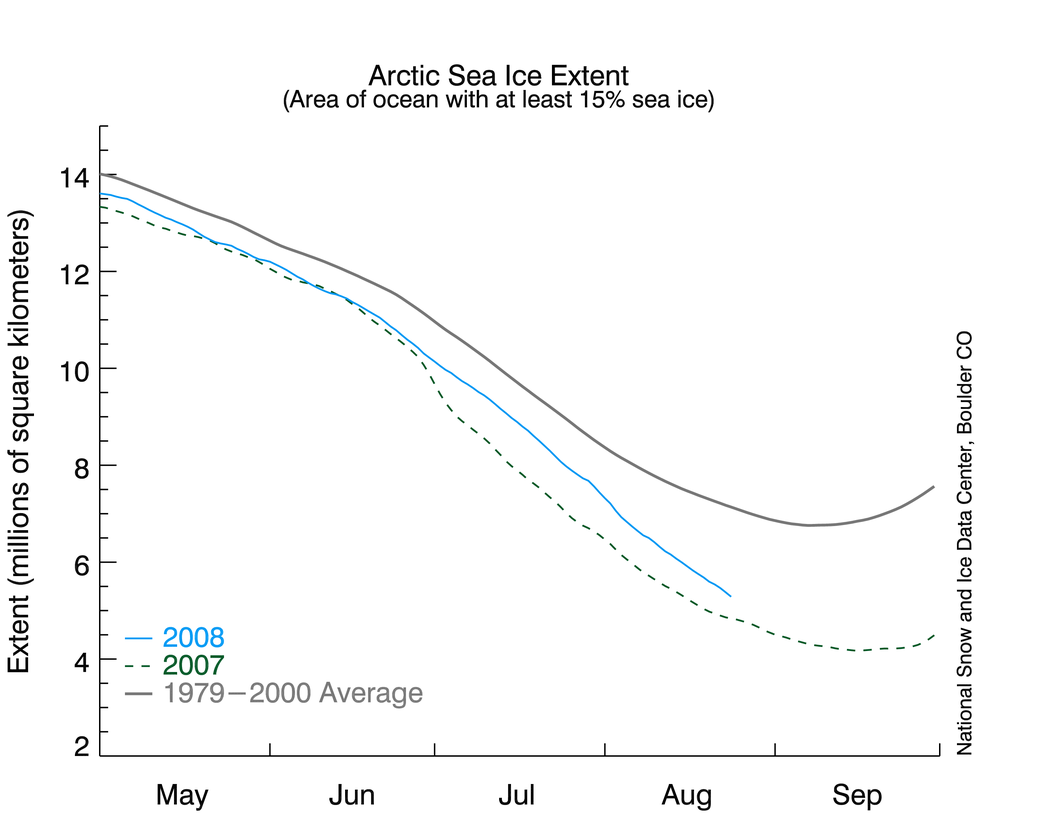
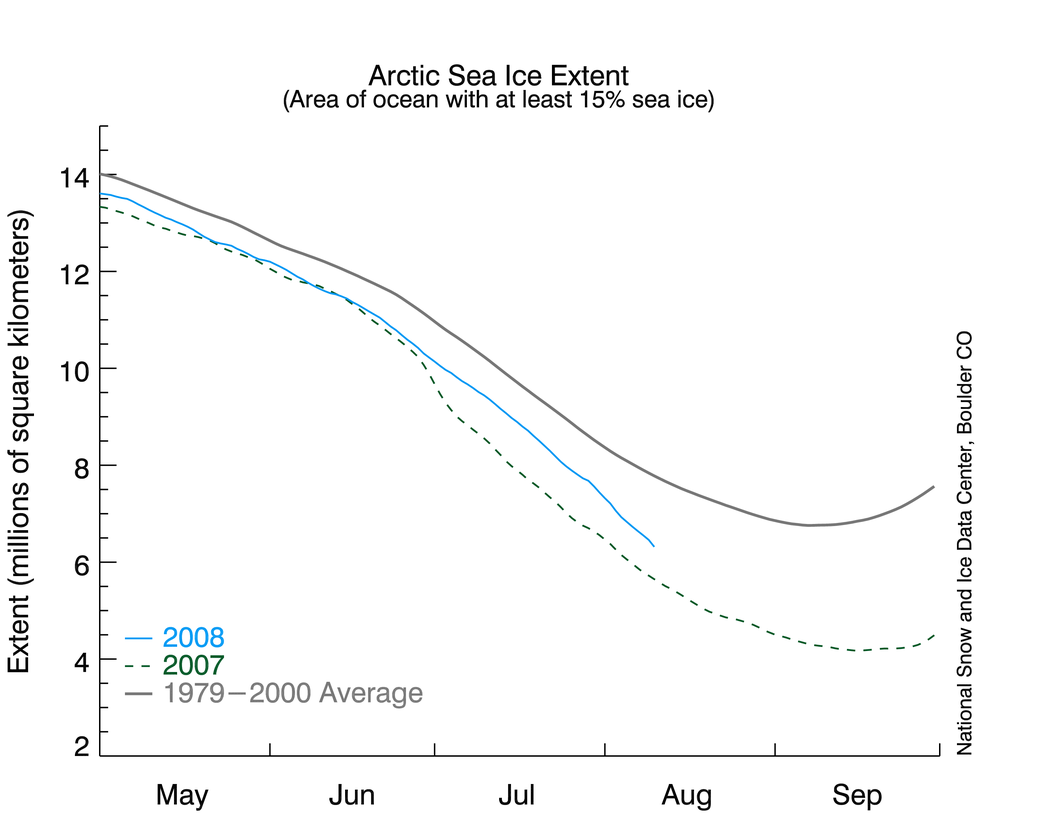
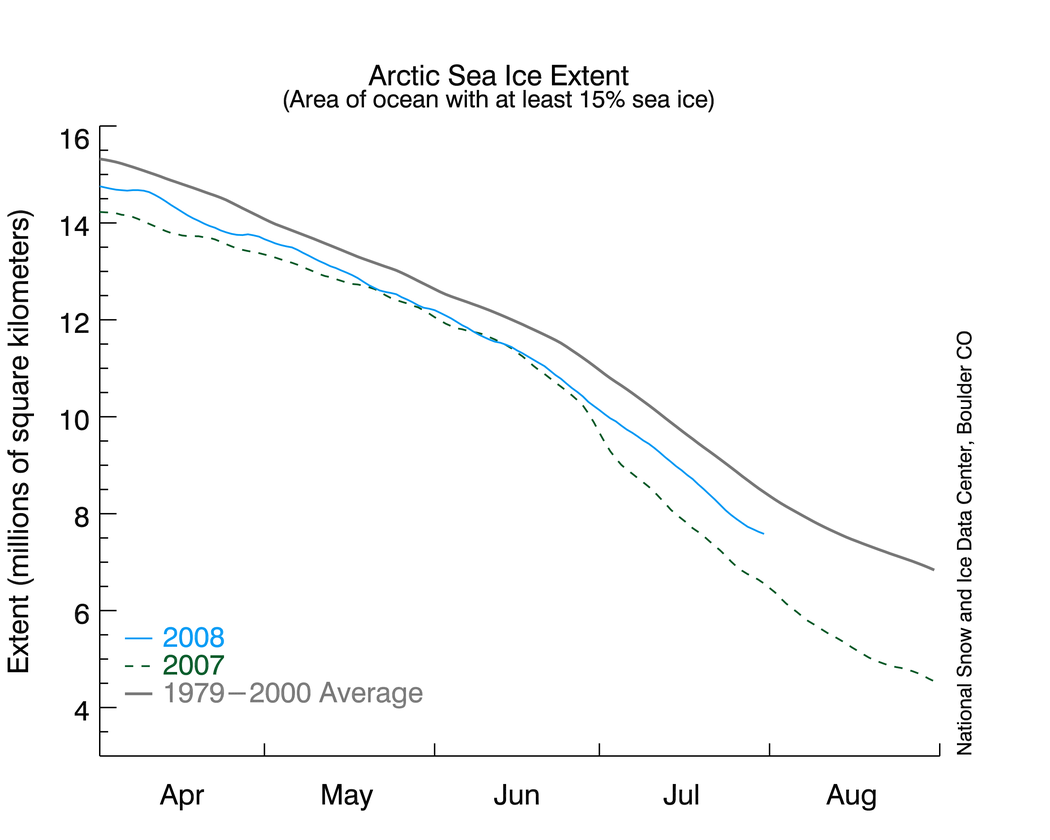
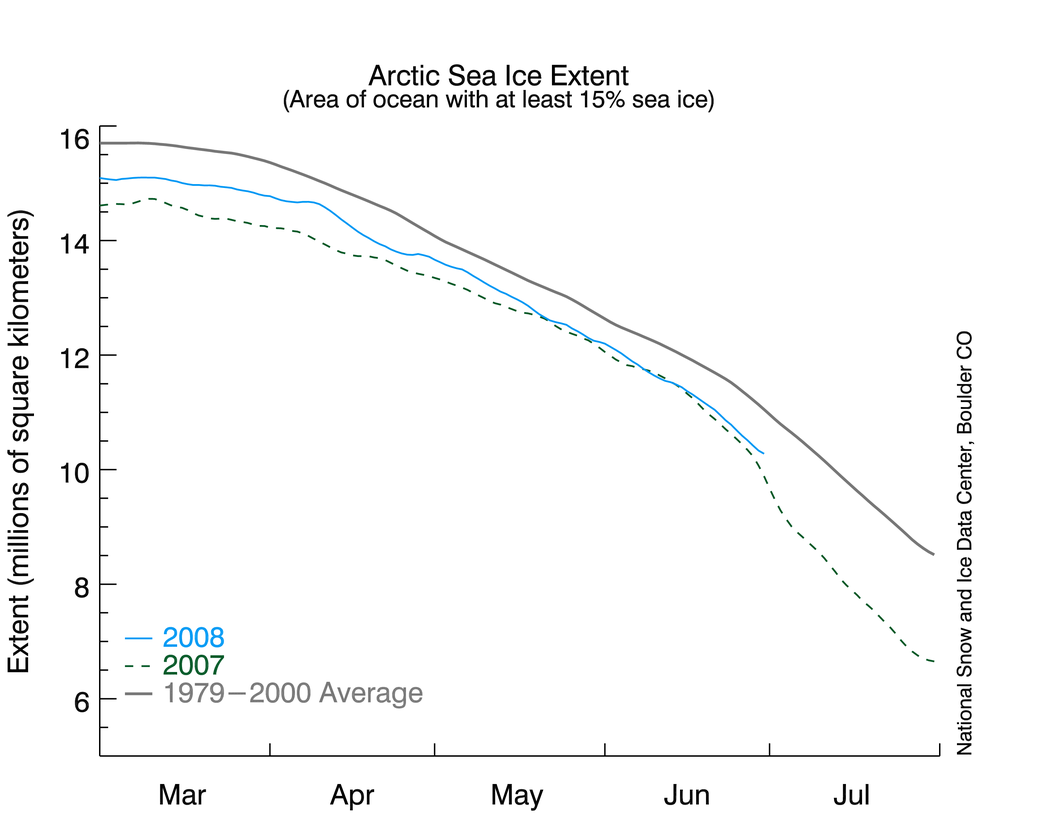
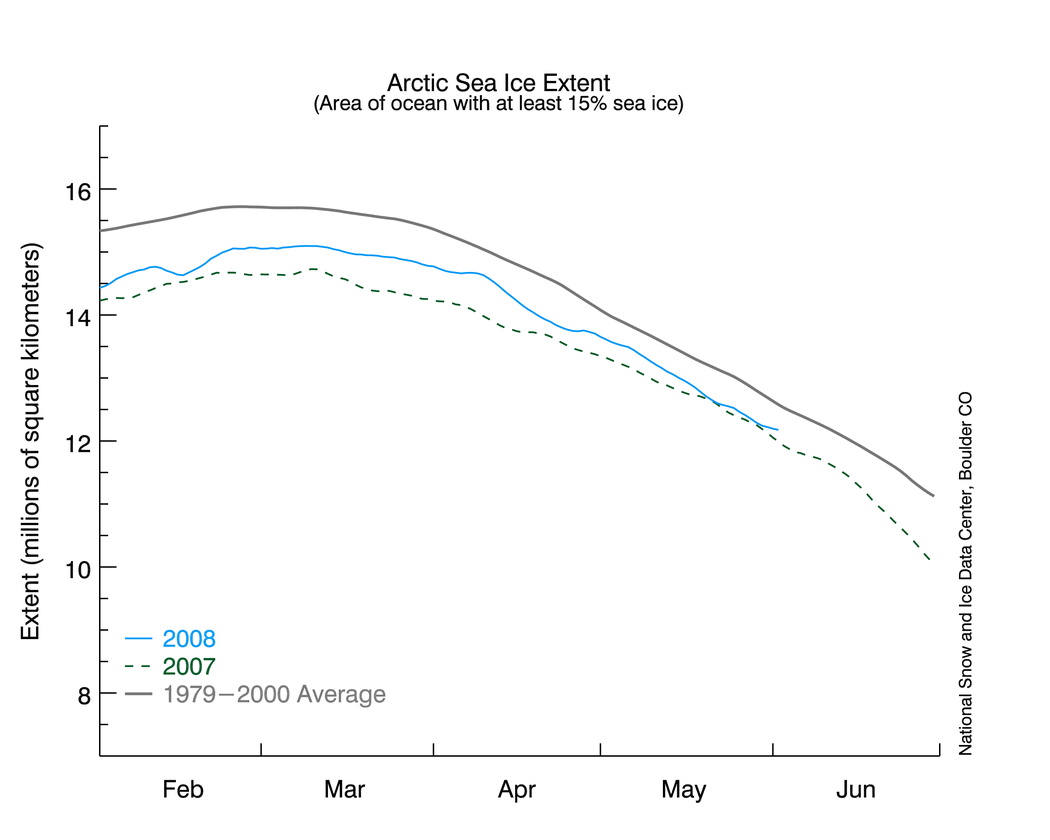
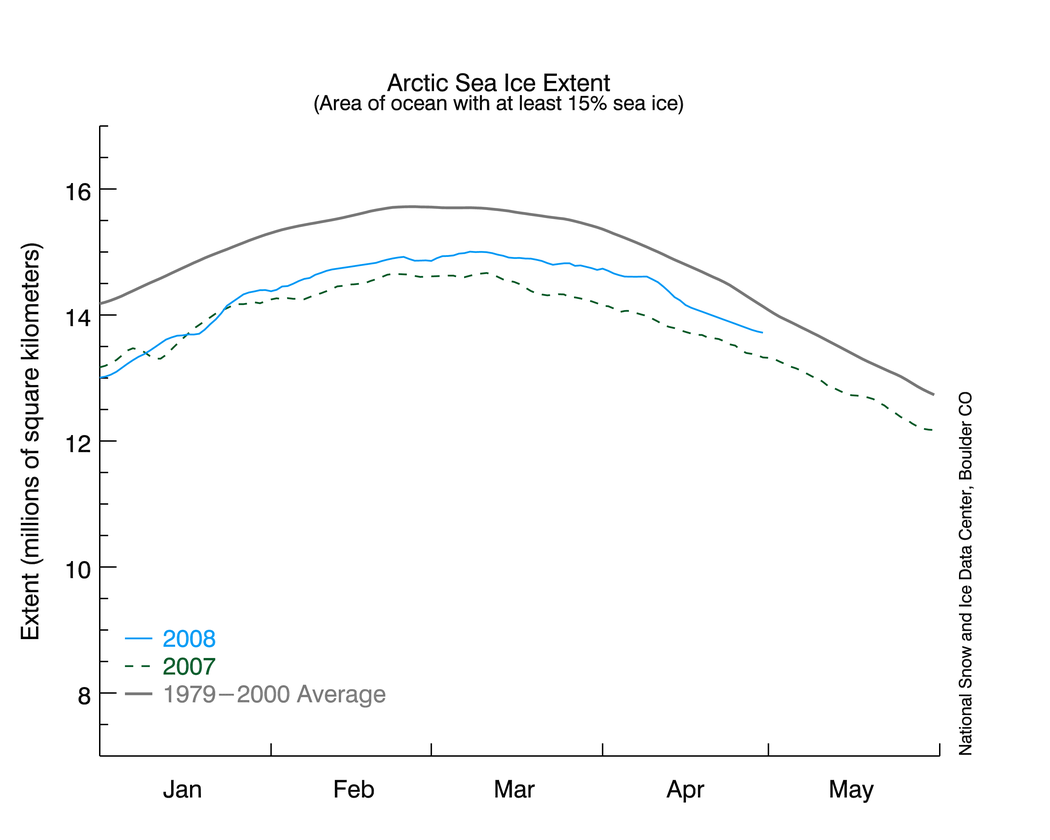
 Figure 2. The graph above shows daily sea ice extent.The solid light blue line indicates 2008; the dashed green line shows 2007; the dotted line shows 2005; the solid gray line indicates average extent from 1979 to 2000. Sea Ice Index data.
—Credit: National Snow and Ice Data Center
High-resolution image
Conditions in context
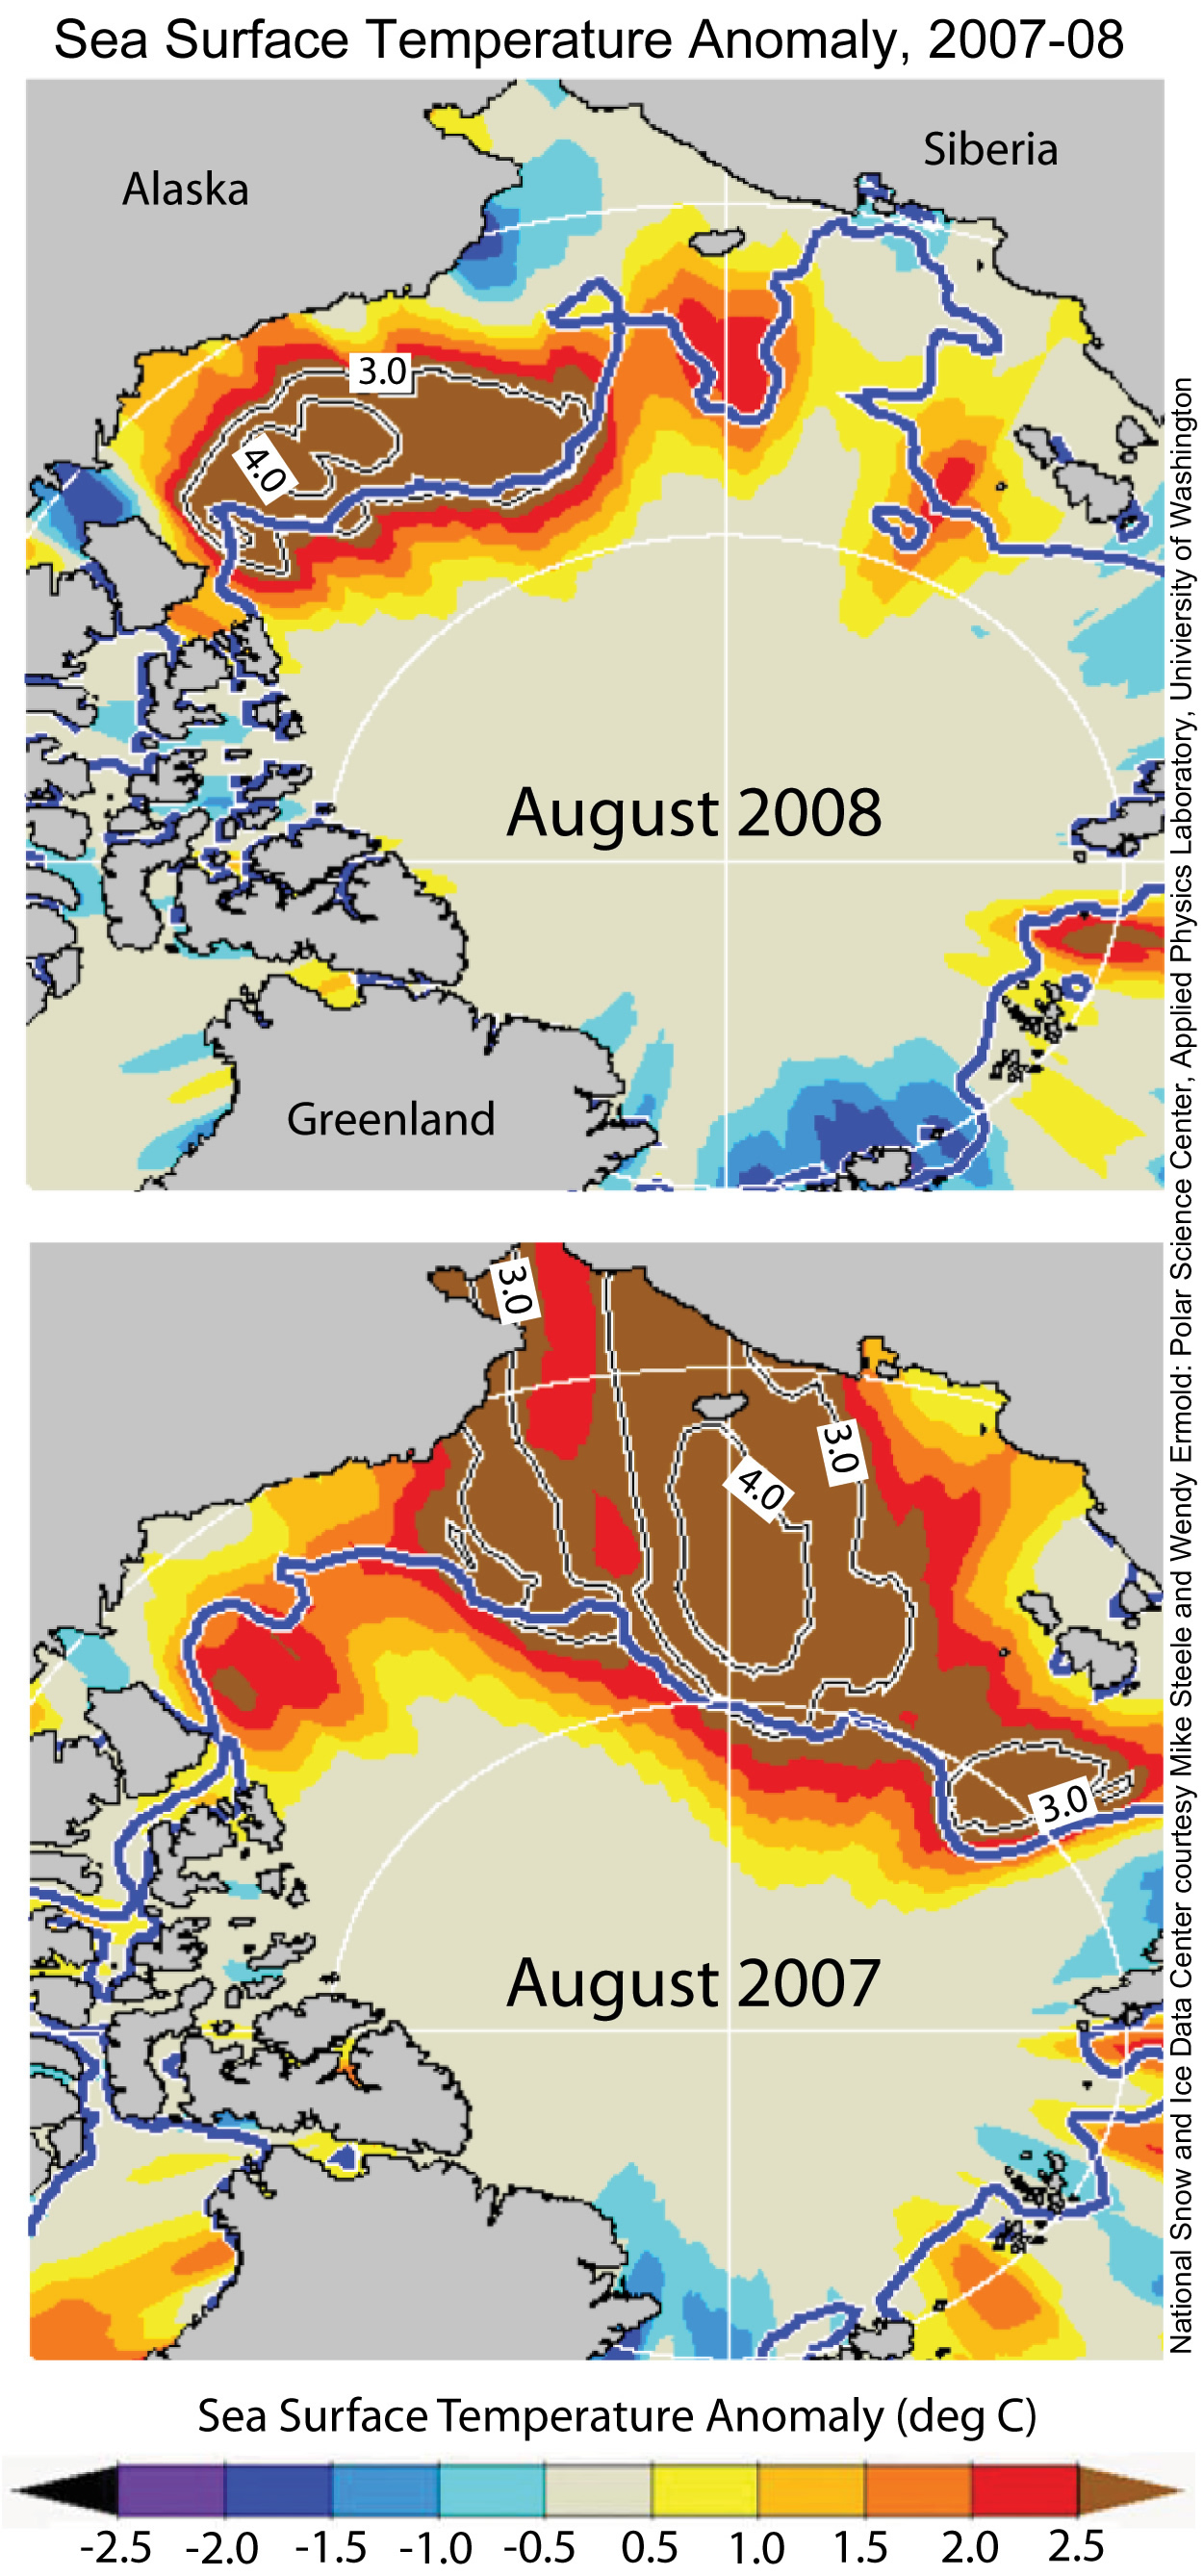
Despite overall cooler summer temperatures, the 2008 minimum extent is only 390,000 square kilometers (150,000 square miles), or 9.4%, more than the record-setting 2007 minimum. The 2008 minimum extent is 15.0% less than the next-lowest minimum extent set in 2005 and 33.1% less than the average minimum extent from 1979 to 2000.
This season further reinforces the long-term downward trend of sea ice extent.
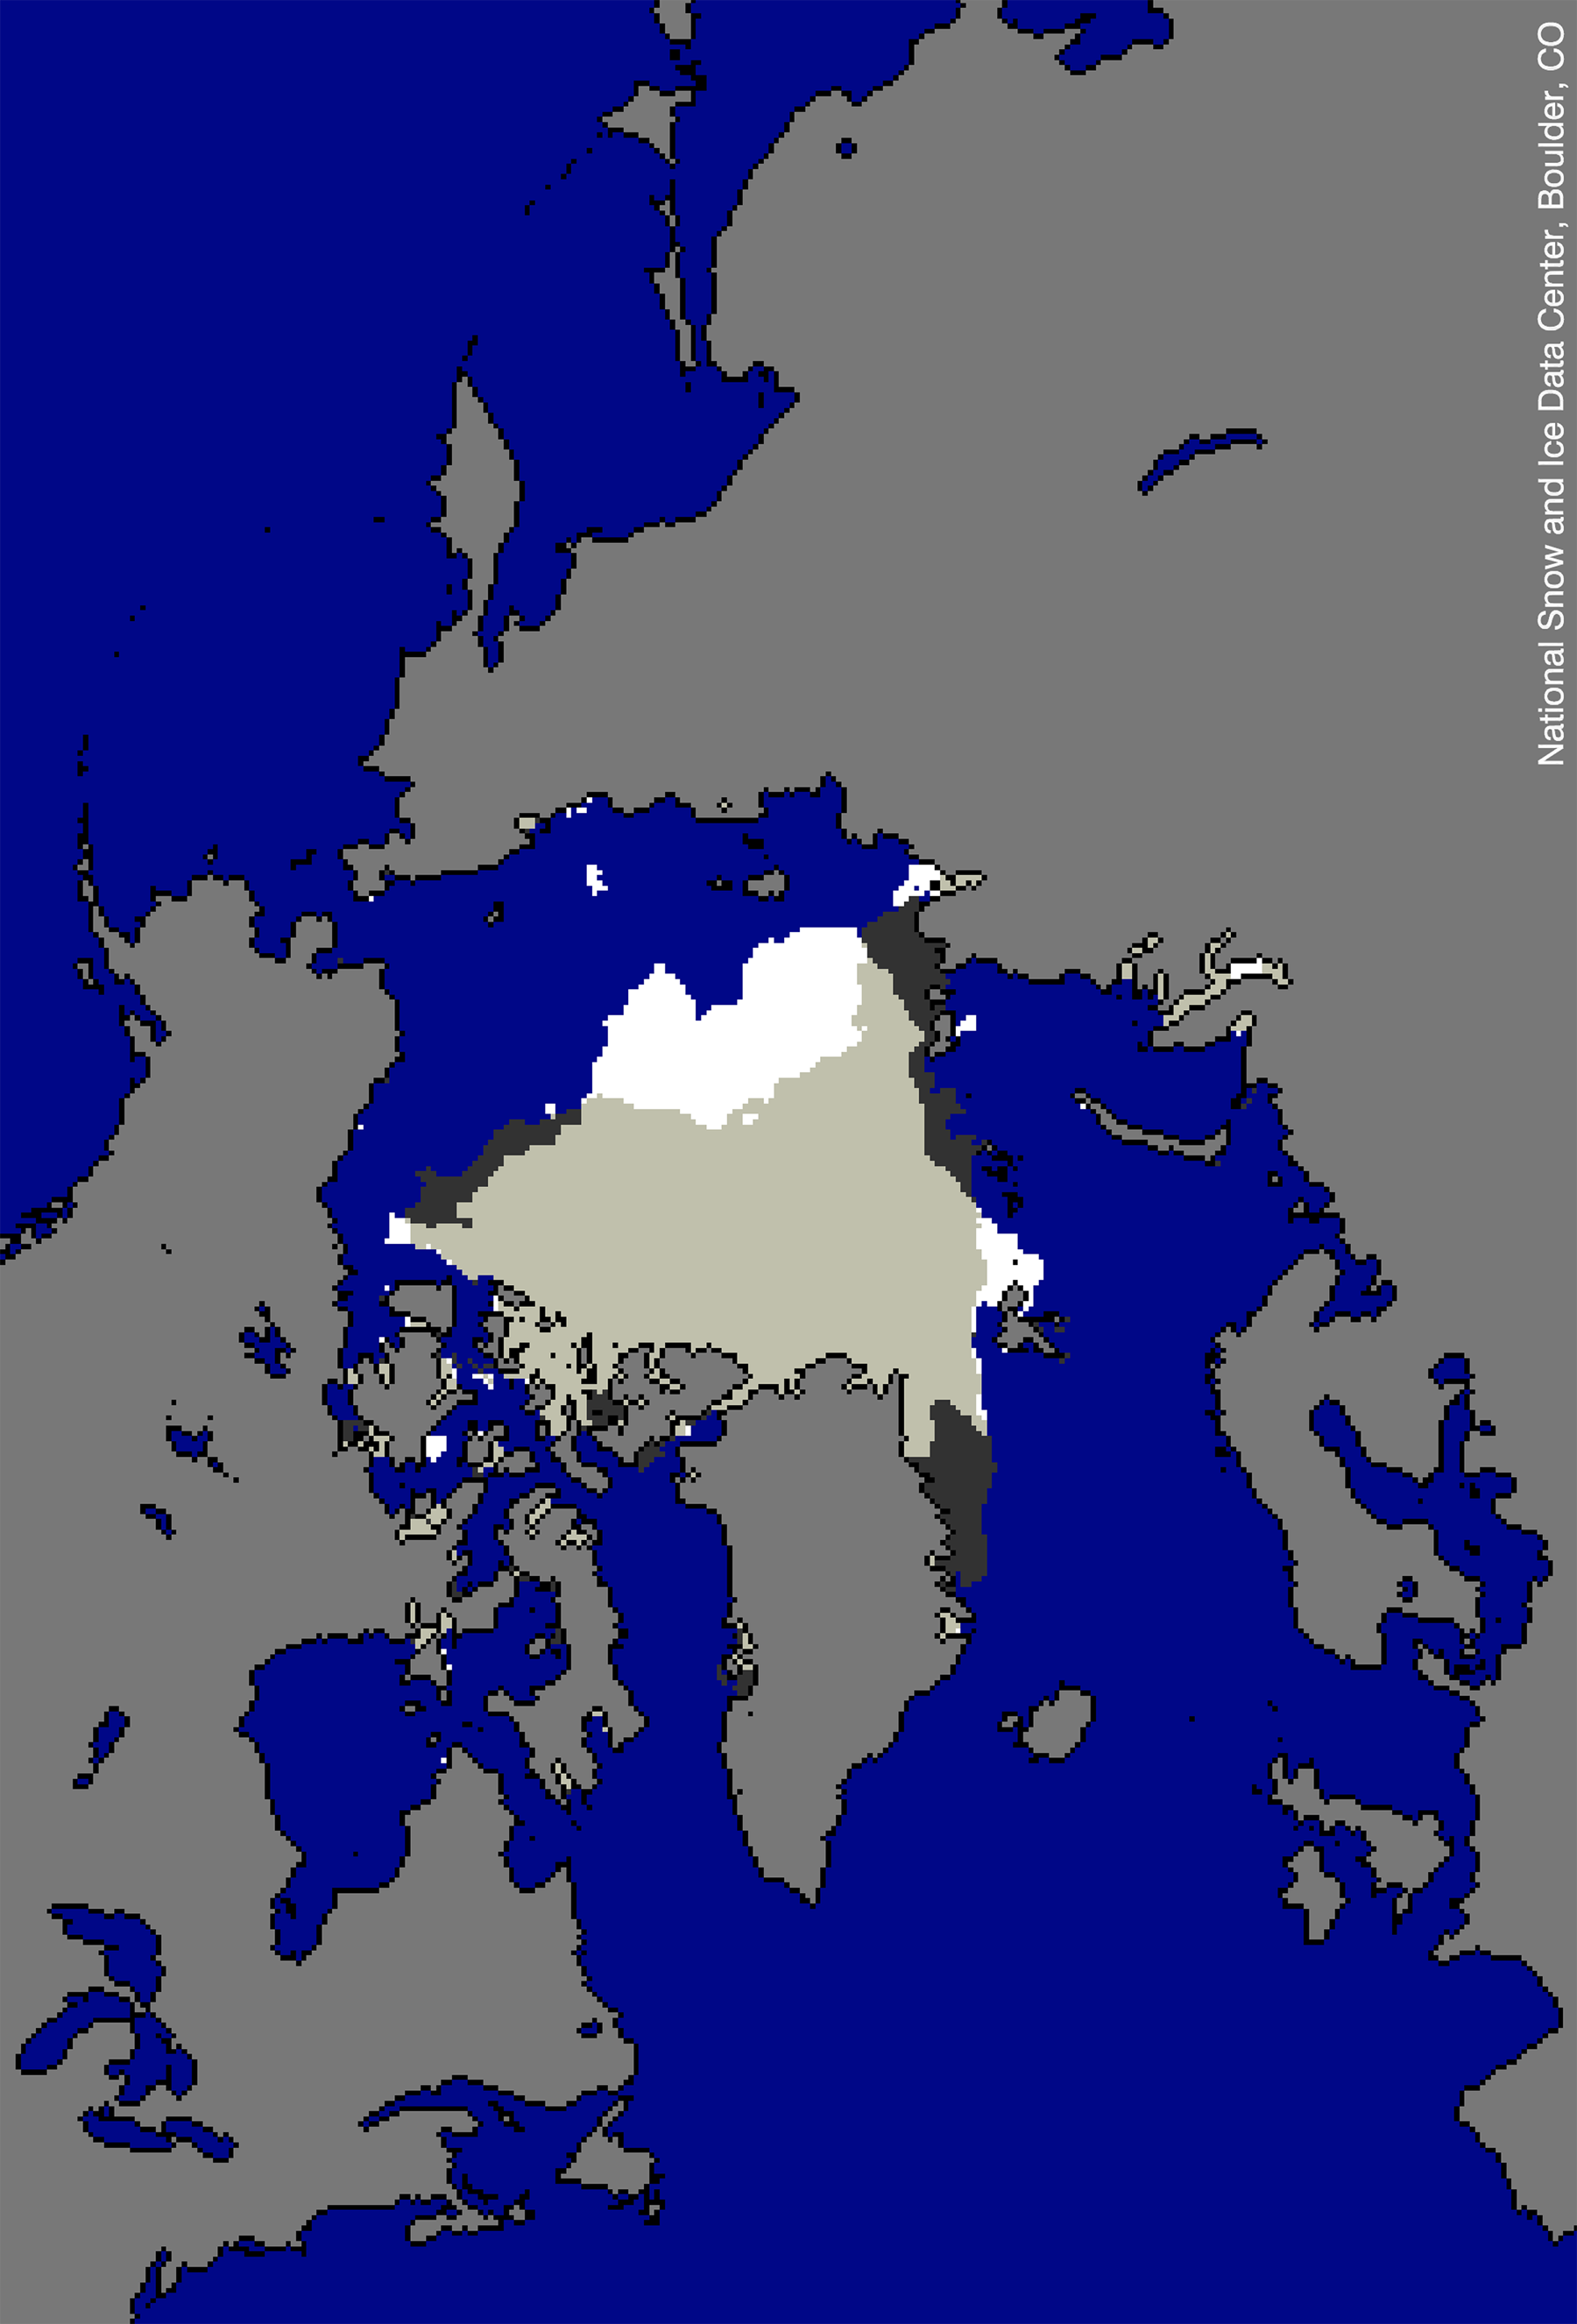
Figure 3. Daily Arctic sea ice extent for September 12, 2008, the date of this year’s minimum (white) is overlaid on September 16, 2007, last year’s minimum extent (dark gray). Light gray shading indicates the region where ice occurred in both 2007 and 2008. Sea Ice Index data. About the data.
—Credit: National Snow and Ice Data Center
High-resolution image
Overlay of 2007 and 2008 at September minimum
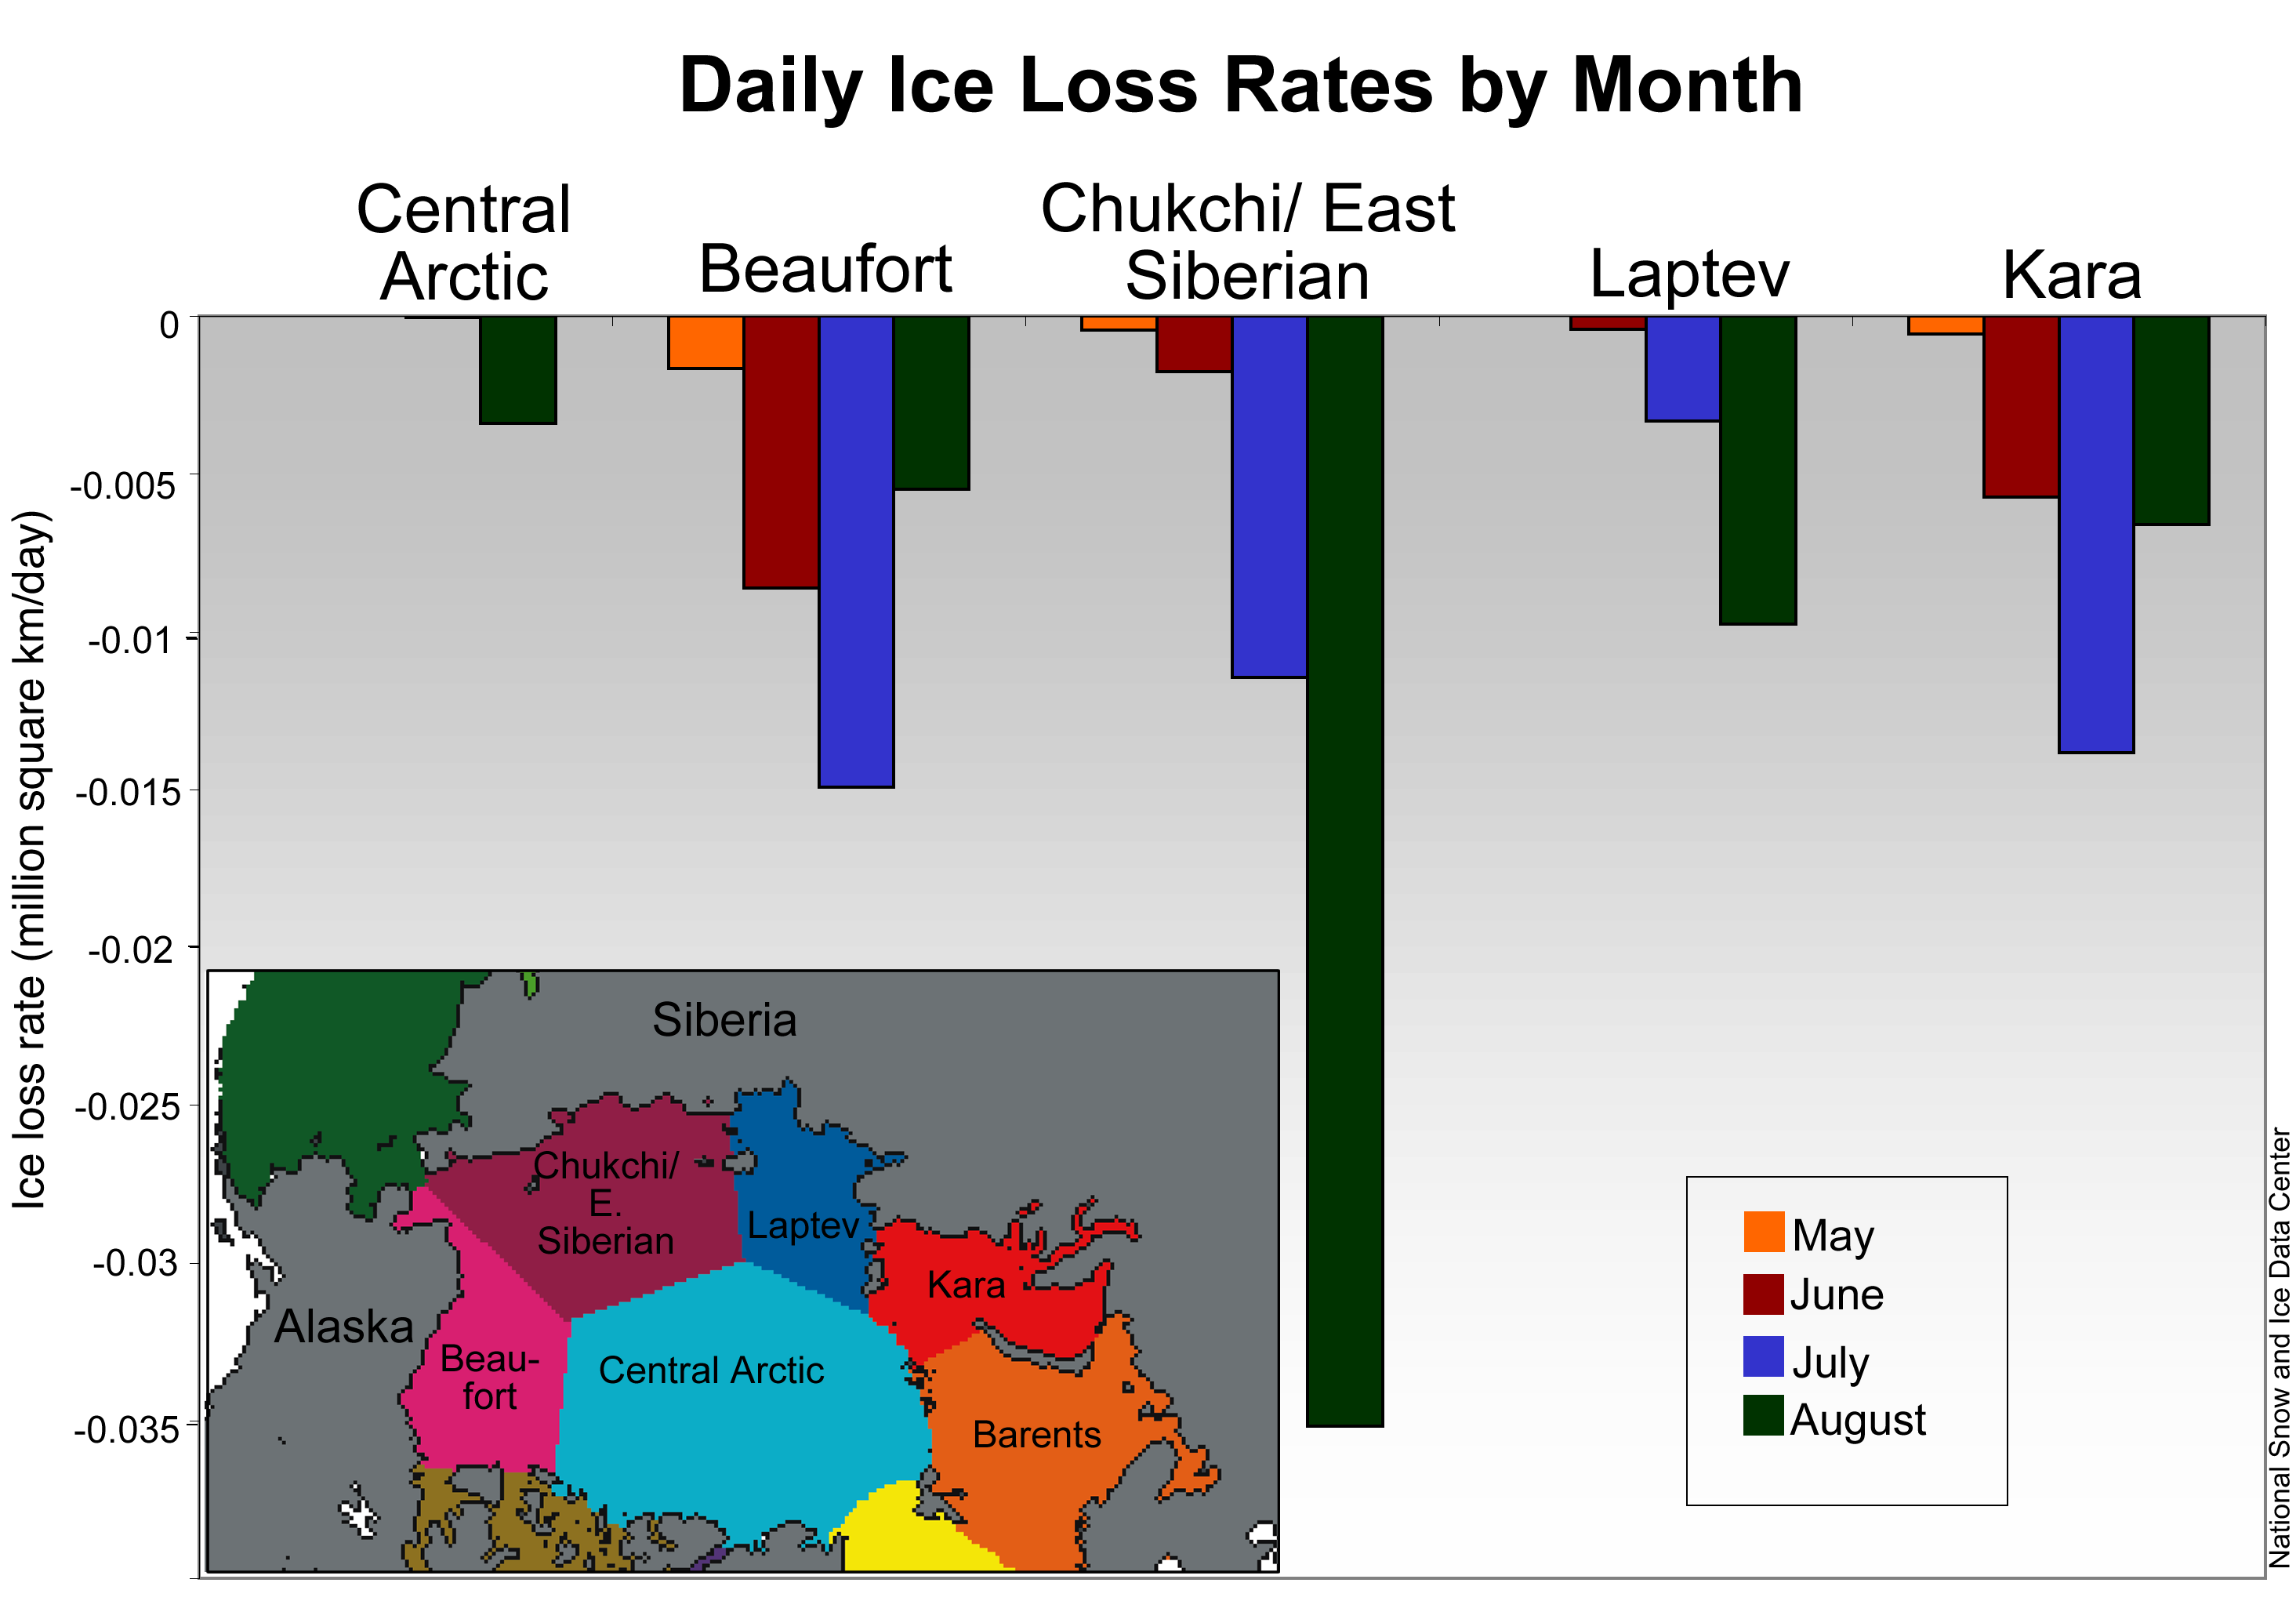
The spatial pattern of the 2008 minimum extent was different than that of 2007. This year did not have the substantial ice loss in the central Arctic, north of the Chukchi and East Siberian Seas. However, 2008 showed greater loss in the Beaufort, Laptev, and Greenland Seas.
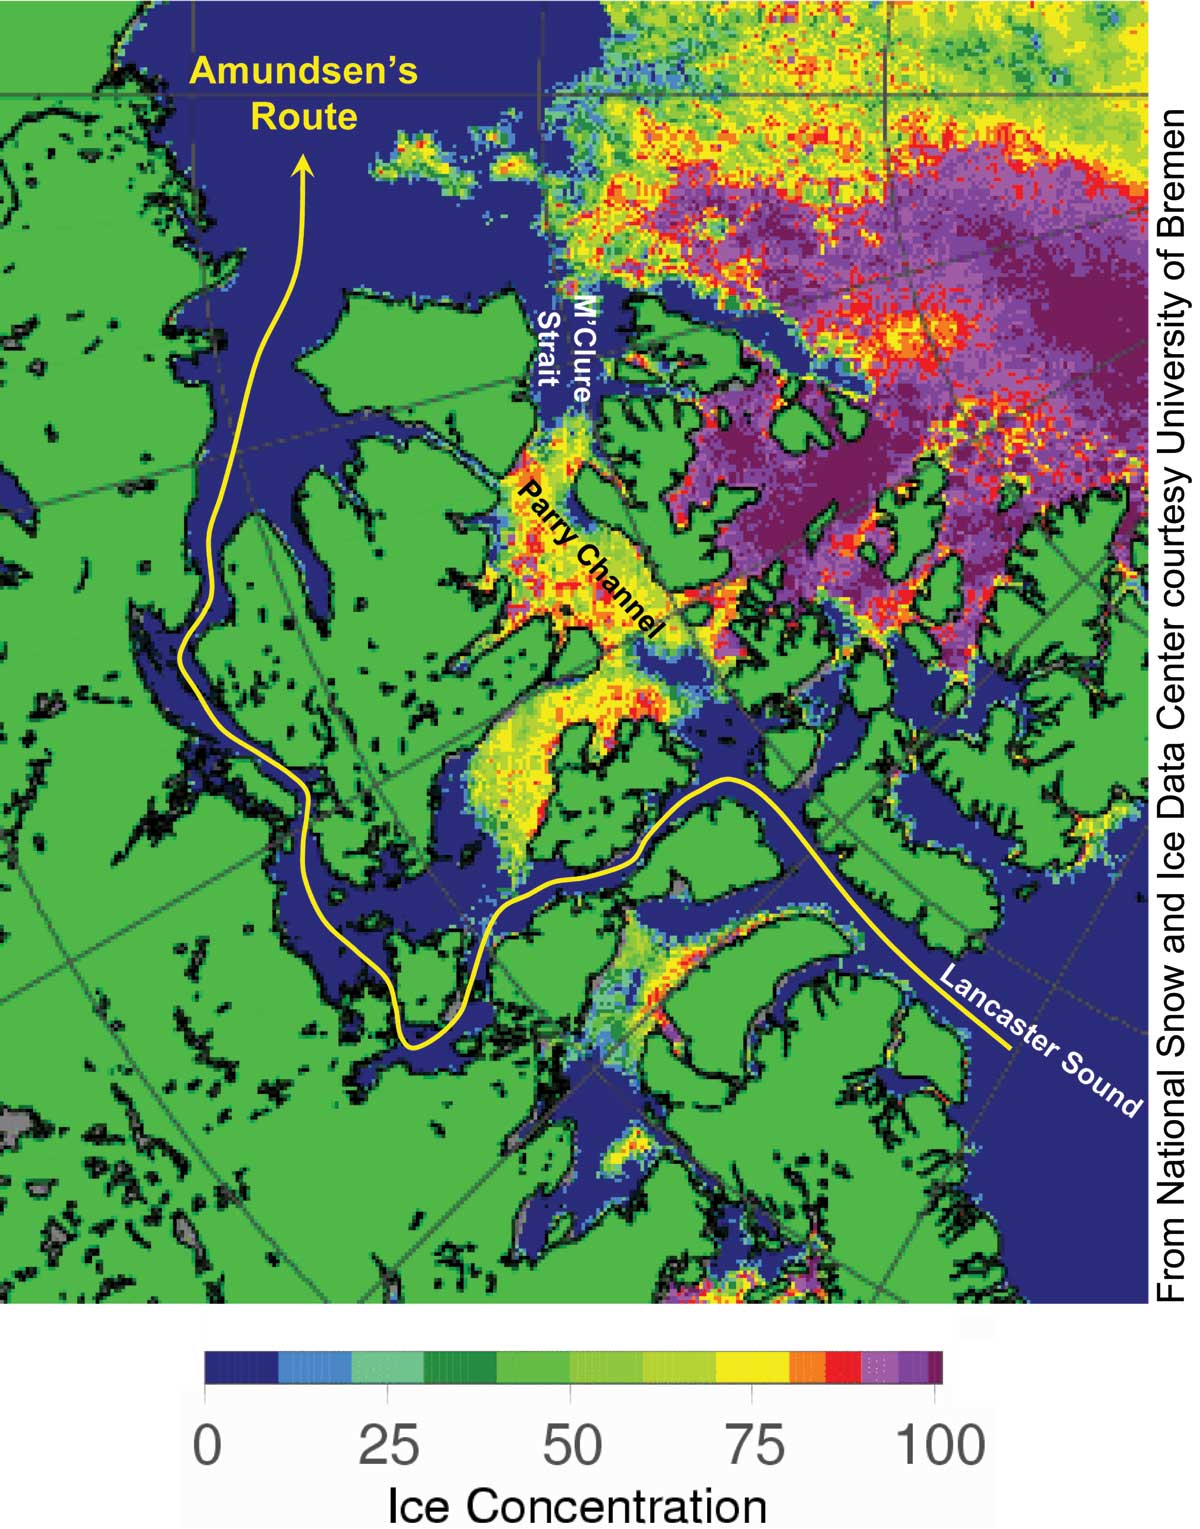
Unlike last year, this year saw the opening of the Northern Sea Route, the passage through the Arctic Ocean along the coast of Siberia. However, while the shallow Amundsen’s Northwest Passage opened in both years, the deeper Parry’s Channel of the Northwest Passage did not quite open in 2008.
A word of caution on calling the minimum
Determining with certainty when the minimum has occurred is difficult until the melt season has decisively ended. For example, in 2005, the time series began to level out in early September, prompting speculation that we had reached the minimum. However, the sea ice contracted later in the season, again reducing sea ice extent and causing a further drop in the absolute minimum.
We mention this now because the natural variability of the climate system has frequently been known to trick human efforts at forecasting the future. It is still possible that ice extent could fall again, slightly, because of either further melting or a contraction in the area of the pack due to the motion of the ice. However, we have now seen five days of gains in extent. Because of the variability of sea ice at this time of year, the National Snow and Ice Data Center determines the minimum using a five-day running mean value.
Ongoing analysis continues
We will continue to post analysis of sea ice conditions throughout the year, with frequency determined by sea ice conditions. Near-real-time images at upper right will continue to be updated every day.
In addition, NSIDC will issue a formal press release at the beginning of October with full analysis of the possible causes behind this year’s low ice conditions, particularly interesting aspects of the melt season, the set-up going into the important winter growth season ahead, and graphics comparing this year to the long-term record. At that time, we will also know what the monthly average September sea ice extent was in 2008—the measure scientists most often rely on for accurate analysis and comparison over the long-term.
For previous analysis, please see the drop-down menu under Archives in the right navigation at the top of this page.