Arctic sea ice extent for June 2008 is close to that for 2007, which went on to reach the lowest minimum since at least 1979. More notably, however, satellite data indicate that melt began significantly earlier than last year over most of the Arctic Ocean. The large area of the Arctic Ocean covered by first-year ice (described in our June analysis), coupled with the early onset of melting, may mean more rapid and more severe summer ice retreat than last year.
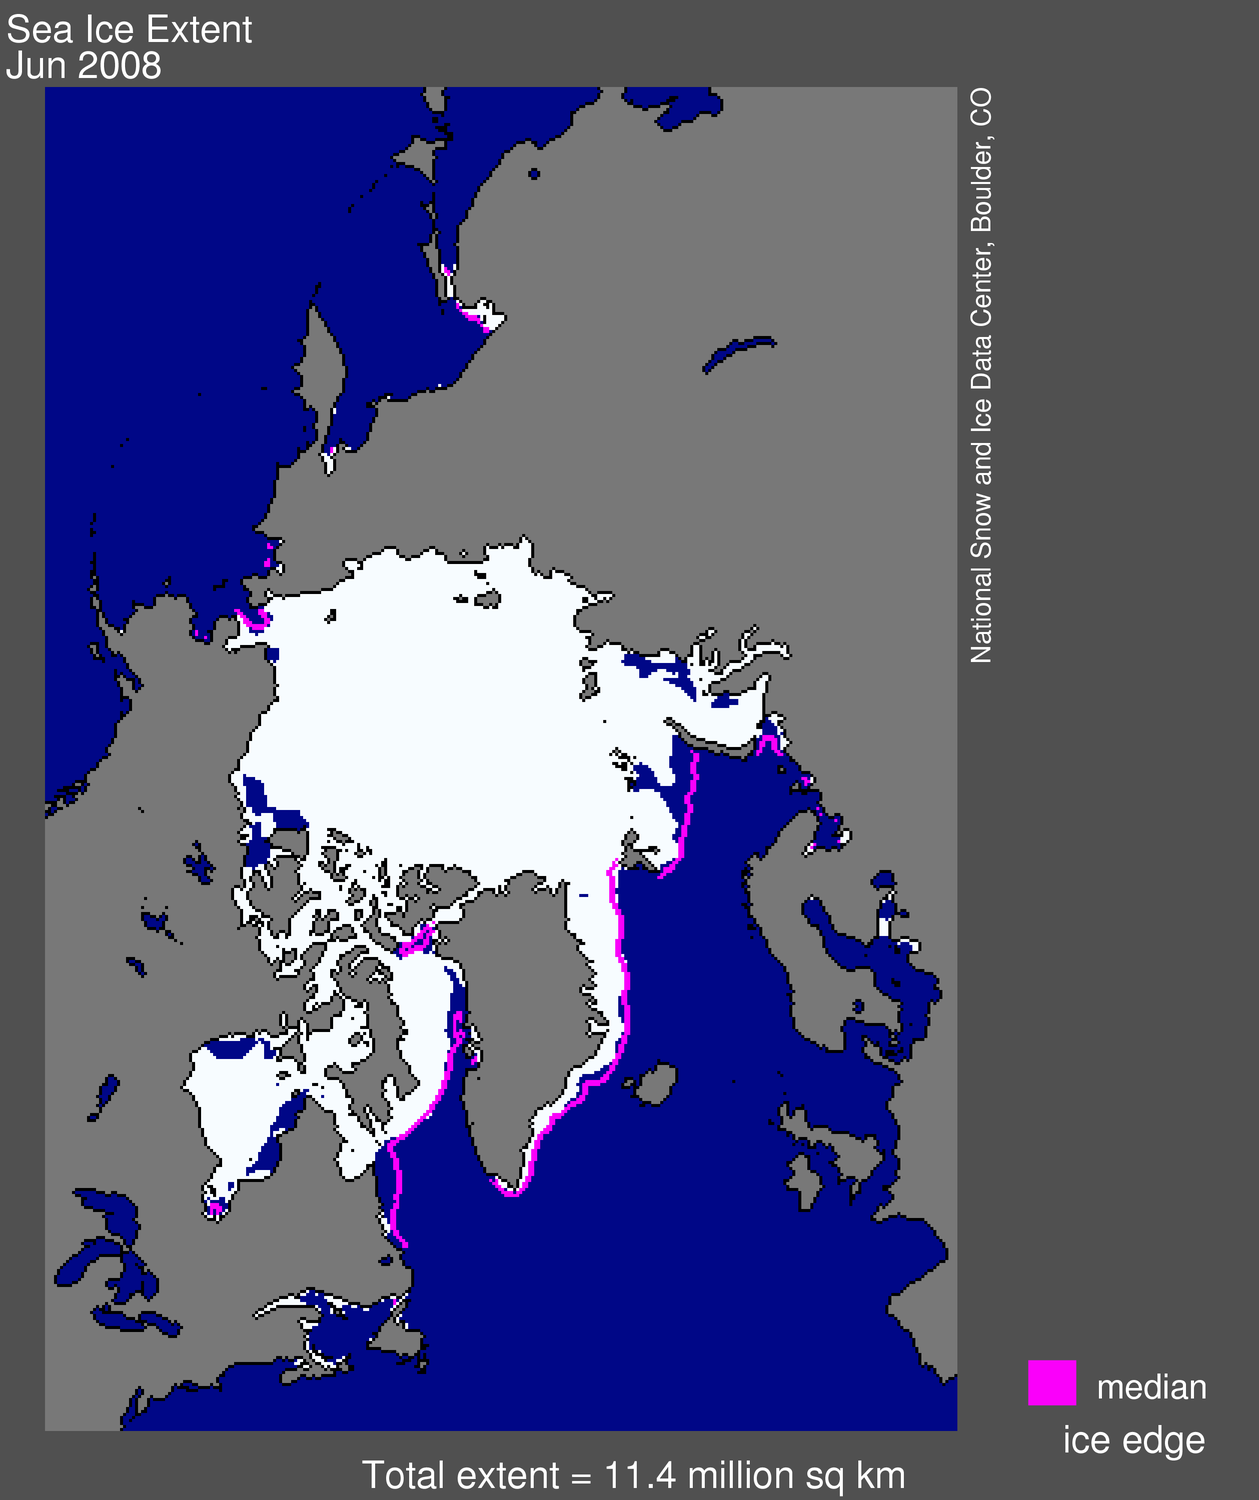 Figure 1. Arctic sea ice extent for June 2008 was 11.44 million square kilometers (4.42 million square miles). The magenta line shows the median ice extent for June from 1979 to 2000. About the data.
Overview of conditions
Arctic sea ice extent averaged for June stood at 11.44 million square kilometers (4.42 million square miles), 0.72 million square kilometers (0.25 million square miles) less than the 1979 to 2000 average for the month. This is very slightly (0.05 million square kilometers; 0.02 million square miles) lower than the average extent for June 2007, but not the lowest on record, which occurred in June 2006 (see Figure 3).
While the monthly average was slightly less than June 2007, Figure 2 indicates that on a daily basis, sea ice extent appears slightly higher than 2007 for most of the month. This apparent contradiction arises because of the monthly averaging calculation and because some days may have areas of missing data. To be included as an ice-covered region in the monthly average, the average concentration for that region must exceed 15 percent. So if the concentration is 15 percent for 29 days, but less than 15 percent for 1 day, it will not be included in the average ice extent for the month. Also, since ice extent decreases during June, if there is slightly more missing data in the early part of the month the monthly average could slightly underestimate the sea ice extent.
June sea ice extents in 2008 and 2007 are essentially identical, and near the lowest values for June ever recorded by satellite for the Arctic.
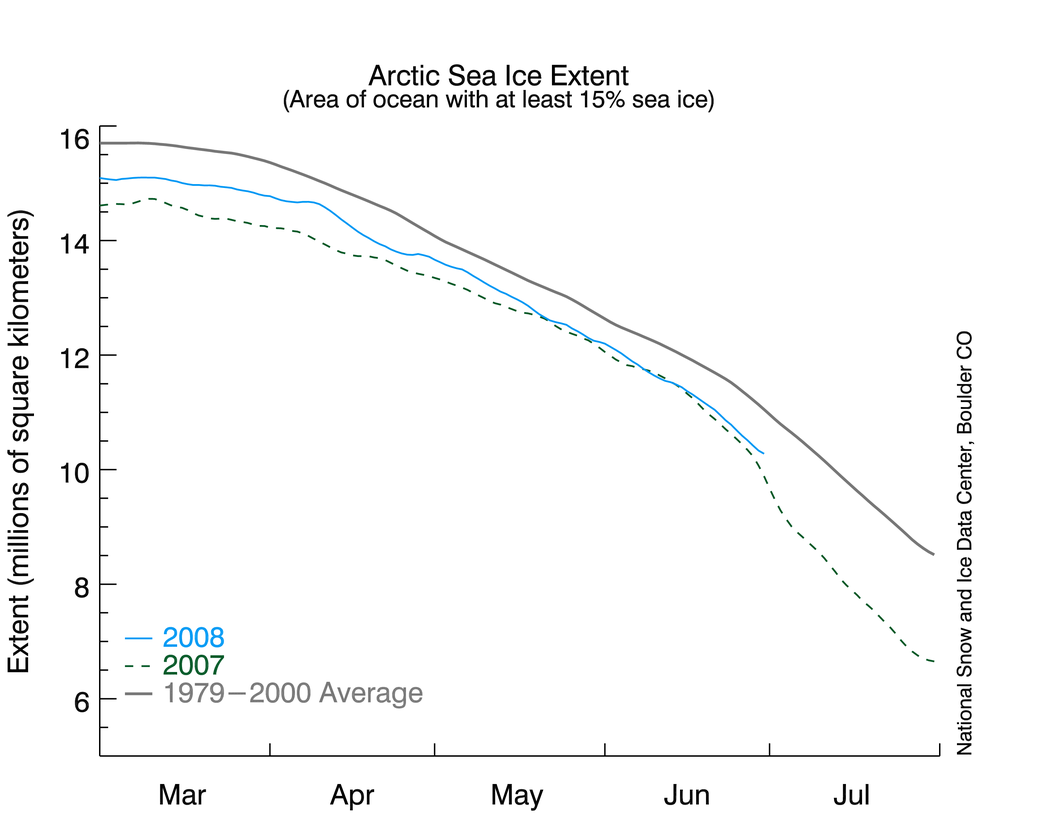
Figure 2. Daily sea ice extent; the blue line indicates 2008; the gray line indicates extent from 1979 to 2000; the dotted green line shows extent for 2007.
—Credit: National Snow and Ice Data Center
Conditions in context
While sea ice extent averaged for June 2008 was similar to last year, there were pronounced differences in the spatial pattern of the retreat through the month. Last year, open water quickly developed along the coasts of the Chukchi and Laptev seas. This year, an unusually large polynya has opened in the Beaufort Sea, and there is significantly less sea ice in Hudson Bay and Baffin Bay.
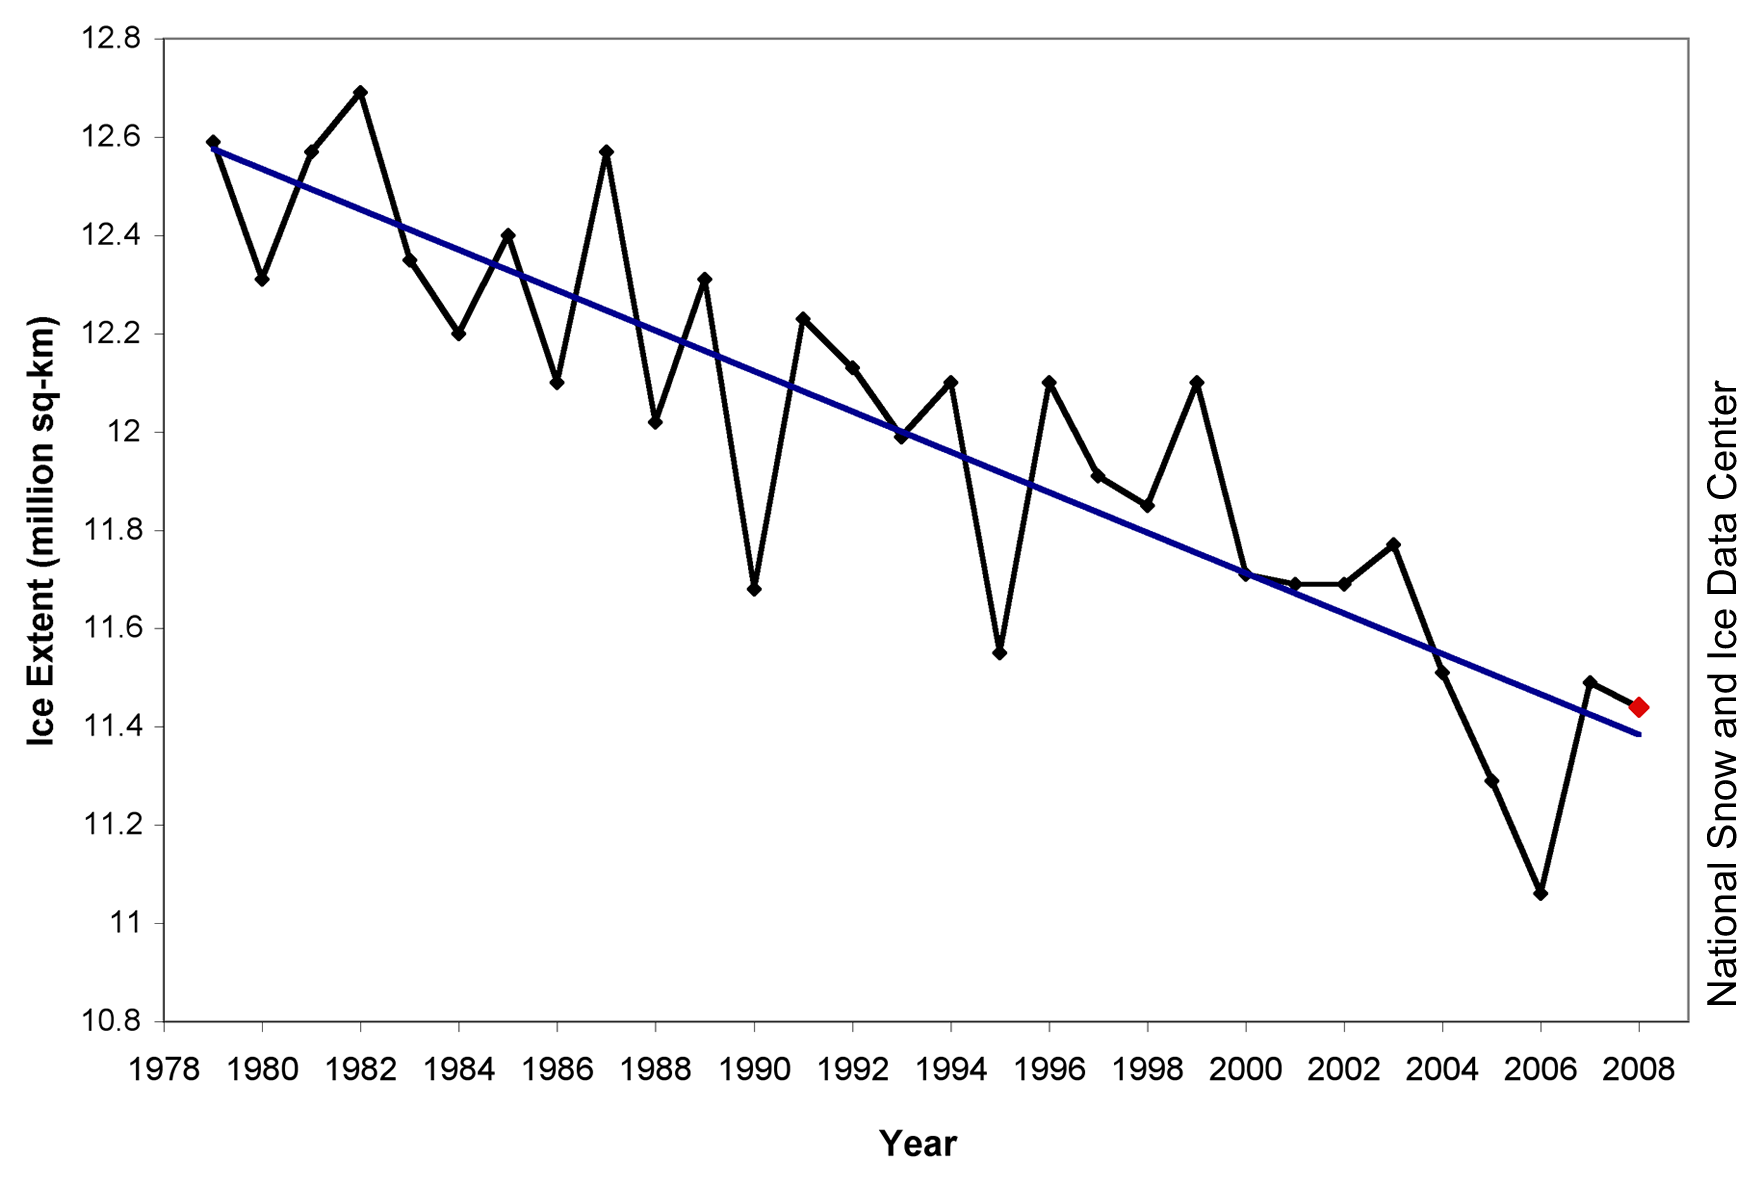
Figure 3. Average June ice extent for 1979 through 2008
—Credit: National Snow and Ice Data CenterSee High Resolution Image
June 2008 compared to past Junes
June sea ice extent is very similar to last year and is now the third lowest on record. It lies very close to the linear trend line for all average June sea ice extents since 1979, which indicates that the Arctic is losing an average of 41,000 square kilometers (15,800 square miles) of ice per year in June. Last year, the rapid melt leading to the record-breaking minimum extent began in July.

Figure 4. The colors in the above image indicate date of onset of melt over the Arctic Ocean. Light gray indicates areas that have not yet begun to melt this year, or areas for which data is not available. Data from the SSM/I sensor; algorithm used to process the data came from Thorsten Markus at Goddard Space Flight Center.
Early onset of melt
Preliminary satellite data shows us that surface melt began earlier than usual over the western and central Arctic Ocean and Baffin Bay (see Figure 4). Last year was fairly typical except for significant early melt in the Laptev and Barents seas. This year, sea ice in the Beaufort Sea began to melt on average 15 days earlier than normal, and 15 days earlier than last year. Surface melt in the Chukchi and East Siberian seas was 6 days earlier than normal, and 14 days earlier than in 2007. In the central Arctic Ocean, melt began around June 9th, which was 12 days earlier than normal and 9 days earlier than the year before. In Baffin Bay, surface melt began 14 days earlier than last year and was 16 days earlier than normal. Areas where melt occurred later, compared to last year, are confined to the margins of the ice cover. These preliminary results will be updated as more data becomes available.
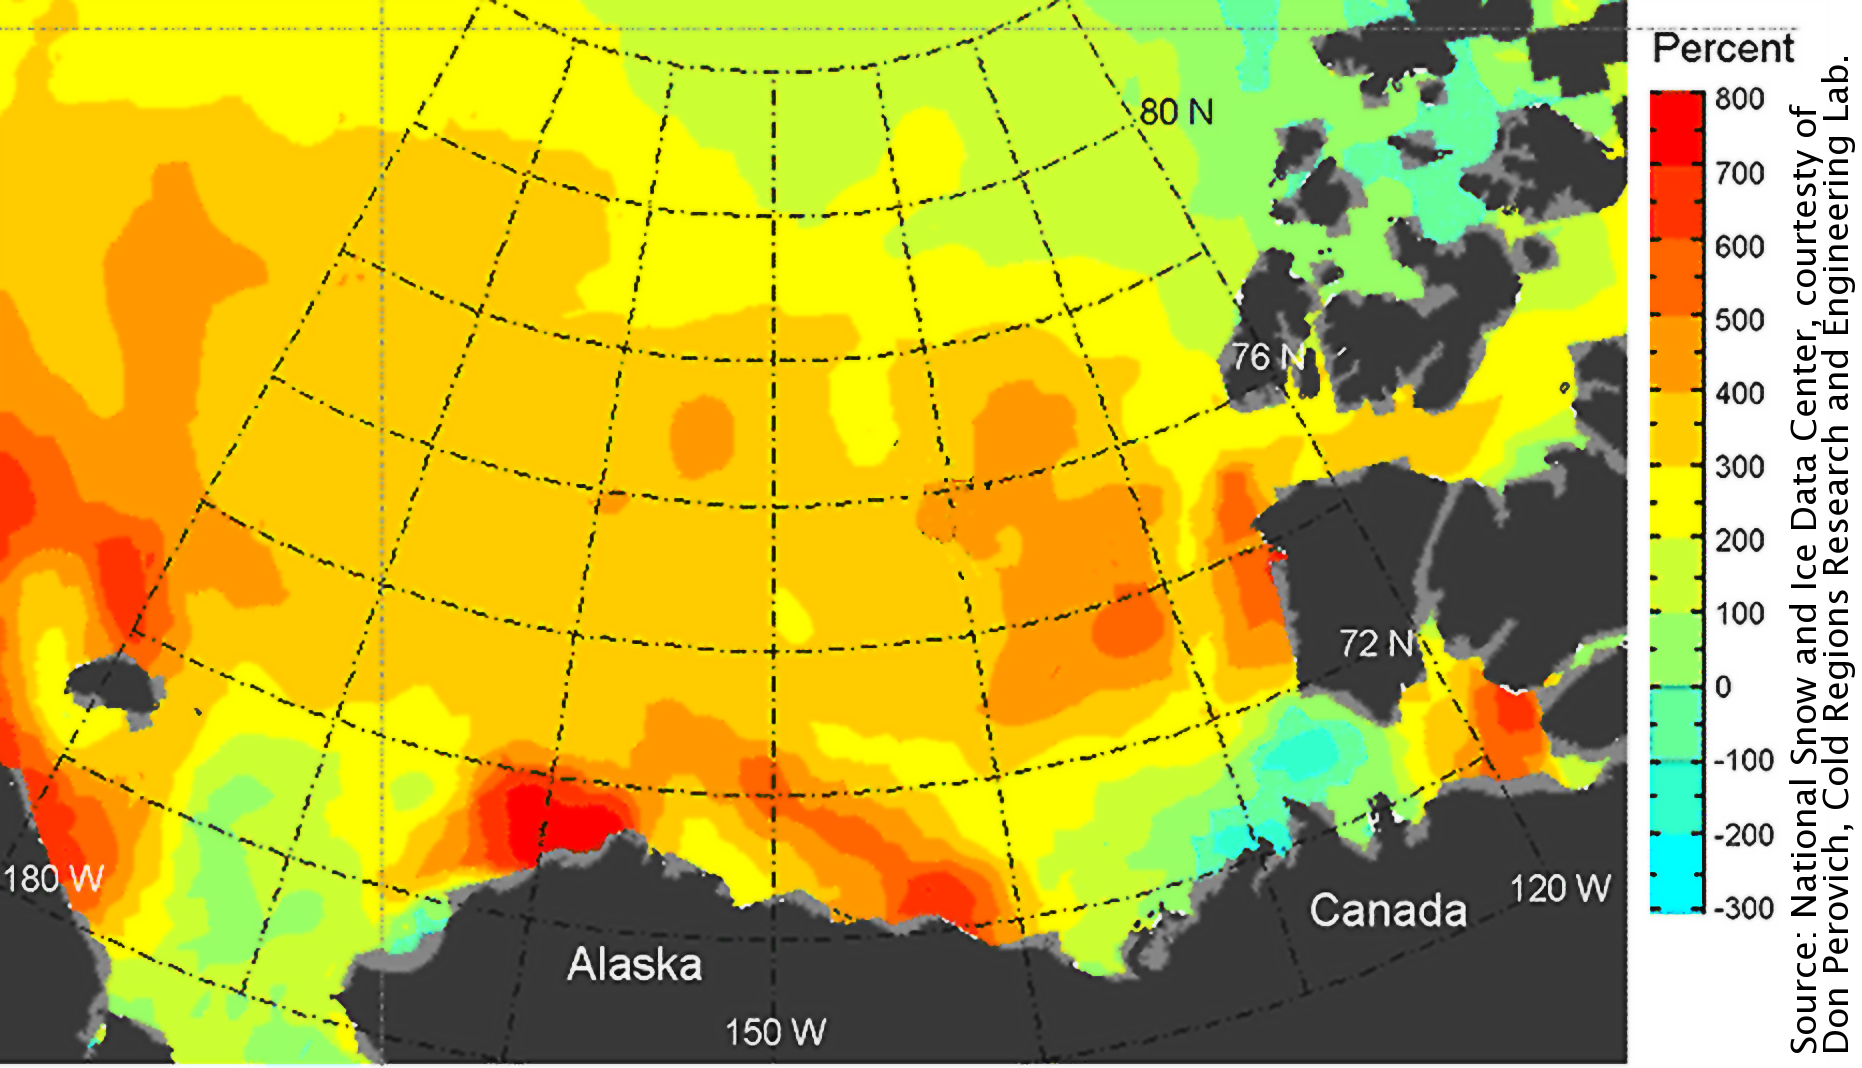 Figure 5. This image shows the percent anomaly of ocean absorption of solar heat from January 1 to September 21, 2007, compared to the 1979 to 2005 average. Dark red and orange indicate areas with especially low albedo. Data from SSM/I sensor.
 Figure 4 was updated on July 3, 2008, with data through July 1. A previous version, posted on July 2, used data from June 10, 2008.
Why earlier melt matters
What are the implications of this year’s earlier-than-normal melt onset? As melting begins, the layer of snow on top of the ice becomes wet and then disappears, leaving bare ice and ponded water. Each of these changes reduces the reflectance of the surface—increasing absorption of solar energy, further reducing reflectance, and promoting even stronger melt. This is known as the ice-albedo feedback.
Early melt onset exposes the snow and ice to more days with low reflectance. It also increases the exposure during the critical early summer season, when solar energy is at its peak. As colleague Don Perovich of the Cold Regions Research and Engineering Laboratory notes, this combination enhances ice-albedo feedback (see Figure 5). Perovich calculated that in 2007, some areas of the Arctic absorbed eight times as much heat because of the ice-albedo feedback, contributing heavily to last year’s record-breaking melt.
The combination of ice-albedo feedback and early melt onset in 2008 sets the stage for significant ice losses this summer. Three of the most important factors in sea ice losses are melt onset, cloud conditions throughout the melt season, and atmospheric circulation throughout the melt season. With melt onset having occurred earlier than usual, cloud and atmospheric conditions over the next two months come to the forefront. To learn more about cloud conditions and atmospheric circulation, read “More on the sea ice-atmosphere connection” in our June analysis.
A community sea ice outlook
The Study of Environmental Arctic Change program has released a Sea Ice Outlook for 2008. Their May report has predictions from a number of different scientific groups (including NSIDC) of how much sea ice will be left in the Arctic at the end of the melt season. The predictions range widely above and below last year’s record minimum of 4.13 million square kilometres (1.59 million square miles).
References
Perovich, D. K., J. A. Richter-Menge, K. F. Jones, and B. Light (2008), Sunlight, water, and ice: Extreme Arctic sea ice melt during the summer of 2007, Geophys. Res. Lett., 35, L11501, doi:10.1029/2008GL034007.
Stroeve, J.C., T. Markus and W.N. Meier (2006), Recent changes in the Arctic melt season, Annals of Glaciology, 44, 367-374
For previous analysis, please see the drop-down menu under Archives in the right navigation at the top of this page.

