A summer storm in the Arctic

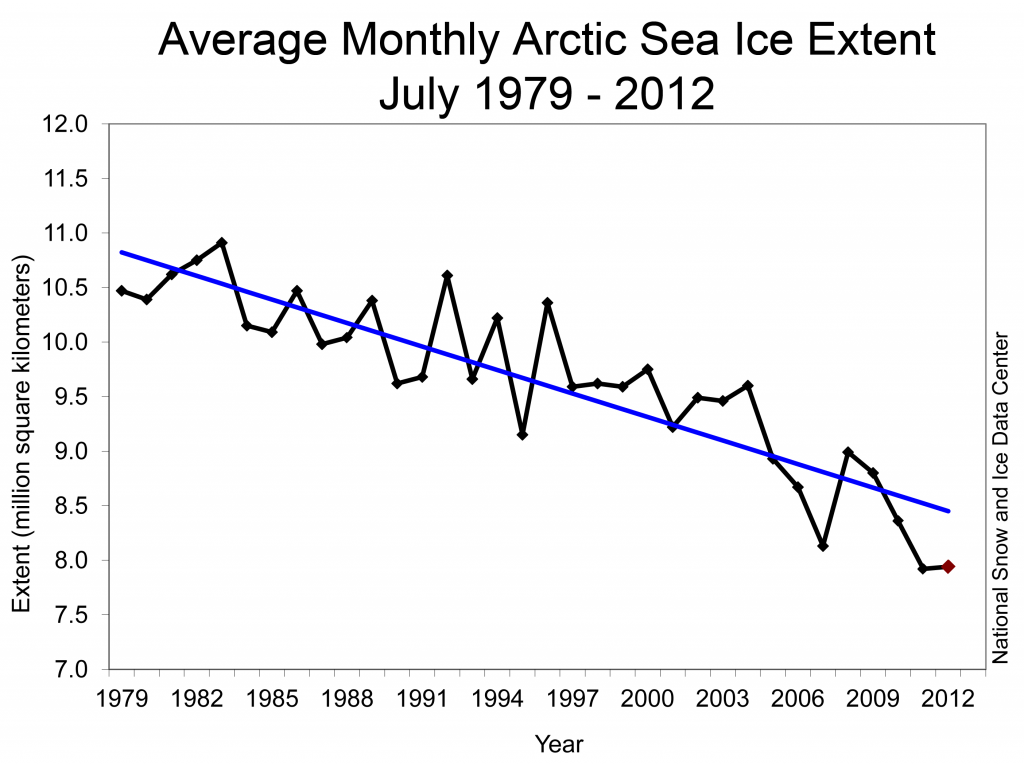
Arctic sea ice extent during the first two weeks of August continued to track below 2007 record low daily ice extents. As of August 13, ice extent was already among the four lowest summer minimum extents in the satellite record, with about five weeks still remaining in the melt season. Sea ice extent dropped rapidly between August 4 and August 8. While this drop coincided with an intense storm over the central Arctic Ocean, it is unclear if the storm prompted the rapid ice loss. Overall, weather patterns in the Arctic Ocean through the summer of 2012 have been a mixed bag, with no consistent pattern.

Overview of conditions

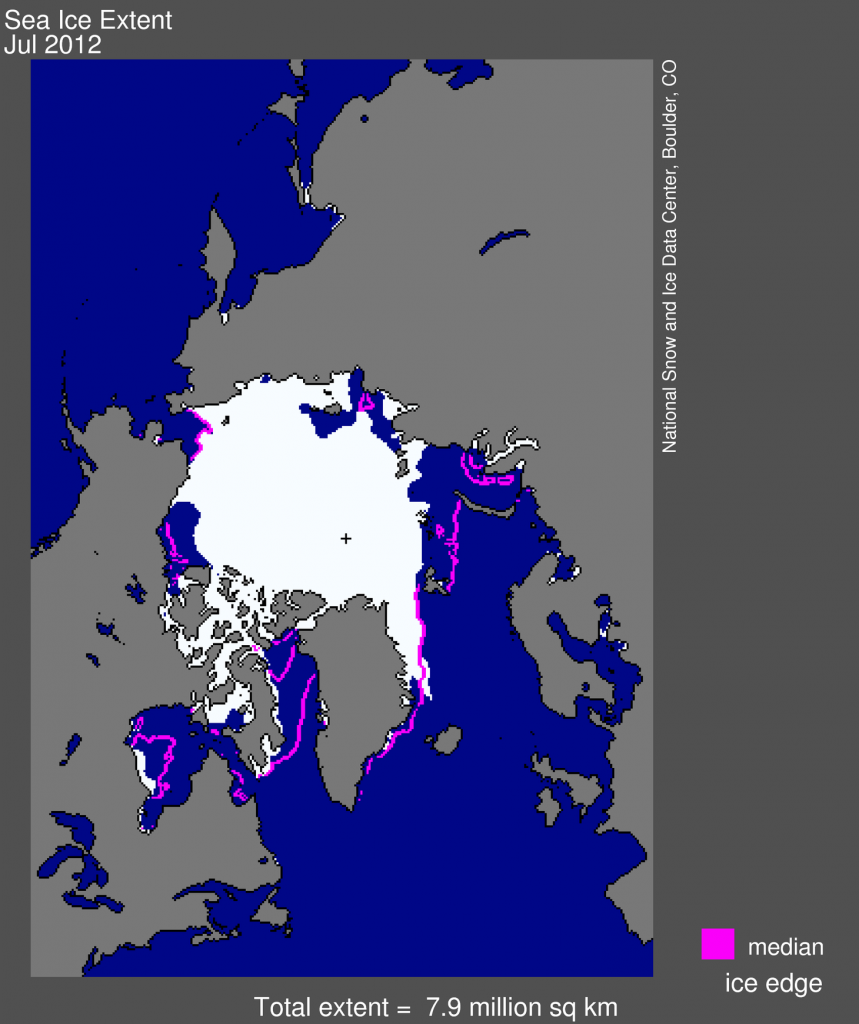
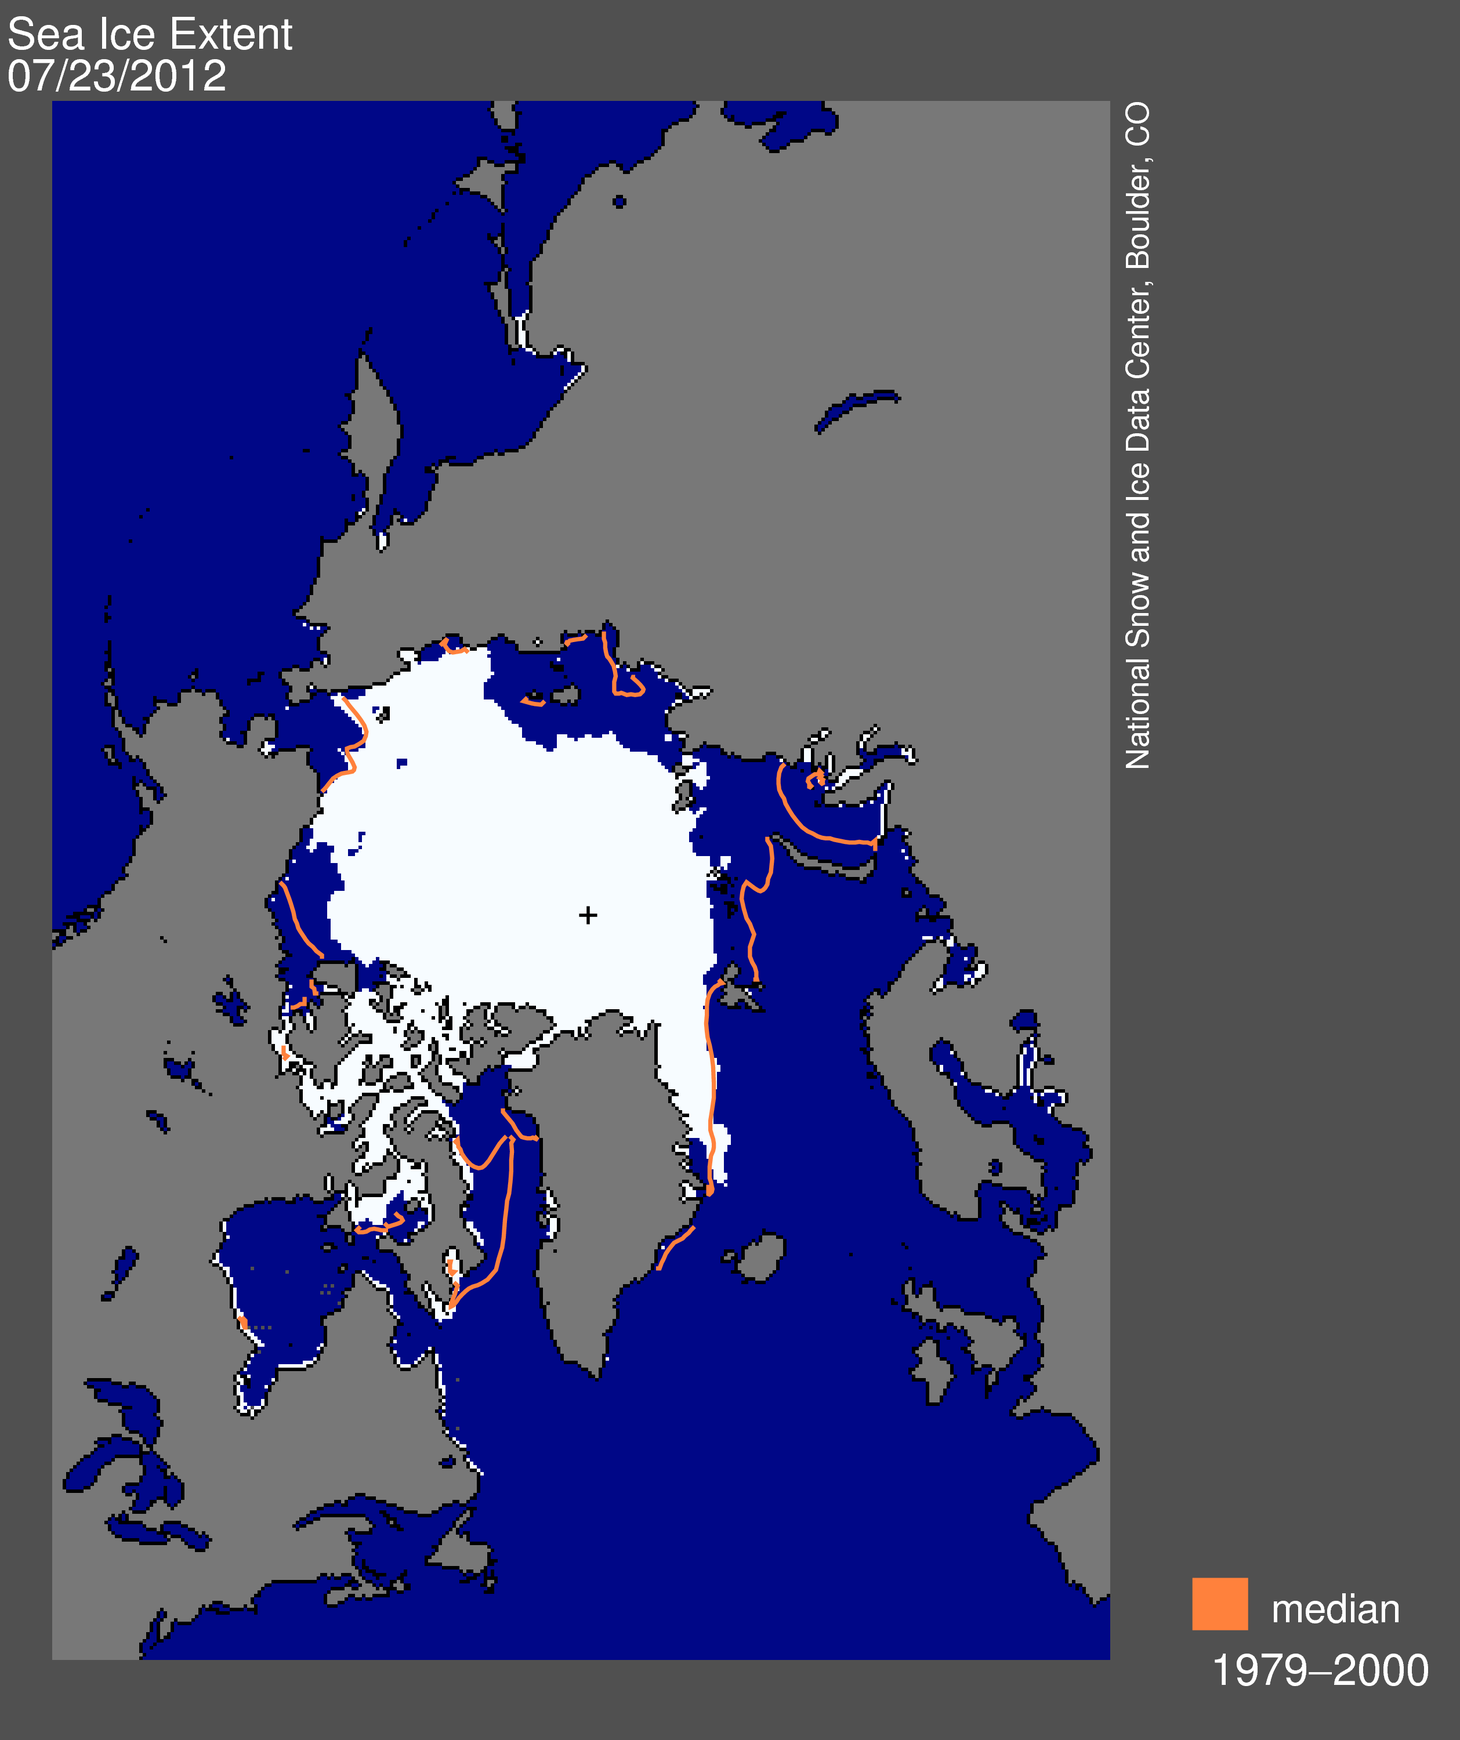
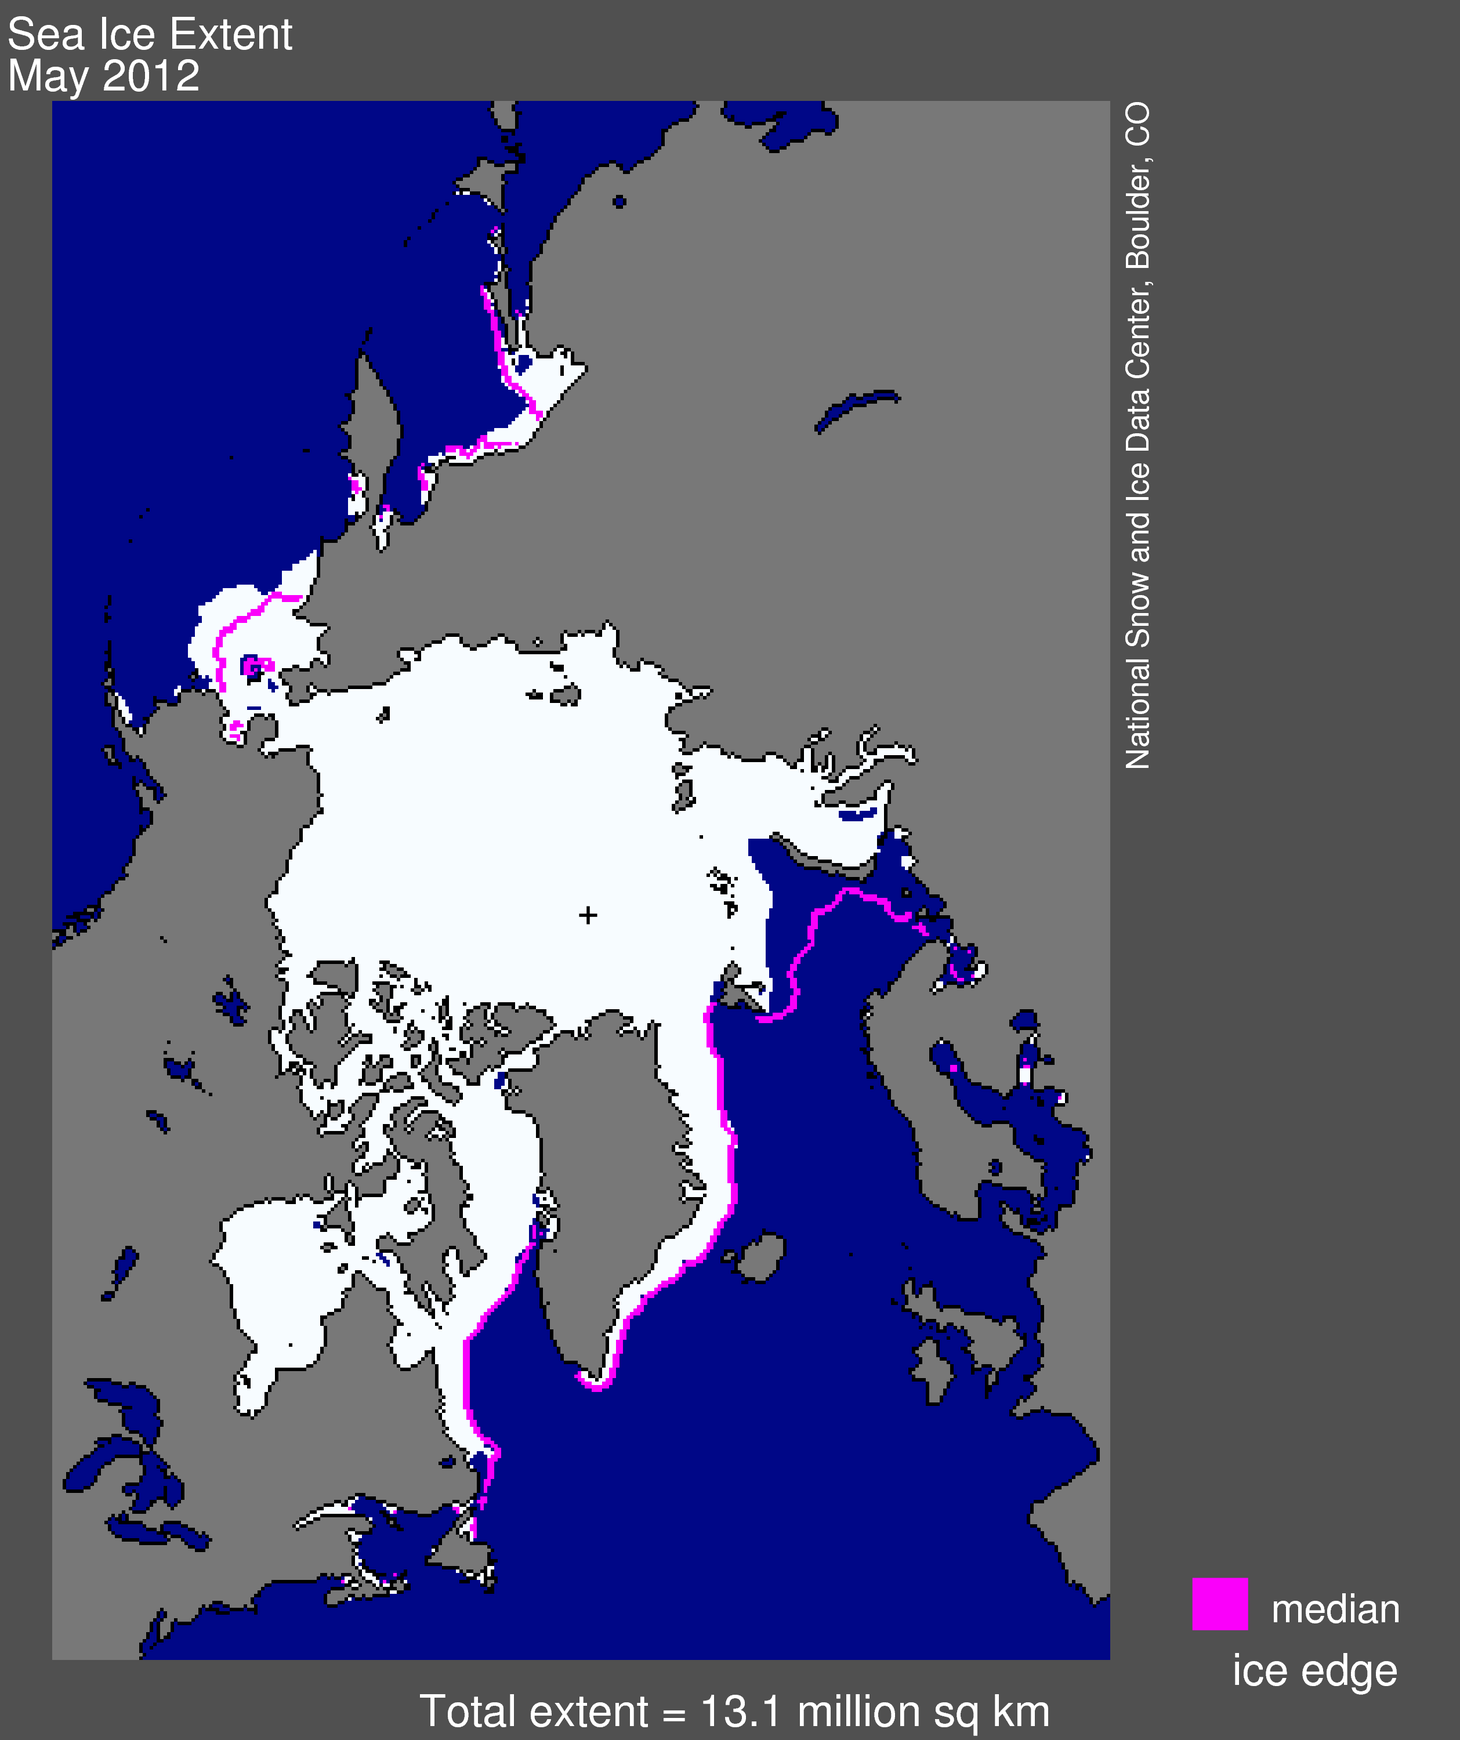
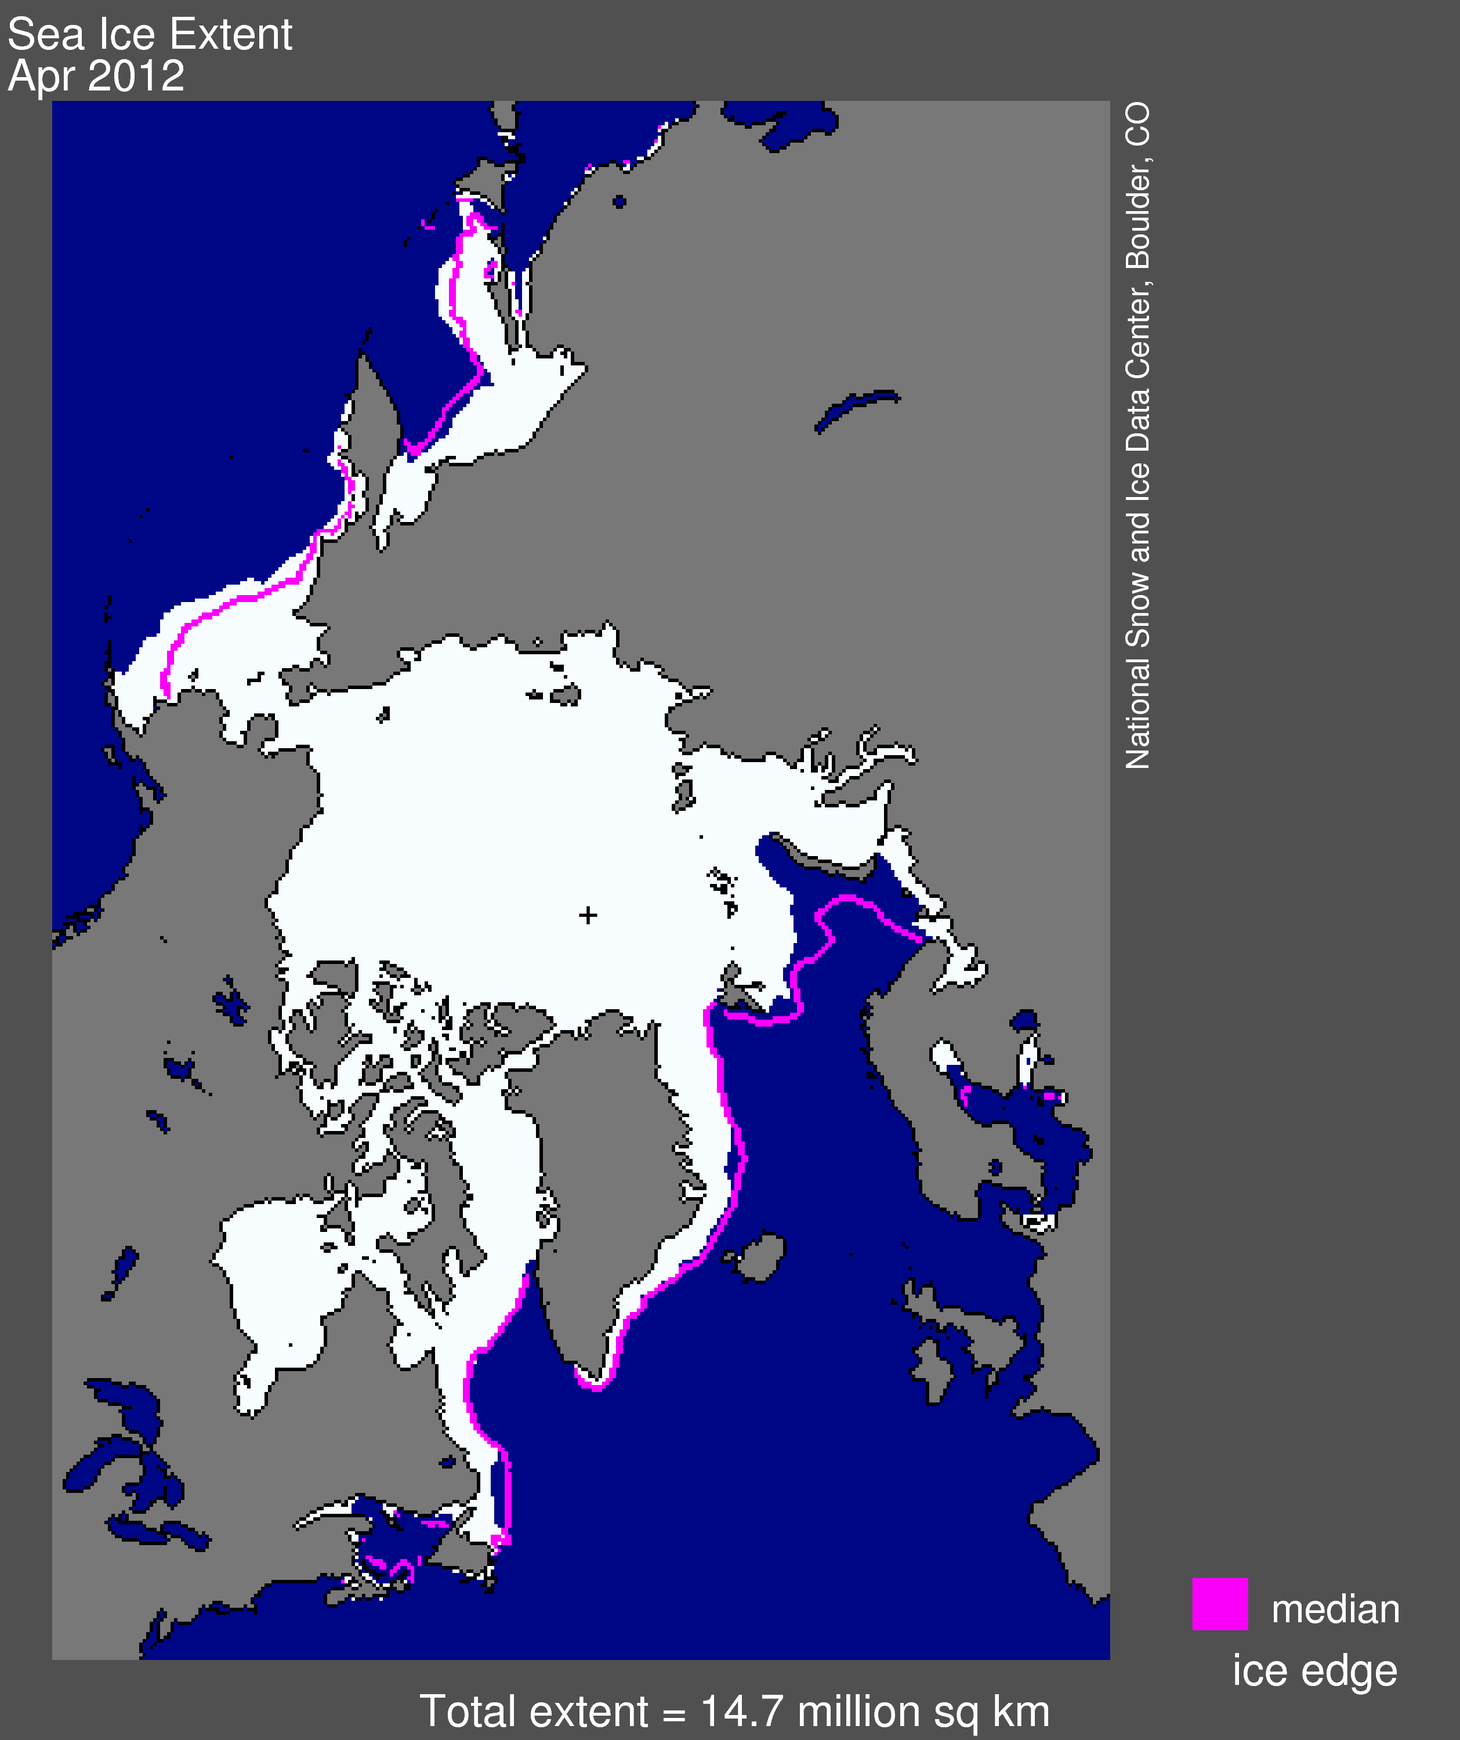
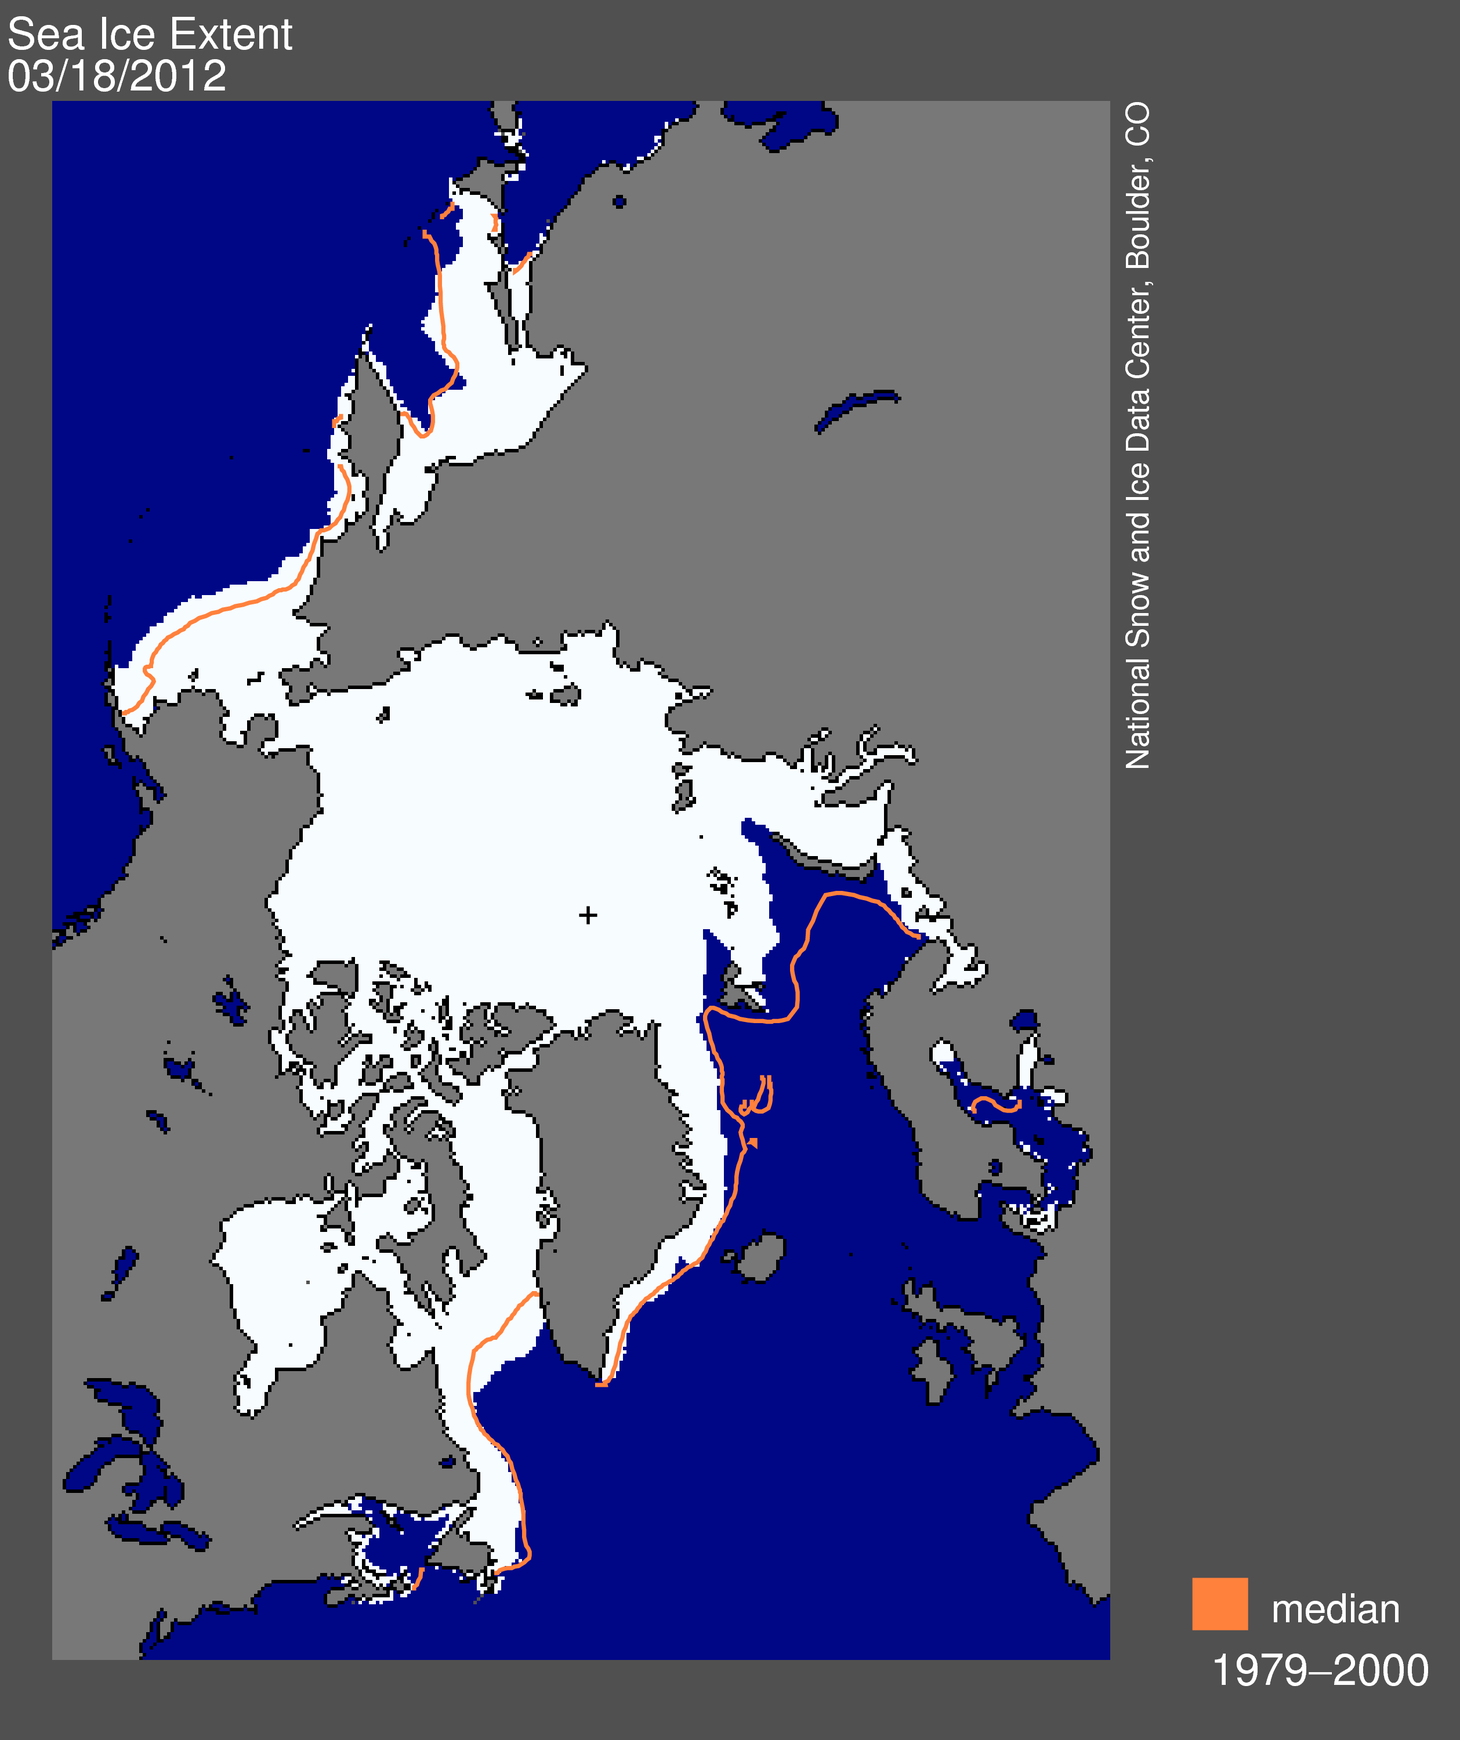
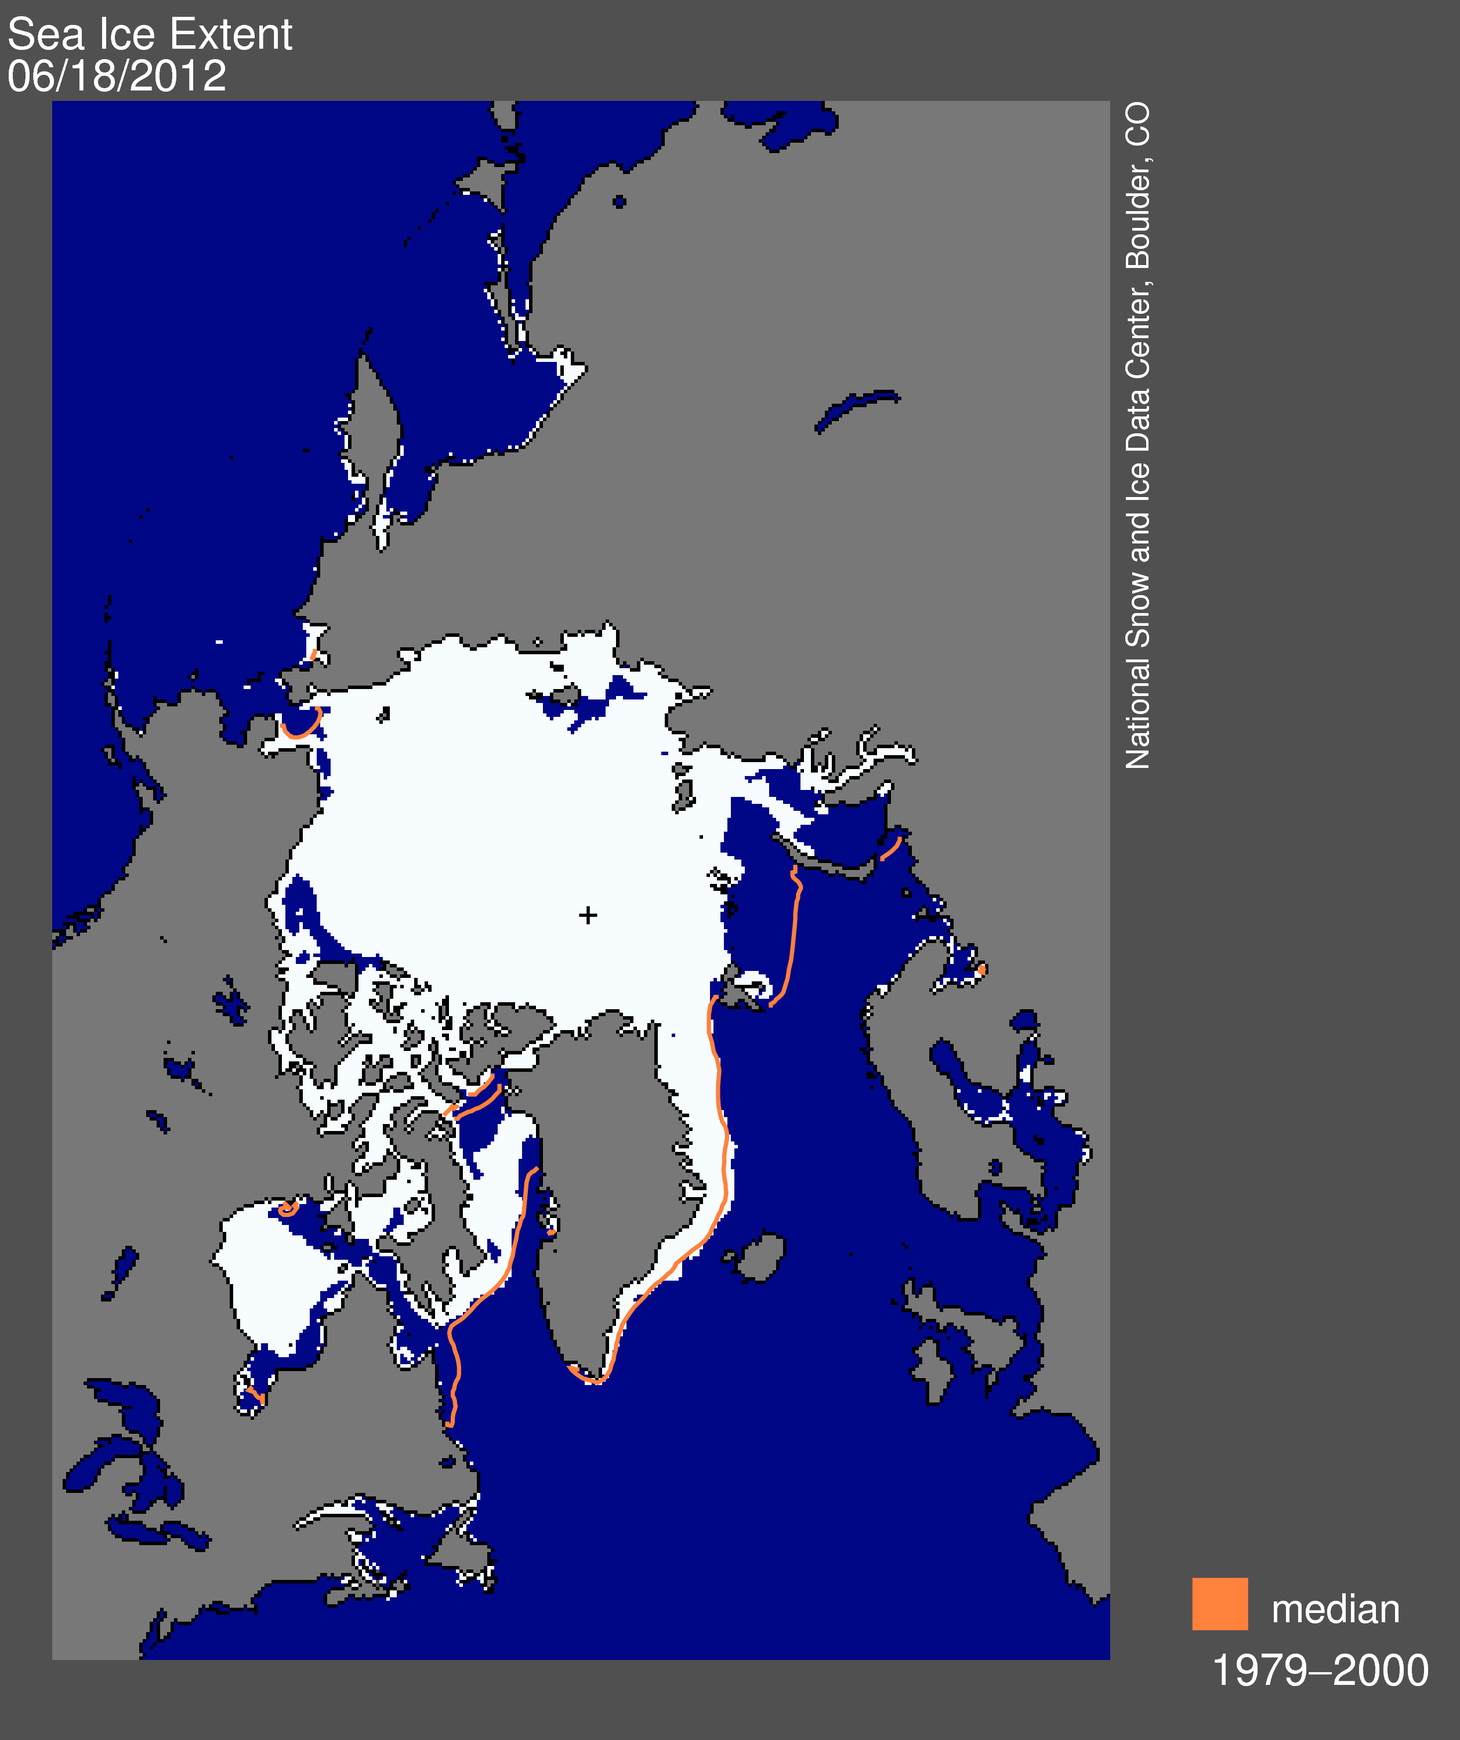
Figure 1. Arctic sea ice extent for August 13, 2012 was 5.09 million square kilometers (1.97 million square miles), 483,000 square kilometers (186,000 square miles) below the same day in 2007. The orange line shows the 1979 to 2000 median extent for that day. The black cross indicates the geographic North Pole. Sea Ice Index data. About the data

Credit: National Snow and Ice Data Center
High-resolution image

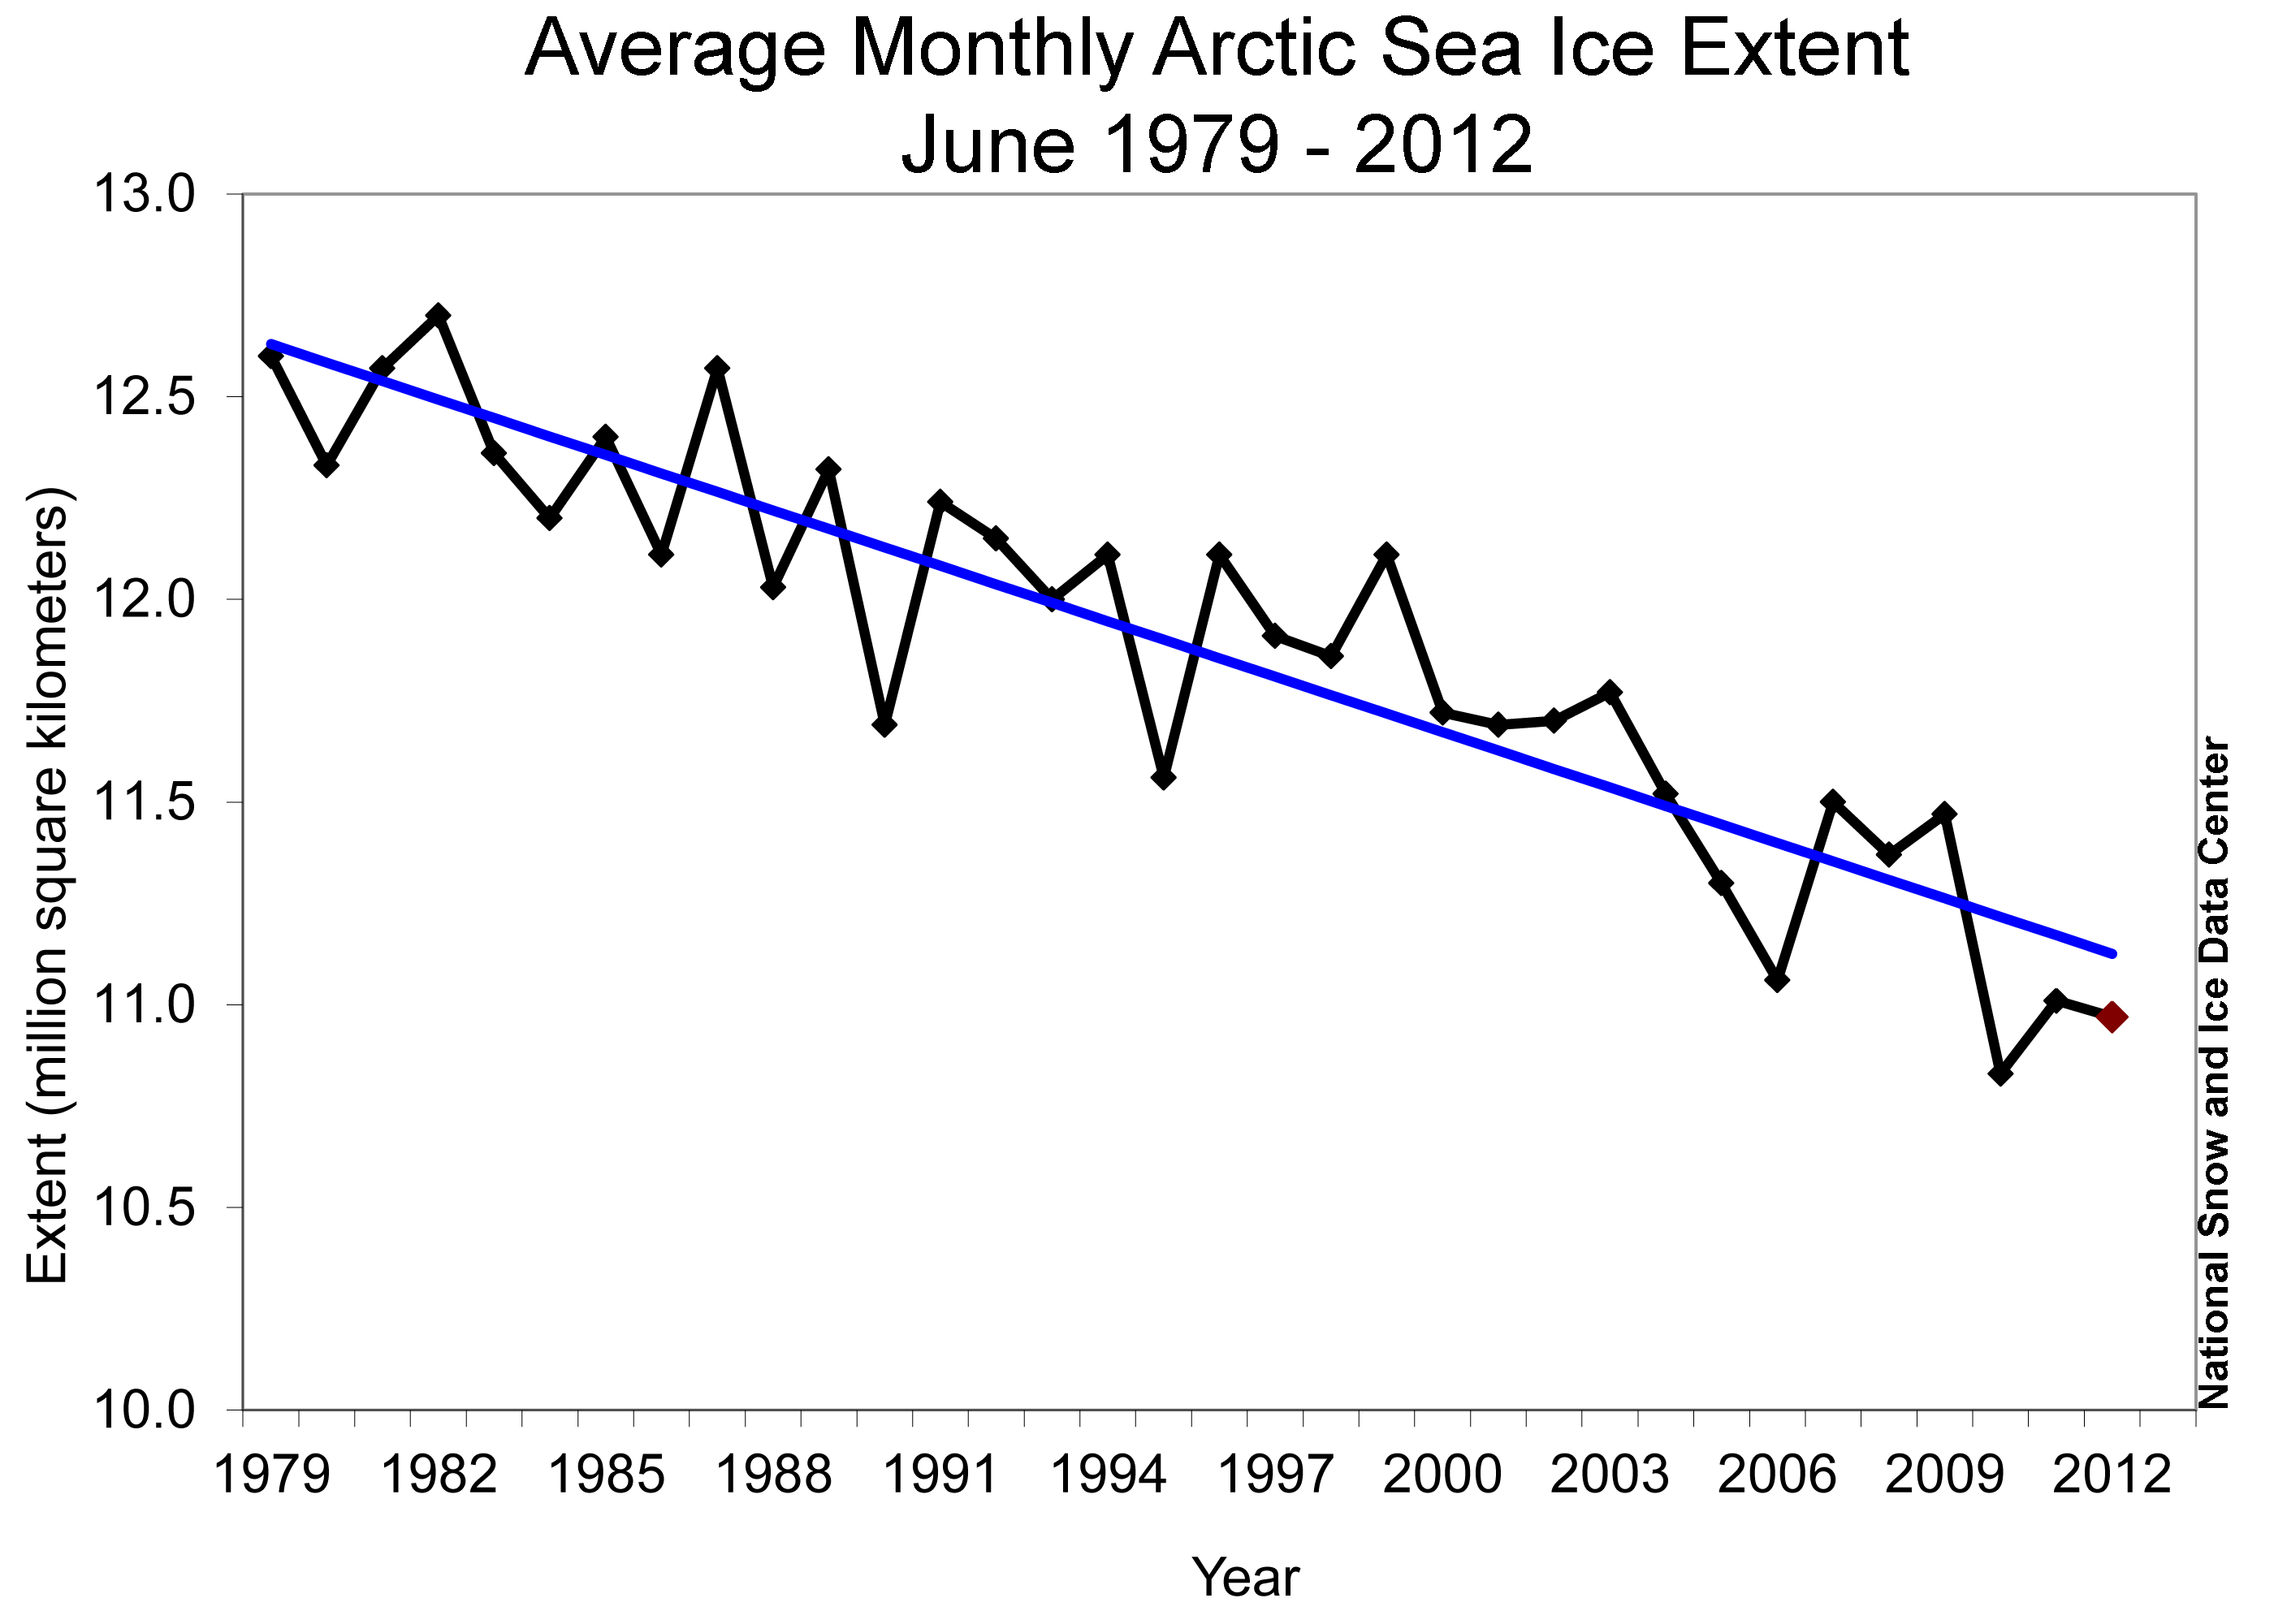
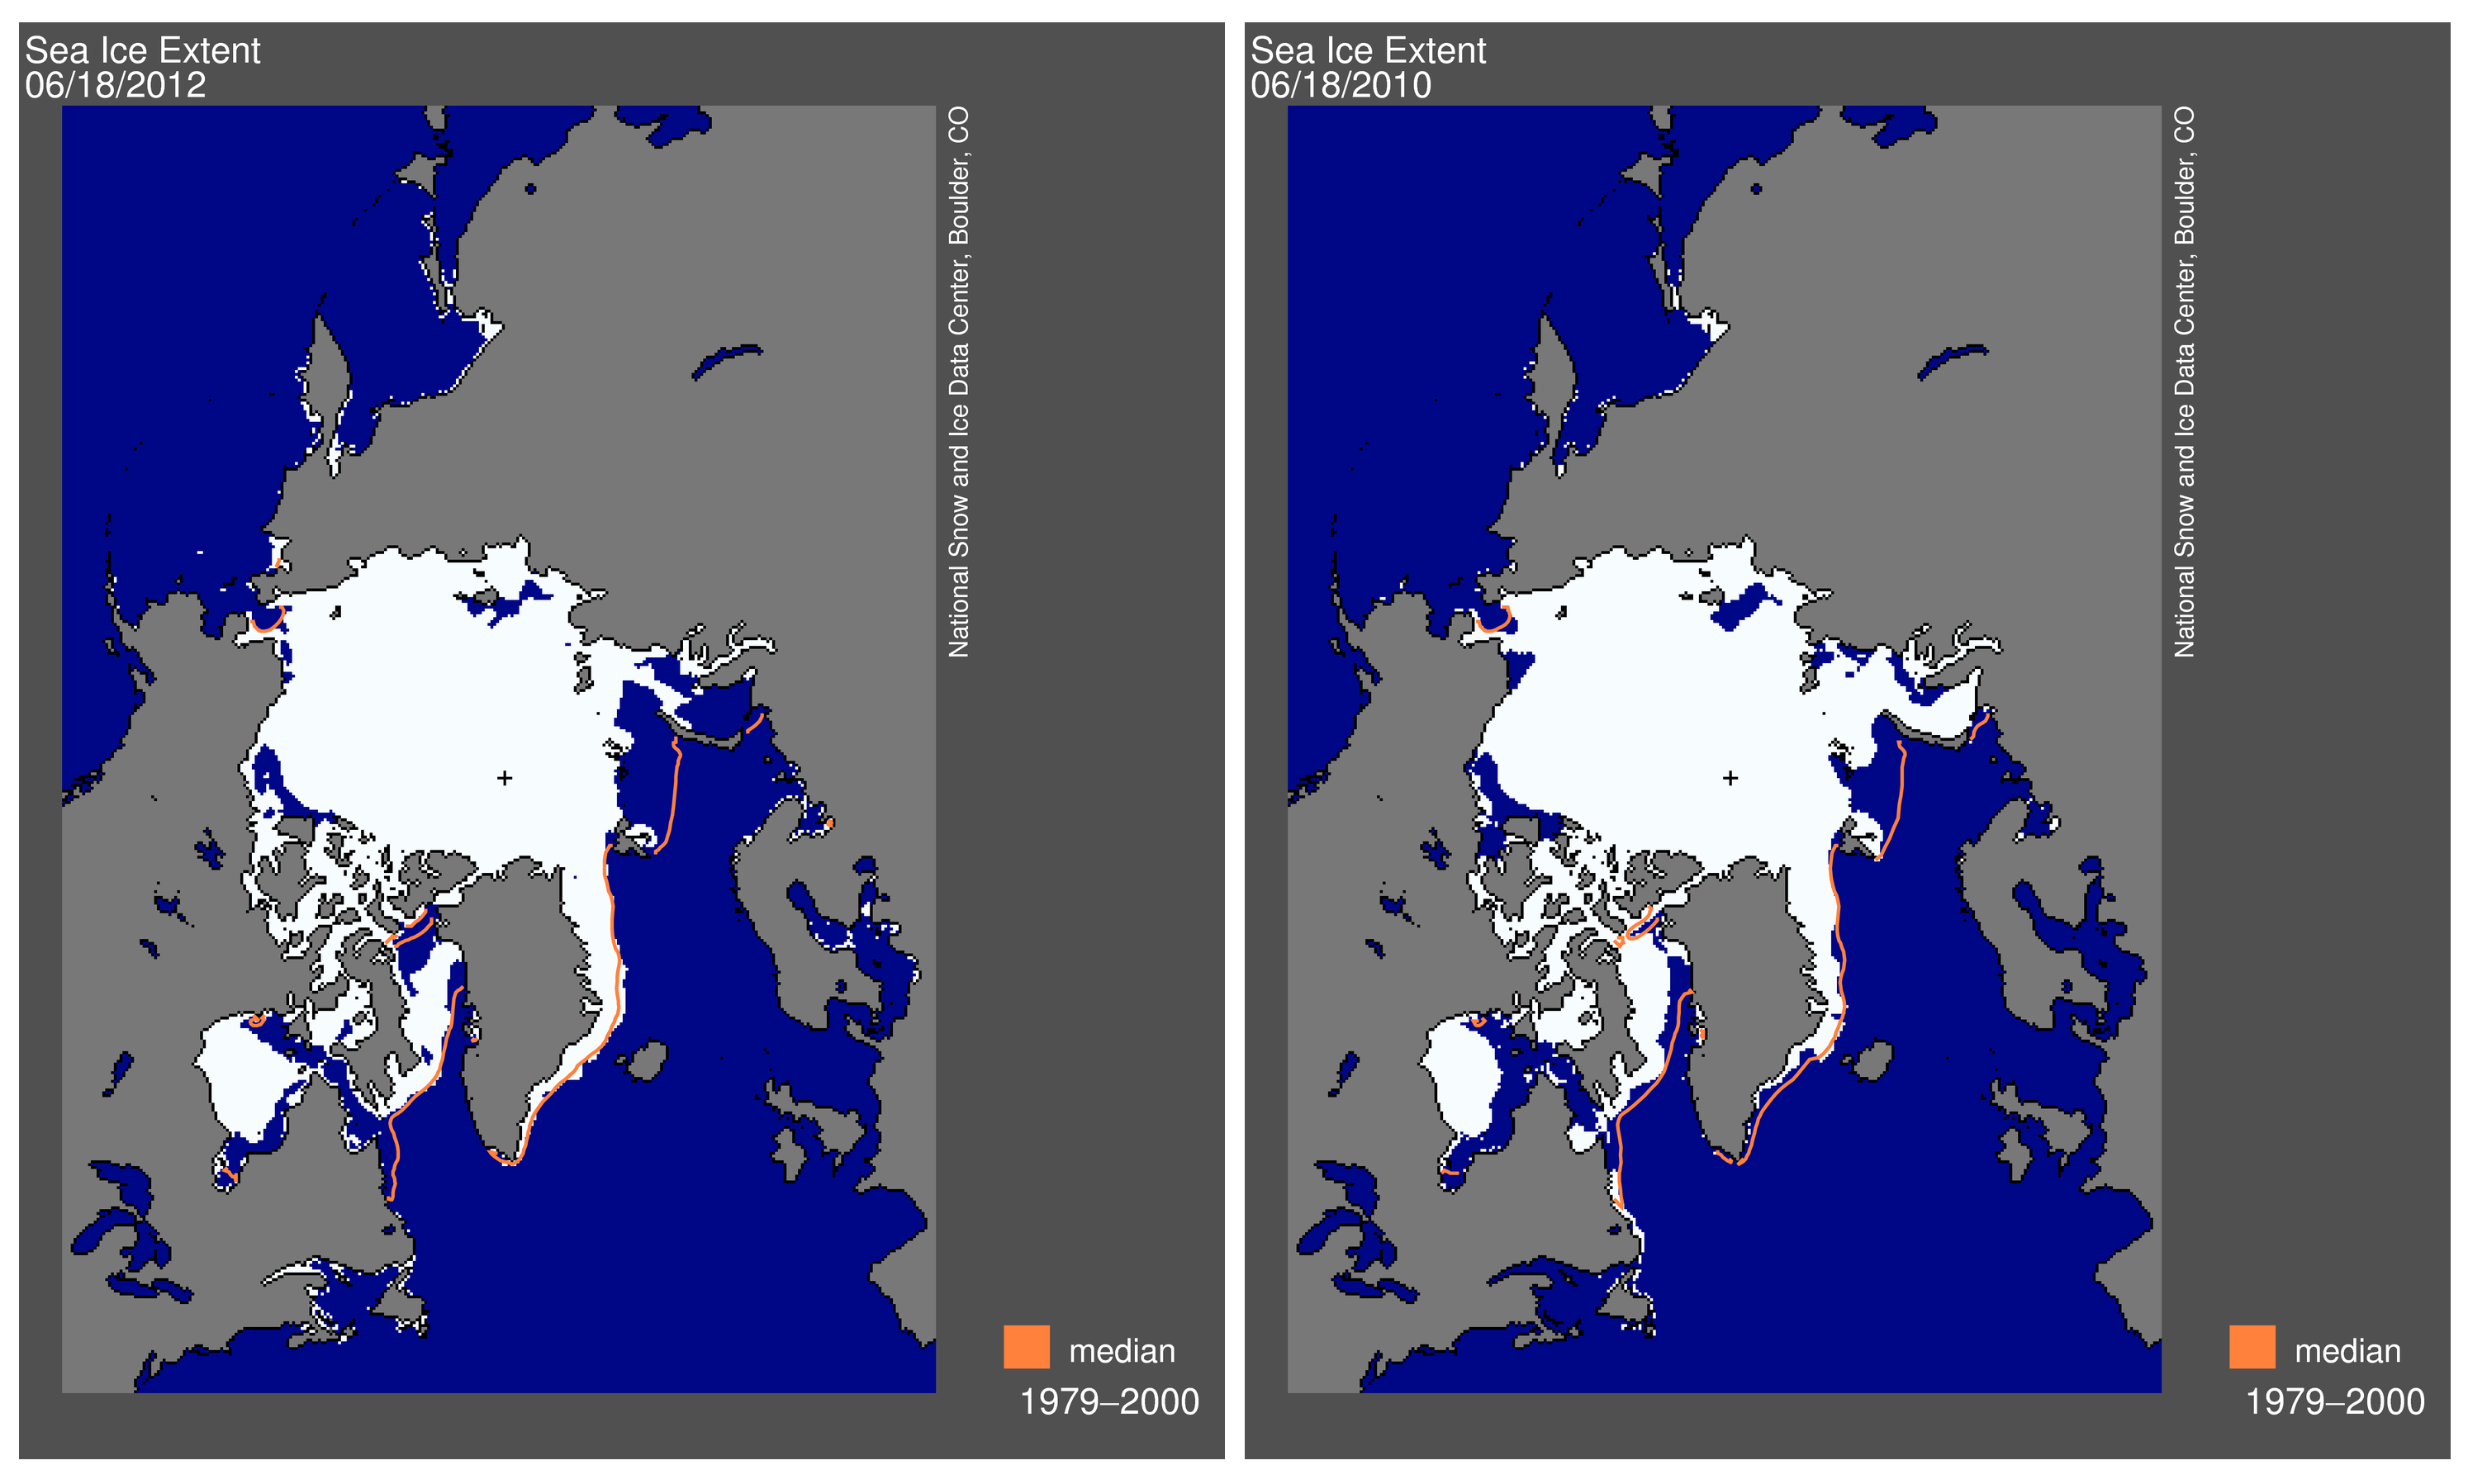
Arctic sea ice extent on August 13 was 5.09 million square kilometers (1.97 million square miles). This is 2.69 million square kilometers (1.04 million square miles) below the 1979 to 2000 average extent for the date, and is 483,000 square kilometers (186,000 square miles) below the previous record low for the date, which occurred in 2007. ( Note: The sea ice extent originally published on August 14, 2012 was the actual one-day value for August 13. We normally report the five-day trailing mean, so to be consistent we have updated the post with these numbers instead of the one-day value. See the Sea Ice Index Documentation for more information about the five-day trailing mean.) Low extent for the Arctic as a whole is driven by extensive open water on the Atlantic side of the Arctic, the Beaufort Sea, and—due to rapid ice loss over the past two weeks—the East Siberian Sea. Ice is near its normal (1979 to 2000) extent only off the northeastern Greenland coast. Ice near the coast in eastern Siberia continues to block sections of the Northern Sea Route. The western entrance to the Northwest Passage via McClure Strait remains blocked.

Conditions in context

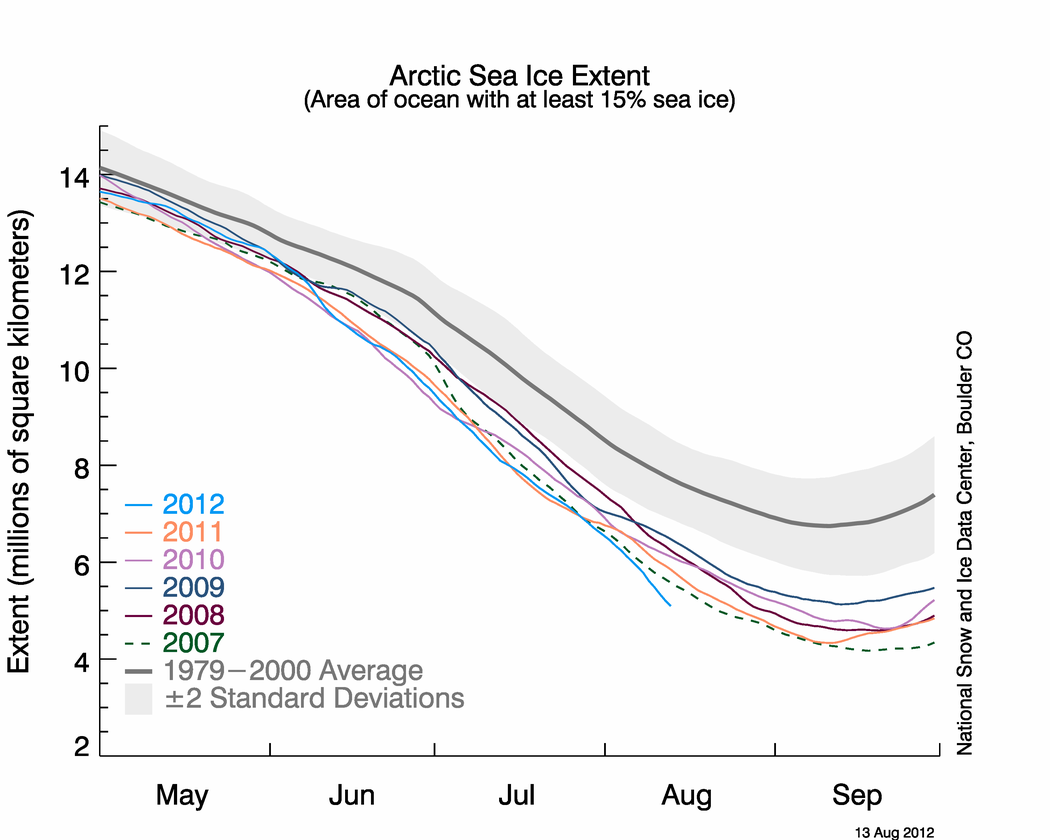
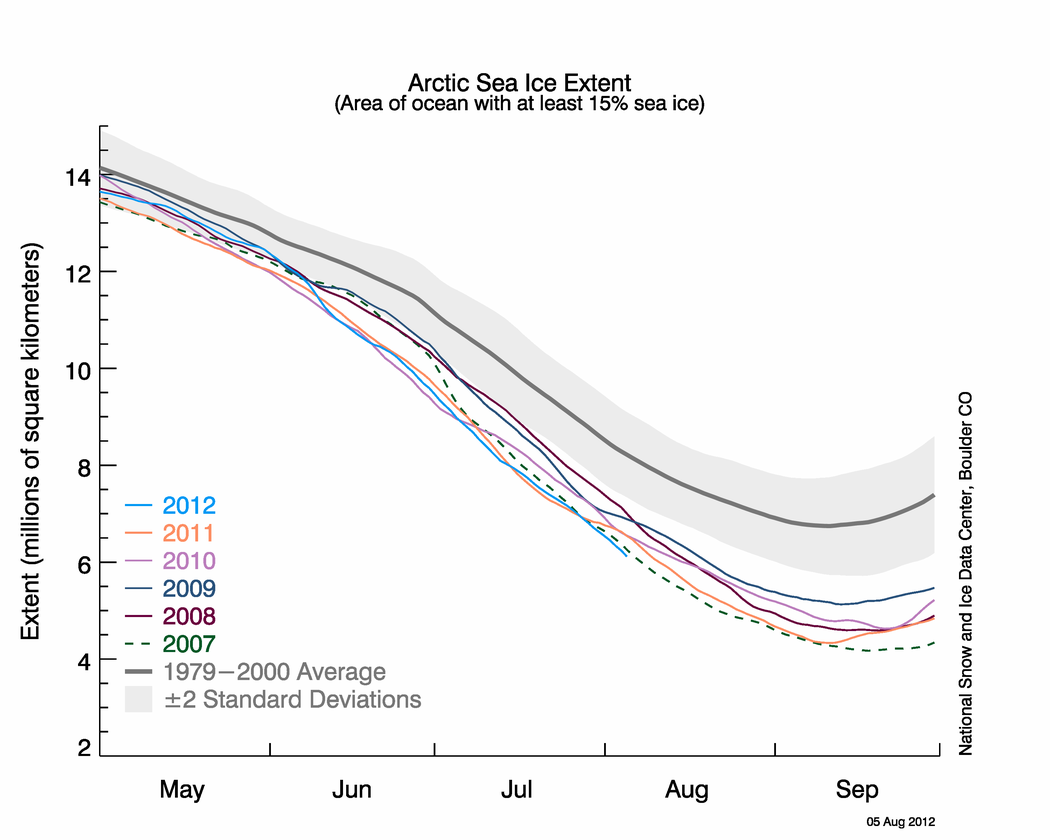
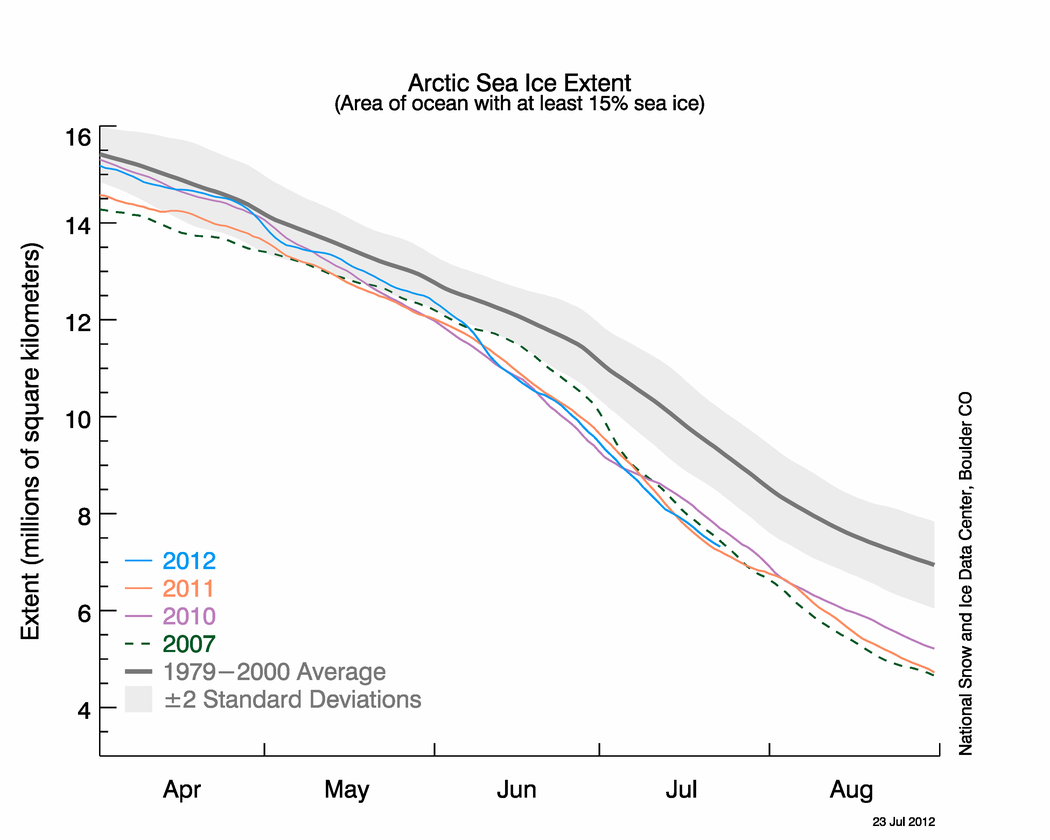
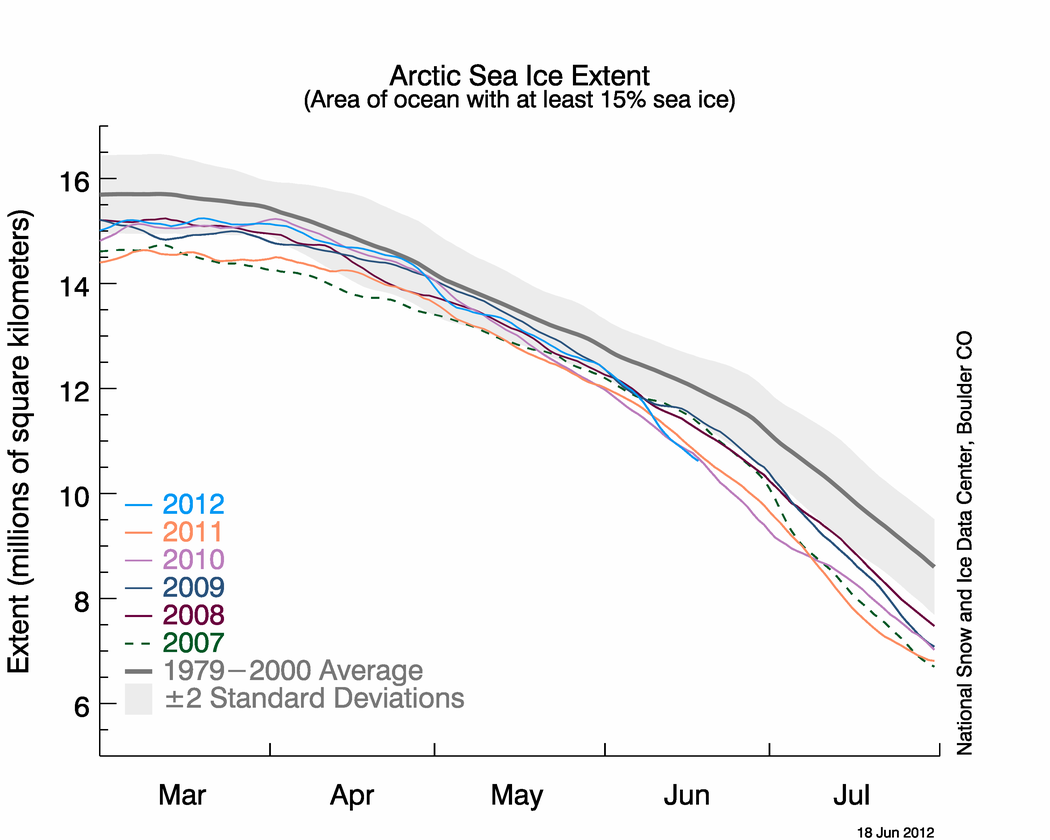
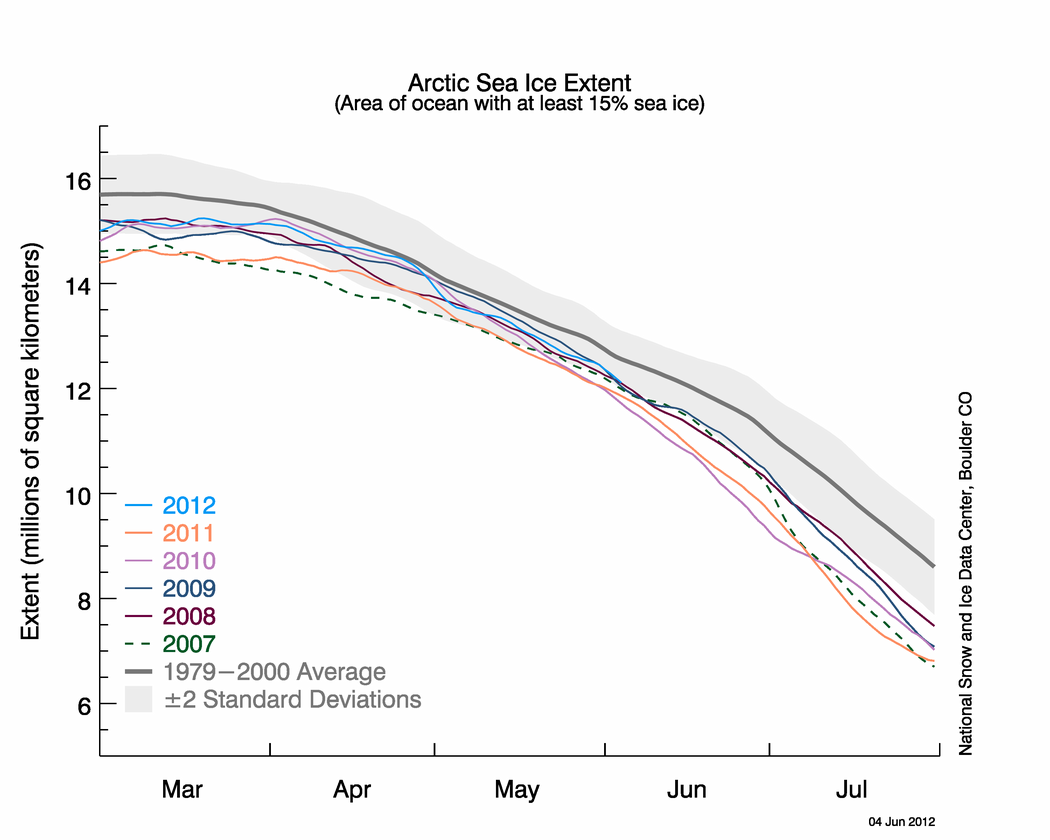
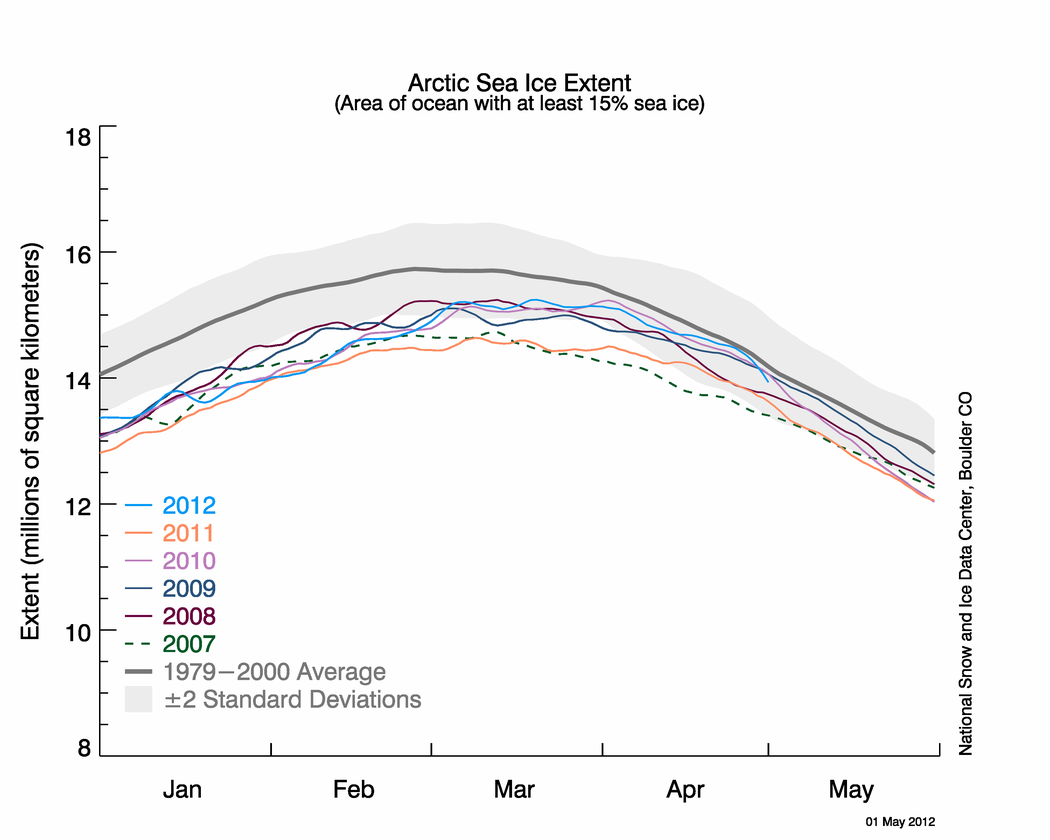
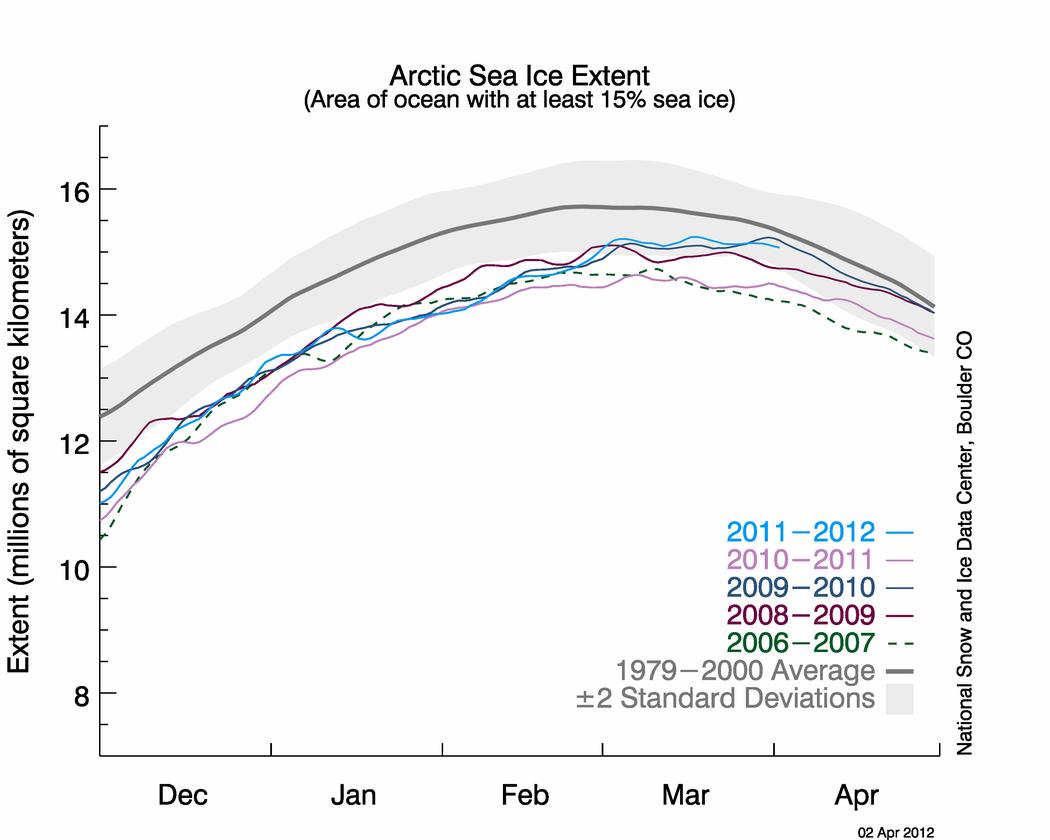
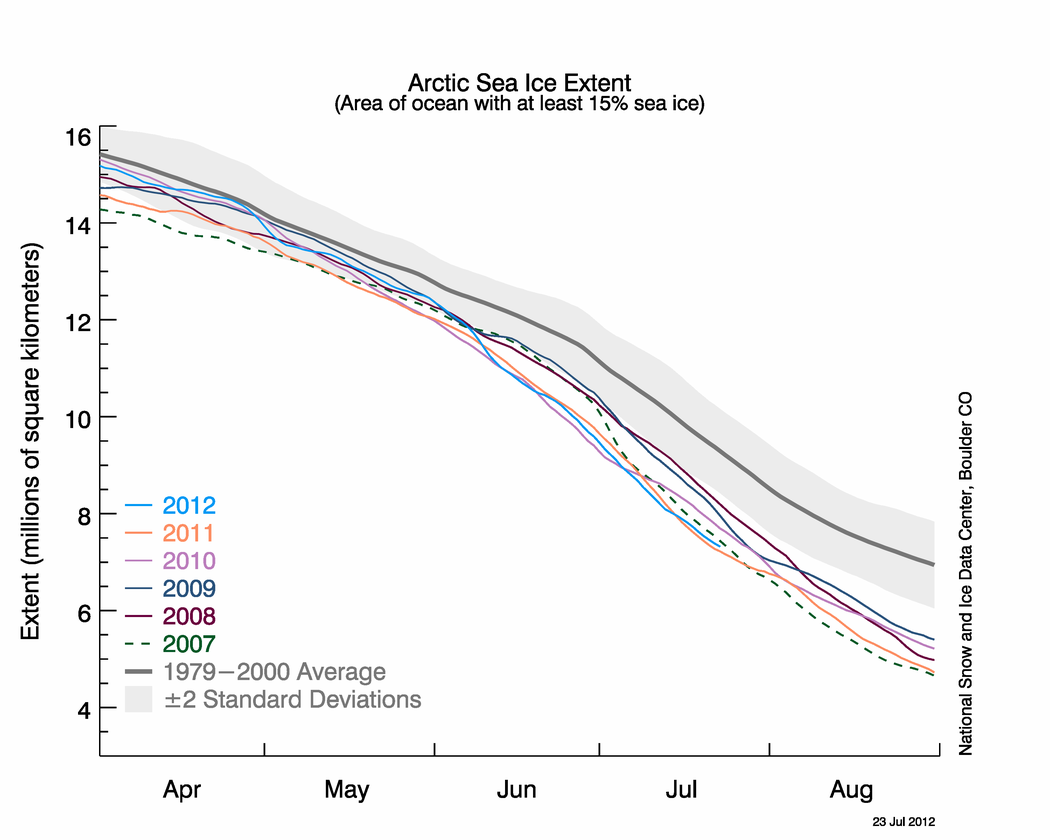
Figure 2. The graph above shows Arctic sea ice extent as of August 13, 2012, along with daily ice extent data for the previous five years. 2012 is shown in blue, 2011 in orange, 2010 in pink, 2009 in navy, 2008 in purple, and 2007 in green. The gray area around the average line shows the two standard deviation range of the data. Sea Ice Index data.

Credit: National Snow and Ice Data Center
High-resolution image

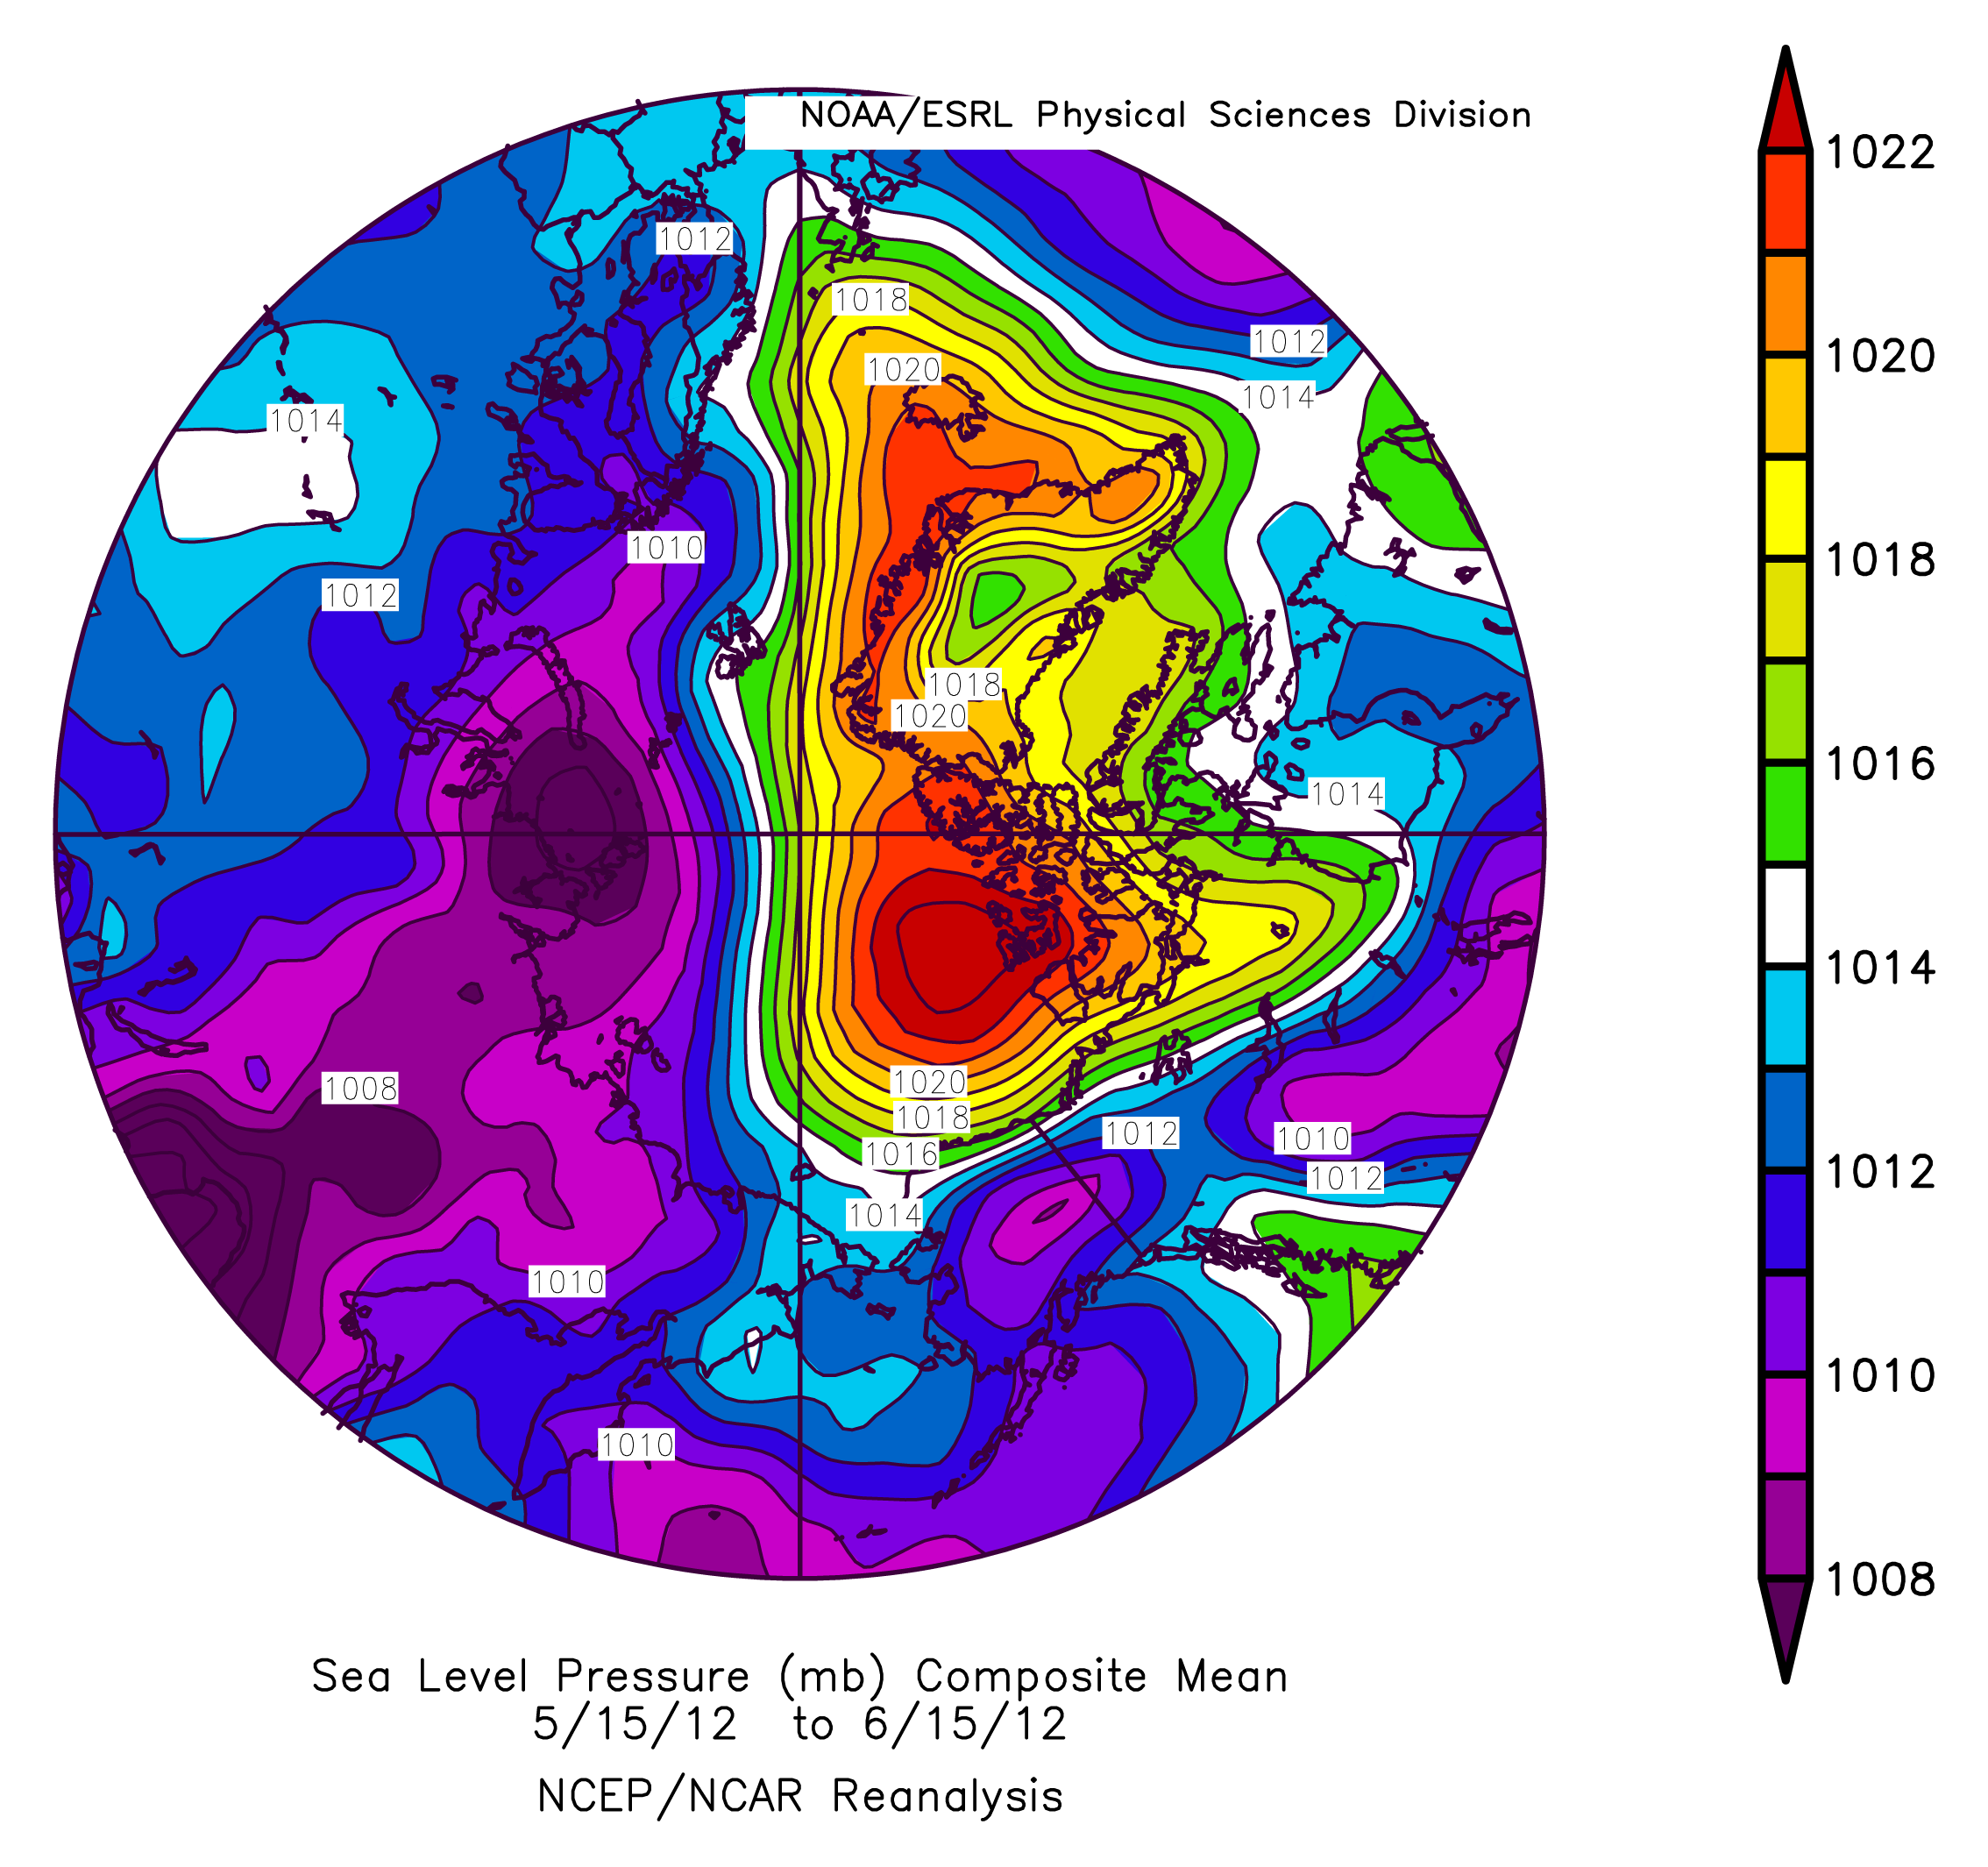
The average pace of ice loss since late June has been rapid at just over 100,000 square kilometers (38,000 square miles) per day. However, this pace nearly doubled for a few days in early August during a major Arctic cyclonic storm, discussed below. Unlike the summer of 2007 when a persistent pattern of high pressure was present over the central Arctic Ocean and a pattern of low pressure was over the northern Eurasian coast, the summer of 2012 has been characterized by variable conditions. Air tempertures at the 925 hPa level (about 3000 feet above the ocean surface) of 1 to 3 degrees Celsius (1.8 to 5.4 degrees Fahrenheit) above the 1981 to 2012 average have been the rule from central Greenland, northern Canada, and Alaska northward into the central Arctic Ocean. Cooler than average conditions (1 to 2 degrees Celsius or 1.8 to 3.6 degrees Fahrenheit) were observed in a small region of eastern Siberia extending into the East Siberian Sea, helping explain the persistence of low concentration ice in this region through early August.

The Great Arctic Cyclone of 2012

Figure 3. This subsection of the surface weather analysis from the Canadian Meteorological Centre for August 6, 2012 (at 0600 Greenwich Mean Time) shows a very strong cyclone over the central Arctic Ocean north of Alaska. The isobars (lines of equal pressure) are very tightly packed around the low pressure system, indicating strong winds. Greenland is on the right side of the figure while Canada is at the bottom.

Credit: Canadian Meteorological Centre
High-resolution image

A low pressure system entered the Arctic Ocean from the eastern Siberian coast on August 4 and then strengthened rapidly over the central Arctic Ocean. On August 6 the central pressure of the cyclone reached 964 hPa, an extremely low value for this region. It persisted over the central Arctic Ocean over the next several days, and slowly dissipated. The storm initially brought warm and very windy conditions to the Chukchi and East Siberian seas (August 5), but low temperatures prevailed later.

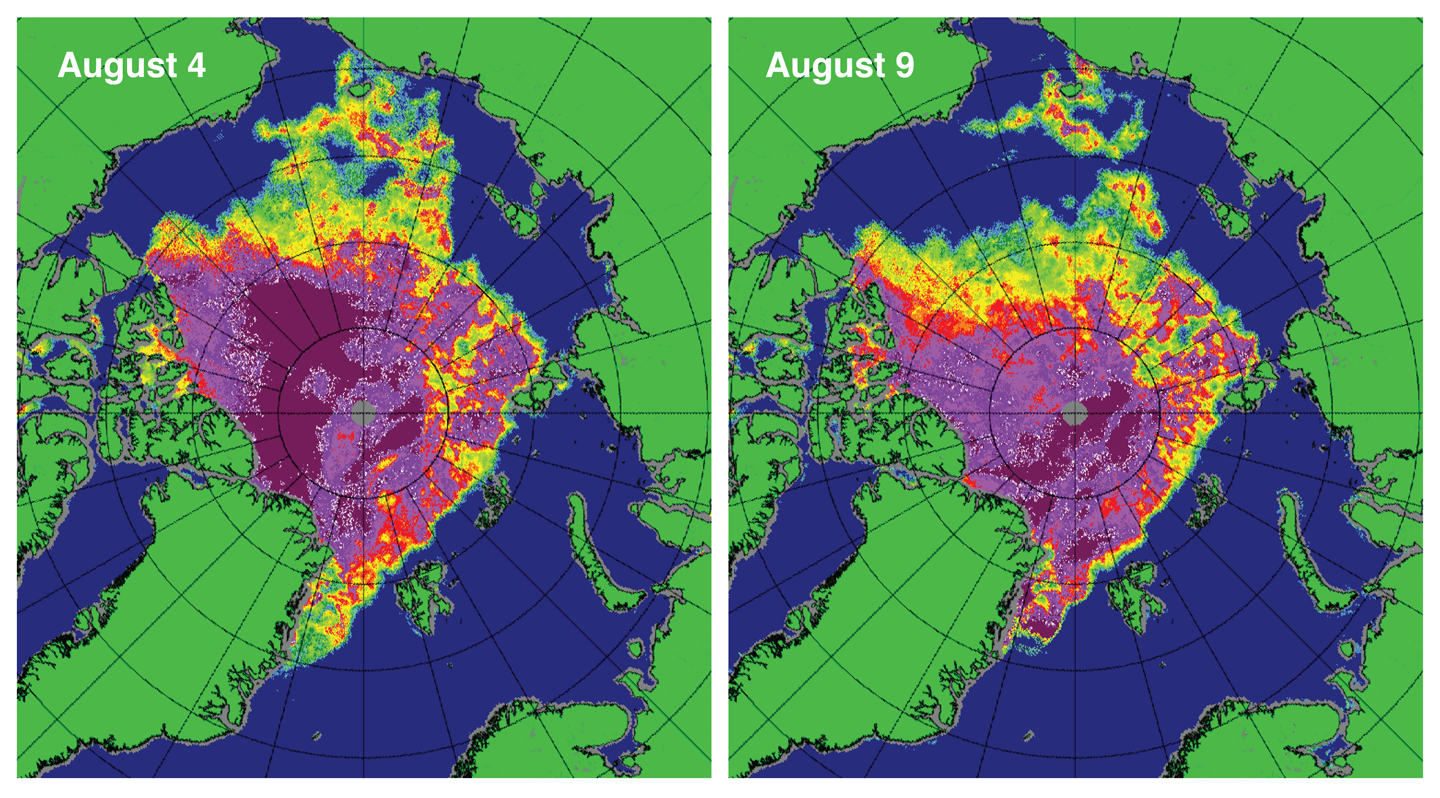
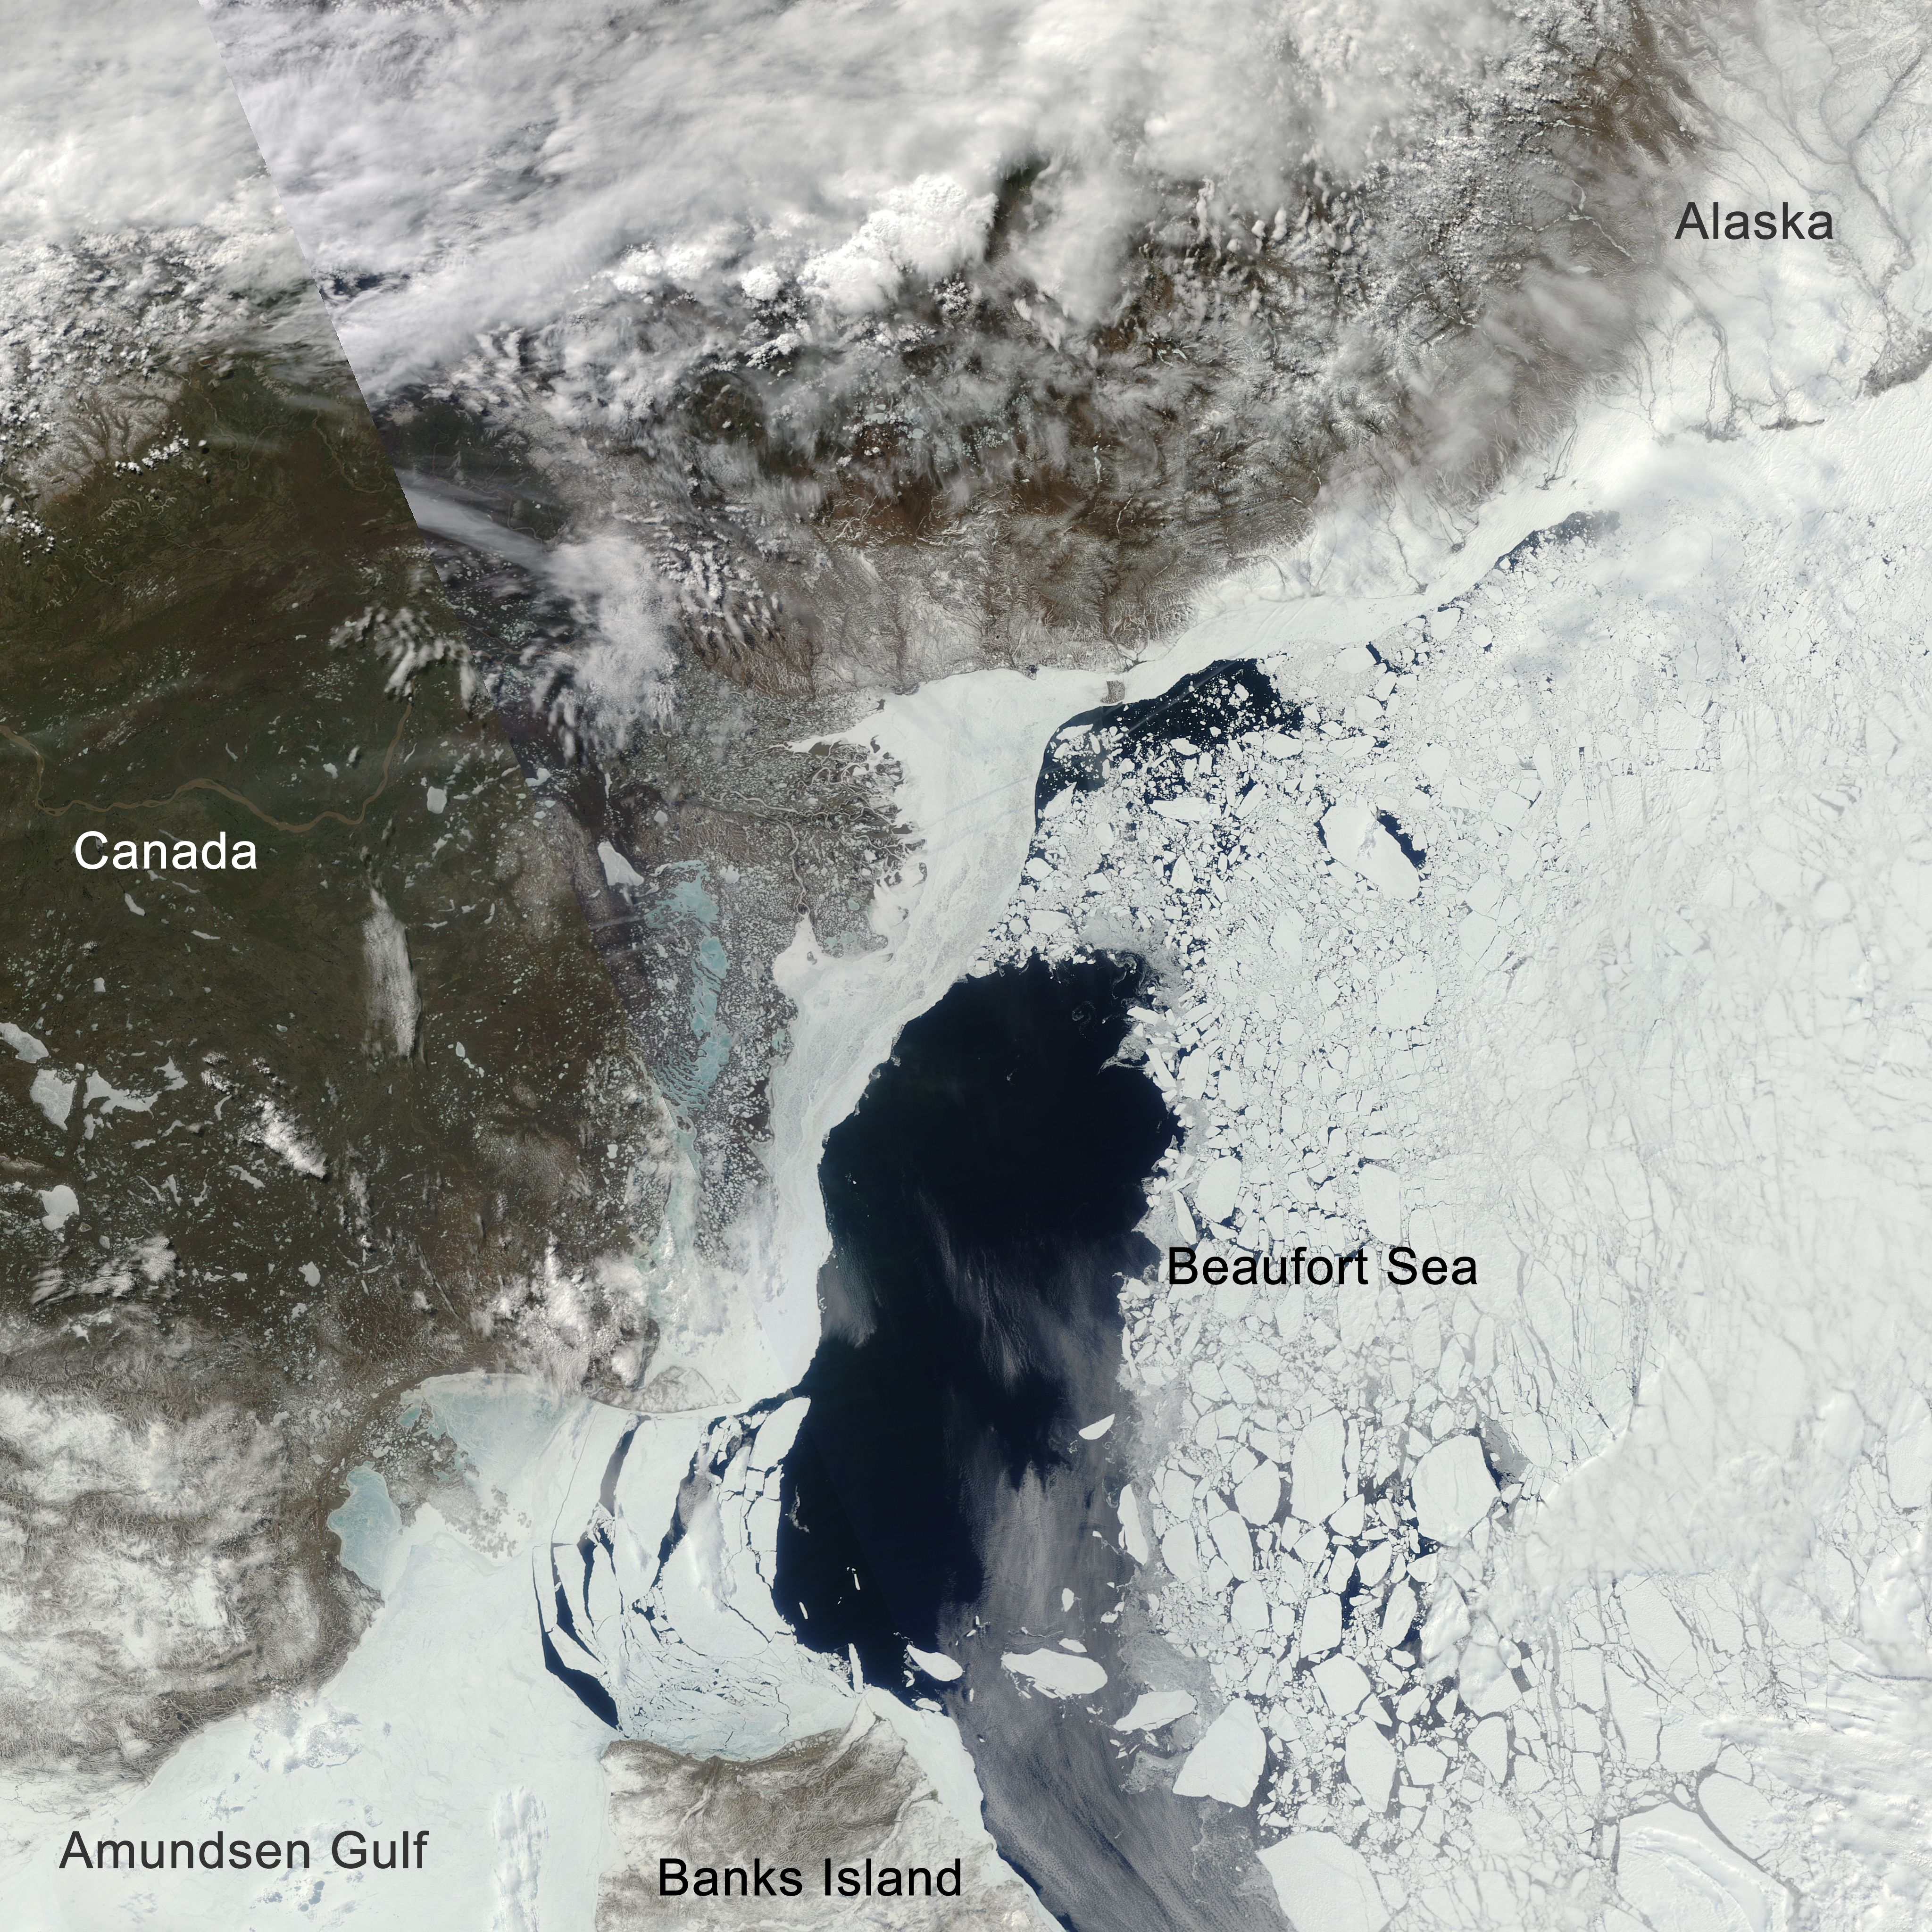
Figure 4. These maps of sea ice concentration from the Special Sensor Microwave Imager/Sounder (SSMIS) passive microwave sensor highlight the very rapid loss of ice in the western Arctic (northwest of Alaska) during the strong Arctic storm. Magenta and purple colors indicate ice concentration near 100%; yellow, green, and pale blue indicate 60% to 20% ice concentration.

Credit: National Snow and Ice Data Center courtesy IUP Bremen
High-resolution image

Low pressure systems over the Arctic Ocean tend to cause the ice to diverge or spread out and cover a larger area. These storms often bring cool conditions and even snowfall. In contrast, high pressure systems over the Arctic cause the sea ice to converge. Summers dominated by low pressure systems over the central Arctic Ocean tend to end up with greater ice extent than summers dominated by high pressure systems.

However, the effects of an individual strong storm, like that observed in early August, can be complex. While much of the region influenced by the August cyclone experienced a sudden drop in temperature, areas influenced by winds from the south experienced a rise in temperature. Coincident with the storm, a large area of low concentration ice in the East Siberian Sea (concentrations typically below 50%) rapidly melted out. On three consecutive days (August 7, 8, and 9), sea ice extent dropped by nearly 200,000 square kilometers (77,220 square miles). This could be due to mechanical break up of the ice and increased melting by strong winds and wave action during the storm. However, it may be simply a coincidence of timing, given that the low concentration ice in the region was already poised to rapidly melt out.

Further Reading

Long, Z. and W. Perrie. 2012. Air-sea interactions during an Arctic storm. Journal of Geophysical Research, 117, D15103, doi:10.1029/2011JD016985.

Screen, J. A., I. Simmonds, and K. Keay. 2011. Dramatic interannual changes of perennial Arctic sea ice linked to abnormal summer storm activity. Journal of Geophysical Research, 116, D15105, doi:10.1029/2011JD015847.

Serreze, M. C. and A. P. Barrett. 2008. The summer cyclone maximum over the central Arctic Ocean. Journal of Climate, 21, doi:10.1175/2007JCLI1810.1.

A most interesting Arctic summer

Arctic sea ice extent declined quickly in July, continuing the pattern seen in June. On August 1, ice extent was just below levels recorded for the same date in 2007, the year that saw the record minimum ice extent in September. Low sea ice concentrations are present over large parts of the western Arctic Ocean. Warm conditions dominated the weather for most of the Arctic Ocean and surrounding lands. For a brief period in early July, nearly all of the Greenland ice sheet experienced surface melt, a rare event.

Overview of conditions

Sea ice image for July 2012

Figure 1. Arctic sea ice extent for July 2012 was 7.94 million square kilometers (3.07 million square miles). The magenta line shows the 1979 to 2000 median extent for that month. The black cross indicates the geographic North Pole. Sea Ice Index data. About the data

Credit: National Snow and Ice Data Center
High-resolution image

Arctic sea ice extent for July 2012 averaged 7.94 million square kilometers (3.07 million square miles). This was 2.12 million square kilometers (819,000 square miles) below the 1979 to 2000 average extent. July 2012 ice extent was 20,000 square kilometers (7,700 square miles) above the 2011 record July low.

As throughout the summer, the low ice extent for the Arctic as a whole is primarily due to extensive open water on the Atlantic side of the Arctic (Kara, Laptev and East Siberian seas) and the Beaufort Sea. By August 1, open water in the Laptev Sea, along the Siberian coast, had reached nearly 80oN latitude. Ice extent remains near average in the Chukchi Sea, and ice continues to block sections of the both the Northern Sea Route and the Northwest Passage. The ice extent recorded for August 1 of 6.53 million square kilometers (2.52 million square kilometers) is the lowest in the satellite record. The previous record for the same date was set in 2007 at 6.64 million square kilometers (2.56 million square miles), when the current record low September ice extent was set.

Conditions in context

Figure 2. The graph above shows Arctic sea ice extent as of August 5, 2012, along with daily ice extent data for the 2011 and for 2007, the record low year. 2012 is shown in blue, 2011 in orange, and 2007 in green. The gray area around the average line shows the two standard deviation range of the data. Sea Ice Index data.

Credit: National Snow and Ice Data Center
High-resolution image

In July, the Arctic lost a total of 2.97 million square kilometers (1.15 million square miles) of ice. The largest July total loss, 3.53 million square kilometers (1.36 million square miles) occurred in the year 2007. Warm conditions prevailed over most of the Arctic Ocean; temperatures at the 925 hPa level (about 3,000 feet above the ocean surface) were typically 1 to 3 degrees Celsius (1.8 to 5.4 degrees Fahrenheit) above the 1981 to 2010 average over the Beaufort Sea and regions to the north, as well as over Baffin Bay. By contrast, temperatures were 1 to 3 degrees Celsius below average over the Norwegian Sea. Weather patterns over the Arctic Ocean varied substantially through the month, as they have done throughout the melt season.

July 2012 compared to recent years

Graph of sea ice extent trend

Figure 3. Monthly July ice extent for 1979 to 2012 shows a decline of 7.1% per decade.

Credit: National Snow and Ice Data Center
High-resolution image

Arctic sea ice extent for July 2012 was the second lowest in the satellite record, behind 2011. Through 2012, the linear rate of decline for July Arctic ice extent over the satellite record is 7.1% per decade.

MODIS data shows low concentration ice

MODIS image of sea ice

Figure 4. This image from the Moderate Resolution Imaging Spectroradiometer (MODIS), taken in late July, shows areas of low concentration sea ice in the Beaufort Sea, north of Alaska. Barrow, Alaska is at the top left. The resolution is 500 meters. The cloud band covering much of the lower right part of the image is associated with an approaching storm.

Credit: NASA Goddard Space Flight Center, Rapid Response
High-resolution image

In our last post (July 24, 2012) we commented on large areas of low ice concentration depicted in Special Sensor Microwave Imager/Sounder (SSMIS) data in the Beaufort and Chukchi seas, the Canadian Archipelago, the East Greenland Sea, and north of Siberia. These areas of low ice concentration ice can be seen clearly in visible-band data collected by the Moderate Resolution Imaging Spectroradiometer (MODIS) aboard NASA’s Aqua and Terra satellites.

The MODIS image shows polygonal floes of multi-year ice, as well as thin, gray first-year ice, and dark open water in the Beaufort Sea, north of Alaska. Most of these areas of low concentration ice will likely melt over the next month. Because MODIS senses light reflected from the surface as opposed to the emission of microwave radiation, its ability to see the surface depends on cloud cover.

Comparisons between observed and modeled September sea ice trends

Graph of sea ice model results

Figure 5. This figure shows the observed September sea ice extent for 1952 to 2011 (bold black line) and extents for 1900 to 2100 from the CMIP3 models using the “business as usual” SRESA1B greenhouse gas emissions scenario (the blue line averaging results from all of the model runs with the blue shading showing the +/- 1 standard deviation of the different model runs) and from the CMIP5 archive, using the RCP 4.5 scenario (pink line and pink shading). The darker pink shading shows where the simulations from CMIP3 and CMIP5 overlap each other.

Credit: National Snow and Ice Data Center courtesy Stroeve et al. 2012
High-resolution image

Previous research at NSIDC documented that September Arctic ice extent has declined faster than models predicted it would. The comparison was between observations and simulated trends from models participating in the World Climate Research Programme Coupled Model Intercomparison Project Phase 3 (CMIP3). These climate models were used in the 2007 4th Assessment report of the Intergovernmental Panel on Climate Change (IPCC). In a new paper, Stroeve et al. (2012) compared the observed 1979-2011 September trend for the Arctic against trends over the same period from the next generation of models in the CMIP5 archive. While the newer CMIP5 models do a better job of simulating the observed trend, most of the modeled ice extent trends are still smaller than the observed downward trend. NSIDC is working with researchers to further improve the models, which help extend and refine our understanding of the climate system.

Extensive melt over the Greenland Ice Sheet

Figure 6. This figure shows the daily, cumulative area of the Greenland ice sheet showing surface melt for 2012, 2011, 2010 and for the 1980 to 1999 mean. While melt was unusually extensive through May and June of 2012, the melt area increased rapidly in early July in response to an unusually warm weather event.

Credit: National Snow and Ice Data Center courtesy Marco Tedesco, CUNY
High-resolution image

This summer, the ocean has not been the only place where unusual melt has been observed in the Arctic. NASA researchers reported that for several days in early July, nearly the entire Greenland ice sheet experienced a brief period of surface melt, including at the summit of the ice sheet. Typically, about half of the ice sheet sees some surface melting during summer, but this tends to be confined to the lower elevations. The 2012 event was associated with a high-pressure weather pattern bringing unusually warm temperatures over the higher elevations of the ice sheet. While the event has not been seen previously in the 34-year satellite record, there is evidence in ice core data from Summit, Greenland of similar events occurring several times over the past few thousand years. These melt events recorded in the ice cores from Summit show an overall average frequency of about once every 150 years since the end of the last ice age. Perhaps more important, however, is the extraordinary high melting occurring this year around the lower elevations in Greenland. Figure 6 shows that the first few months of melt exceeded past higher-than-average melt seasons. Flooding and damage to structures has been reported in some areas where this melt runs off the ice sheet and fills streams and rivers along the Greenland coast. The surface melt runoff, as well as the flow of ice and the resulting calving of icebergs, are contributors to sea level rise. Along with the substantial summer sea ice extent decline and the early Northern Hemisphere snow melt, the pace of Greenland surface melt suggests that 2012 is yet another interesting summer in the Arctic.

For more information and images, visit Greenland Melting.

References

Stroeve, J. C., V. Kattsov, A. P. Barrett, M. C. Serreze, T. Pavlova, M. M. Holland, and W. N. Meier. 2012. Trends in Arctic sea ice extent from CMIP5, CMIP3 and observations. Geophys. Res. Lett., doi:10.1029/2012GL052676, in press.

Sea ice continues to track at low levels

Arctic sea ice continued to track at levels far below average through the middle of July, with open water in the Kara and Barents seas reaching as far north as typically seen during September. Melt onset began earlier than normal throughout most of the Arctic.

Figure 1. Arctic sea ice extent for July 23, 2012 was 7.32 million square kilometers (2.82 million square miles). The orange line shows the 1979 to 2000 median extent for that day. The black cross indicates the geographic North Pole. Sea Ice Index data. About the data

Credit: National Snow and Ice Data Center
High-resolution image

Overview of conditions
As of July 23, 2012, sea ice extent was 7.32 million square kilometers (2.82 million square miles). On the same day last year, ice extent was 7.22 million square kilometers (2.78 million square miles), the record low for this day.

Arctic sea ice extent continued to track at very low levels, setting daily record lows for the satellite era for a few days in early July. Extent is especially low in the Barents, Kara, and Laptev seas. In the Barents and Kara seas, the area of open water extends to the north coasts of Franz Josef Land and Severnaya Zemlya, as far north as typically seen during September, the end of the summer melt season. Polynyas in the Beaufort and East Siberian seas continued to expand during the first half of July. By sharp contrast, ice extent in the Chukchi Sea remains near normal levels. In this region the ice has retreated back to the edge of the multiyear ice cover. Ice cover in the East Greenland Sea, while of generally low concentration, remains slightly more extensive than normal.

Figure 2. The graph above shows Arctic sea ice extent as of July 23, 2012, along with daily ice extent data for the previous five years. 2012 is shown in blue, 2011 in orange, 2010 in pink, 2009 in navy, 2008 in purple, and 2007 in green. The gray area around the average line shows the two standard deviation range of the data. Sea Ice Index data.

Credit: National Snow and Ice Data Center
High-resolution image

Conditions in context
The first part of July was once again dominated by high sea level pressure over the Beaufort Sea, combined with low sea level pressure over Siberia and Alaska. As discussed in last month’s post, this pressure pattern tends to promote above-average temperatures and enhances ice transport out of the Arctic through Fram Strait. Beginning July 11th, the pressure pattern changed as cyclones moved into the central Arctic Ocean, bringing in cooler temperatures and helping to slow ice loss. Air temperatures at the 925 hPa level (about 3000 feet) in the central Arctic and the Beaufort Sea were 1 to 4 degrees Celsius (2 to 7 degrees Fahrenheit) above normal as averaged from July 1 to July 14. In the Beaufort and Chukchi seas, the sea ice has retreated to the edge of the multiyear ice cover. As a result of the anomalously high air temperatures, melt over the multiyear ice cover is extensive and ice concentrations are low. Anomalously low air temperatures for that period were found in the Barents, Kara, and East Greenland seas (1 to 3 degrees Celsius, or 2 to 6 degrees Fahrenheit, below the 1981 to 2010 climatology).

Early melt onset
The timing of seasonal melt onset, which can be estimated from satellite passive microwave data, plays an important role in the amount of ice that melts each summer. Unusually early melt onset means an early reduction in the surface albedo, allowing for more solar heating of the ice, which in turn allows melt ponds and open water areas to develop earlier in the melt season. In 2012, melt began earlier than normal (as compared to averages for the period 1979 to 2000) throughout most of the Arctic, the exceptions being the Bering Sea and the East Greenland Sea. Melt in the Kara and Barents seas began more than two weeks earlier than normal. Melt onset for the Laptev Sea region as a whole started on June 1 and was the earliest seen in the satellite record. Melt began 12 and 9 days earlier than normal averaged over the Beaufort and Chukchi seas, respectively.

Figure 4. This composite image from the SSMIS instrument obtained on July 23, 2012 shows areas of low ice concentration in the Beaufort and Chukchi seas, the Canadian Archipelago, the East Greenland Sea, and north of Siberia. Purple indicates areas of high sea ice concentration, while yellow and red indicate lower ice concentration. Blue shows open water and green shows land.

Credit: National Snow and Ice Data Center courtesy IUP Bremen
High-resolution image

Low ice concentrations
NSIDC uses satellite data from the Special Sensor Microwave Imager (SSM/I) and the Special Sensor Microwave Imager/Sounder (SSMIS) instruments, in part because they provide the longest consistent time series of data. However, more recent sensors such as the Advanced Microwave Scanning Radiometer-Earth Observing System (AMSR-E) provide a more detailed perspective. In particular, we can examine ice concentration, which tells us how much ice is in a pixel, providing information on how vulnerable the ice may be to summer melting.

In October 2011, the AMSR-E instrument on board the NASA Aqua satellite ceased operation, dealing a blow to the science community. This is because its higher spatial resolution and advanced technology provided detailed ice information to complement the long-term record of the Special Sensor Microwave Imager/Sounder (SSMIS) instrument. However, the Japanese Aerospace Exploration Agency (JAXA) successfully launched a new satellite called Shizuku, or Global Change Observation Mission 1st-Water (GCOM-W1), on May 18, 2012. The Shizuku carries a new Advanced Microwave Scanning Radiometer (AMSR2) instrument, a sensor similar to AMSR-E. As soon as calibration and validation of AMSR2 are complete, the University of Bremen will once again produce maps of sea ice concentration at a fairly high resolution (about 6 kilometers).

In the meantime, the University of Bremen offers sea ice concentration maps from the lower-resolution SSMIS. The July 23 chart shows areas of low sea ice concentration in the Beaufort and Chukchi seas, the Canadian Archipelago, the East Greenland Sea, and north of Siberia. In the Beaufort and Chukchi seas, low ice concentrations and polynyas are found over areas of multiyear sea ice, where open water areas have developed between individual multiyear ice floes and significant ponding on the ice is observed. Low ice concentrations mean a low surface albedo, allowing for more of the sun’s energy to be absorbed, melting even more sea ice. This makes the multiyear ice in the Beaufort and Chukchi seas vulnerable to melting out this summer.

Rapid sea ice retreat in June

Arctic sea ice extent declined quickly in June, setting record daily lows for a brief period in the middle of the month. Strong ice loss in the Kara, Bering, and Beaufort seas, and Hudson and Baffin bays, led the overall retreat. Northern Hemisphere snow extent was unusually low in May and June, continuing a pattern of rapid spring snow melt seen in the past six years.

sea ice extent

Figure 1. Arctic sea ice extent for June 2012 was 10.97 million square kilometers (4.24 million square miles). The magenta line shows the 1979 to 2000 median extent for that month. The black cross indicates the geographic North Pole. Sea Ice Index data. About the data

Credit: National Snow and Ice Data Center
High-resolution image
Daily data files

Overview of conditions
Arctic sea ice extent for June 2012 averaged 10.97 million square kilometers (4.24 million square miles). This was 1.18 million square kilometers (456,000 square miles) below the 1979 to 2000 average extent. The last three Junes (2010-2012) are the three lowest in the satellite record. June 2012 ice extent was 140,000 square kilometers (54,000 square miles) above the 2010 record low. Ice losses were notable in the Kara Sea, and in the Beaufort Sea, where a large polynya has formed. Retreat of ice in the Hudson and Baffin bays also contributed to the low June 2012 extent. The only area of the Arctic where sea ice extent is currently above average is along the eastern Greenland coast.

The ice extent recorded for 30 June 2012 of 9.59 million square kilometers (3.70 million square miles) would not normally be expected until July 21, based on 1979-2000 averages. This puts extent decline three weeks ahead of schedule.

graph of sea ice extents

Figure 2. The graph above shows Arctic sea ice extent as of July 2, 2012, along with daily ice extent data for the previous five years. 2012 is shown in blue, 2011 in orange, 2010 in pink, 2009 in navy, 2008 in purple, and 2007 in green. The gray area around the average line shows the two standard deviation range of the data. Sea Ice Index data.

Credit: National Snow and Ice Data Center
High-resolution image
Daily data files

Conditions in context
In June, the Arctic lost a total of 2.86 million square kilometers (1.10 million square miles) of ice. This is the largest June ice loss in the satellite record. Similar to May, the month was characterized by a period of especially rapid ice loss (discussed in the mid-month entry, June 19th) followed by a period of slower loss. Warm conditions prevailed over most of the Arctic; temperatures at the 925 hPa level (about 3000 feet above the ocean surface) were typically 1 to 4 degrees Celsius (1.8 to 7.2 degrees Fahrenheit) above the 1981 to 2010 average, and as much as 7 to 9 degrees Celsius (12.6 to 16.2 degrees Fahrenheit) above average over northern Eurasia and near southern Baffin Bay. Weather patterns over the Arctic Ocean varied substantially through the month.

Figure 3. Monthly June ice extent for 1979 to 2012 shows a decline of 3.7% per decade.

Credit: National Snow and Ice Data Center
High-resolution image

June 2012 compared to recent years
Arctic sea ice extent for June 2012 was well below average for the month compared to the satellite record from 1979 to 2000. It was the second lowest in the satellite record, behind 2010. Through 2012, the linear rate of decline for June Arctic ice extent over the satellite record is 3.7% per decade.

ice conditions in the field

Figure 4. These photographs show sea ice on the fast ice near Barrow, Alaska. (a) Chris Polashenski stands in a melt pond with instrumentation, (b) honeycombed sample of rotten ice taken from the bottom of a melt pond, (c) sea ice rubble field after winds pushed the weakened sea ice onto the shore.

Credit: National Snow and Ice Data Center, courtesy Chris Polanshenski of CRREL as part of the SIZONET project.
High-resolution image

A report from the field
Dr. Chris Polashenski of the Cold Regions Research Lab (CRREL) recently returned from making sea ice measurements on landfast ice a few kilometers offshore near Barrow, Alaska as part of the National Science Foundation and NASA funded Seasonal Ice Zone Observing Network (SIZONET) project. He and his fellow researchers made some interesting observations. Prior to the onset of melt, the ice was thicker than observed in recent years – around 1.8 meters (5.9 feet) as compared to typical conditions of around 1.4 meters (4.6 feet). Despite this thick ice at the beginning of the season, melt proceeded relatively rapidly. Melt ponds began forming on June 4—a typical timing for recent years, but high temperatures, sunny afternoons, and foggy nights combined to speed the melt of ice thereafter.

On June 17-18, a confluence of weather conditions, including a daytime high of 19 degrees Celsius (66 degrees Fahrenheit), overnight condensing fog, and bright sun in the afternoon combined to produce exceptional surface melt of just under 11 centimeters (4.3 inches) in a 24-hour period, according to preliminary lidar data. By June 18, ice conditions had deteriorated significantly and with strong winds forecast out of the west, safety dictated it was time to get off the ice. Collisions of the pack with the weakened shore fast ice on June 21-23 resulted in substantial deformation and a series of ice pushes onto the beach, an amazing process to watch from the safety of land.

Such field observations may only be representative of the local area. However, they provide context for basin-wide observations and a better understanding of local processes.

map of snow cover anomaliesmap of snow cover anomalies

Figure 5. June 2012 set a record low for Northern Hemisphere snow cover extent. Figure 5 (a) graphs snow extent for Junes from 1967 to 2012. Figure 5 (b) maps snow cover anomalies in the Northern Hemisphere.

Credit: National Snow and Ice Data Center courtesy Rutgers University Snow Lab.

High-resolution image: June snow cover anomalies graph
High-resolution image: June snow cover anomalies map

Graph of May snow cover anomalies

Map of May snow cover anomalies

Low June snow extent
Snow cover over Northern Hemisphere lands retreated rapidly in May and June, leaving the Arctic Ocean coastline nearly snow free. June 2012 set a record low for snow extent (for a 45-year period of record spanning 1967-2012) by a significant margin. Snow extent for June 2012 was more than 1 million square kilometers (386,000 square miles) below the previous record set in 2010. Snow extent for 2011 was a close third lowest. May 2012 had third lowest snow extent for the period of record. This rapid and early retreat of snow cover exposes large, darker underlying surfaces to the sun early in the season, fostering higher air temperatures and warmer soils.

A note on the daily sea ice data
NSIDC has published the underlying data used for the Daily Sea Ice Extent image and the Daily Sea Ice Extent 5-Month Time Series graph. Please see the links below for documentation for the Sea Ice Index and links to the data:

Documentation–Daily extent data file

Documentation–Climatology file

Sea ice tracking at record low levels

After a period of rapid ice loss through the first half of June, sea ice extent is now slightly below 2010 levels, the previous record low at this time of year. Sea level pressure patterns have been favorable for the retreat of sea ice for much of the past month.

Figure 1. Arctic sea ice extent for 18 June 2012 (left) was 10.62 million square kilometers (4.10 million square miles), 31,000 square kilometers (12,000 square miles) below the same day in 2010 (right). The orange line shows the 1979 to 2000 median extent for that day. The black cross indicates the geographic North Pole. Sea Ice Index data. About the data

Credit: National Snow and Ice Data Center
High-resolution images: Figure 1a, Figure 1b

Overview of conditions

On June 18, the five-day average sea ice extent was 10.62 million square kilometers (4.10 million square miles). This was 31,000 square kilometers (12,000 square miles) below the same day in 2010, the record low for the day and 824,000 square kilometers (318,000 square miles) below the same day in 2007, the year of record low September extent.

Figure 2. The graph above shows Arctic sea ice extent as of June 18, 2012, along with daily ice extent data for the previous five years. 2012 is shown in blue, 2011 in orange, 2010 in pink, 2009 in navy, 2008 in purple, and 2007 in green. The gray area around the average line shows the two standard deviation range of the data. Sea Ice Index data.

Credit: National Snow and Ice Data Center
High-resolution image

Conditions in context

The main contributors to the unusually rapid ice loss to this point in June are the disappearance of most of the winter sea ice in the Bering Sea, rapid ice loss in the Barents and Kara Seas, and early development of open water areas in the Beaufort and Laptev Seas north of Alaska and Siberia. Recent ice loss rates have been 100,000 to 150,000 square kilometers (38,600 to 57,900 square miles) per day, which is more than double the climatological rate.

Figure 3: This map of mean sea level pressure from 15 May 2012 to 15 June 2012 shows a pattern of high pressure over the Beaufort Sea and a pattern of low pressure over the Laptev Sea, conditions favorable to summer ice loss.

Credit: NSIDC courtesy NOAA/ESRL PSD
High-resolution image

Sea level pressure favors the advection of ice

A pattern of high pressure over the Beaufort Sea and low pressure over the Laptev Sea has been present for the past few weeks. This pattern is favorable for summer ice loss, by advecting warm winds from the south (in eastern Asia) to melt the ice and transport it away from the coastlines in Siberia and Alaska. The high pressure over the Beaufort leads to generally clear skies, and temperatures are now above freezing over much of the Arctic pack. Snow cover in the far north is nearly gone, earlier than normal, allowing the coastal land to warm faster.

Early melt onset, and clear skies near the solstice are favorable conditions for more rapid melting, and warming of the ocean in open-water areas. The persistence of this type of pressure pattern throughout summer 2007 was a major factor toward causing the record low September extent that year. Conversely, in 2010, the patterns were not as favorable for loss of ice and the seasonal decline slowed later in the summer, and the extent did not approach the record low levels of 2007.

While these patterns and conditions have looked similar to 2007, over the last couple days the high pressure pattern over the Beaufort Sea has broken down. And while the extent is at a record low for the date, it is still early in the melt season. Changing weather patterns throughout the summer will affect the exact trajectory of the sea ice extent through the rest of the melt season.

Arctic sea ice variable, ends May below average

After reaching near-average levels in late April, sea ice extent declined rapidly during the early part of May. The rest of the month saw a slower rate of decline. Ice extent in the Bering Sea remained above average throughout the month.

Figure 1. Arctic sea ice extent for May 2012 was 13.13 million square kilometers (5.07 million square miles). The magenta line shows the 1979 to 2000 median extent for that month. The black cross indicates the geographic North Pole. Sea Ice Index data. About the data

Credit: National Snow and Ice Data Center
High-resolution image

Overview of conditions
Arctic sea ice extent for May 2012 averaged 13.13 million square kilometers (5.07 million square miles). This was 480,000 square kilometers (185,000 square miles) below the 1979 to 2000 average extent. This May’s extent was similar to the May 2008 – 2010 extent, but it was higher than May 2011. May ice extent was 550,000 square kilometers (212,000 square miles) above the record low for the month, which happened in the year 2004.

Ice cover remained extensive in the Bering Sea, continuing the pattern observed this past winter and spring. The anomalously heavy ice conditions were countered by unusually low extents in the Barents and Kara Seas, resulting in Arctic-wide ice conditions that remained below normal. By the end of the month, open water areas had begun to form along some parts of Arctic Ocean coast.

While the ice extent for May is not especially low this year, there is little correlation between the extent of the ice cover in May and that at the end of the melt season in September.

Figure 2. The graph above shows Arctic sea ice extent as of June 4, 2012, along with daily ice extent data for the previous five years. 2012 is shown in blue, 2011 in orange, 2010 in pink, 2009 in navy, 2008 in purple, and 2007 in green. The gray area around the average line shows the two standard deviation range of the data. Sea Ice Index data.

Credit: National Snow and Ice Data Center
High-resolution image

Conditions in context
For May, the Arctic as a whole lost 1.62 million square kilometers (625,000 square miles) of ice, which was 180,000 square kilometers (69,500 square miles) more than the 1979 to 2000 average. The average daily rate of ice loss was 52,000 square kilometers (20,000 square miles) per day, which was slightly faster than the long-term average of 46,000 square kilometers (18,000 square miles) per day. However, the rate of ice loss for the month was composed of two distinct periods: a rapid loss of ice during the first part of the month, followed by near-average rates during the latter part of the month.

Air temperatures for May were higher than usual over the central Arctic Ocean and the Canadian Archipelago. Over the Bering Sea, Hudson Bay, and parts of the East Greenland and Norwegian seas, temperatures were slightly below average.

Figure 3. Monthly May ice extent for 1979 to 2012 shows a decline of 2.3% per decade.

Credit: National Snow and Ice Data Center
High-resolution image

May 2012 compared to past years
Arctic sea ice extent for May 2012 was below average for the month, compared to the satellite record from 1979 to 2000. However, the ice extent this May was not as low as it has been in some recent years. Including the year 2012, the linear rate of decline for May ice extent over the satellite record is 2.3% per decade.

May and April have the smallest trends of the year, indicating that spring is a period during the year when there is less variability and conditions tend to converge. It also demonstrates that spring extents are not necessarily indicative of conditions later in the summer.

Figure 4. This map of sea level pressure anomalies for May 2012 shows that low pressure continued to dominate off of southern Alaska, resulting in northerly winds in the Bering Sea.

Credit: NSIDC courtesy NOAA/ESRL PSD
High-resolution image

A persistent pattern of extensive ice in the Bering Sea

Continuing the pattern of the past six months, ice cover remained unusually extensive in the Bering Sea. Normally by the end of May, the Bering is largely ice-free, but this year, 350,000 square kilometers (135,000 square miles) of ice remained. As was also the case for February through April, May 2012 had the highest average Bering Sea ice extent for the month in the satellite record.

The higher than normal extent and late spring break up of the ice cover in the Bering Sea are mainly due to unusually low air temperatures and persistent winds from the north, related to a region of low atmospheric pressure centered over Kodiak, Alaska. As these cold winds slowed ice melt, they also pushed the ice edge to the south. The heavy ice in the region may delay the start of Shell Alaska’s Arctic drilling this summer, which will be the first exploratory drilling in the Arctic Ocean in 20 years.

With the overall springtime warming of the Arctic, the ice has nevertheless started to break up and large areas of open water are now present in the northern part of the Bering Sea.

Figure 5. In this Moderate Resolution Imaging Spectroradiometer (MODIS) Arctic Mosaic image for the Beaufort Sea on May 29, 2012, open water is apparent between fast ice along the coast and the broken-up floes off-shore. Toward the bottom of the image, thin clouds can be seen over the open water.

Credit: NASA/GSFC, Rapid Response
High-resolution image

Open water areas within the Arctic Ocean

Although ice extent has remained high in the Bering Sea, open water areas have developed in parts of the Arctic Ocean, notably along the coasts of the Beaufort and Laptev seas. These openings are largely driven by winds pushing the ice away from fast ice, ice that is attached to the coast and that does not move with the winds. That the open water areas have not refrozen points to the relatively warm conditions over the Arctic, particularly in the Beaufort Sea.

The ice cover in the southern Beaufort Sea is also substantially broken up, with many individual ice floes instead of a consolidated pack. This makes the ice in this region vulnerable to enhanced melt during summer, as the sun rises higher in the sky and the dark open water areas between the floes readily absorb solar energy.

Quicker thickness data from NASA IceBridge

As we discussed last month, thickness information is extremely important for understanding the state of the ice cover. It is particularly important to seasonal forecasts (such as the SEARCH Sea Ice Outlook that will be released later this month), because thinner ice is more likely to melt completely during summer.

Sea ice age can be inferred from satellite data, and can help indicate the locations of relatively thin versus relatively thick ice. But direct measurements of ice thickness have been limited. Satellite missions such as ICESat and CryoSat, which measure ice thickness with altimeters, have been extremely valuable in better understanding overall changes in Arctic sea ice volume.

Currently, the NASA IceBridge mission supplies both sea ice thickness and snow depth measurements in spring, providing timely information on the state of the ice cover as the melt season begins. IceBridge data are collected from aircraft that fly over the ice cover carrying a suite of instruments, including altimeters that can directly measure ice thickness above the surface. These measurements are at high spatial resolution that can also be used to validate satellite data.

This year, the IceBridge Arctic sea ice campaign collected data in late March and early April, and provided data to NSIDC for distribution shortly thereafter. The data, collected from the North American side of the Arctic, indicate thick ice north of Greenland due to wind and ocean current patterns piling ice into thick ridges. In the Beaufort Sea, the offshore ice is fairly thin (1 to 2 meters, or 3 to 6 feet), indicative of first-year ice. Such thin ice will be prone to melt out completely this summer.

Ice along the Alaskan coast is thicker. Thicker ice tends to have a deeper overlying snow cover. The amount of snow is an important factor in the summer melt, because the snow reflects solar energy. The snow must melt away before surface melting of the ice can begin in earnest.

Arctic sea ice reaches near-average extent in April

Arctic sea ice extent declined slowly through the first three weeks of April, compared to recent years. The slow decline through March and the first few weeks of April meant that by mid-April, ice extent was at near-average levels. However, much of the extensive ice cover is thin ice that will melt quickly once temperatures rise in the Arctic. Over the past week, extent has started to fall sharply.

Figure 1. Arctic sea ice extent for April 2012 was 14.73 million square kilometers (5.69 million square miles). The magenta line shows the 1979 to 2000 median extent for that month. The black cross indicates the geographic North Pole.Sea Ice Index data. About the data

Credit: National Snow and Ice Data Center
High-resolution image

Overview of Conditions
Arctic sea ice extent in April 2012 averaged 14.73 million square kilometers (5.69 million square miles). Because of the very slow rate of ice loss through the last half of March and the first three weeks of April, ice extent averaged for April ranked close to average out of 34 years of satellite data.  It was the highest average ice extent for the month since 2001, only 270,000 square kilometers (104,000 square miles) below the 1979 to 2000 average extent. April ice extent was 860,000 square kilometers (330,000 square miles) above the record low for the month, which happened in 2007.

In April, ice cover remained unusually extensive in the Bering Sea, continuing a pattern that persisted over the winter.  Ice extent was also slightly higher than average in Baffin Bay and part of the Sea of Okhotsk.  As in recent winters, ice extent was well below normal in the Barents Sea, compensating for the extensive ice in the Bering Sea.

As discussed in previous posts, the high Bering Sea ice extent this winter stemmed from unusually low air temperatures and persistent winds that helped to push ice southwards. During April, atmospheric conditions changed, warming the air to near-average temperatures for this time of year and slowing the strong southerly winds.

During April, air temperatures over most of the Arctic were higher than usual, particularly over the central Arctic Ocean.  Over the Bering Sea and parts of the East Greenland and Norwegian seas, temperatures ranged from average to slightly below average.

Figure 2. The graph above shows Arctic sea ice extent as of May 1, 2012, along with daily ice extent data for the previous five years. 2012 is shown in blue, 2011 in orange, 2010 in pink, 2009 in navy, 2008 in purple, and 2007 in green. The gray area around the average line shows the two standard deviation range of the data. Sea Ice Index data.

Credit: National Snow and Ice Data Center
High-resolution image
Note: That image originally published on May 3 contained an error in the climatology. The image has been replaced with the correct image. About the data

Conditions in context
Overall, the Arctic lost 1.07 million square kilometers (413,000 square miles) of ice during April, somewhat less than the 1979 to 2000 average April loss of 1.21 million square kilometers (467,000 square miles). The average daily rate of ice loss was 35,600 square kilometers (13,700 square miles) per day.  On April 24, ice extent was only 118,000 square kilometers (45,6000 square miles) below the 1979 to 2000 average for that day, although the difference has increased since then.

While ice conditions approached the 1979 to 2000 average levels for this time of year, the high ice extent will have little influence on how much ice melts this summer. Much of the ice cover is recently formed thin ice that will melt out quickly. Research has shown that sea ice extent in spring does not tell us much about ice extent the following summer. More important to the summer melt is the thickness of the ice cover, and summer weather.

Figure 3. Monthly April ice extent for 1979 to 2012 shows a decline of 2.6% per decade.

Credit: National Snow and Ice Data Center
High-resolution image

April 2012 compared to past years
Arctic sea ice extent for April 2012 was near average for the month in the satellite record, but was the highest since 2001. Including the year 2012, the linear rate of decline for April ice extent over the satellite record is 2.6% per decade.

Figure 4. This graph shows Antarctic sea ice extent as of May 1, 2012 (light blue line), along with the average ice extent and the ice extent from last year (dark blue). The average Southern Annular Mode (SAM) index number for each month is overlaid on the image. A stronger SAM correlates to stronger winds, which help to spread the sea ice and increase ice extent.

Credit: National Snow and Ice Data Center
High-resolution image

Antarctic sea ice spread by strong winds

The sea ice cover that surrounds the continent of Antarctica has been higher than average through most of the Southern Hemisphere summer (December to March). Ice extent declined much more slowly than usual in late November and remained above average through December and January, although it did not reach record highs for those months. At its minimum extent in March, Antarctic sea ice remained above average. Ice extent was the highest in the Weddell Sea and the northwestern Ross Sea.

The high ice extent likely stemmed from unusually strong winds that circled the continent of Antarctica during most the southern summer. These circumpolar winds tend to push the ice out from the continent, increasing the extent of the ice, although not necessarily the volume. Air temperatures in December and January were close to average over most of the sea ice-covered water. Researchers approximate the circumpolar wind intensity by an index called the Southern Annular Mode (SAM). A positive value for SAM indicates strong circumpolar winds around the continent; negative values indicate weaker winds. This index was at a record high for the two months of December 2011 and January 2012, at the same period of the higher-than-normal seasonal extents. For more information on Antarctic sea ice, see the NSIDC Icelights article: Sea ice down under: Antarctic sea ice and climate.

Figure 5. This map shows Arctic sea ice thickness, as well as the elevation of the Greenland Ice Sheet, for March 2011. The data come from the European Space Agency CryoSat-2 satellite. For the sea ice, green shades indicate thinner ice, while the yellows and oranges indicate thicker ice.

Credit: NSIDC courtesy CPOM/UCL/Leeds/ESA/PVL
High-resolution image

Cryosat provides new ice thickness data

NSIDC data provide a long-term record of the Arctic and Antarctic sea ice cover. But researchers also want to know how thick the ice cover is, since thinner ice melts faster than thicker ice. Ice thickness measurements are more limited than ice extent, because researchers can only sample small regions in person, and there have only been a few satellite sensors that can measure ice thickness. For example, the NASA ICESat satellite recorded Arctic sea ice thickness between 2003 and 2008, but the mission ended in 2009, and the follow-on mission is not expected to begin until 2016. In the meantime, NASA is filling some of the data gap with airplane-borne instruments as part of Operation IceBridge.

The European Space Agency (ESA) has released initial data from the radar altimeter on their CryoSat-2 satellite. Last week, ESA released the first calibrated maps of Arctic sea ice thickness capturing thickness changes through the winter from October 2010 through March 2011. In the coming years, CryoSat-2 will provide monthly fields of thickness that will allow scientists to track the evolution of the ice cover. For more information on CryoSat-2 and an animation of the thickness maps, see: http://www.esa.int/SPECIALS/Cryosat/SEMU55NW91H_0.html.

Further Reading

Kwok, R., G. F. Cunningham, M. Wensnahan, I. Rigor, H. J. Zwally, and D. Yi. 2009. Thinning and volume loss of the Arctic Ocean sea ice cover: 2003–2008, J. Geophys. Res., 114, C07005, doi:10.1029/2009JC005312.

Kwok, R., G. F. Cunningham, S. S. Manizade, and W. B. Krabill. 2012. Arctic sea ice freeboard from IceBridge acquisitions in 2009: Estimates and comparisons with ICESat, J. Geophys. Res., 117, C02018, doi:10.1029/2011JC007654.

Kwok, R., and G. F. Cunningham. 2008. ICESat over Arctic sea ice: Estimation of snow depth and ice thickness, J. Geophys. Res., 113, C08010, doi:10.1029/2008JC004753.

Laxon, S., N. Peacock, and D. Smith. 2003. High interannual variability of sea ice thickness in the Arctic region, Nature, 424, 947-950, October, doi:10.1038/nature02063.

Daily Graph Changes

Update, April 19, 2012: The nine-day trailing average climatology on the daily data graph has been changed to a five-day trailing average, to be consistent with the five-day trailing average for the daily data.

Figure 1. The graph above shows sea ice extent data graphed using the old method, a five-day centered mean (orange line), and the new method, a five-day trailing mean (blue line). The black line shows the raw daily data. In the old averaging method, extrapolated data sometimes changed values when sea ice extent was changing trajectory. The new method solves this problem by averaging only observed values.
Click for Animation

NSIDC has updated our processing of the daily sea ice extent graph. NSIDC calculates daily extent using a five-day average of the data. Previously, this average was a five-day centered mean, meaning that the final two days of data in the series were extrapolated from the previous three days.

The new method takes the average of the previous five days, so that readers will see fewer “wiggles” in the tail end of the data series (see animation, left). The value of the trailing mean lags the actual data values, so sea ice values will appear lower when ice extent is increasing, but will appear larger when ice is decreasing. The climatology is a 9-day running mean rather than a 5-day, so the climatology line also shifts slightly with this change.

While the averaging changes the data points on the graph,  the underlying data remain unchanged. This change does not affect the monthly average data, which scientists use for longer climate comparisons.

NSIDC will be making further improvements to the Sea Ice Index graphs and images in the coming months. Sea ice data processing methods are described in detail in the Sea Ice Index Documentation.


Arctic sea ice enters the spring melt season

Arctic sea ice reached its annual maximum extent on March 18, after reaching an initial peak early in the month and declining briefly. Ice extent for the month as a whole was higher than in recent years, but still below average.

As the melt season begins, researchers look at a variety of factors that may contribute to summer ice melt. While the maximum extent occurred slightly later than average, the new ice growth is very thin and likely to melt quickly. Ice age data indicate that despite the higher extent compared to recent years, the winter sea ice continues to be dominated by younger and thinner sea ice.

Figure 1. Arctic sea ice extent for March 2012 was 15. 21 million square kilometers (5.87 million square miles). The magenta line shows the 1979 to 2000 median extent for that month. The black cross indicates the geographic North Pole. Sea Ice Index data. About the data

Credit: National Snow and Ice Data Center
High-resolution image

Overview of Conditions
Arctic sea ice extent in March 2012 averaged 15.21 million square kilometers (5.87 million square miles). Ice extent this March ranked ninth lowest out of the 34 years of satellite data for the month, but it was the highest March average ice extent since 2008 and one of the higher March extents in the past decade. Ice extent was 530,000 kilometers (205,000 square miles) below the 1979 to 2000 average extent, and 780,000 square kilometers (301,000 square miles) above the record low for the month, which happened in 2006.

Ice cover remained extensive in the Bering Sea, where it has been above average all winter. Ice extent was also higher than average in Baffin Bay, between Greenland and Canada, and the Sea of Okhotsk, east of Russia. These conditions stemmed from a combination of wind patterns and low temperatures. Air temperatures were 6 to 8 degrees Celsius (11 to 14 degrees Fahrenheit) below average over the Bering Sea, Baffin Bay, and parts of the Sea of Okhotsk, at the 925 millibar level (about 3,000 feet above sea level). View a map of Arctic regions.

In the Kara Sea, where ice extent had been below average during January and February, ice extent rebounded to near-average levels in March. Winds that had been pushing the ice cover back shifted, allowing areas of open water in the Kara Sea to freeze over and the ice to spread out. Ice extent in the Barents Sea remained well below normal. In both the Barents and Kara seas, temperatures remained above normal by 4 to 6 degrees Celsius (7 to 11 degrees Fahrenheit).

Figure 2. The graph above shows daily Arctic sea ice extent as of April 2, 2012, along with the ice extents for the previous four years. The current year is shown in light blue, 2010-11 is in pink, 2009-10 in dark blue, 2008-09 is in purple, and 2006-2007, the year with the record low minimum, is dashed green. The gray area around the average line shows the two standard deviation range of the data.Sea Ice Index data.

Credit: National Snow and Ice Data Center
High-resolution image

Conditions in context
Overall, the Arctic gained 140,000 square kilometers (54,000 square miles) of ice during March. Typically, March has been a month of net ice loss (an average of 260,000 square kilometers [100,000 square miles] for 1979 to 2000), but the last three Marches have had net ice growth. At its maximum extent on March 18, Arctic sea ice extent was within two standard deviations of the average, a measure that scientists look at as an estimate of the natural range of variability for the data.

Over the past thirty years of satellite data, the day of the maximum has varied by over six weeks, occurring as early as mid-February and as late as the end of March. However, even with so much variability, there is a small trend towards later maximum ice extents. This year’s maximum ice extent continued that trend, occurring 12 days later than average.

It is not clear why the maximum ice extent would happen later, given that in general, ice extent is decreasing. One possibility is that the lower winter ice extents might make it easier for ice to continue growing later in the season. With lower winter extents, a late cold snap or northerly wind could spread ice southward over ocean that would normally be ice-covered at that point. Researchers do not expect the late maximum ice extent to strongly influence summer melt. The ice that grew late this winter is quite thin, and will melt rapidly as the sun rises higher in the sky and the air and water get warmer.

Figure 3. Monthly March ice extent for 1979 to 2012 shows a decline of 2.6% per decade.

Credit: National Snow and Ice Data Center
High-resolution image

March 2012 compared to past years
Arctic sea ice extent for March 2012 was the 9th lowest in the satellite record, but the highest since 2008 and one of the highest March extents in the past decade. Including the year 2012, the linear rate of decline for March ice extent over the satellite record is 2.6% per decade.

Figure 4. This image, from the NASA Moderate Resolution Imaging Spectroradiometer (MODIS), shows extensive sea ice cover in the Bering Sea on March 18, 2012. For more details and a full-resolution image, visit the NASA Earth Observatory Web site.
Credit:NASA image by Rob Simmon based on data from Jeff Schmaltz, NASA GSFC.
High-resolution image

High ice extent in the Bering Sea
In the Bering Sea, off Alaska, ice extent reached a record high for the month of March. Persistent winds pushed the sea ice southward and froze more seawater into ice.

As winds from the north pushed Arctic ice southward through the Bering Strait, the ice locked together and formed a structurally continuous band known as an ice arch, which acts a bit like a keystone arch in a building. The ice arch temporarily held back the ice behind it, but as the winds continued, the arch failed along its southern edge, and ice cascaded south through the strait into the Bering Sea. Sea ice also piled up on the northern coast of St. Lawrence Island, streaming southward on either side of it.

Figure 5. Ice age data show that first-year ice made up 75% of the Arctic sea ice cover this March. Thicker multiyear ice used to make up around a quarter of the Arctic sea ice cover. Now it constitutes only 2%.

Credit: NSIDC courtesy J. Maslanik and M. Tschudi, University of Colorado
High-resolution image

Ice age data shows thin ice cover
One key predictor for summer ice melt is the amount of old, thick ice in the Arctic at the end of the winter. Some ice thickness data are available from satellites, but these records are short and discontinuous. Data from the NASA ICESat satellite covers only 2003 to 2009, and the new European Space Agency CryoSat satellite began collecting data in 2011. So researchers look at ice age data as one indicator of Arctic sea ice thickness. Older ice that has survived multiple melt seasons tends to be thicker than newly formed ice.

Ice age data this year show that the ice cover remains much thinner than it was in the past, with a high proportion of first-year ice, which is thin and vulnerable to summer melt. After the record low minimum of 2007 the Arctic lost a significant amount of older, thicker ice, both from melting and from movement of ice out of the Arctic the following winter. In the last few years, the melt and export of old ice was less extreme than in 2007 and 2008, and multiyear ice started to regrow, with second and third-year ice increasing over the last three years.

After the near-record melt last summer, second-year ice declined again, but some of the ice that had survived the previous few summers made it through another year, increasing the proportion of third- and fourth-year ice. However the oldest, thickest ice, more than four years old, continued to decline. Ice older than four years used to make up about a quarter of the winter sea ice cover, but now constitutes only 2%. First-year ice (0 to 1 years old) this year makes up 75% of the total ice cover, the third highest at this time of year in the satellite record. In 2008 the proportion of first-year ice was 79%, and in 2009 it was 76%.

Figure 6. The top image shows a decline in upper-atmosphere winds (solid line) over the last 30 years that mirrors the decline in sea ice over the same time period (dashed line). The bottom image shows the expected change in trajectory of the jet stream (dotted line) compared to the current jet stream trajectory (solid line).

Credit: Jennifer Francis, Rutgers University
High-resolution image

Rapid Arctic warming and mid-latitude weather
The Arctic has warmed about twice as fast as the rest of the Northern Hemisphere in recent decades. Summer Arctic sea ice has declined by 40%, and snow is melting earlier in spring on the surrounding land. This dramatic change in the climate system is expected to affect weather patterns well beyond the confines of the Arctic—but researchers are working to understand exactly how those changes are affecting other regions.

New research by Jennifer Francis of Rutgers University and Steve Vavrus of the University of Wisconsin suggests that warming in the Arctic is causing weather patterns in mid-latitudes to become more persistent. This persistence can lead to conditions like heat waves, cold spells, drought, flooding, and heavy snows. The researchers found that as temperatures in the Arctic warm and become closer to temperatures in lower latitudes, the waves of the jet stream tend to spread out, and west-to-east winds slow down in the upper level of the atmosphere (where storm tracks form). Both of these effects tend to slow the progression of weather patterns, which means that a weather pattern, whether hot or cold, is more likely to stick around.

References

Francis, J.A. and S.J. Vavrus. 2012. Evidence linking Arctic amplification to extreme weather in mid-latitudes. Geophysical Research Letters, 39, L06801, doi:10.1029/2012GL051000.

Francis, J.A. 2012. Linking weird weather to rapid warming of the Arctic. Yale Environment 360, http://e360.yale.edu/feature/linking_weird_weather_to_rapid_warming_of_the_arctic/2501/

Kwok, R., T. Pederson, P. Gudmandsen, S. Pang. 2010. Large sea ice outflow in the Nares Strait in 2007. Geophysical Research Letters, 37, L03502, doi:10.1029/2009GL041872.

Sodhi, D. S. 1977. Ice arching and the drift of pack ice through restricted channels, Rep. 77‐18, Cold Reg. Res. and Eng. Lab., Hanover, N. H.

Arctic sea ice maximum marks beginning of melt season

On March 18, 2012, Arctic sea ice extent reached its annual maximum extent, marking the beginning of the melt season for Northern Hemisphere sea ice. This year’s maximum extent was the ninth lowest in the satellite record.

Figure 1. Arctic sea ice extent on March 18 was 15.24 million square kilometers (5.88 million square miles). The orange line shows the 1979 to 2000 median extent for that day. The black cross indicates the geographic North Pole. Sea Ice Index data. About the data.

Credit: National Snow and Ice Data Center
High-resolution image

Overview of conditions

On March 18, 2012 Arctic sea ice likely reached its maximum extent for the year, at 15.24 million square kilometers (5.88 million square miles). The maximum extent was 614,000 square kilometers (237,000 square miles) below the 1979 to 2000 average of 15.86 million square kilometers (6.12 million square miles). The maximum occurred this year 12 days later than the 1979 to 2000 average date of March 6.

This year’s maximum ice extent was the ninth lowest in the satellite record, slightly higher than the 2008 maximum (15.24 million square kilometers or 5.88 million square miles) Last year, 2011, was the lowest maximum on record, 14.64 million square kilometers (5.65 million square miles). Including this year, the nine years from 2004 to 2012 are the nine lowest maximums in the satellite record.

The graph above shows daily Arctic sea ice extent as of March 25, 2012, along with the ice extents for the previous four years. 2011-12 is shown in light blue, 2010-11 is in pink, 2009-10 in dark blue, 2008-09 is in purple, and 2006-2007, the year with the record low minimum, is dashed green. The gray area around the average line shows the two standard deviation range of the data. Sea Ice Index data.

Credit: National Snow and Ice Data Center
High-resolution image

Conditions in context
As of March 23, ice extent has declined for five days. However, there is still a chance that the ice extent could expand again. Sea ice extent in February and March tends to be quite variable, because ice near the edge is thin and often quite dispersed. The thin ice is highly sensitive to weather, moving or melting quickly in response to changing winds and temperatures, and it often oscillates near the maximum extent for several days or weeks, as it has done this year.

Arctic sea ice extent is declining in winter as well as in summer months, although the decline is not as steep in the winter months. At the beginning of April, NSIDC scientists will release a full analysis of winter conditions, along with monthly data for March. For more information about the maximum extent and what it means, see the NSIDC Icelights post, the Arctic sea ice maximum.