A wintry mix from a dynamic cryosphere

Arctic sea ice extent for January 2013 was well below average, largely due to extensive open water in the Barents Sea and near Svalbard. The Arctic Oscillation also remained in a primarily negative phase. Antarctic sea ice remained extensive due to an unusual northward excursion of ice in the Weddell Sea. December of 2012 saw Northern Hemisphere snow cover at a record high extent, while January 2013 is the sixth-highest snow cover extent on record since 1967.

Overview of conditions

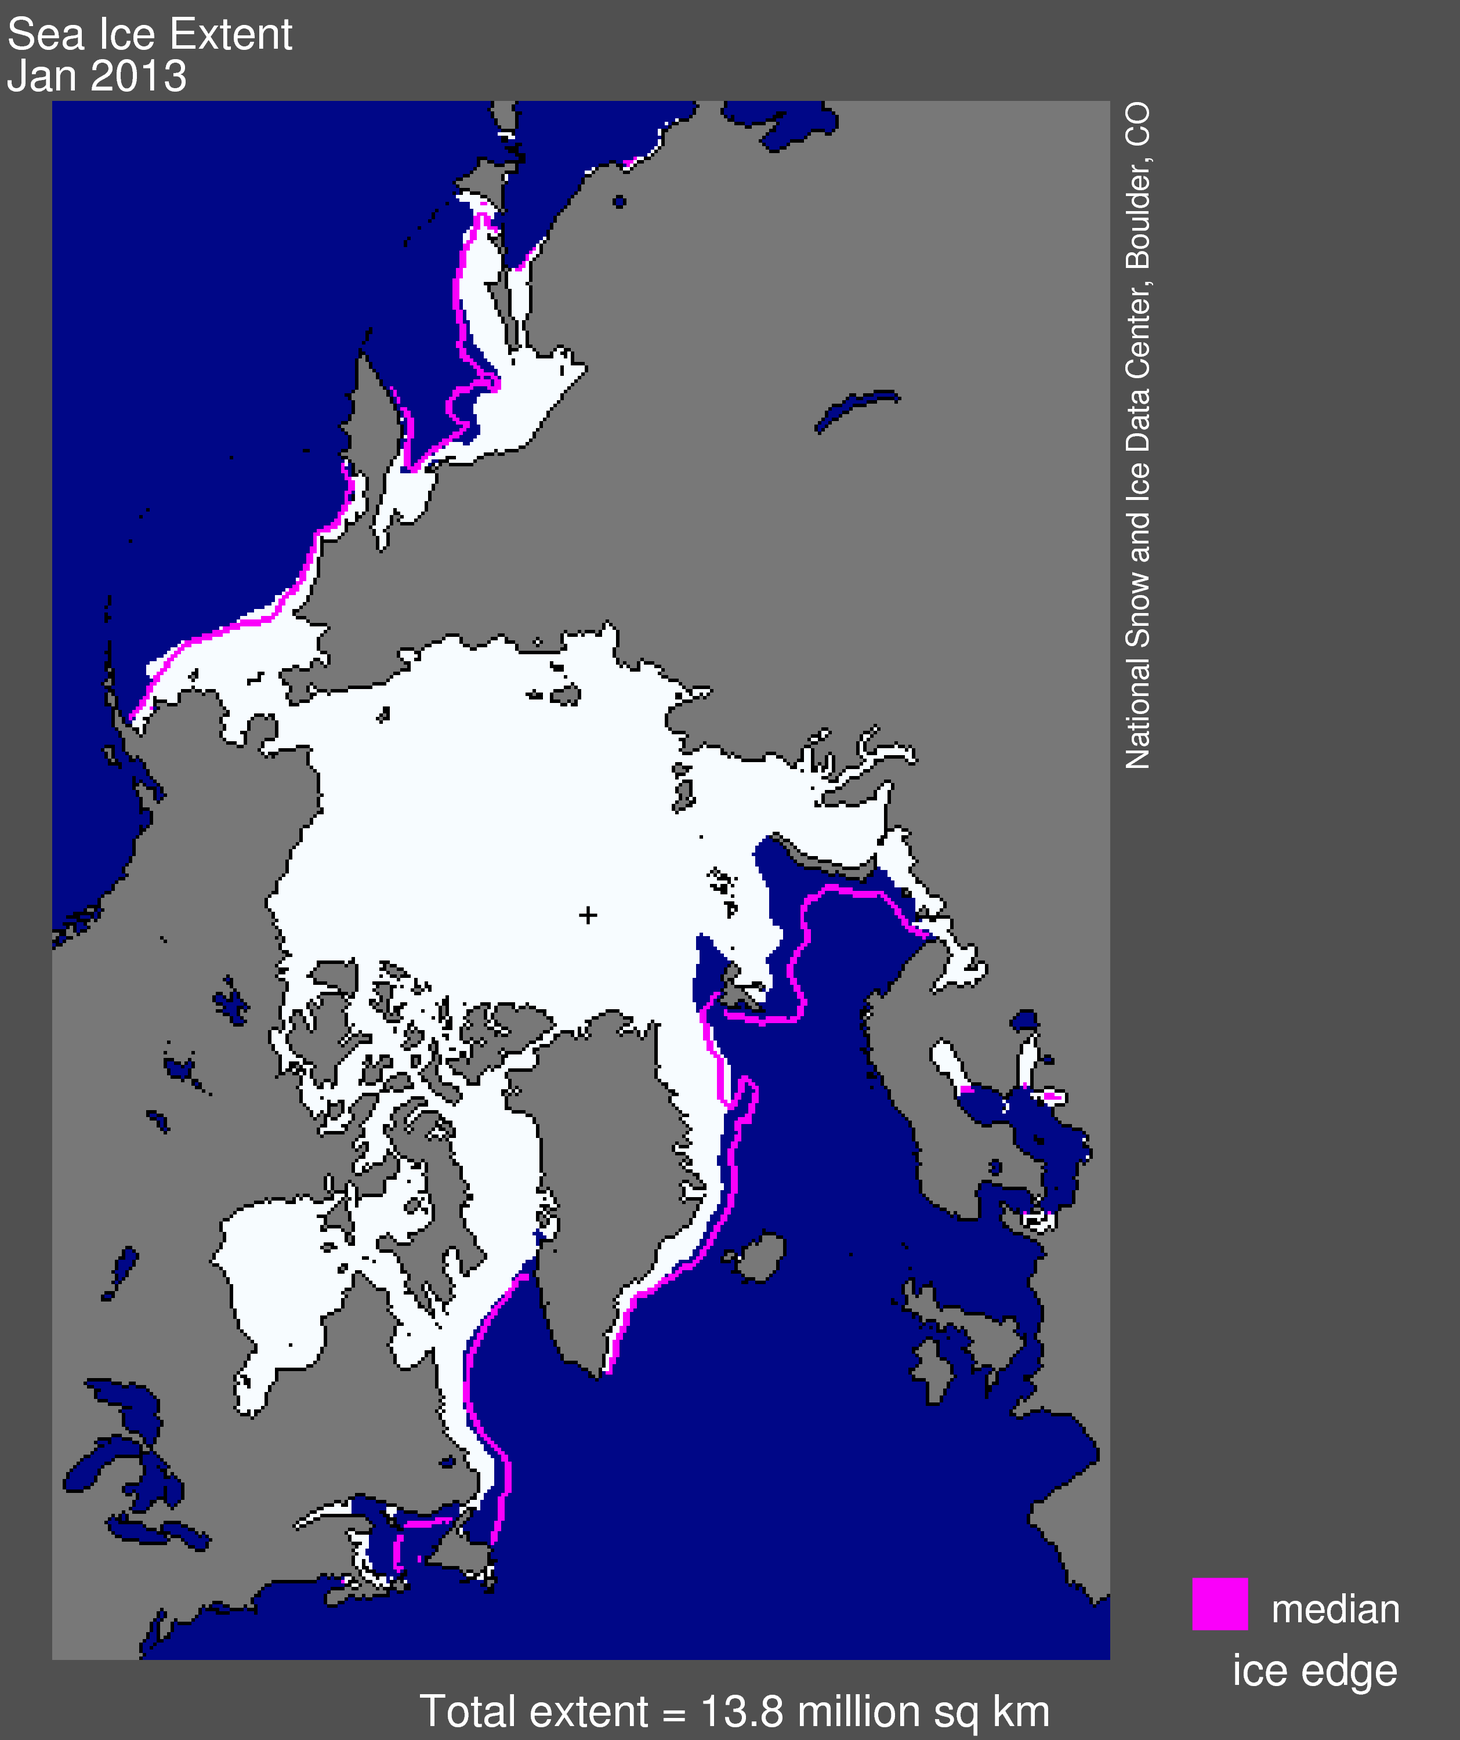
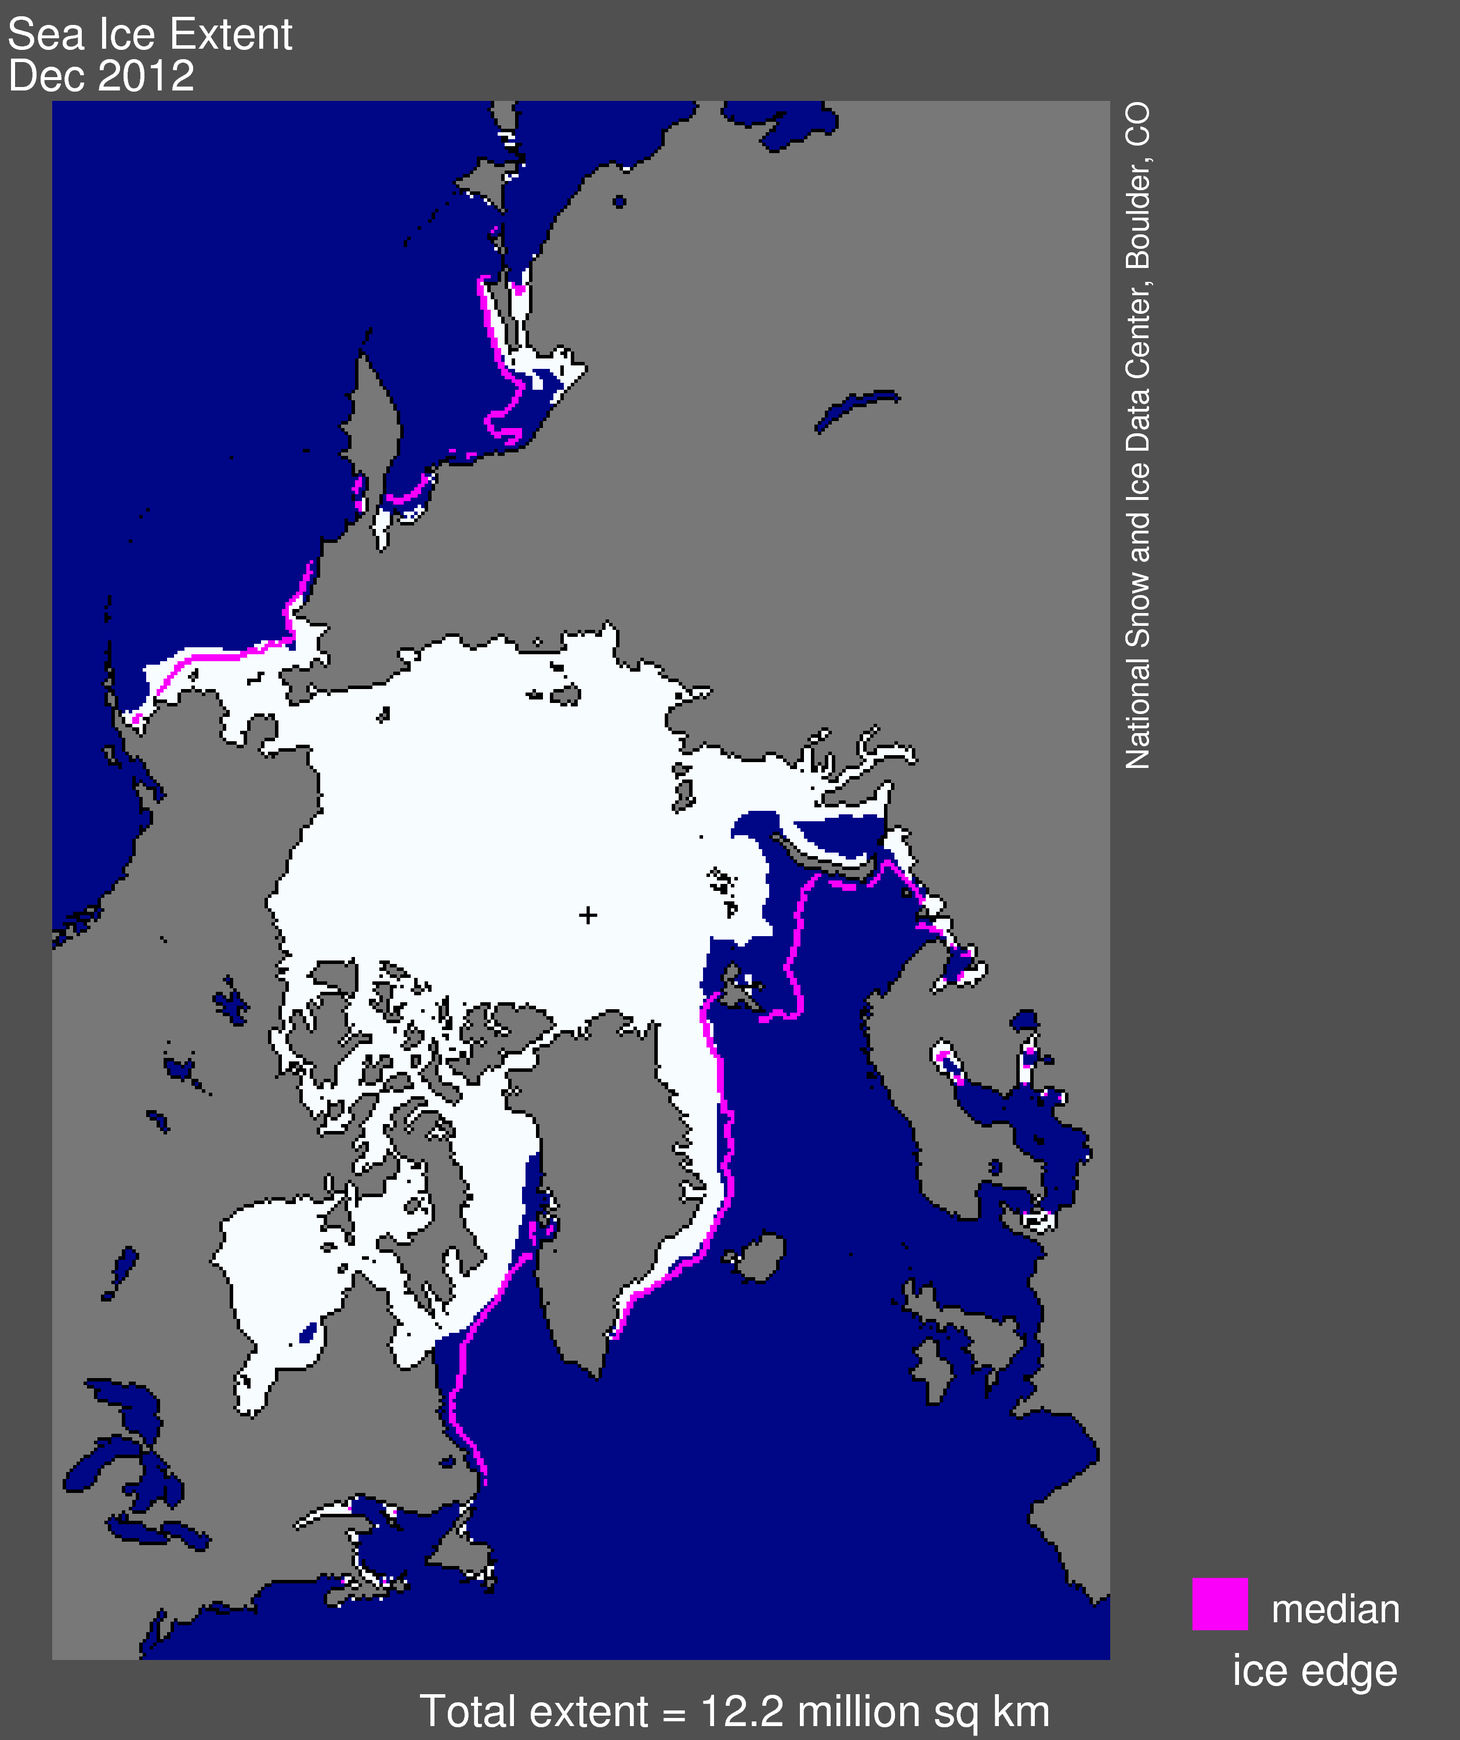
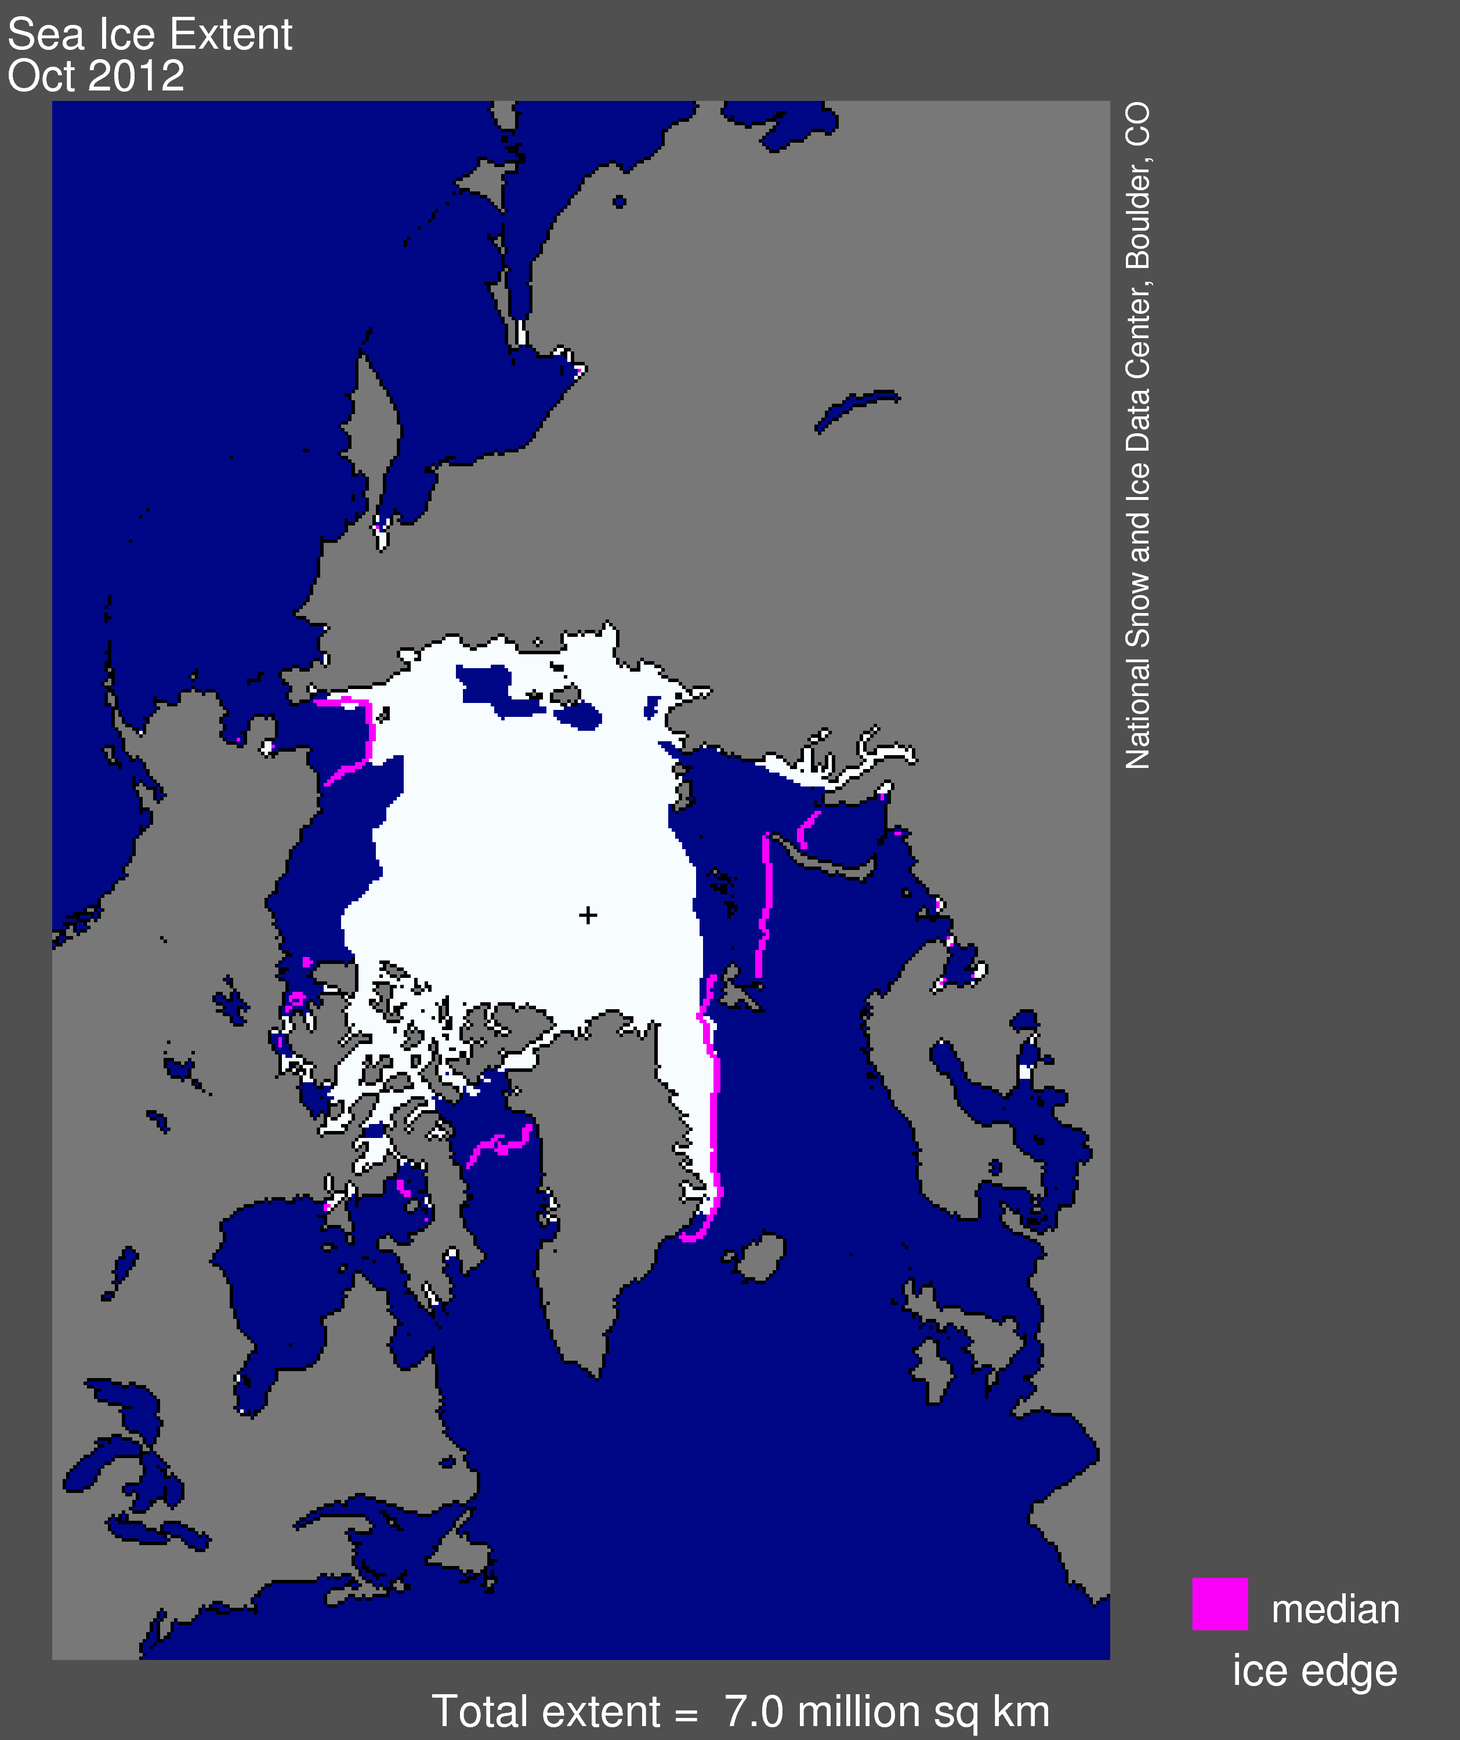
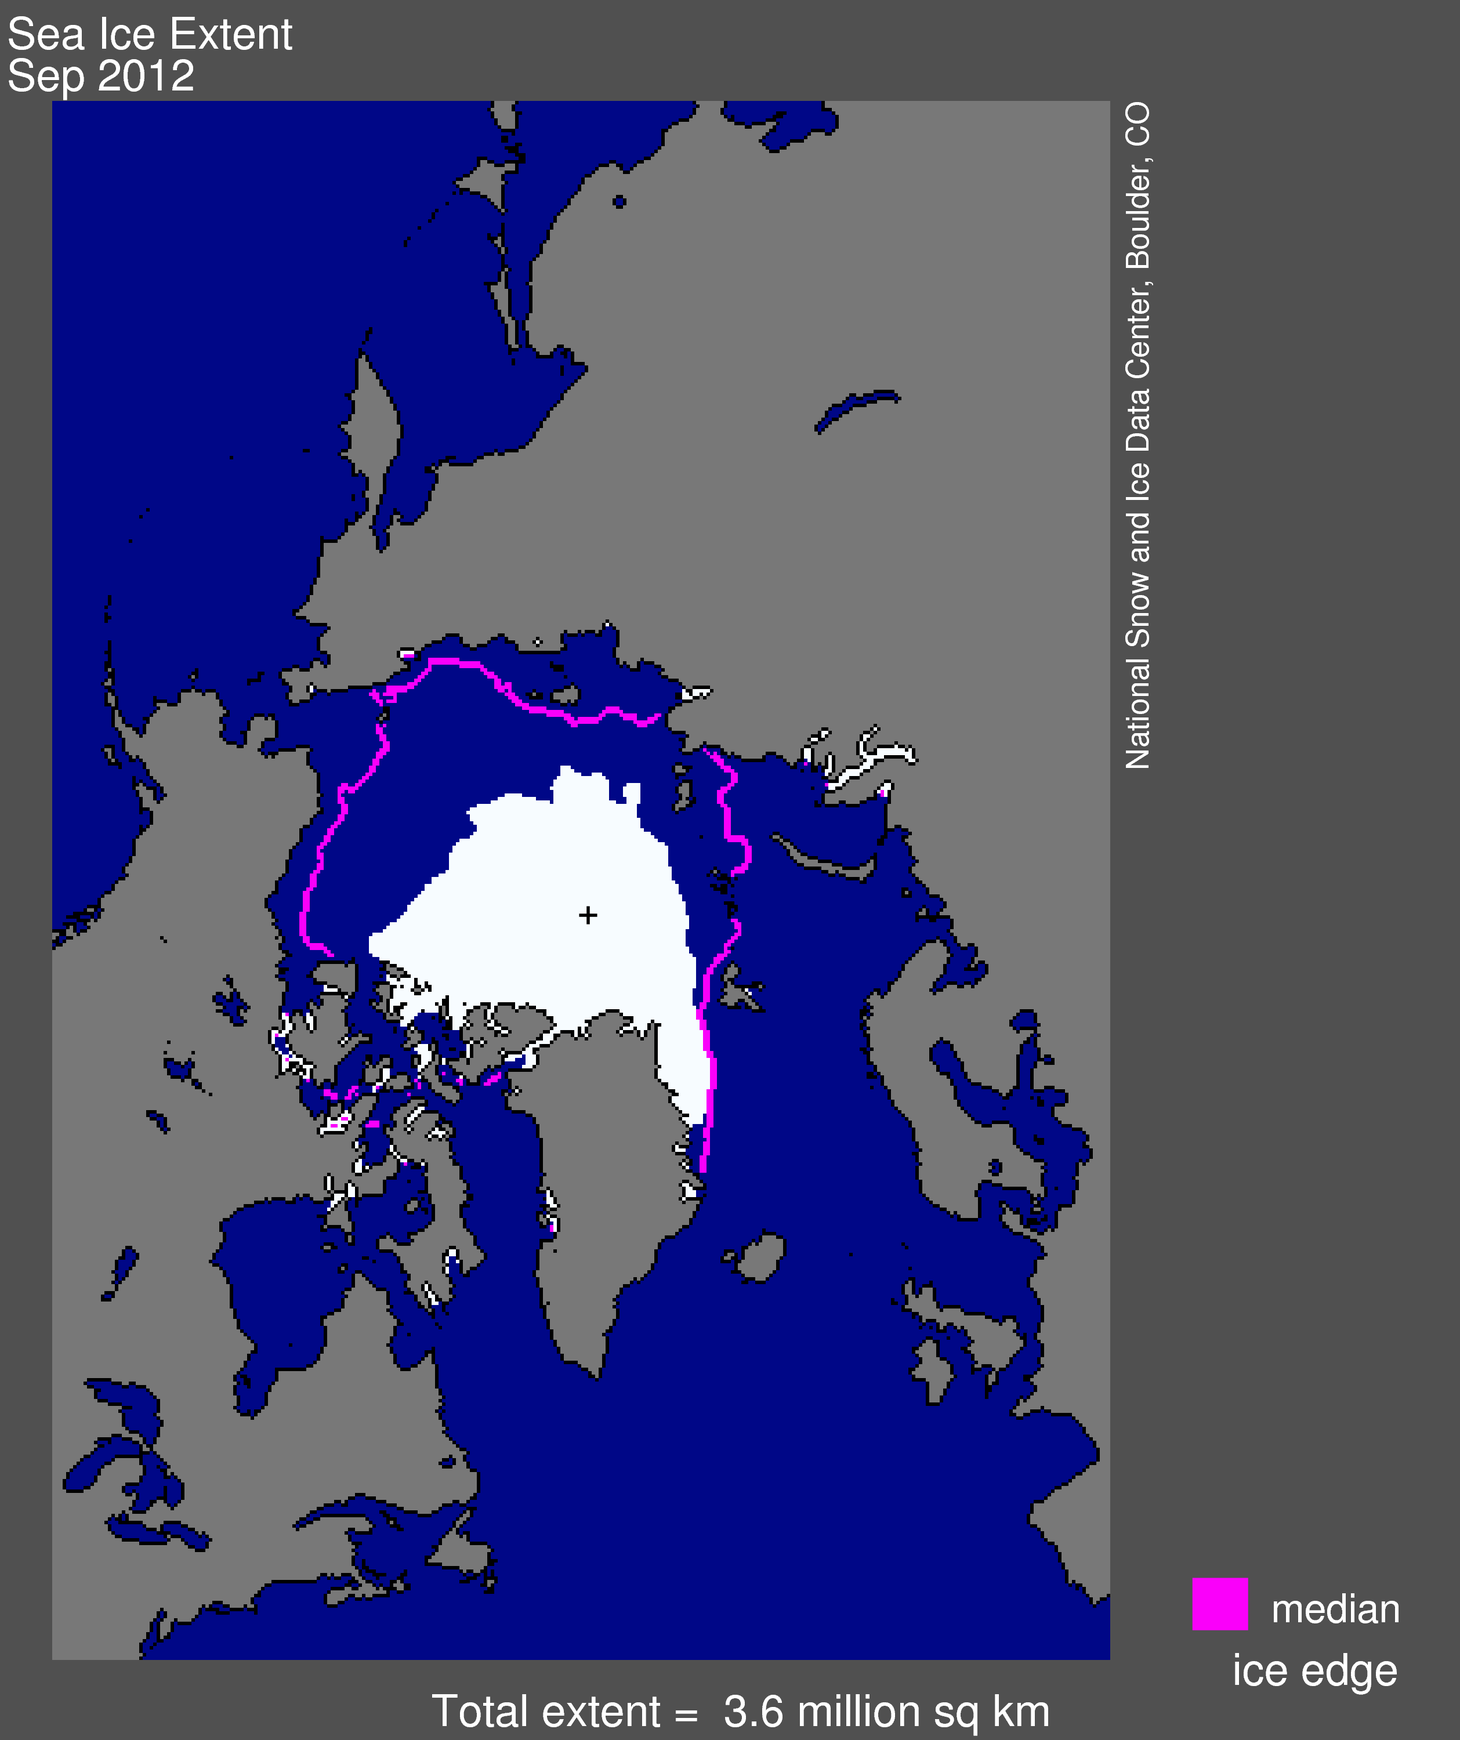
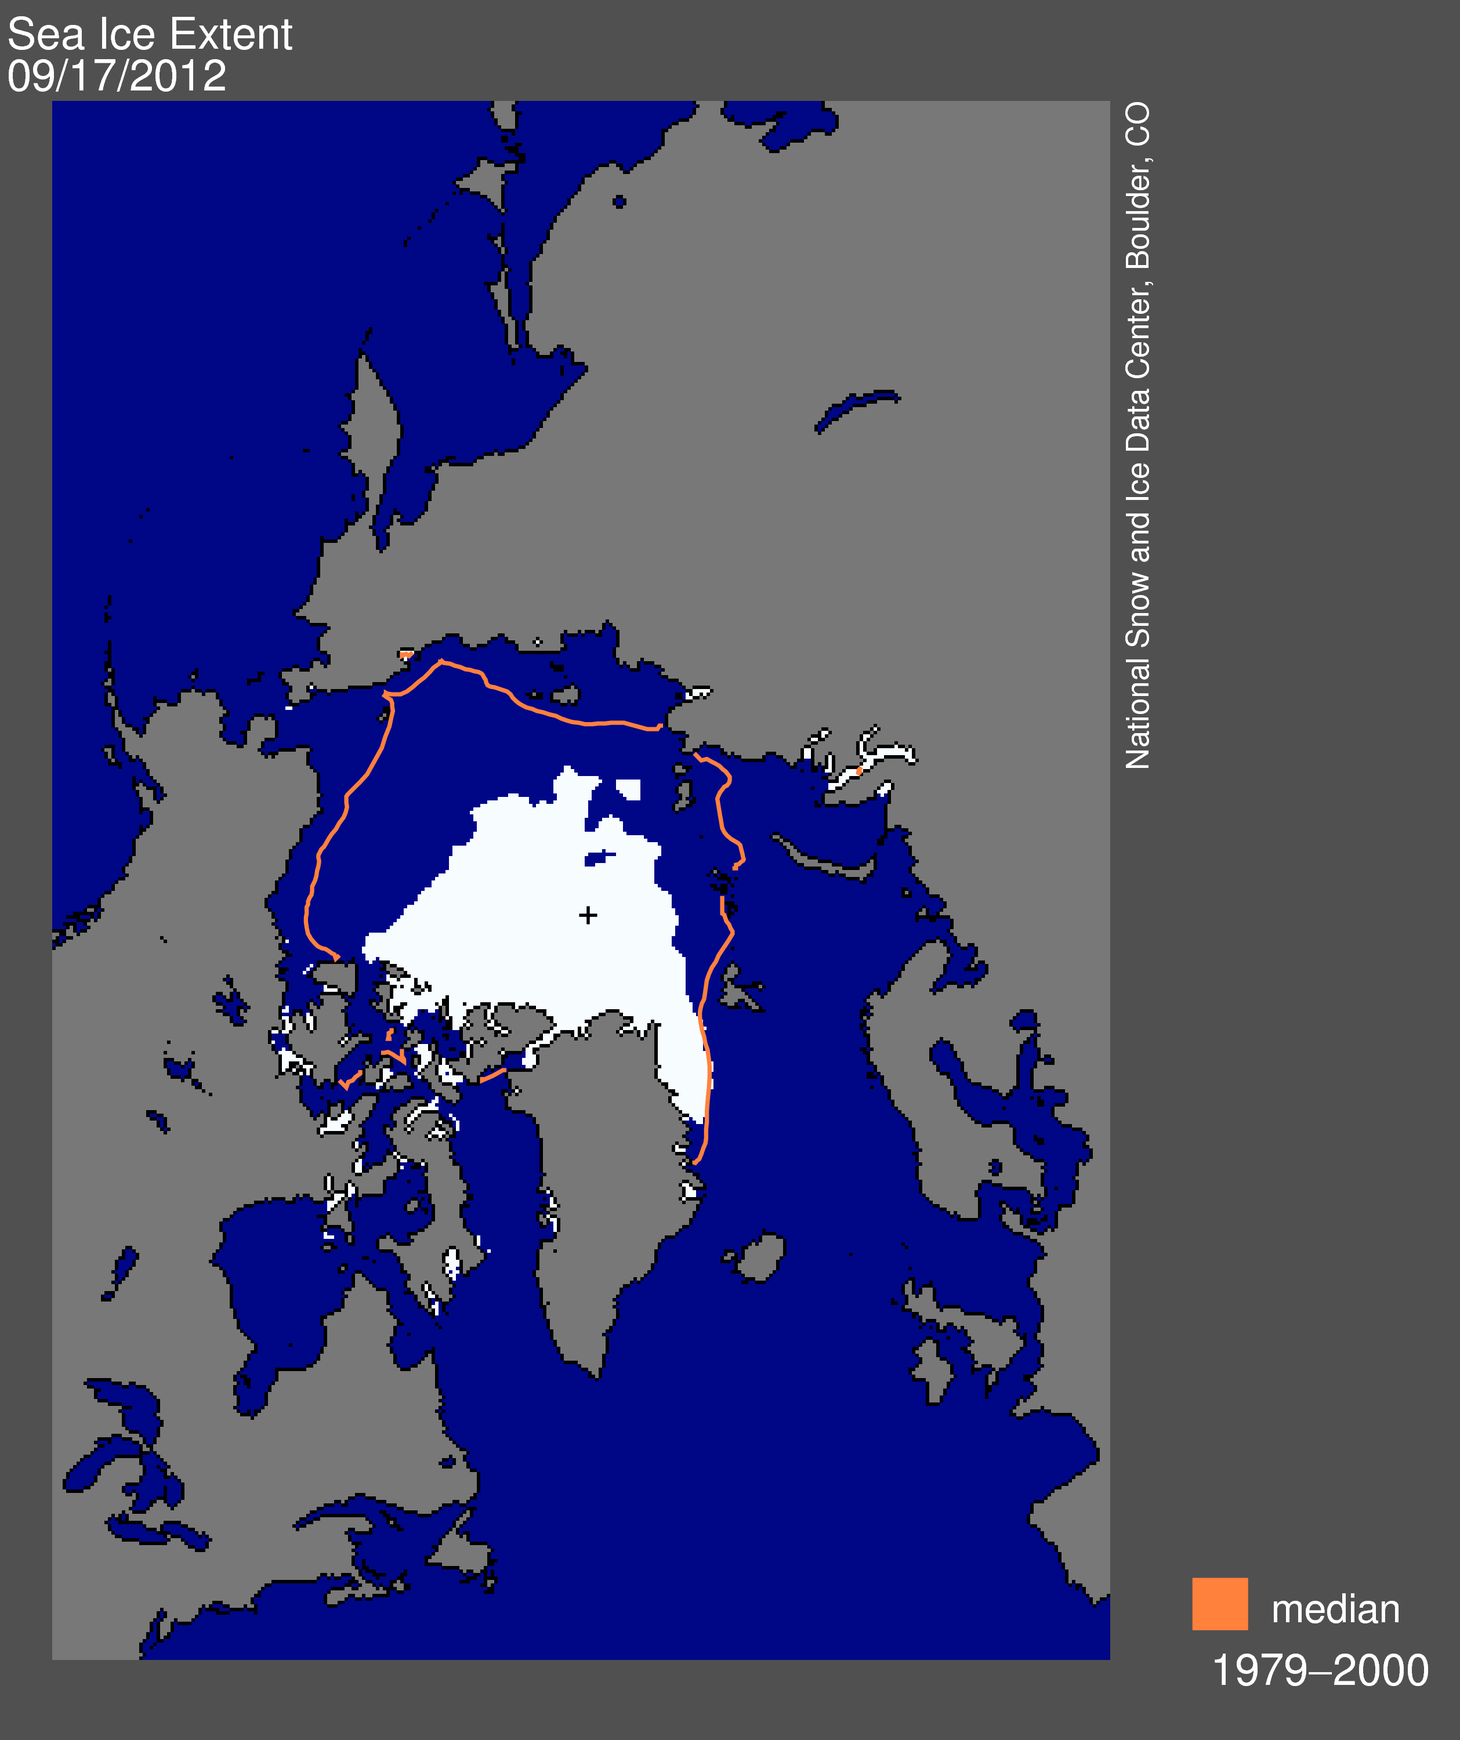
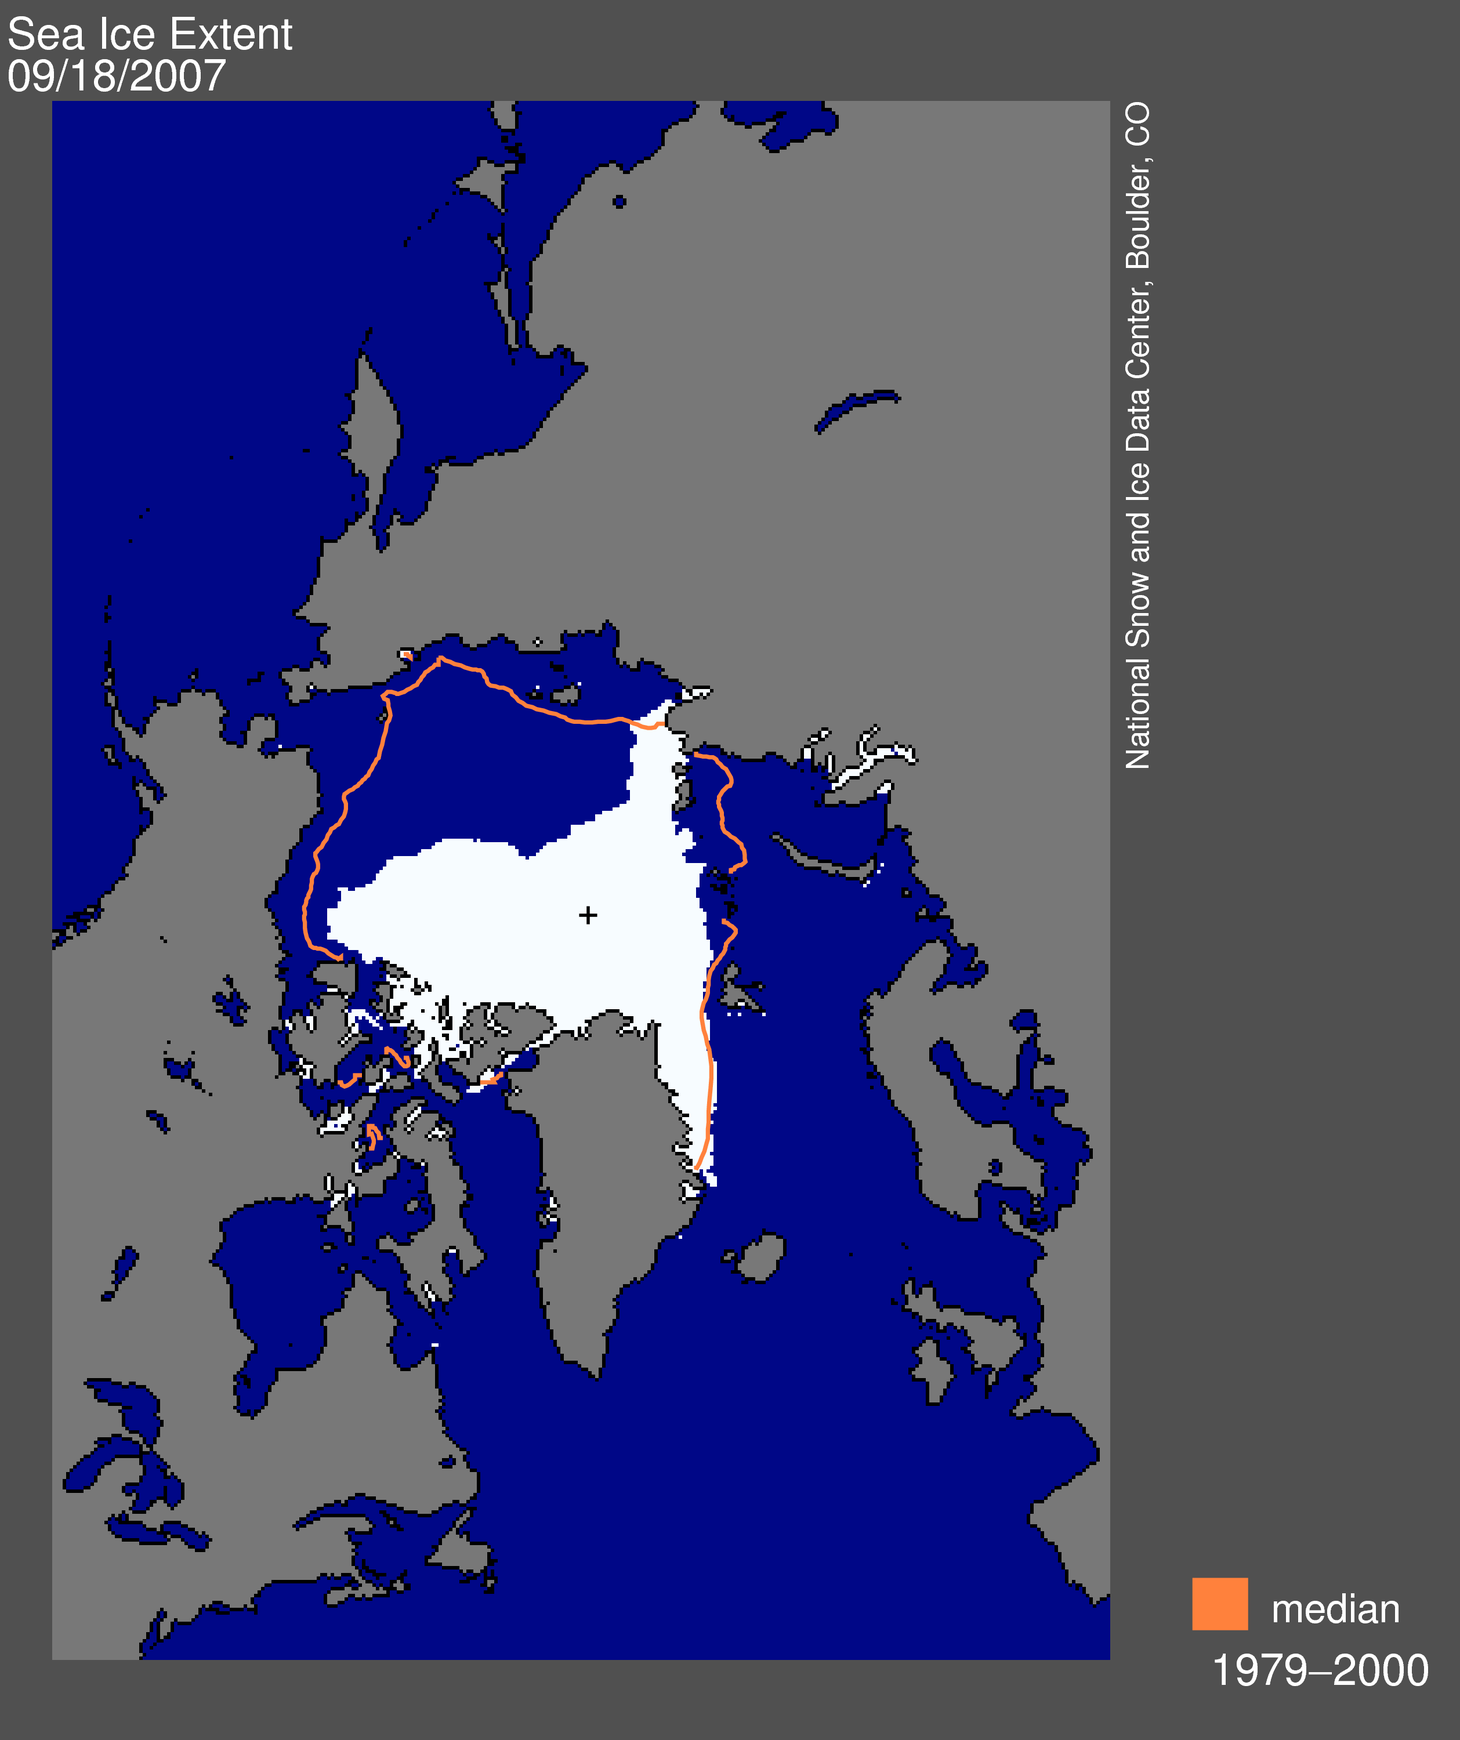
Figure 1. Arctic sea ice extent for January 2013 was 13.78 million square kilometers (5.32 million square miles). The magenta line shows the 1979 to 2000 median extent for that month. The black cross indicates the geographic North Pole. Sea Ice Index data. About the data

Credit: National Snow and Ice Data Center
High-resolution image

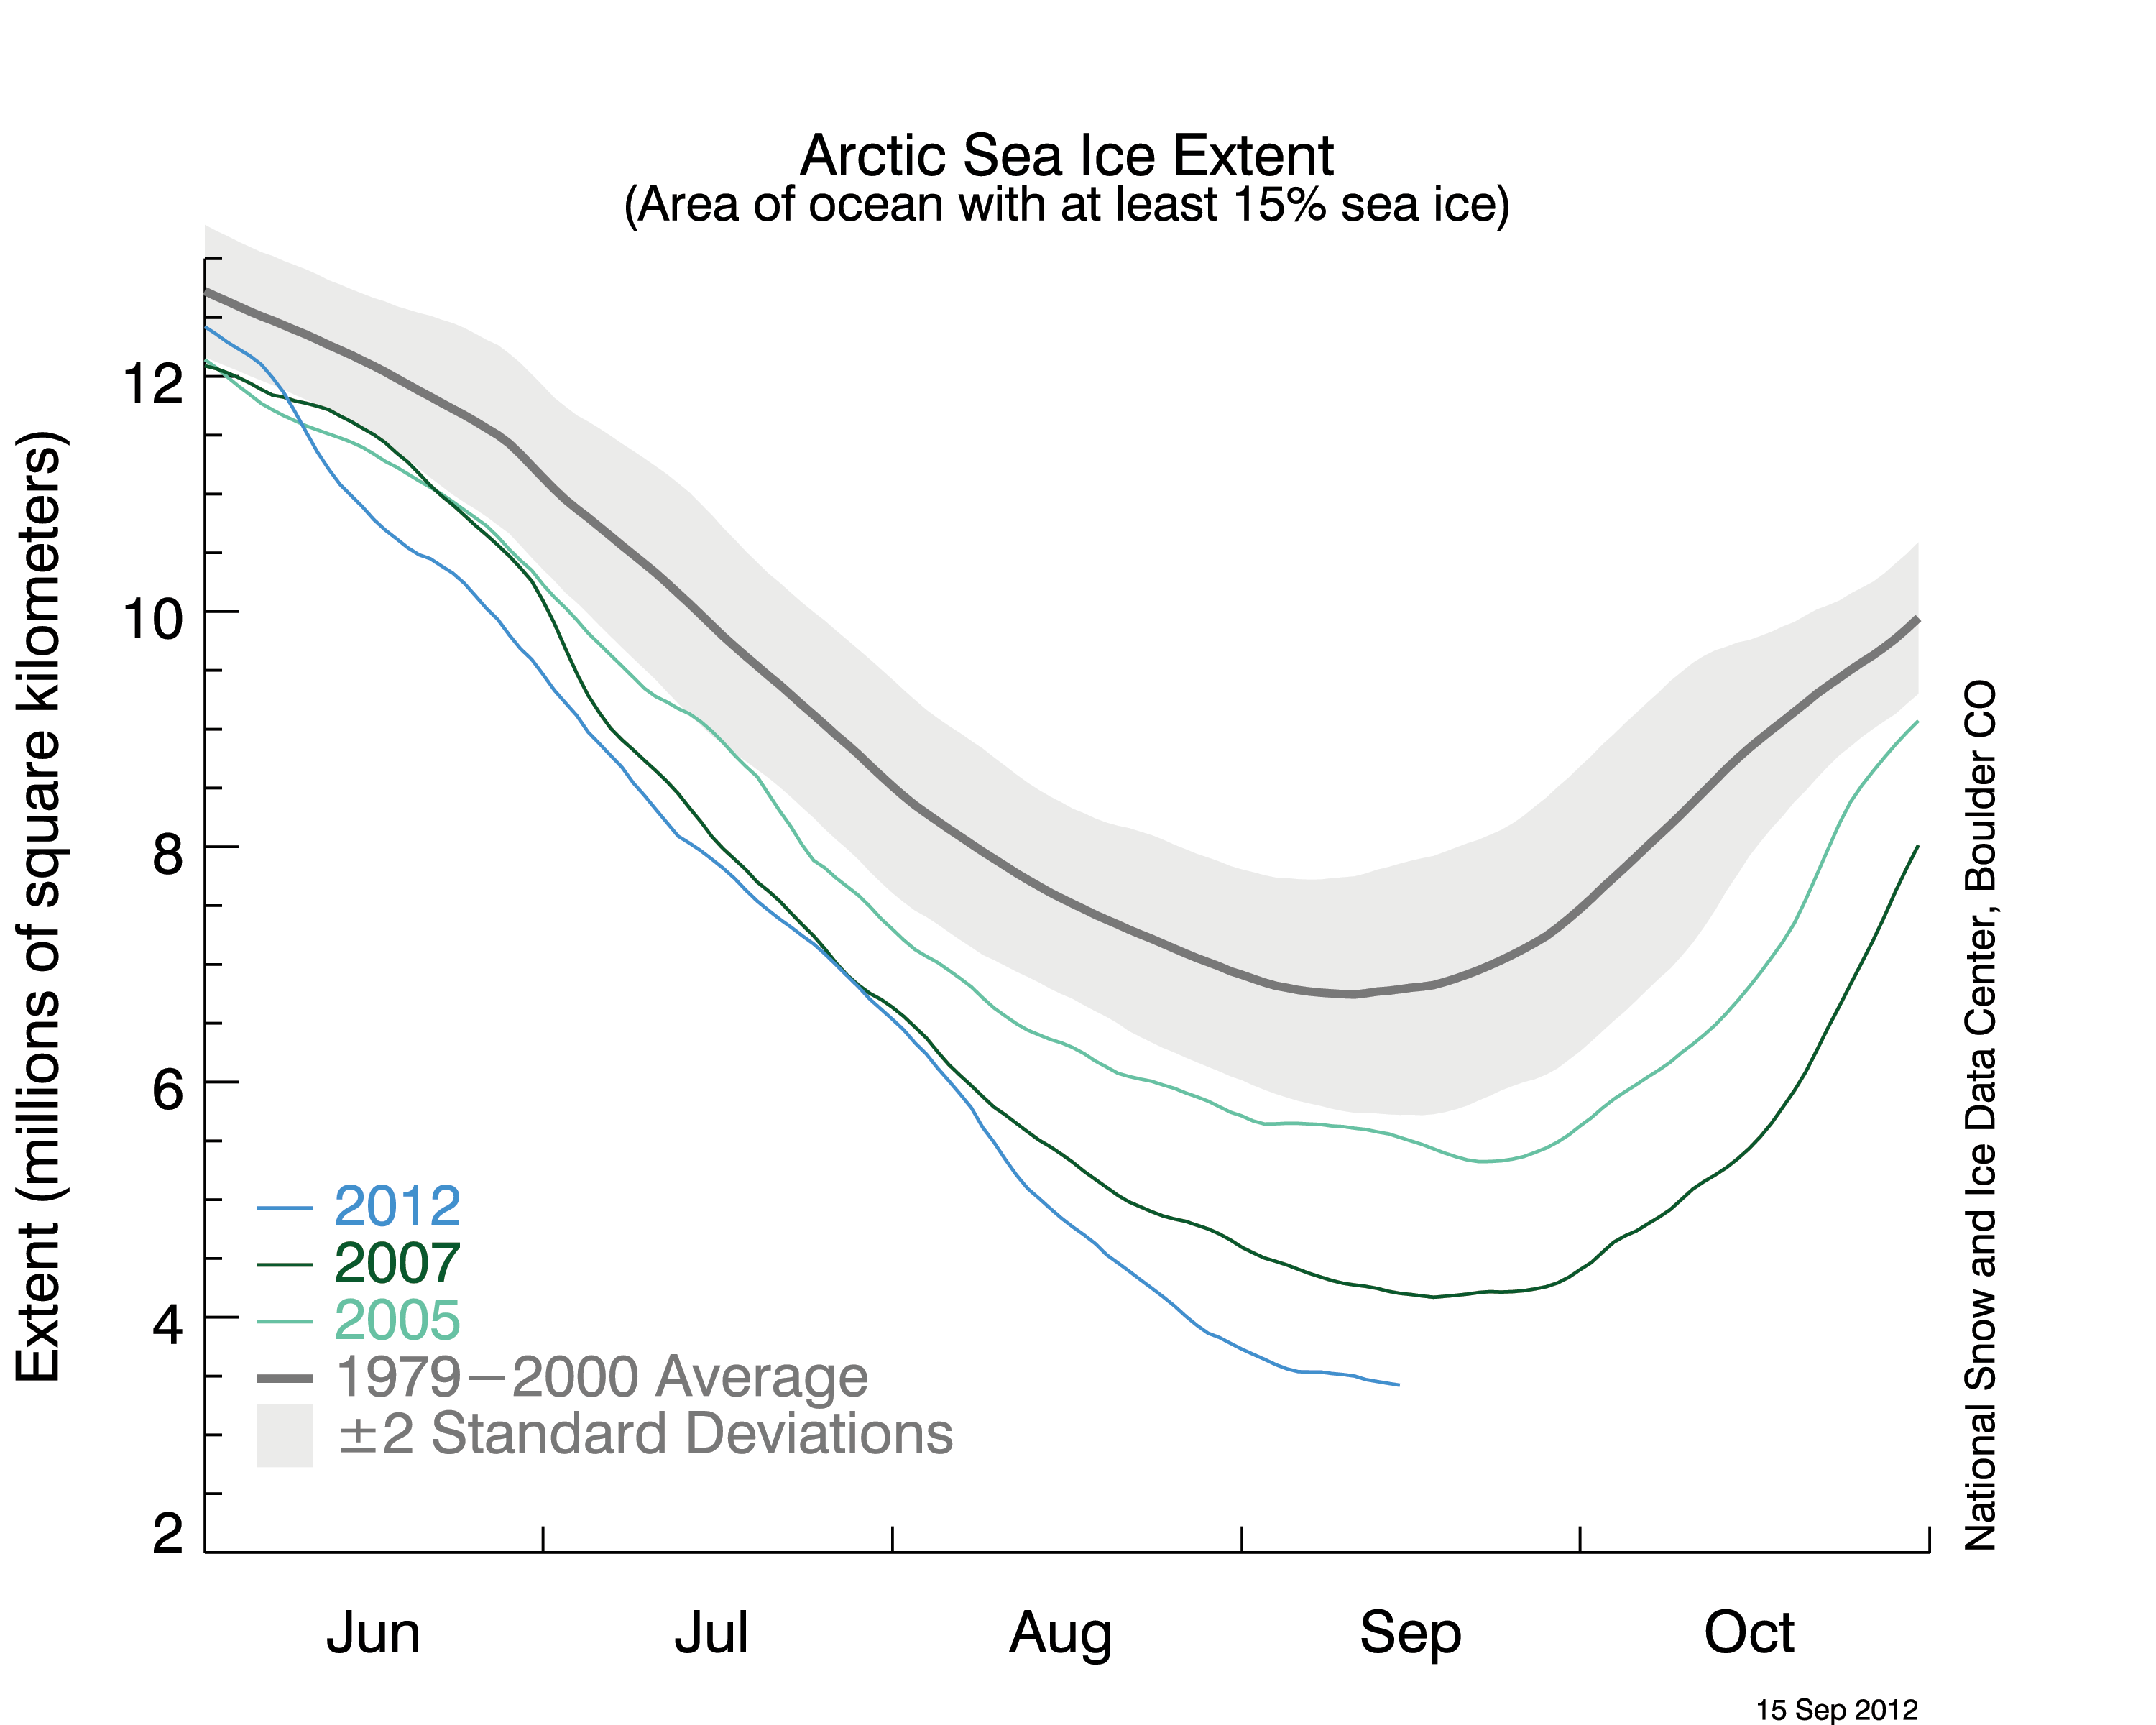
The average sea ice extent for January 2013 was 13.78 million square kilometers (5.32 million square miles). This is 1.06 million square kilometers (409,000 square miles) below the 1979 to 2000 average for the month, and is the sixth-lowest January extent in the satellite record. The last ten years (2004 to 2013) have seen the ten lowest January extents in the satellite record.

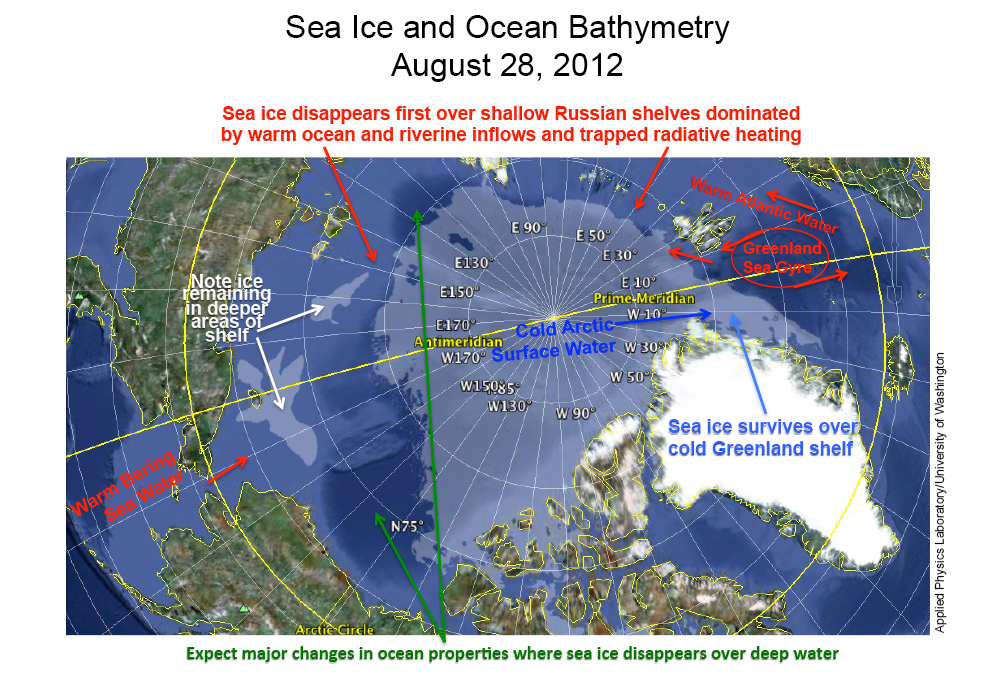
As has been the case throughout this winter, ice extent in the Atlantic sector of the Arctic Ocean remained far below average. While the Kara Sea was completely iced over, nearly all of the Barents Sea remained ice free, and open water was present north of the Svalbard Archipelago. The lack of winter ice in the Barents Sea and the vicinity of Svalbard has been a common feature of recent years. Recent work by Vladimir Alexeev and colleagues at the University of Alaska Fairbanks provides further evidence that this is related to a stronger inflow of warm waters from the Atlantic as compared to past decades. On the Pacific side, the ice edge in the Bering Sea continued to extend slightly further to the south than usual.

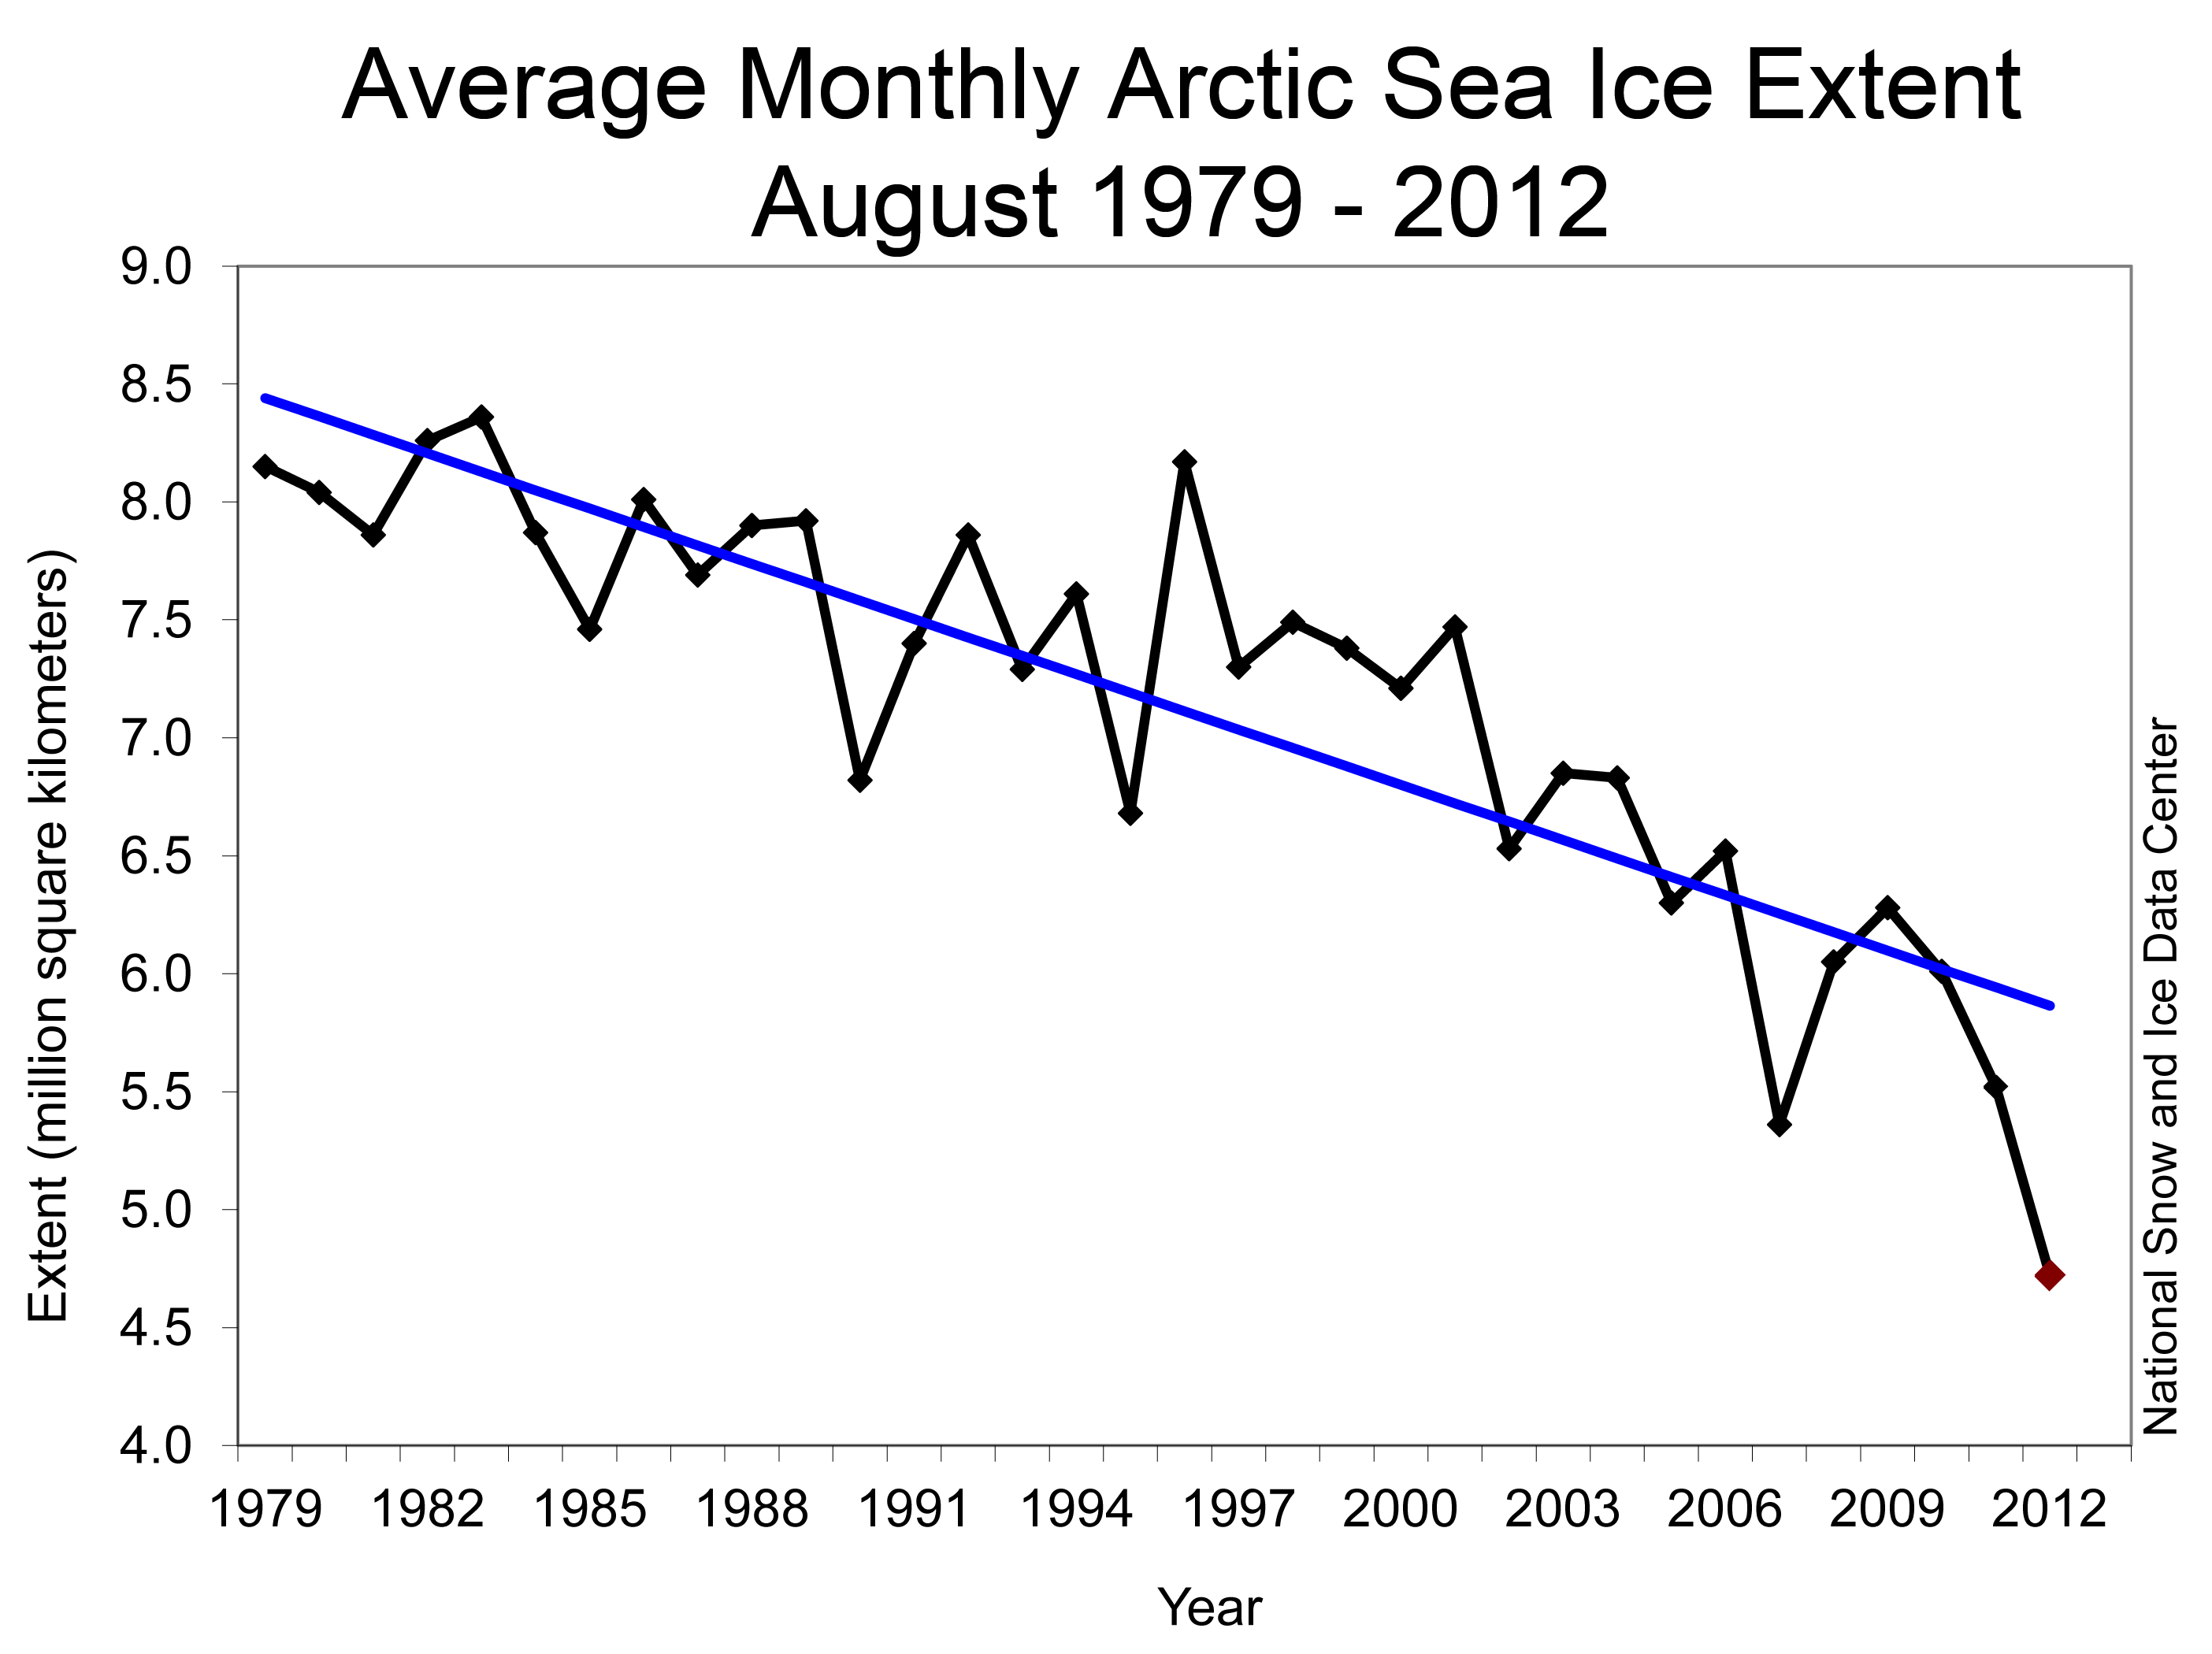
Also, a new paper by Jinlin Zhang and colleagues at the University of Washington analyzed the effect of the strong August 2012 cyclone on last year’s record sea ice minimum. While they found a large effect in the immediate wake of the storm, the effect declined quickly and overall it had only a small effect on the final September minimum extent.

Conditions in context

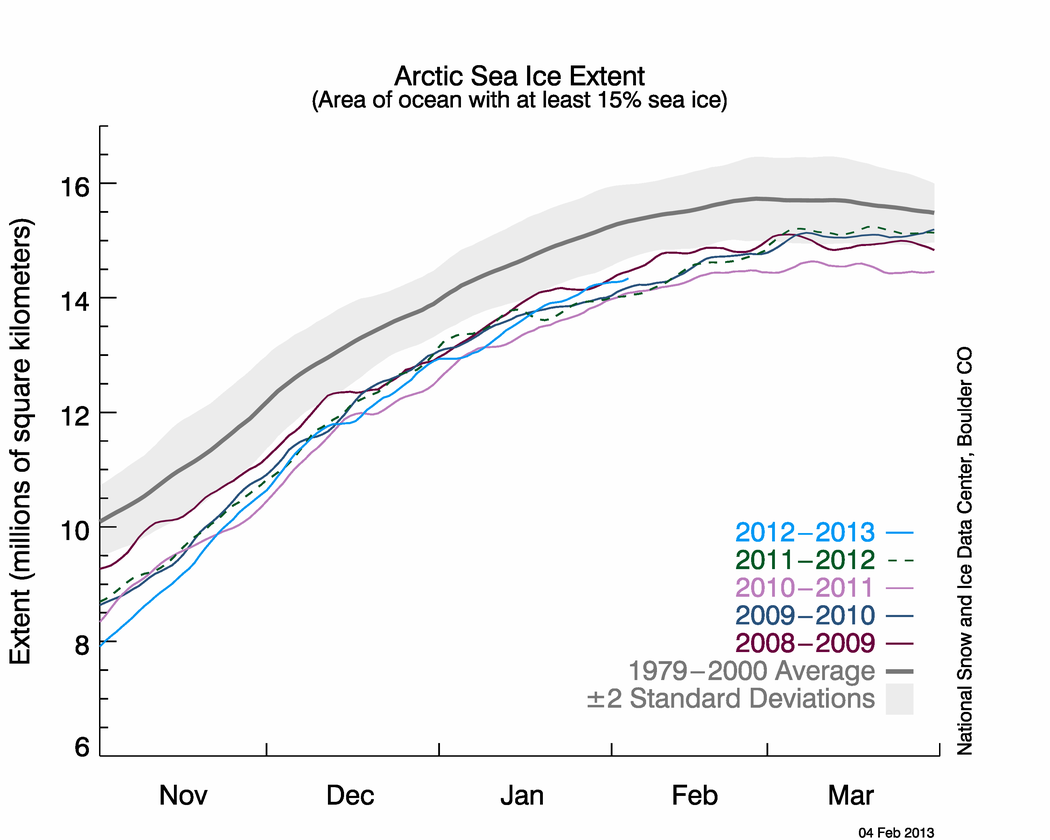
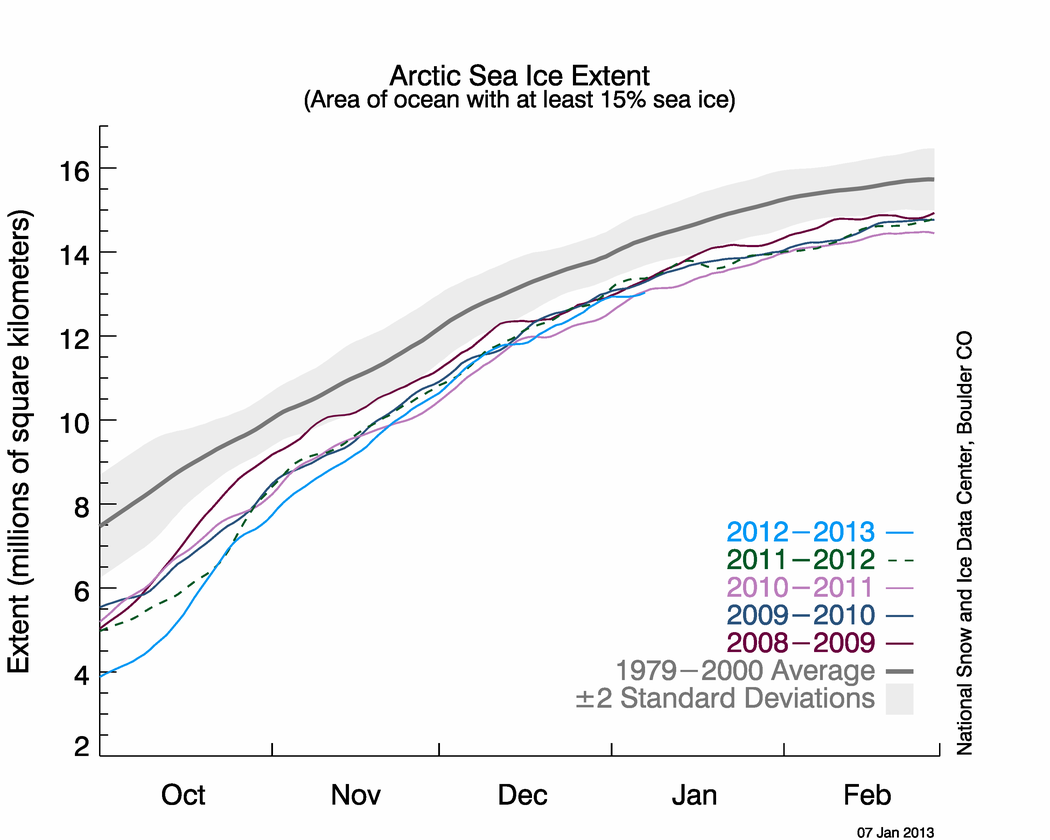
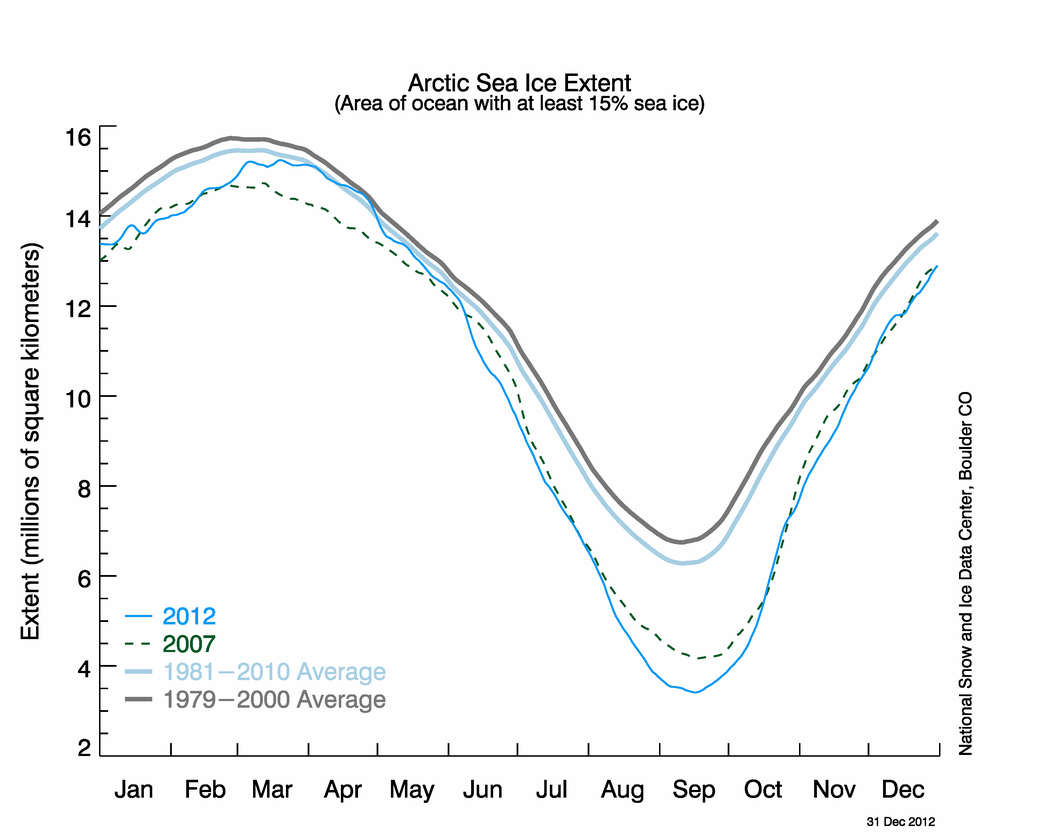
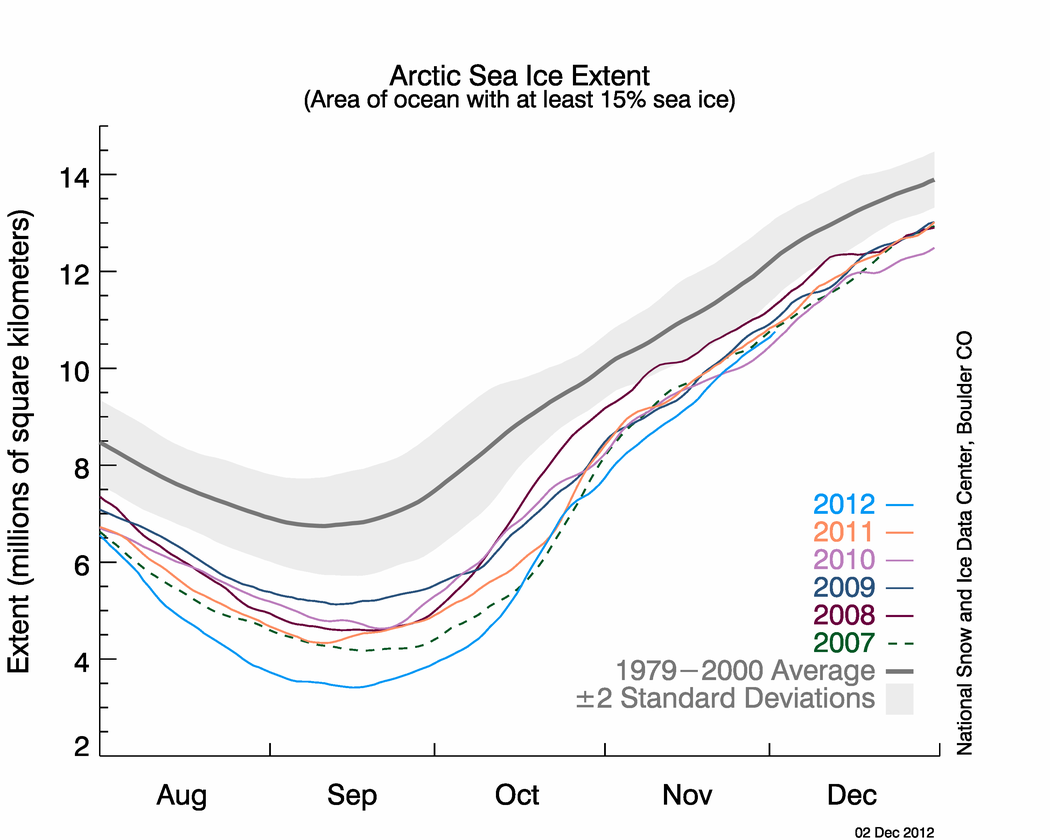
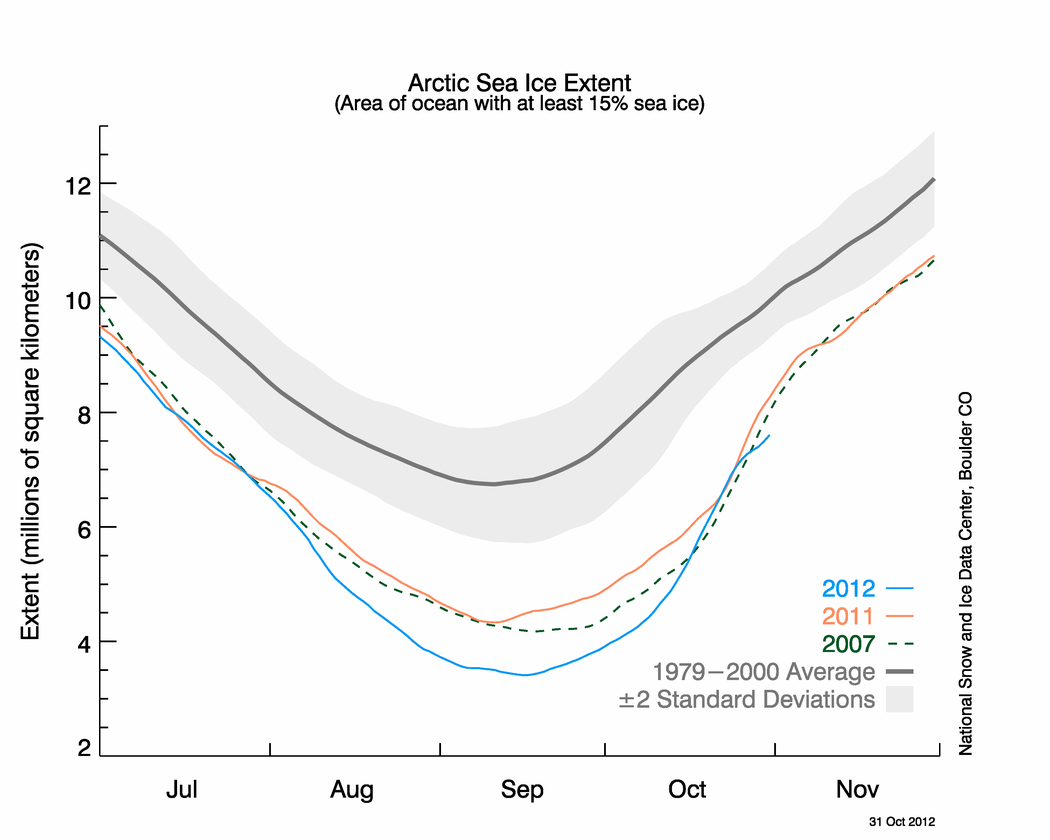
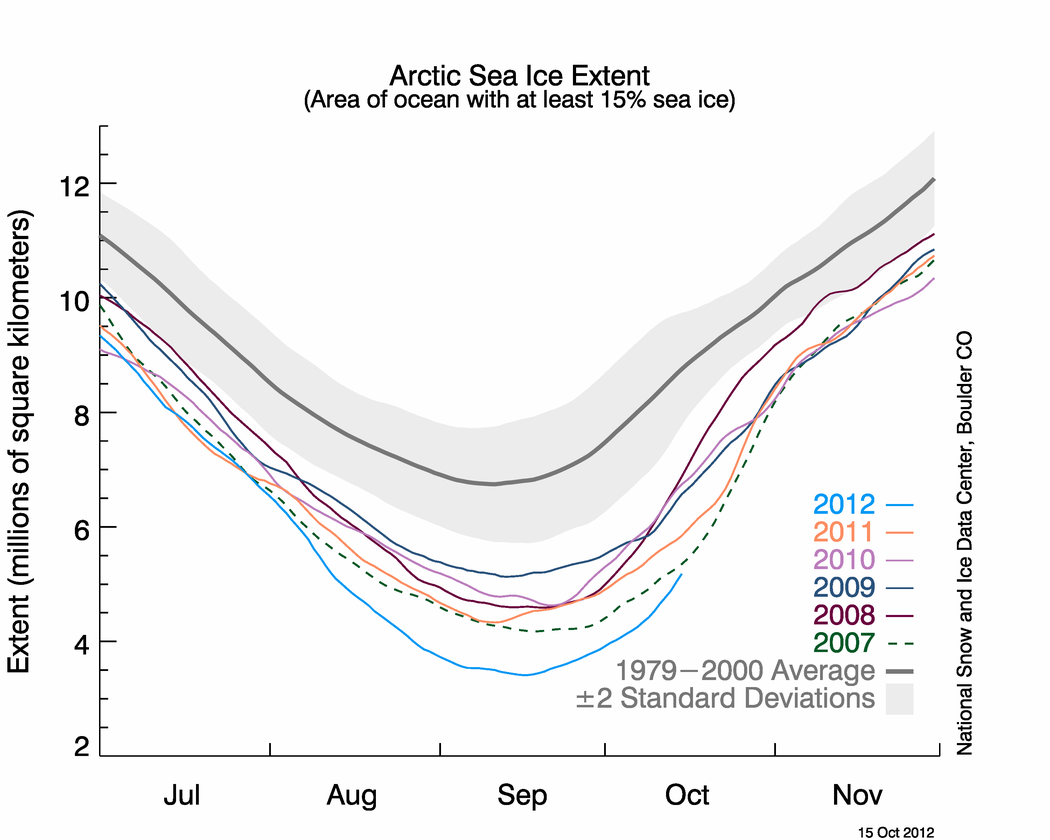
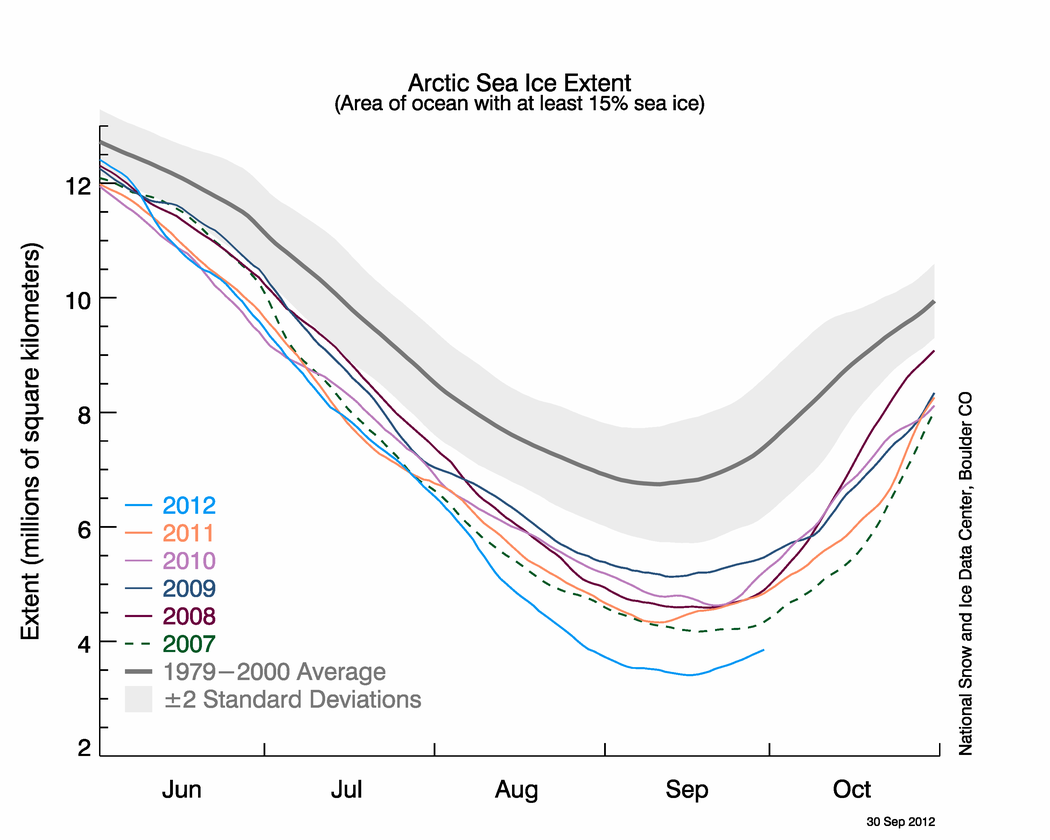
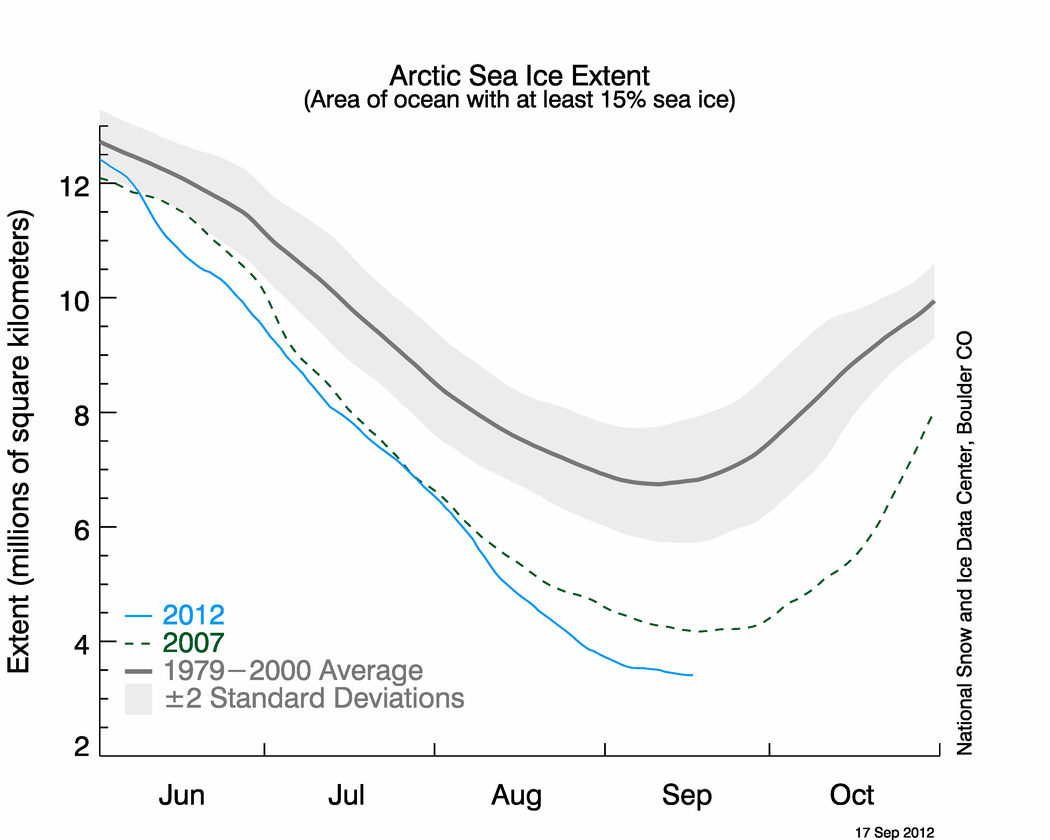
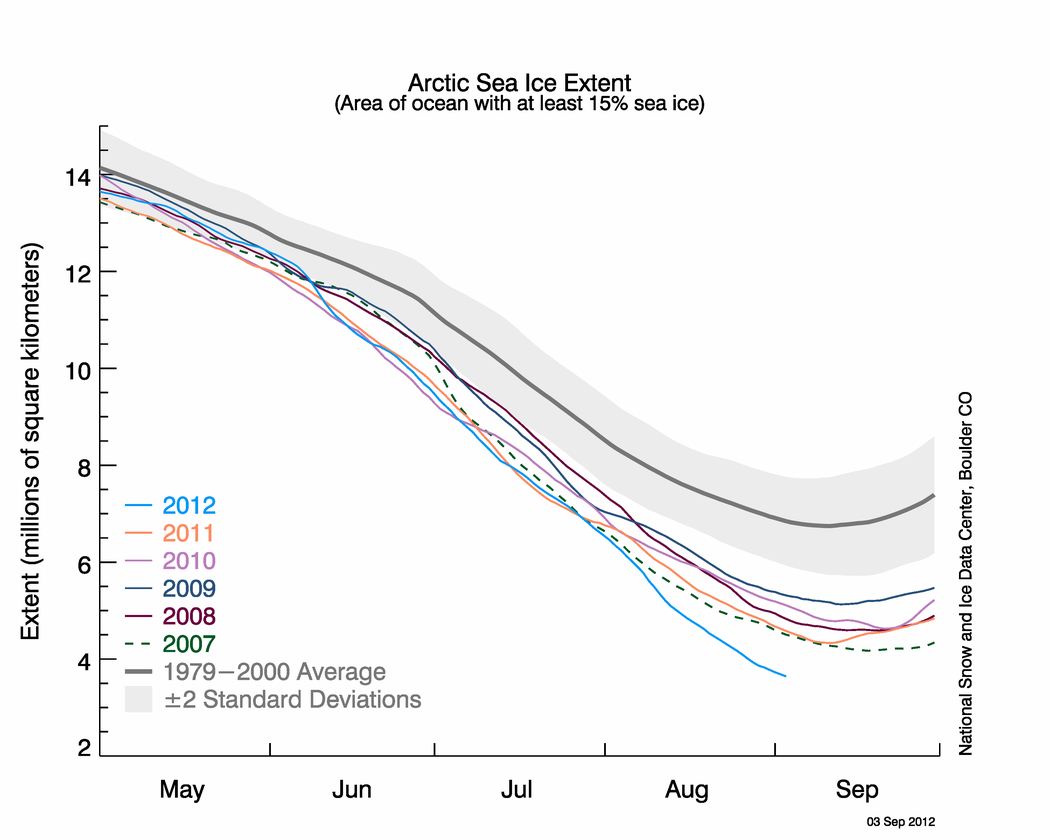
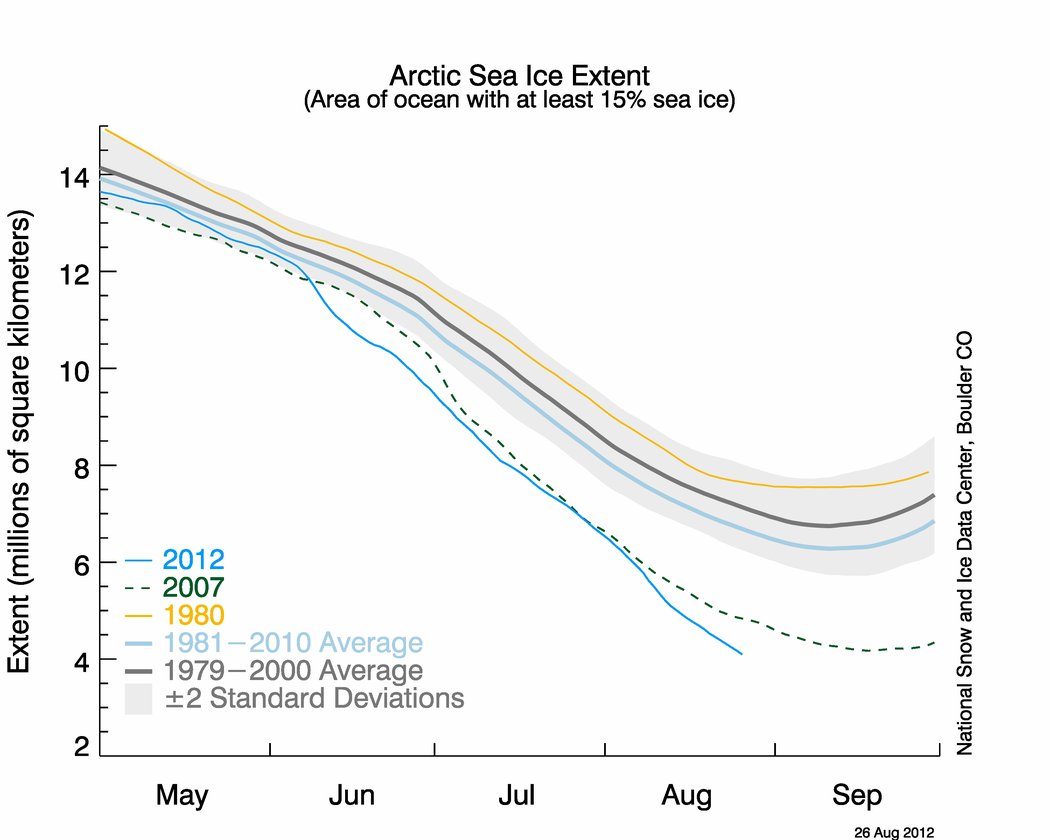
Figure 2. The graph above shows Arctic sea ice extent as of February 4, 2013, along with daily ice extent data for the previous five years. 2012 to 2013 is shown in blue, 2011 to 2012 in green, 2010 to 2011 in pink, 2009 to 2010 in navy, and 2008 to 2009 in purple. The 1979 to 2000 average is in dark gray. The gray area around this average line shows the two standard deviation range of the data. Sea Ice Index data.

Credit: National Snow and Ice Data Center
High-resolution image

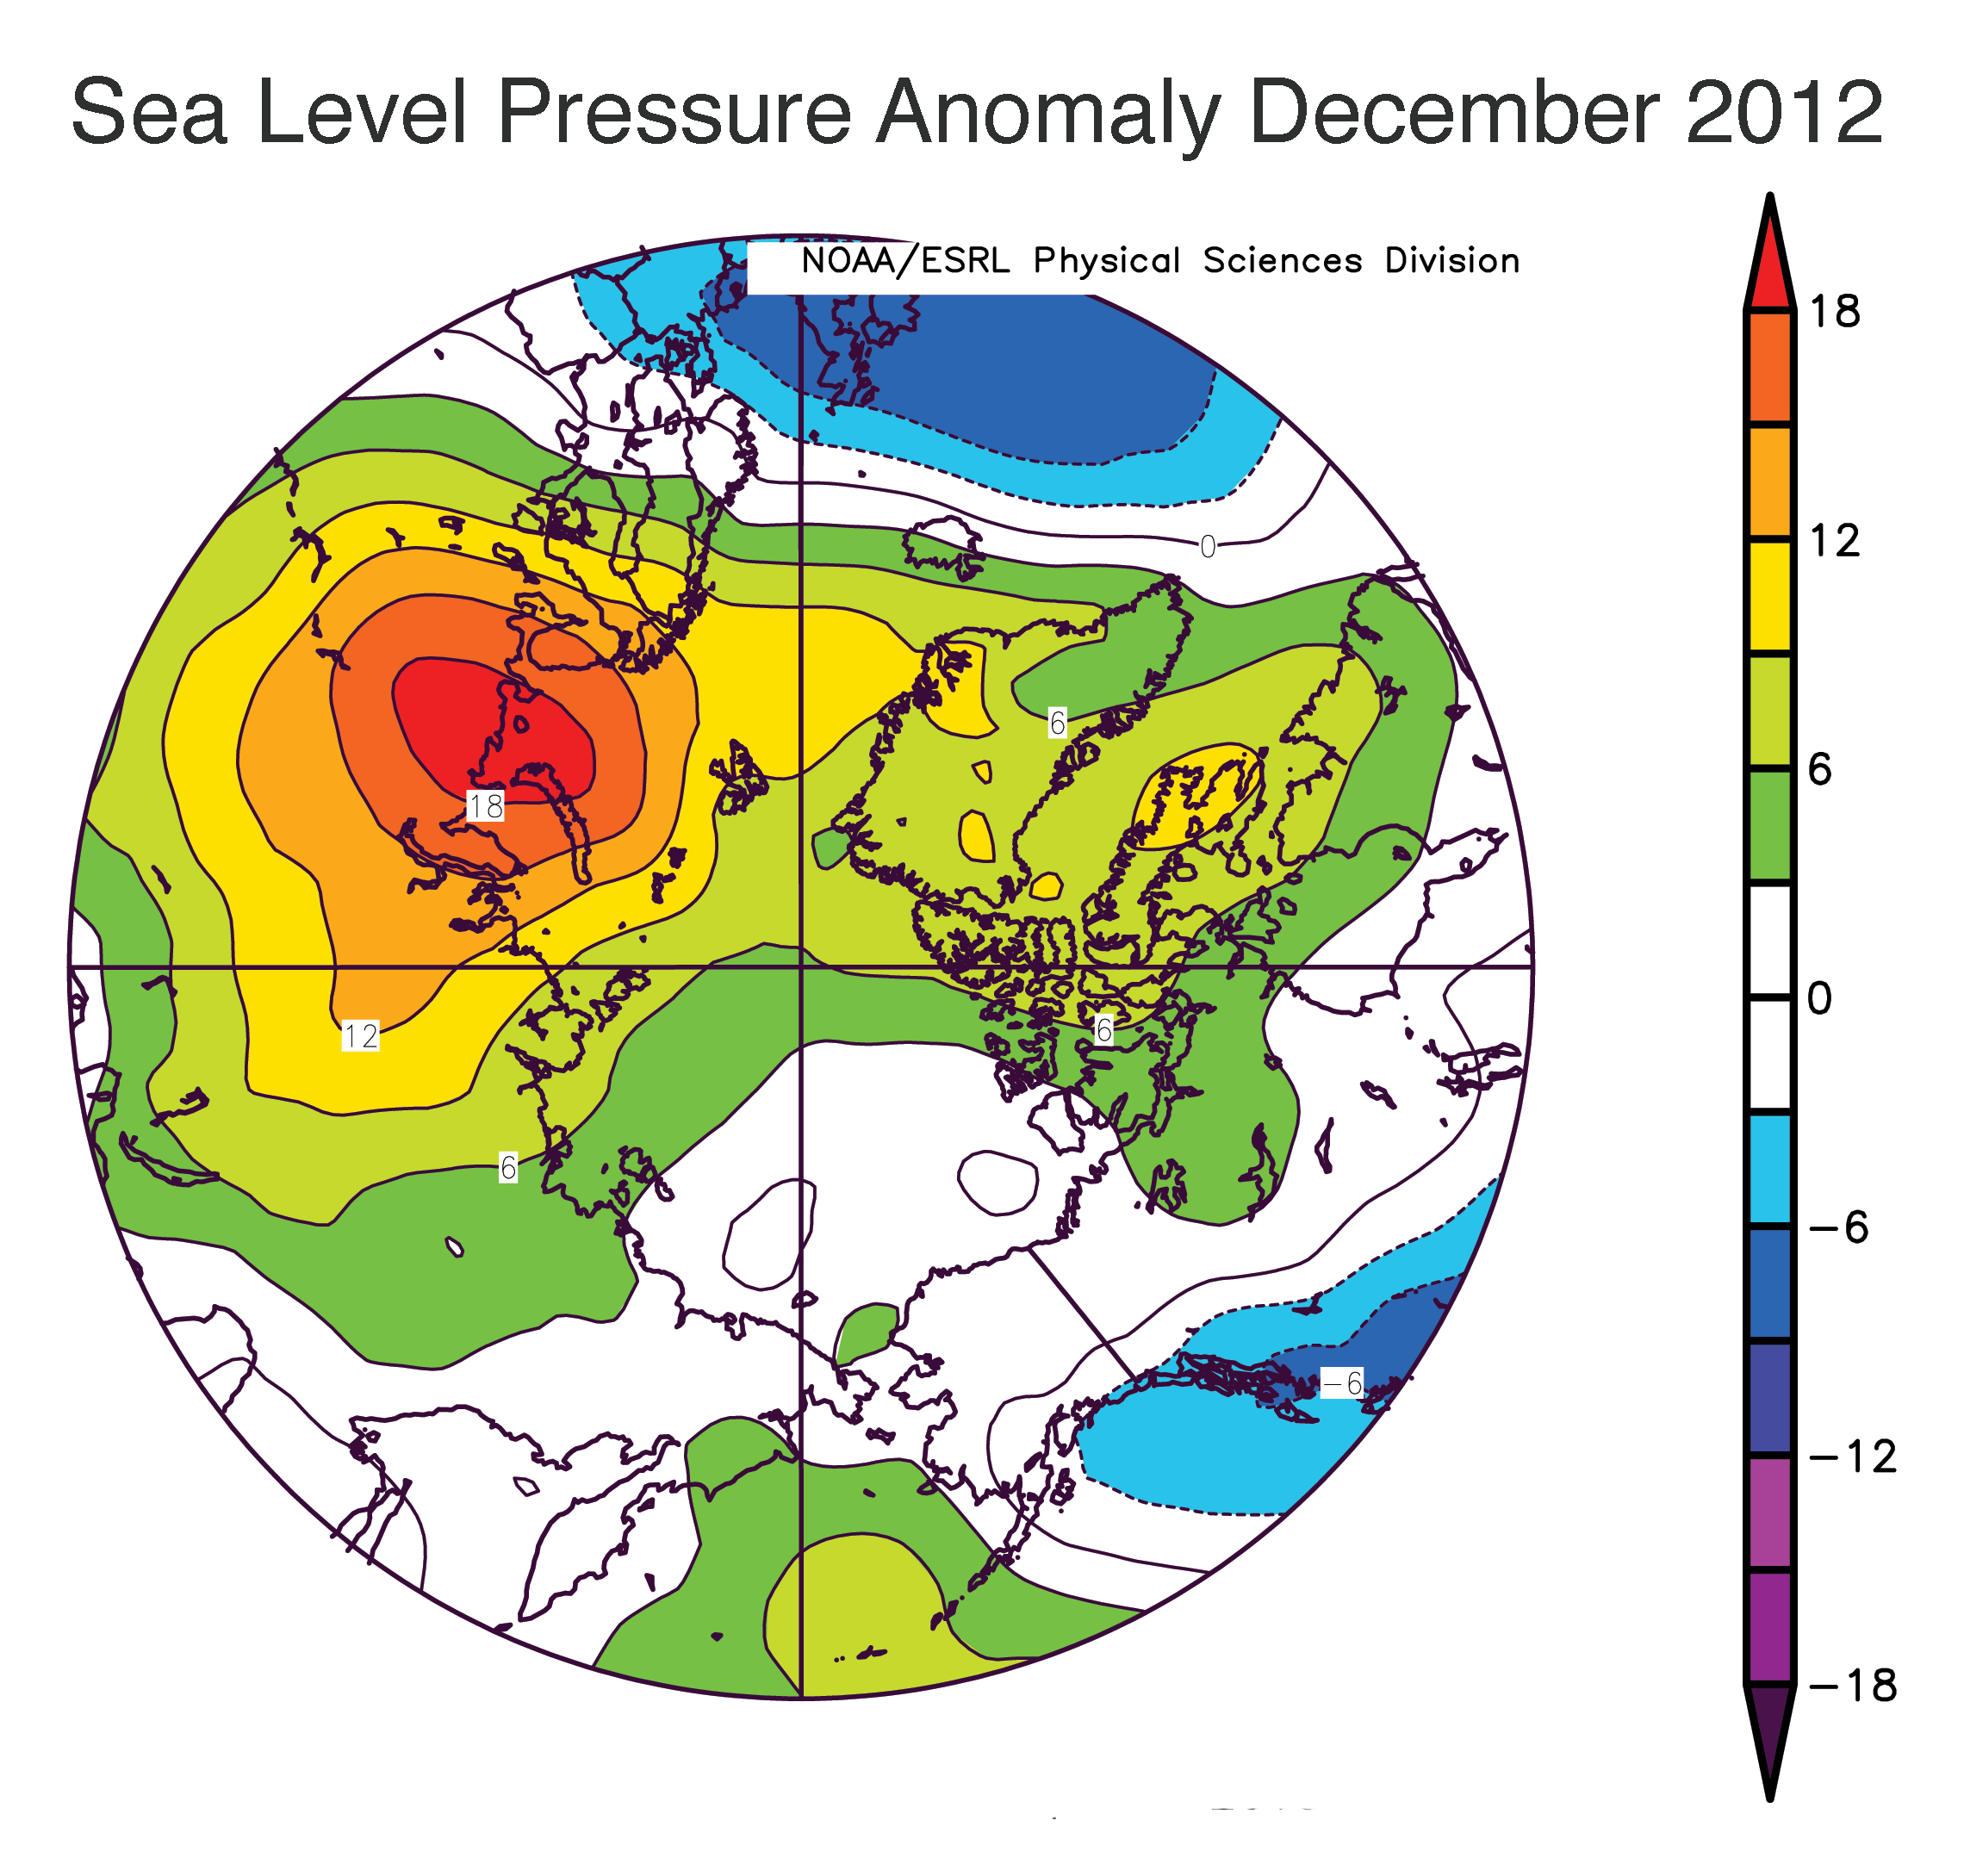
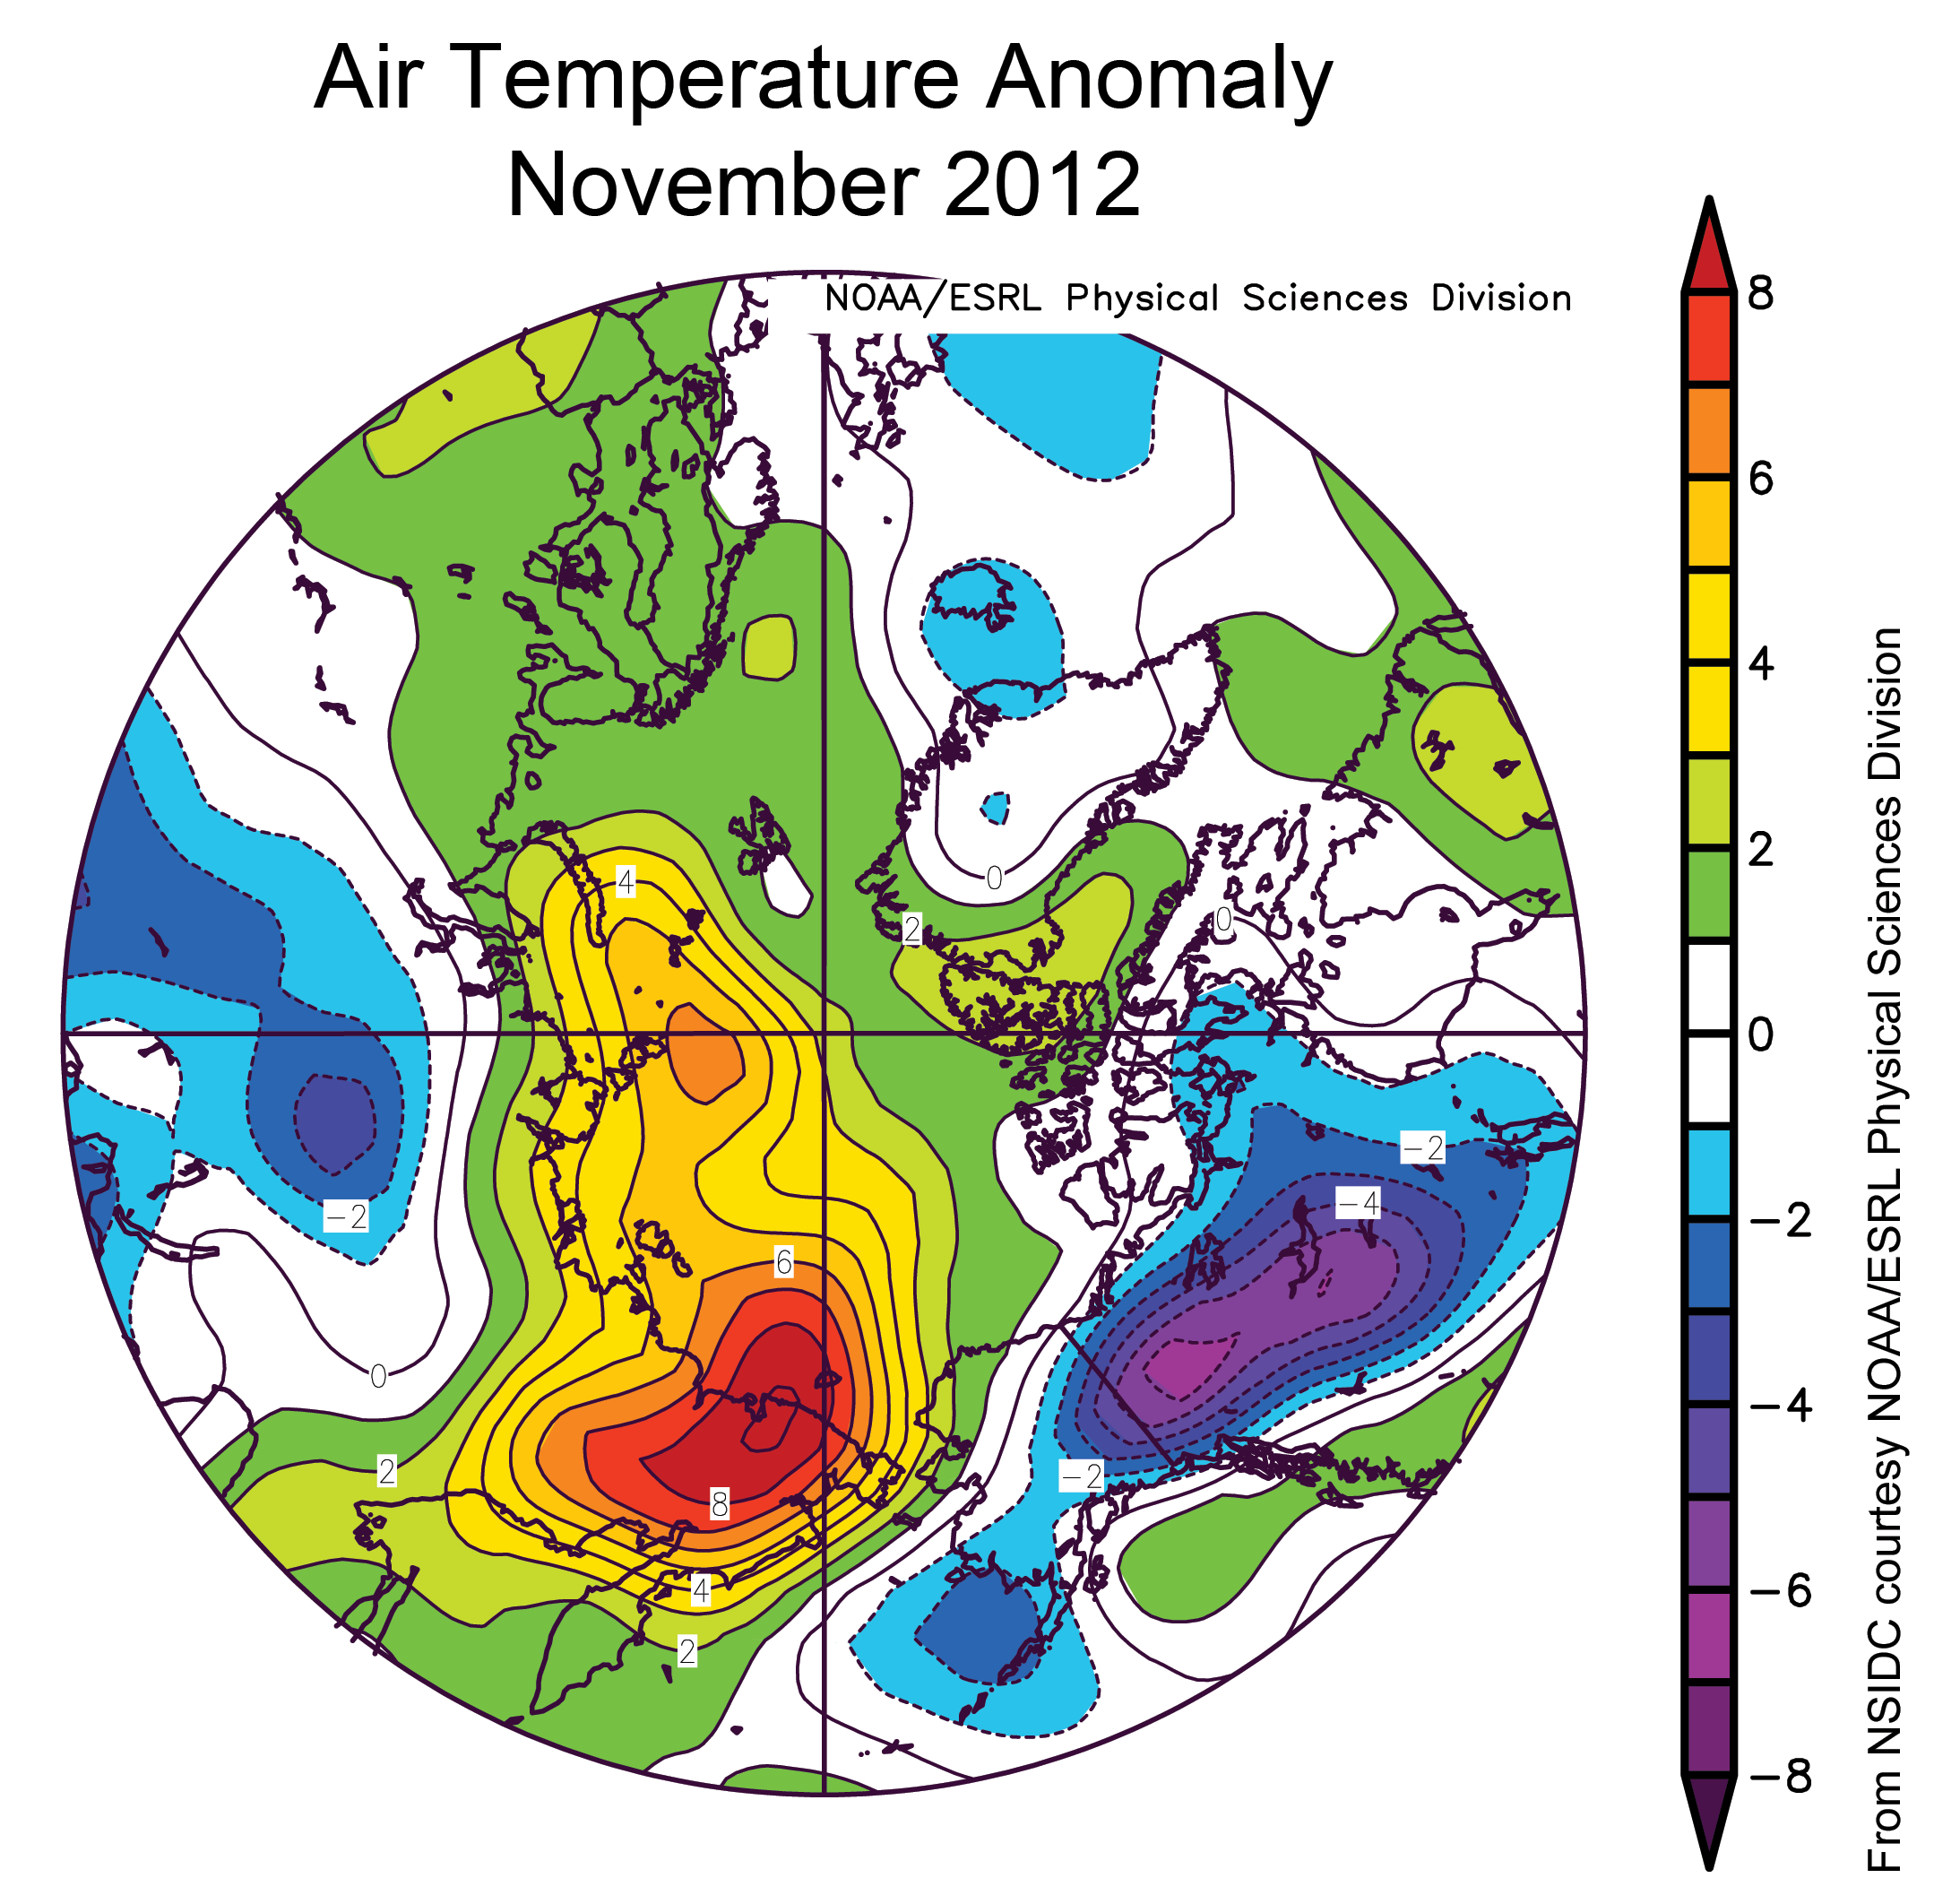
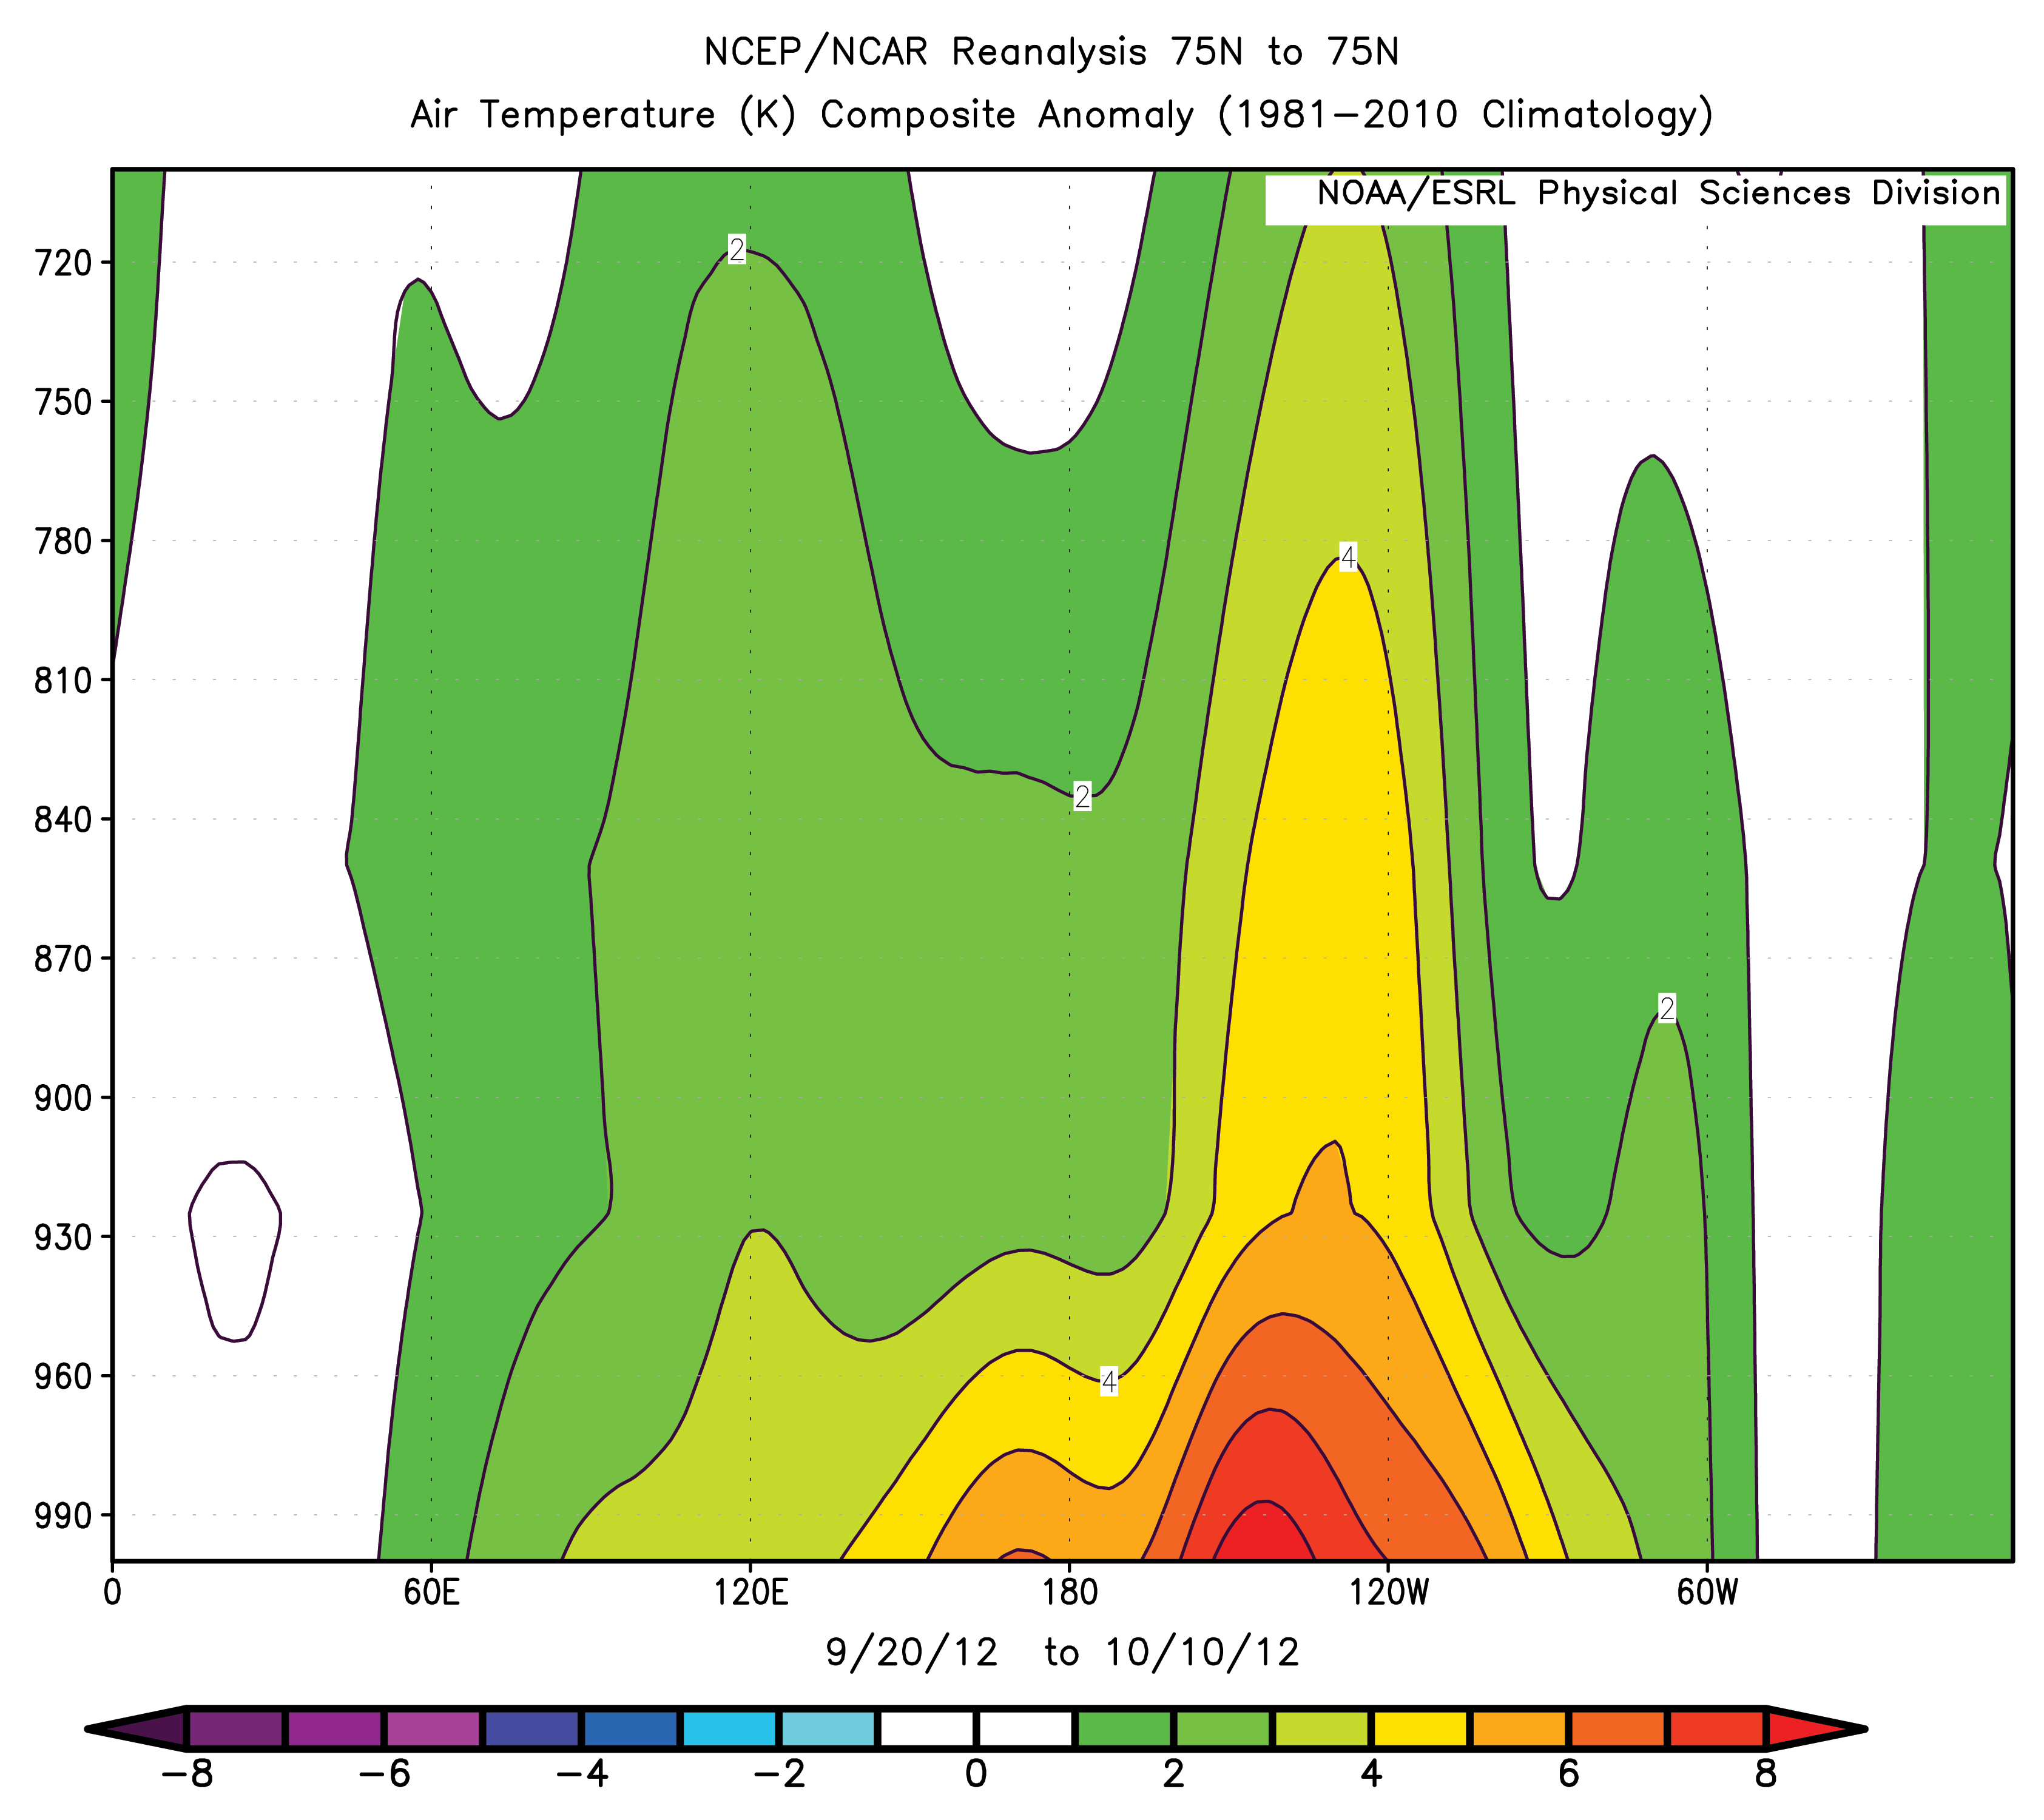
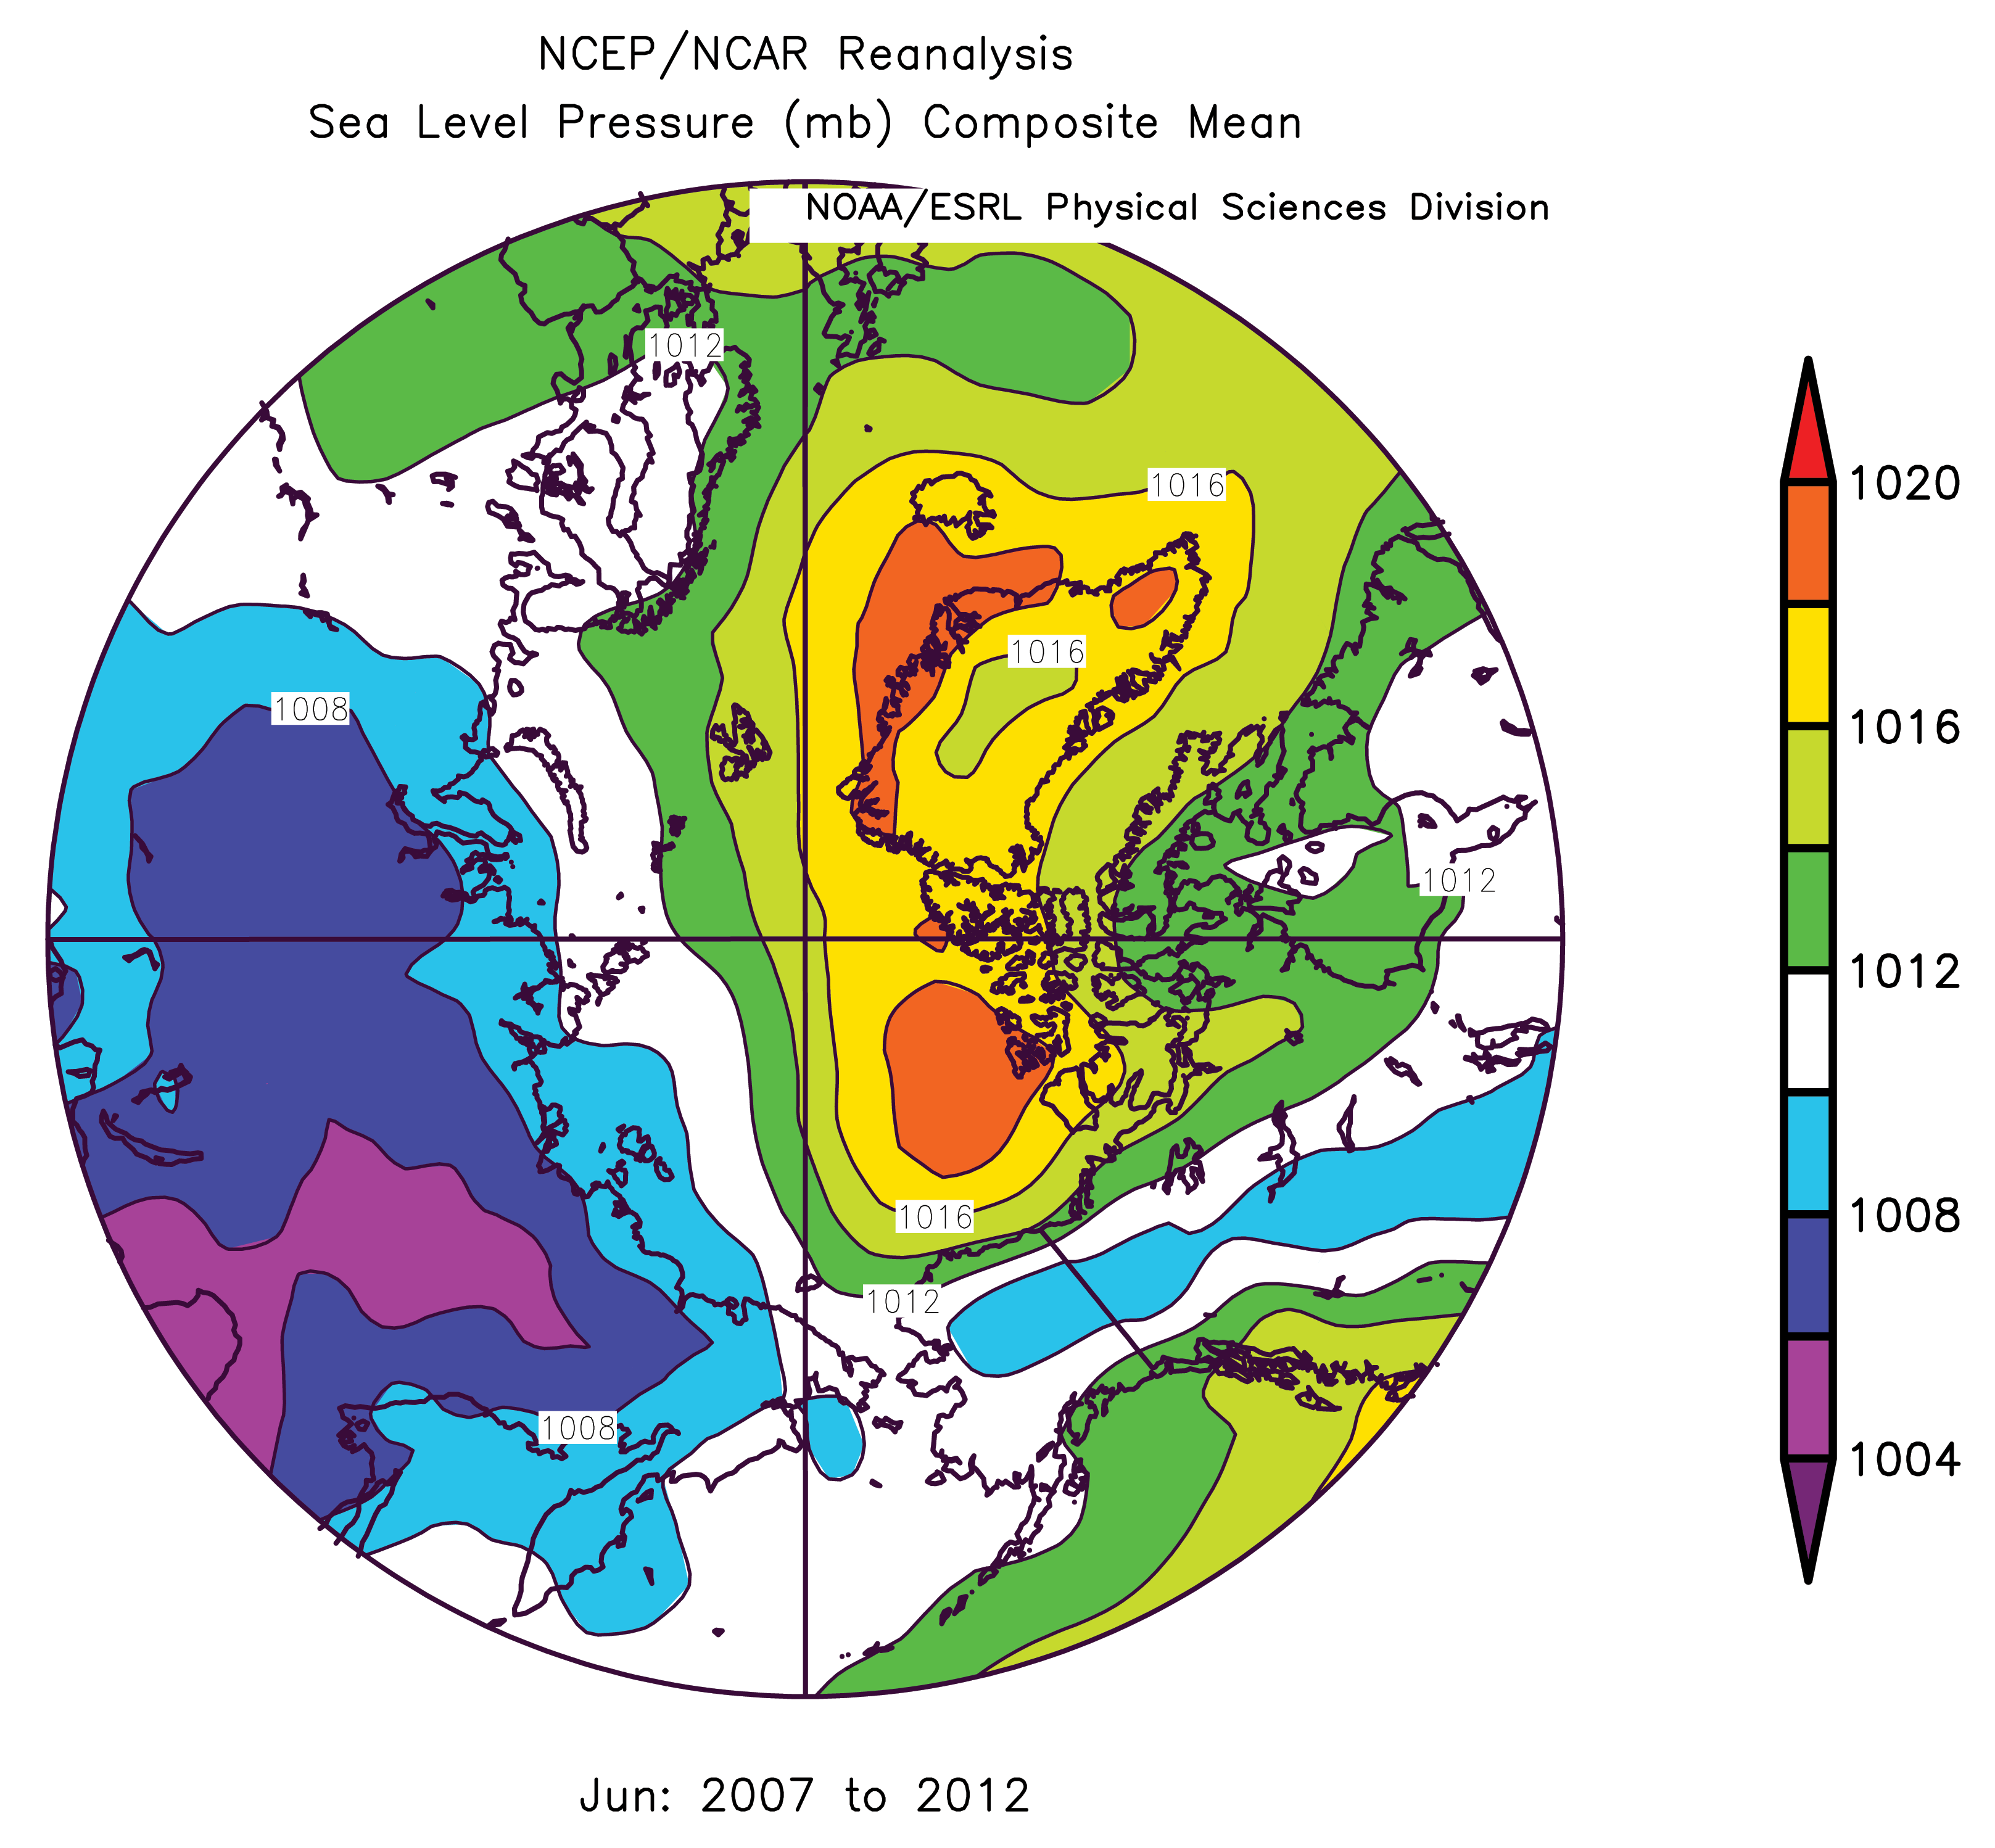
Through the month of January, the Arctic gained 1.36 million square kilometers of ice (525,000 square miles), which is slightly higher than average for the month. Air temperatures at the 925 hPa level were 2 to 5 degrees Celsius (4 to 9 degrees Fahrenheit) higher than average across much of the Arctic Ocean. Conditions were especially warmer than average near Svalbard where ice-free conditions persist. Below average temperatures characterized parts of northern Eurasia and northwestern Canada. The dominant feature of the Arctic sea level pressure field for January 2013 was unusually high pressure over the central Arctic Ocean, consistent with a predominantly negative phase of the Arctic Oscillation.

January 2013 compared to previous years

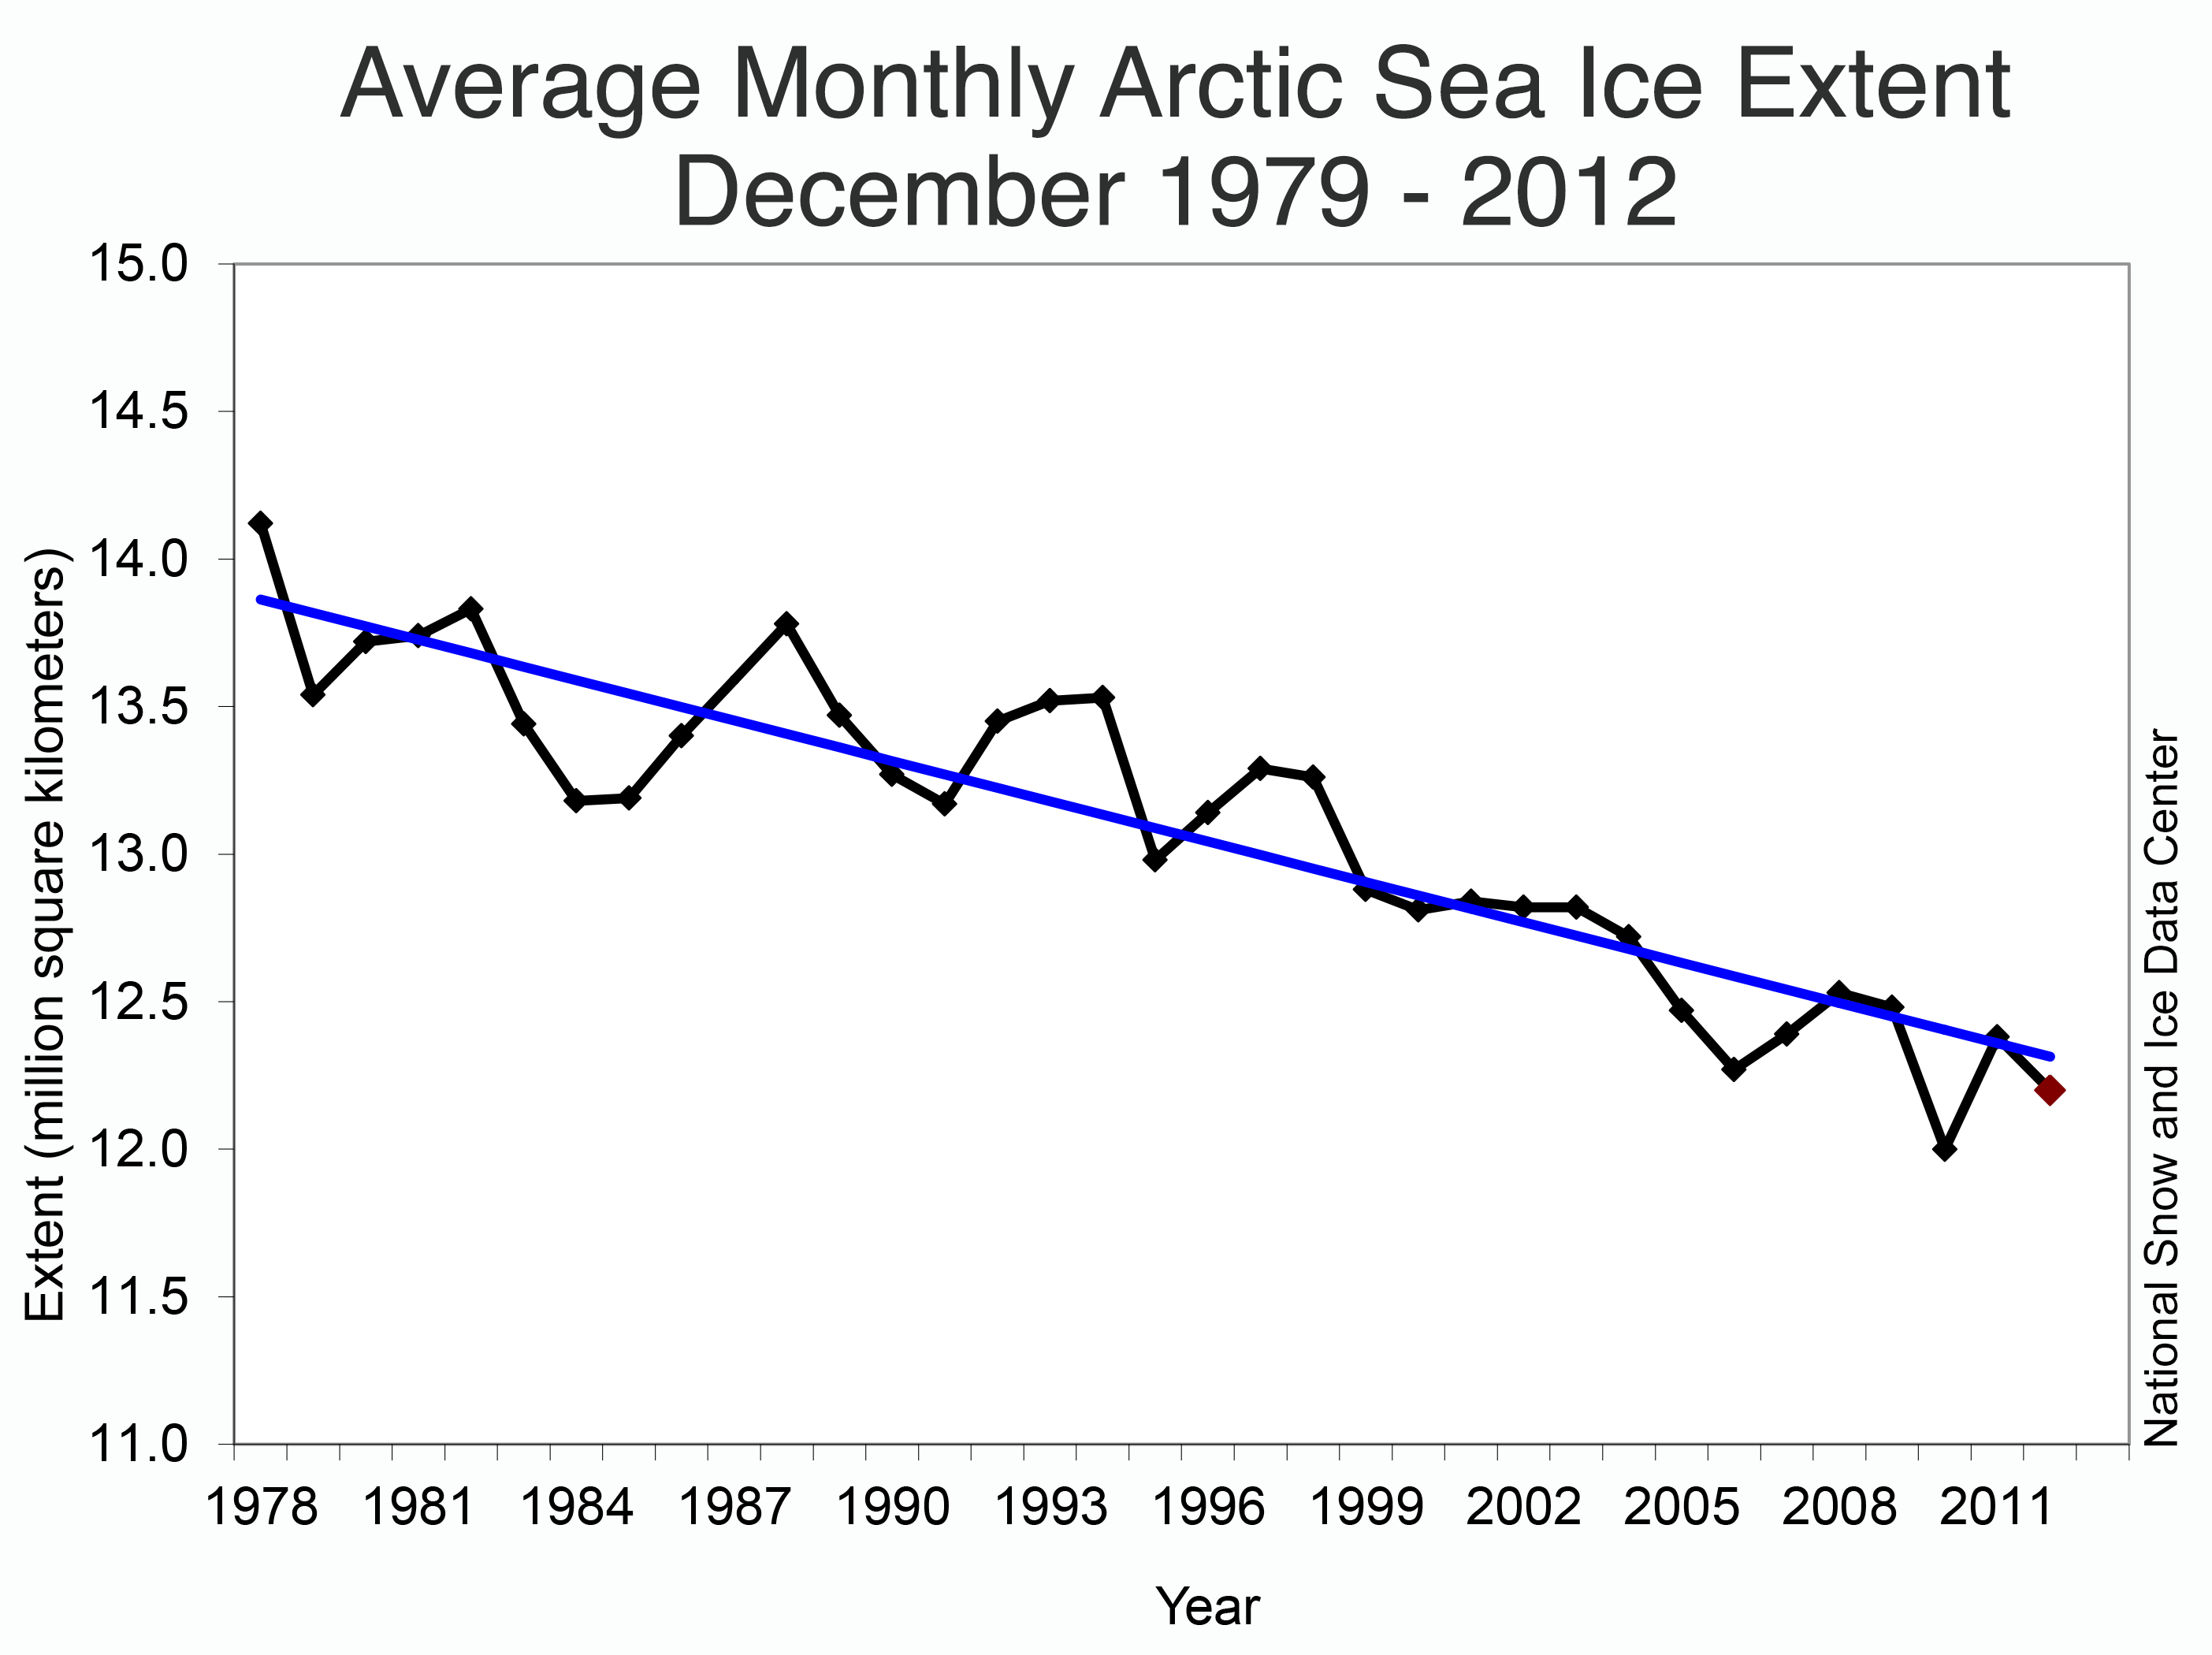
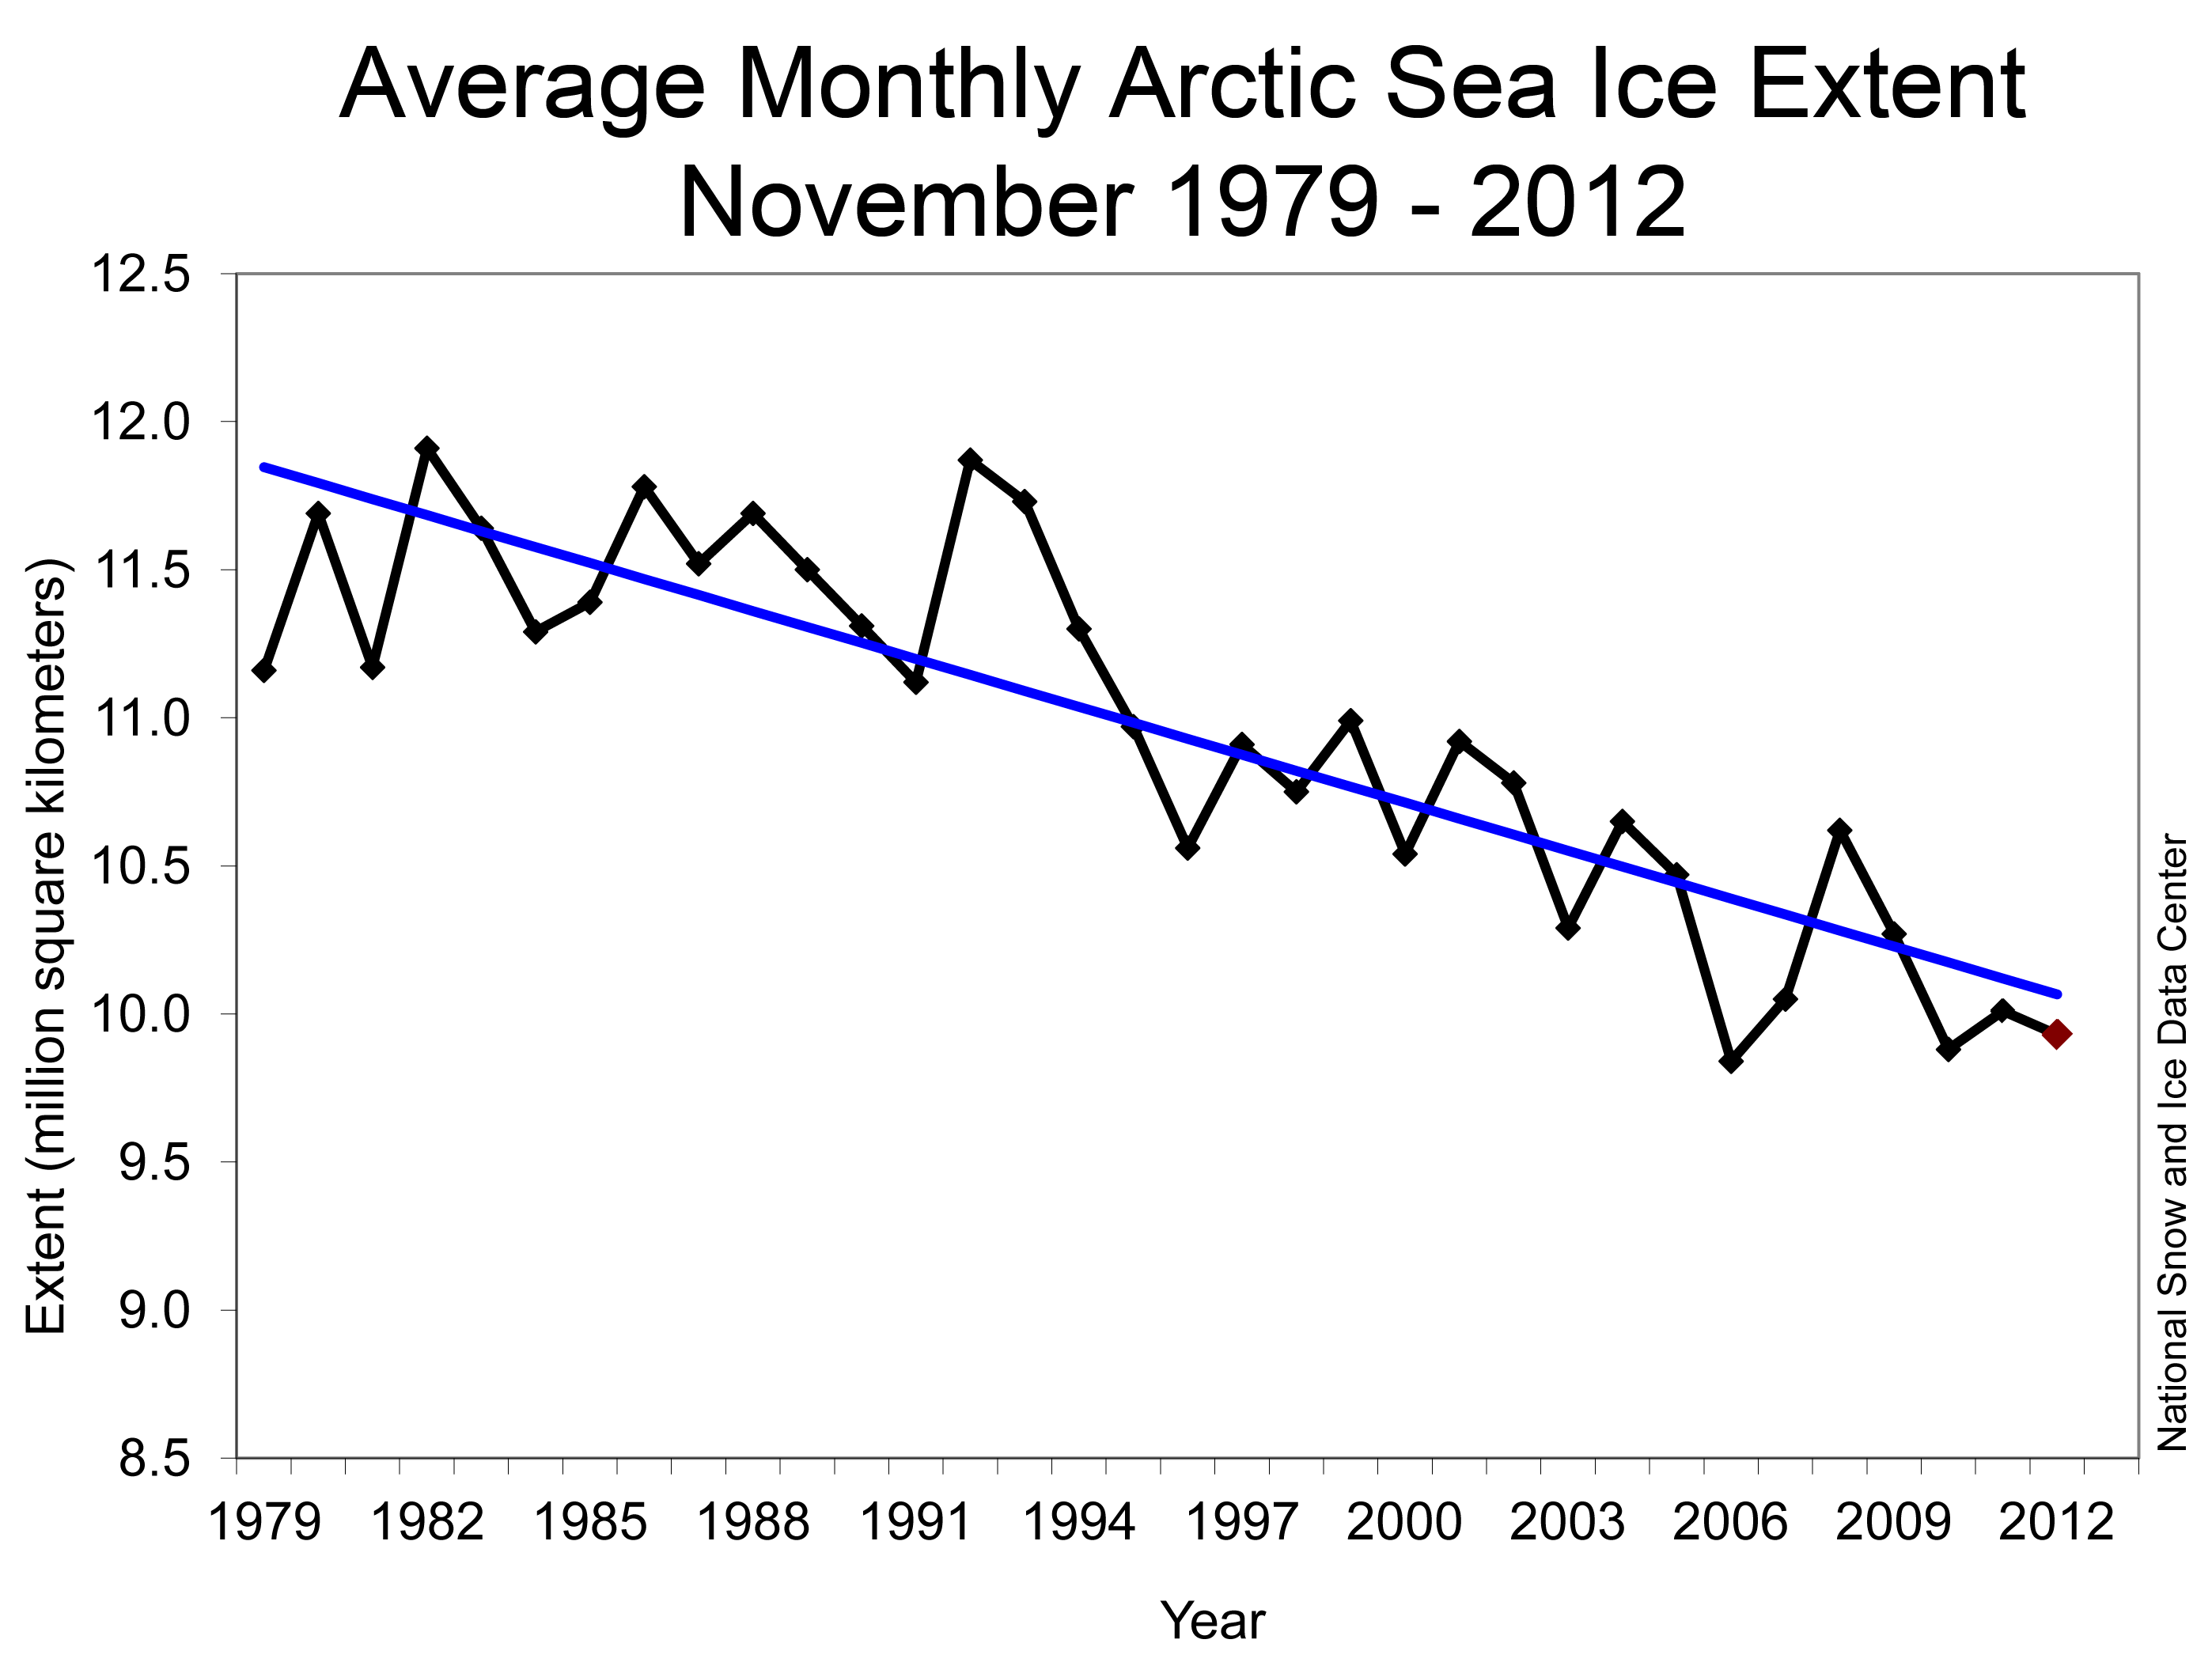
Figure 3. Monthly January ice extent for 1979 to 2013 shows a decline of -3.2% per decade.

Credit: National Snow and Ice Data Center
High-resolution image

Average Arctic sea ice extent for January 2013 was the sixth lowest for the month in the satellite record. Through 2013, the linear rate of decline for January ice extent is -3.2 percent per decade relative to the 1979 to 2000 average.

Looking at Northern Hemisphere snow

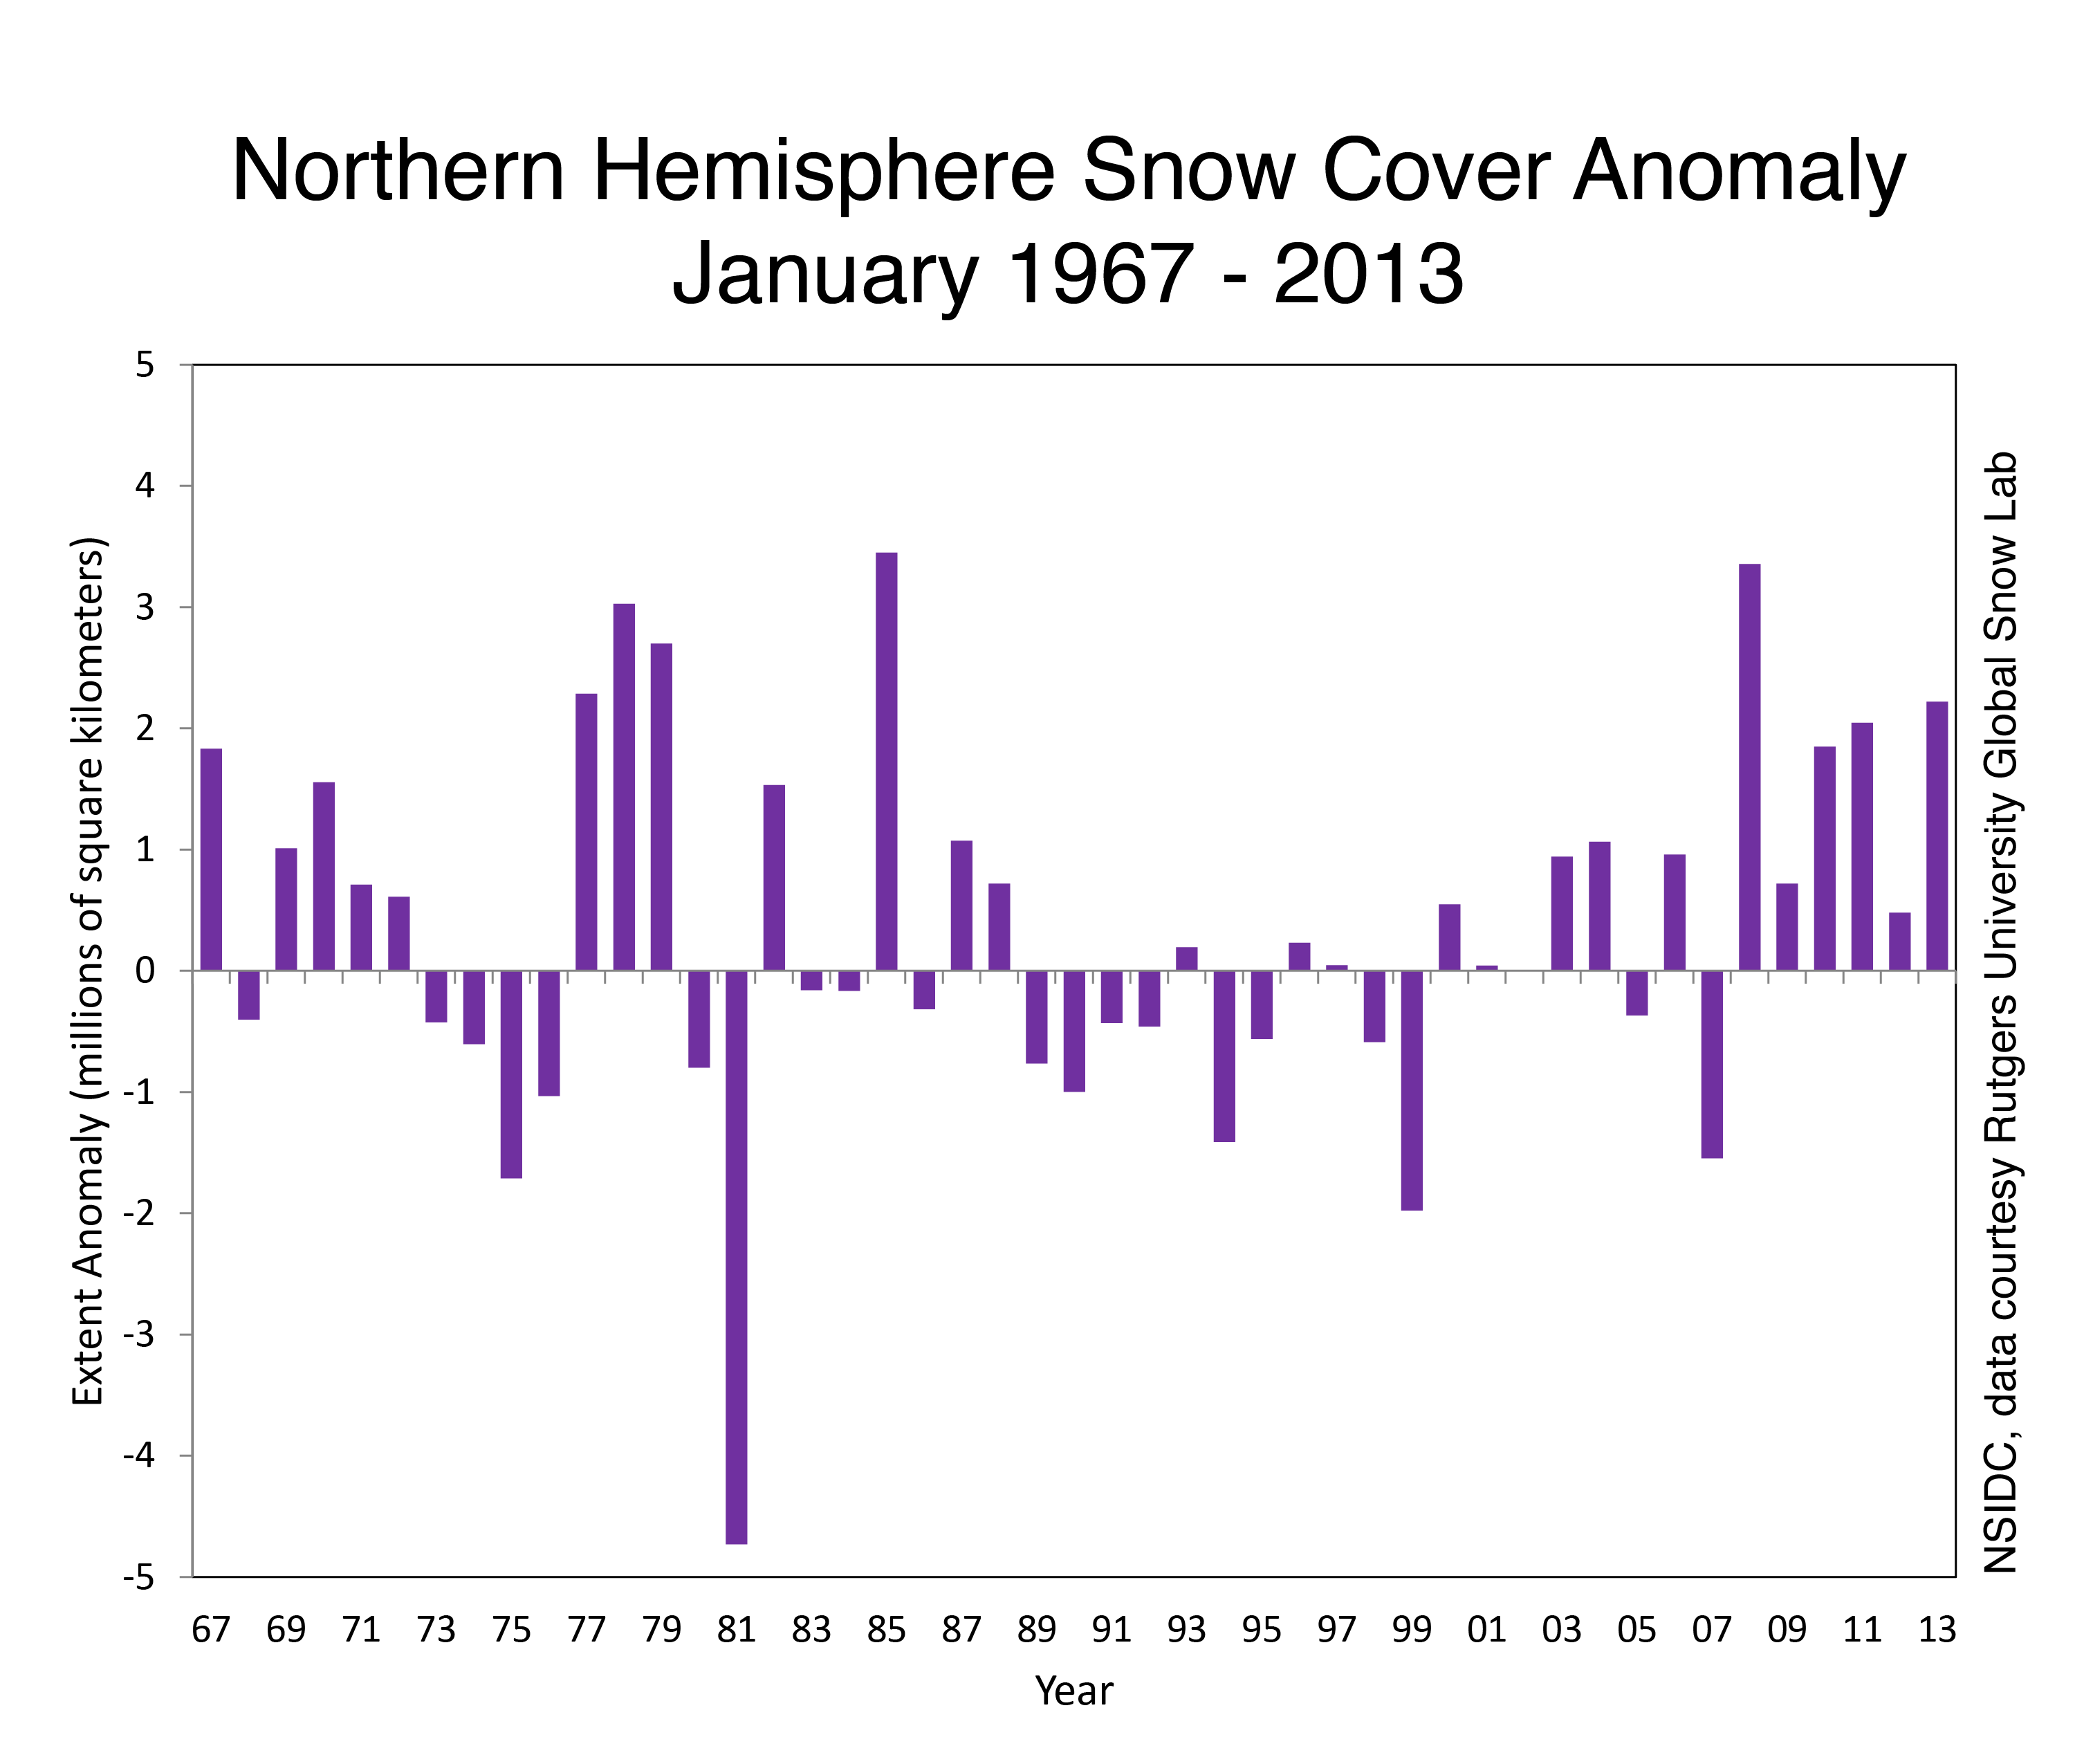
Figure 4. This graphs shows snow cover extent anomaly in the Northern Hemisphere for January from 1967 to 2013. January 2013 is the sixth-highest snow cover extent on record since 1967. The anomaly is relative to the 1971 to 2000 average.

Credit: National Snow and Ice Data Center, data courtesy Rutgers University Global Snow Lab
High-resolution image

As noted in a previous post, Northern Hemisphere snow cover extent for June 2012 set a record low, continuing a downward trend in springtime snow extent. Satellite data from the Rutgers University Global Snow Lab show that after Northern Hemisphere snow cover extent for December 2012 reached a record high for the month of 46.27 million square kilometers (17.86 million square miles), extent during January increased to a monthly average of 48.64 million square kilometers (18.78 million square miles). This was the sixth-highest January extent in the record, dating back to 1967. Snow cover was higher than average throughout much of the western United States as well as northern Europe and eastern China. Snow cover was lower than normal over the central U.S., and much of southern Asia, including the Tibetan Plateau.

A visit to Antarctica

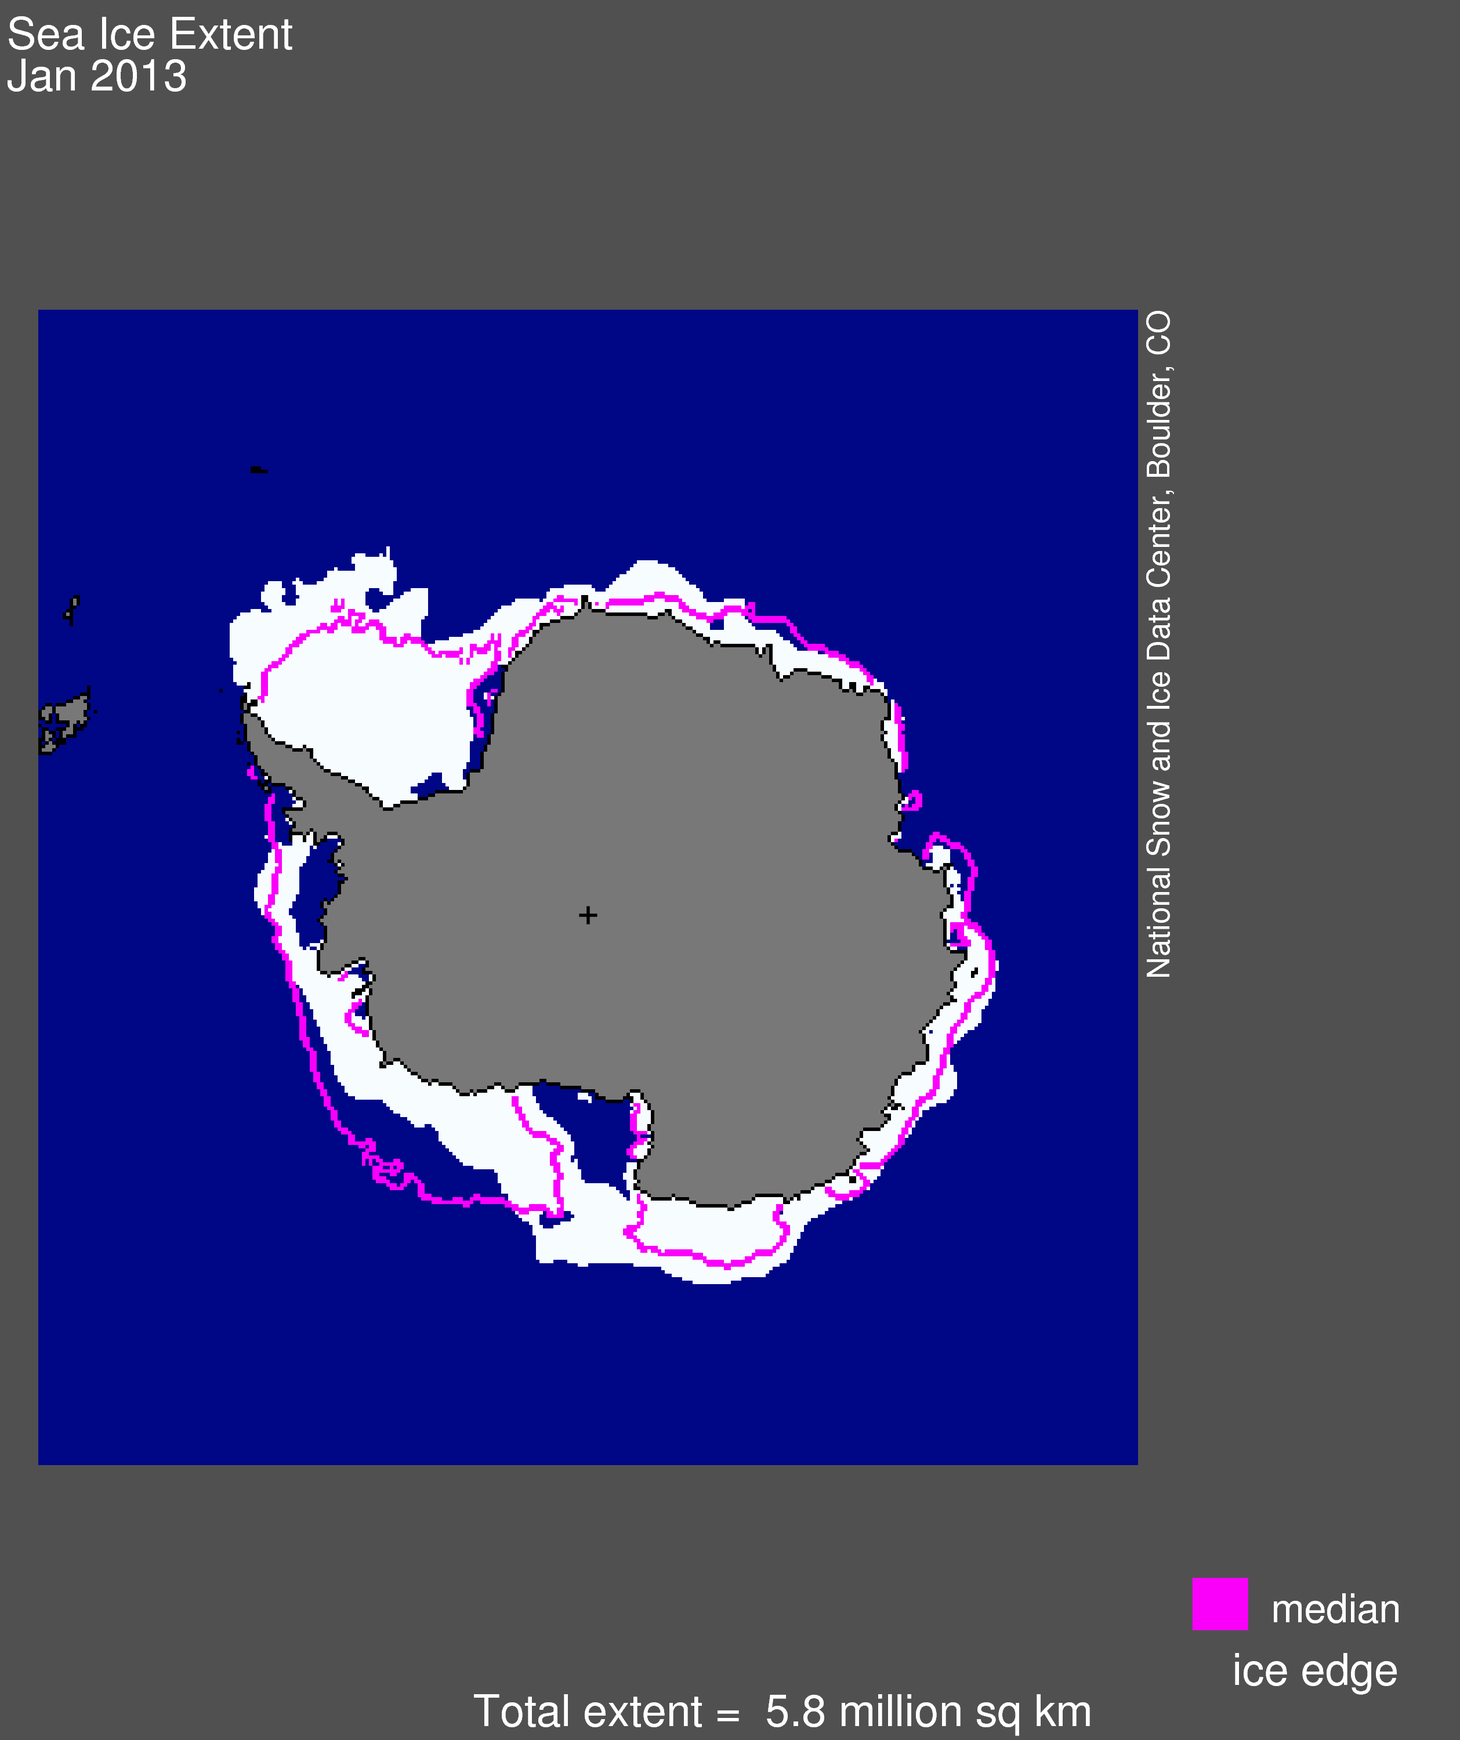
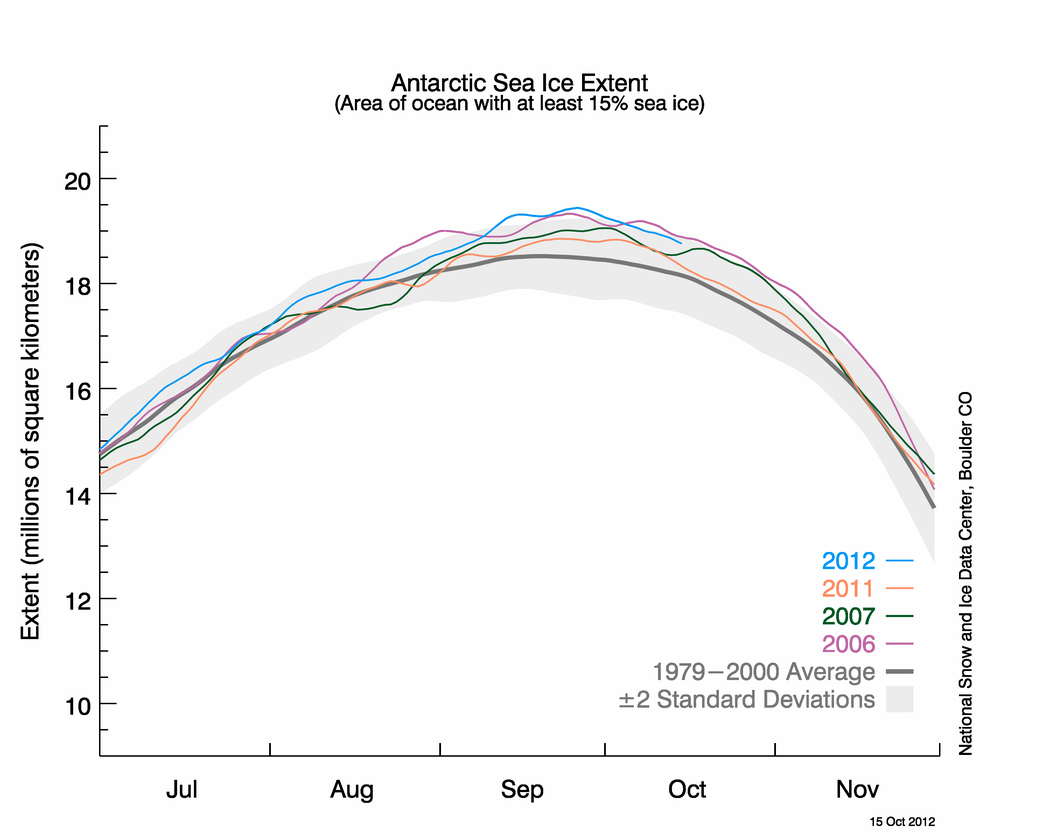
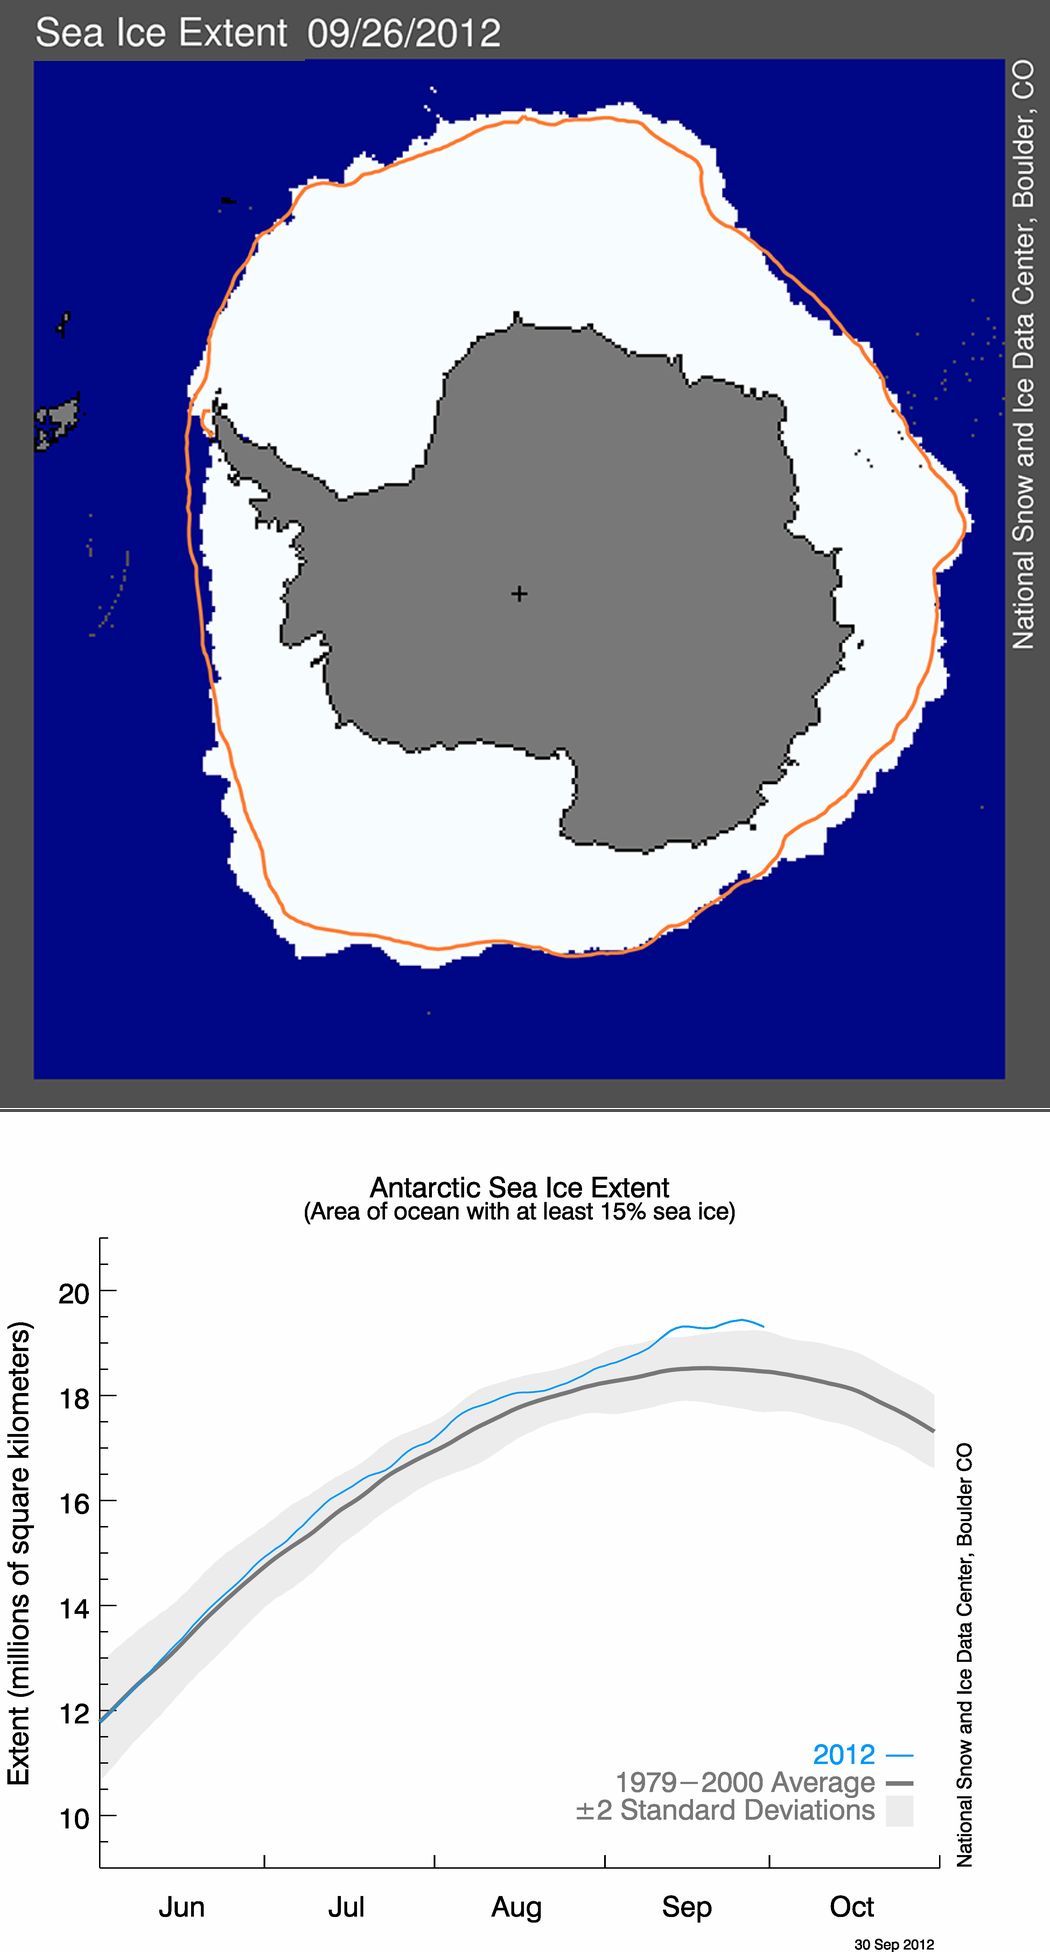
Figure 5. The pattern of Antarctic sea ice extent for January 2013 features an unusual northwards (towards the equator) excursion of sea ice in the northern Weddell Sea. Antarctic sea ice extent as a whole was more than two standard deviations above average for the month. The magenta line shows the 1979 to 2000 median extent for that month. The black cross indicates the South Pole. Sea Ice Index data. About the data

Credit: National Snow and Ice Data Center
High-resolution image

Turning to Antarctica, we note that January 2013 saw an unusual northward (towards the equator) excursion of sea ice in the Weddell Sea. The ice edge was found approximately 200 to 300 kilometers (124 to 186 miles) beyond its typical location. Overall, sea ice extent in the Antarctic was nearly two standard deviations above the mean for most of the month.

The cause of this is very unusual sea ice pattern appears to be persistent high pressure in the region west of the Weddell Sea, across the Antarctic Peninsula to the Bellingshausen Sea. This pressure pattern means that winds are tending to blow to the north on the east side of the Peninsula, both moving the ice northward and bringing in cold air from southern latitudes to reduce surface melting of the ice as it moves north.

Intense Greenland surface melting inspires new Web site

In recent years, the surface of the Greenland Ice Sheet has experienced strong melting, but the 2012 melt season far exceeded all previous years of satellite monitoring, and led to significant amounts of ice loss for the year. NSIDC’s new Web site, Greenland Ice Sheet Today presents images of the widespread surface melt on Greenland during 2012 and scientific commentary on the year’s record-breaking melt extent.

Throughout the coming year, the site will offer daily satellite images of surface melting and periodic analysis by the NSIDC science team. NSIDC scientists at the University of Colorado Boulder developed Greenland Ice Sheet Today with data from Thomas Mote of the University of Georgia, and additional collaboration from Marco Tedesco of the City University of New York.

The Greenland Ice Sheet contains a massive amount of fresh water, which if added to the ocean could raise sea levels enough to flood many coastal areas where people live around the world. The ice sheet normally gains snow during winter and melts some during the summer, but in recent decades its mass has been dwindling.

Further reading

Alexeev, V.A., Ivanov, V.V., Kwok, K., and Smedsrud, L.H. 2013. North Atlantic warming and declining volume of arctic sea ice. The Cryosphere Discussions 7, 245-265, doi: 10.519/tcd-7-245-2013.

Zhang, J., R. Lindsay, A. Schweiger, and M. Steele. 2013. The impact of an intense summer cyclone on 2012 Arctic sea ice retreat. Geophysical Research Letters, In press, doi: 10.1002/grl.50190.

Arctic Oscillation switches to negative phase

Arctic sea ice extent for December 2012 remained far below average, driven by anomalously low ice conditions in the Kara, Barents, and Labrador seas. Thus far, the winter has been dominated by the negative phase of the Arctic Oscillation, bringing colder than average conditions to Scandinavia, Siberia, Alaska, and Canada.

Overview of conditions

Figure 1. Arctic sea ice extent for December 2012 was 12.20 million square kilometers (4.71 million square miles). The magenta line shows the 1979 to 2000 median extent for that month. The black cross indicates the geographic North Pole. Sea Ice Index data. About the data

Credit: National Snow and Ice Data Center
High-resolution image

The average sea ice extent for December 2012 was 12.20 million square kilometers (4.71 million square miles). This is 1.16 million square kilometers (448,000 square miles) below the 1979 to 2000 average for the month, and is the second-lowest December extent in the satellite record.

At the end of December, ice extent in the Atlantic sector remained far below normal, as parts of the Kara and Barents seas remained ice-free. Ice has also been slow to form in the Labrador Sea, while Hudson Bay is now completely iced over. On the Pacific side, ice extent is slightly above normal, with the ice edge in the Bering Sea extending further to the south than usual. The Bering Sea has seen above-average winter ice extent in recent years and is the only region of the Arctic that has exhibited a slightly positive trend in ice extent during the winter months.

Conditions in context

Figure 2. The graph above shows Arctic sea ice extent as of January 7, 2013, along with daily ice extent data for the previous five years. 2012 to 2013 is shown in blue, 2011 to 2012 in green, 2010 to 2011 in pink, 2009 to 2010 in navy, and 2008 to 2009 in purple. The 1979 to 2000 average is in dark gray. The gray area around this average line shows the two standard deviation range of the data. Sea Ice Index data.

Credit: National Snow and Ice Data Center
High-resolution image

Although the Arctic gained 2.33 million square kilometers of ice (900,000 square miles) through the month, ice extent in the region remained far below average. Ice growth remained slow in the Kara and Barents seas where air temperatures were 3 to 5 degrees Celsius (5 to 9 degrees Fahrenheit) higher than normal. Air temperatures over Greenland and the Canadian Archipelago were also slightly above average, while temperatures over Alaska were 2 to 7 degrees Celsius (4 to 13 degrees Fahrenheit) lower than average.

Winter sea ice variability is largely confined to the peripheral seas surrounding the Arctic Ocean. In the past, the dominant pattern of winter sea ice variability showed a distinct out-of-phase relationship between the Labrador and Greenland-Barents seas, with a less prominent seesaw pattern in the Pacific sector, between the Bering Sea and the Sea of Okhotsk. In recent winters however, this out-of-phase relationship no longer appears to hold in the Atlantic sector. Ice extent has remained below average in both the Labrador and the Barents seas.

Successive winters with anomalously low sea ice in the North Atlantic have led to higher mortality rates for seals in the region. The United States government recently added the bearded and ringed seals to the list of creatures threatened under the Endangered Species Act.

December 2012 compared to previous years

Figure 3. Monthly December ice extent for 1979 to 2012 shows a decline of -3.5(+/-0.6)% per decade.

Credit: National Snow and Ice Data Center
High-resolution image

Average Arctic sea ice extent for December 2012 was the second lowest for the month in the satellite record. Through 2012, the linear rate of decline for December ice extent is -3.5 percent per decade relative to the 1979 to 2000 average. While the winter ice extent for the Arctic as a whole shows only modest declines, large negative trends are now found in nearly all of the peripheral seas, with the exception of the Bering Sea.

Negative Arctic Oscillation

Figure 4. This image shows sea level pressure anomalies averaged for December 2012, compared to averages over the period 1981 to 2010. Sea level pressure was above average over Eurasia, extending into the Kara and Barents seas, and across Greenland and the Canadian Archipelago.

Credit: NSIDC courtesy NOAA/ESRL PSD
High-resolution image

The most important mode of variation in the Arctic’s winter atmospheric circulation is the Arctic Oscillation. When the Arctic Oscillation is in a negative mode or phase, sea level pressure is higher than normal over the central Arctic and lower than normal over middle latitudes. This pattern tends to keep the high Arctic relatively warm. It brings colder weather to Europe and North America because air masses can cross into and out of the high Arctic more easily. This pattern tends to favor the retention of thick ice in the Arctic basin by reducing the outflow of ice through the Fram Strait and strengthening the Beaufort Gyre, a clockwise circular pattern of ice drift in the central Arctic. The opposite conditions generally hold for a positive Arctic Oscillation pattern.

The specific influence of this winter’s negative Arctic Oscillation will depend not only on the strength of the sea level pressure anomaly, but also on the location of the sea level pressure center of action. While a negative Arctic Oscillation pattern tends to favor more ice in summer, this was not the case during the extreme negative Arctic Oscillation winter of 2009 to 2010.

The overall effect on the ice cover remains to be seen. Recent studies have argued that that strong warming of the atmosphere in autumn from summer sea ice loss favor the negative Arctic Oscillation phase.

2012 Year in Review

Figure 5. The graph above shows January to December Arctic sea ice extent for the two lowest extent years in the satellite record. Year 2012 is shown in blue and 2007 is shown in green. The 1981 to 2010 average is shown in light blue while the 1979 to 2000 average is in dark gray. Sea Ice Index data. About the data

Credit: National Snow and Ice Data Center
High-resolution image

While the year began with lower than average extent for the Arctic as a whole, extent in the Bering Sea was at record high levels for much of the winter. The seasonal decline of ice extent began slowly, such that in mid-April, extent for the Arctic as a whole was briefly near average levels.

Extent began dropping rapidly beginning in May, and by the end of the melt season on September 16, extent was at the lowest level recorded in the satellite record of 3.41 million square kilometers (1.32 million square miles). While summer weather conditions were not as favorable for ice loss as during 2007, the year of the previous record low, an unusually strong cyclone in August helped to quickly break up the already thin and fragmented ice cover in the Chukchi Sea. This cyclone—remarkable in its intensity and its duration—lasted for thirteen days, of which ten days were spent in the Arctic basin.

While it appears that a record low extent would have been reached even without the cyclone, thinning over the last several decades has made the ice more vulnerable to such storms, compared to earlier decades when the Arctic Ocean was dominated by thick, multiyear ice.

The annual average extent is now declining at a rate of -4.5 percent per decade relative to the 1979 to 2000 average and -4.6 percent per decade relative to the 1981 to 2010 average. The 1981 to 2010 period is the 30-year climatology used by the National Oceanic and Atmospheric Administration (NOAA) for their climate normals. Thirty years is a commonly-used period to define average or normal climate conditions. It is long enough to capture much climate variability, such as the different modes of the Arctic Oscillation, and short enough to be relevant for human timescales, such as agricultural cycles. NOAA updates its climate normals every ten years. For Arctic sea ice, use of the 1981 to 2010 period results in a lower extent than the 1979 to 2000 period, as seen in Figure 5, because the low extents of the last decade are included.

Record low ice extent was not the only remarkable event in the north. In June, Northern Hemisphere land snow cover set a new record for the least amount of snow cover in the 45-year record. A month later, the Greenland ice sheet experienced melt over more than 90 percent of its surface area, the largest melt extent recorded during the satellite data record.

Further reading

Simmonds, I. and I. Rudeva.  2012. The great Arctic cyclone of August 2012. Geophysical Research Letters 39, L23709, doi:10.1029/2012GL054259.

Jaiser, R., K. Dethloff, D. Handorf, A. Rinke, and J. Cohen. 2011. Impact of sea ice cover changes on the Northern Hemisphere atmospheric winter circulation. Tellus A, 64, 11595, doi:10.3402/tellusa.v64i0.11595.

Stroeve, J. C., J. Maslanik, M. C. Serreze, I. Rigor, W. Meier, and C. Fowler. 2011. Sea ice response to an extreme negative phase of the Arctic Oscillation during winter 2009/2010, Geophysical Research Letters 38, L02502, doi:10.1029/2010GL045662.


Winds and warmth influence freeze up

For the Arctic as a whole, ice growth for November was faster than average. However, the Kara and Barents seas remained largely ice free, contributing to above-average air temperatures in these regions.

Overview of conditions

Figure 1. Arctic sea ice extent for November 2012 was 9.9 million square kilometers (3.8 million square miles). The magenta line shows the 1979 to 2000 median extent for that month. The black cross indicates the geographic North Pole. Sea Ice Index data. About the data

Credit: National Snow and Ice Data Center
High-resolution image

November average sea ice extent was 9.93 million square kilometers (3.83 million square miles). This is 1.38 million square kilometers (533,000 square miles) below the 1979 to 2000 average for the month and is the third lowest November extent in the satellite record.

By the end of the month, the central Arctic Ocean had almost completely frozen over. However, the Barents and Kara seas remained largely ice free. Extent remained below normal in the Baffin Bay and Hudson Bay, but ice extent in the Bering Sea by the end of the month was greater than average, continuing a pattern seen in recent years. Extent in the Bering Sea was at record high levels last winter.

Conditions in context

Figure 2. The graph above shows Arctic sea ice extent as of December 2, 2012, along with daily ice extent data for the previous five years. 2012 is shown in blue, 2011 in orange, 2010 in pink, 2009 in navy, 2008 in purple, and 2007 in green. The 1979 to 2000 average is in dark gray. The gray area around this average line shows the two standard deviation range of the data. Sea Ice Index data.

Credit: National Snow and Ice Data Center
High-resolution image

Extent can increase quickly during November because there is little solar energy and the ocean is rapidly losing the heat that it gained in summer. For the Arctic as a whole, ice growth for November 2012 was faster than average, increasing at an average rate of 98,600 square kilometers (38,100 square miles) per day. After remaining lower than levels observed in 2007 for most of the month, by November 30 ice extent matched or exceeded extent seen in 2007, 2006, and 2010.

November 2012 compared to previous years

Figure 3. Monthly November ice extent for 1979 to 2012 shows a decline of -4.8% per decade.

Credit: National Snow and Ice Data Center
High-resolution image

Average sea ice extent for November 2012 was the third lowest in the satellite record. This marks only the third year in the satellite record that November extent was below 10 million square kilometers (3.86 million square miles). Through 2012, the linear rate of decline for November Arctic ice extent is -4.8% per decade relative to the 1979 to 2000 average.

Air temperatures remain high over ice-free areas

Figure 4. This image shows air temperature anomalies at the 925 hPa level averaged for November 2012, compared to averages over the period 1981 to 2010. Temperatures were above average over the East Siberian, Barents, and Kara seas.

Credit: NSIDC courtesy NOAA/ESRL PSD
High-resolution image

November air temperatures at the 925 hPa level (approximately 3,000 feet) were above average over most of the Arctic Ocean. Notably, temperatures in the Barents and Kara seas were up to 6 degrees Celsius (11 degrees Fahrenheit) higher than average. This reflects in part the lingering open water in the regions, allowing strong upward transfers of heat from the ocean to the atmosphere. Unusually strong winds from the south contributed to the warmth and also helped keep the region ice free.

More striking were the unusually warm conditions over the ice-covered East Siberian Sea, where temperatures were 6 degrees Celsius (11 degrees Fahrenheit) above average. This appears to be due to persistent high pressure over the Bering Strait. Southerly winds on the west side of the high-pressure zone brought warm air into the East Siberian region. Colder, northerly winds on the east side of the high-pressure zone help explain the higher-than-average extent in the Bering Sea.

Arctic rapidly gaining winter ice

Ice extent doubled in October. The rate of increase since the 2012 minimum was near record, resulting in an October monthly extent 230,000 square kilometers (88,800 square miles) greater than the previous low for the month, which occurred in 2007. Despite this rapid growth, ice extent remains far below normal as we begin November.

Overview of conditions

Figure 1. Arctic sea ice extent for October 2012 was 7.0 million square kilometers (2.7 million square miles). The magenta line shows the 1979 to 2000 median extent for that month. The black cross indicates the geographic North Pole. Sea Ice Index data. About the data

Credit: National Snow and Ice Data Center
High-resolution image

Average ice extent for October was 7.00 million square kilometers (2.70 million square miles). This is the second lowest in the satellite record, 230,000 square kilometers (88,800 square miles) above the 2007 record for the month. However, it is 2.29 million square kilometers (884,000 square miles) below the 1979 to 2000 average. The East Siberian, Chukchi, and Laptev seas have substantially frozen up. Large areas of the southern Beaufort, Barents and Kara seas remain ice free.

As of November 4, sea ice extent stood at 8.22 million square kilometers (3.17 million square miles). This is 520,000 square kilometers (201,000 square miles) below the extent observed in 2007 on the same date, and ice extent remains 2.04 million square kilometers (788,000 million square miles) below the 1979 to 2000 average for this date.

Conditions in context

Figure 2. The graph above shows Arctic sea ice extent as of October 31, 2012, along with daily ice extent data for 2011 and for the previous record year, 2007. 2012 is in blue, 2011 is orange, and 2007 is shown in green. The gray area around the average line shows the two standard deviation range of the data. Sea Ice Index data.

Credit: National Snow and Ice Data Center
High-resolution image

After the record minimum ice extent on September 16 and through October 31, the Arctic gained 4.19 million square kilometers (1.62 million square miles) of ice. Ice extent doubled during the month of October. The average rate of ice growth for October was 121,000 square kilometers (46,700 square miles) per day, causing the extent to temporarily climb above the extent observed during October 2007 for a period. This led to a monthly average extent slightly above levels in 2007, the previous record low October. Slower ice growth during the last few days of the month then brought extent below 2007 levels.

On October 20, ice extent went above 6.0 million square kilometers (2.3 million square miles) for the first time since August 6.

October 2012 compared to previous years

Figure 3. Monthly October ice extent for 1979 to 2012 shows a decline of -7.1% per decade.

Credit: National Snow and Ice Data Center
High-resolution image

Due to the rapid ice growth during October, Arctic sea ice extent for October 2012 was the second lowest in the satellite record, above 2007. Through 2012, the linear rate of decline for October Arctic ice extent over the satellite record is -7.1% per decade.

Asymmetric ice growth and temperatures

Figure 4. This graph shows rates of ice growth in the Arctic since the September 16, 2012 minimum extent and through October 31. Growth has been particularly rapid in the East Siberian and Laptev seas.

Credit: Julienne Stroeve/National Snow and Ice Data Center
High-resolution image

While overall the Arctic rapidly gained ice throughout October, the rate of ice growth was not the same everywhere. Ice growth in the Beaufort and Chukchi seas averaged about 8,500 square kilometers (3,300 square miles) per day and large areas still remain ice free. In the eastern Arctic there was rapid ice growth in the East Siberian and Laptev seas exceeding, respectively, 28,000 and 18,000 square kilometers per day (11,000 and 7,000 square miles per day). As a result, most of the region is now completely frozen over. The slowest rates of ice growth have occurred in the Kara Sea (less than 3,000 square kilometers, or 1,000 square miles per day). In large part because of extensive open water in the Kara and Barents seas, air temperatures for October in this area at the 925 hPa level (about 3,000 feet above the surface) were 3 to 4 degrees Celsius (5 to 7 degrees Fahrenheit) above average, with unusual warmth becoming more pronounced near the surface. October air temperatures over the ice-free southern Beaufort Sea were also far above average.

Ice extent and bathymetry: The floor’s the limit

Figure 5. This image provides a snapshot of how ocean depth in the Arctic influences sea ice extent. Sea ice cover for August 28, 2012 is shown in semi-transparent white; ocean depths are indicated in blues, with deeper blues indicating greater depth. Sea ice data are from the Multisensor Analyzed Sea Ice Extent (MASIE), which provides more accurate ice edge position.

Credit: National Snow and Ice Data Center courtesy Jamie Morison/Applied Physics Laboratory, University of Washington
High-resolution image

Research by our colleagues Jamie Morison at the University of Washington Seattle and NASA scientist Son Nghiem suggests that bathymetry (sea floor topography) plays an important role in Arctic sea ice formation and extent by controlling the distribution and mixing of warm and cold waters. At its seasonal minimum extent, the ice edge mainly corresponds to the deep-water/shallow-water boundary (approximately 500-meter depth), suggesting that the ocean floor exerts a dominant control on the ice edge position. However, in some cases, ice survives in the shallower continental shelf regions due to water circulation patterns. For example, the shelf area of the East Greenland Sea is almost always covered with sea ice because the southward-flowing cold Arctic surface water helps to limit melt.

In contrast, ice disappears in shallow areas like the Barents and Chukchi seas that are subject to warm ocean waters and river runoff. River runoff and ice melting have also contributed to changes in the amount and distribution of fresh water in the Arctic.

Further reading

Morison, J., R. Kwok, C. Peralta-Ferriz, M. Alkire, I. Rigor, R. Andersen, and M. Steele. 2012. Changing Arctic Ocean freshwater pathways. Nature 481, 66–70 (05 January 2012), doi:10.1038/nature10705.

Nghiem, S.V., P. Clemente-Colón, I.G. Rigor, D.K. Hall, and G. Neumann. 2012. Seafloor control on sea ice. Deep Sea Research Part II: Topical Studies in Oceanography, Volumes 77–80, 15 November 2012, pp. 52-61, ISSN 0967-0645, doi:10.1016/j.dsr2.2012.04.004.

Open water means a warm Arctic

Autumn over the Arctic Ocean is a season of falling temperatures and rapid growth of sea ice. However, as in recent years, low sea ice extent at the beginning of autumn means large transfers of heat to the atmosphere from open water areas, keeping the Arctic warmer than usual. Despite this warmth, freeze up is in high gear.

Overview of conditions

Figure 1. Arctic sea ice extent for October 15, 2012 was 5.18 million square kilometers (2.00 million square miles). The orange line shows the 1979 to 2000 median extent for that day. The black cross indicates the geographic North Pole. Sea Ice Index data. About the data

Credit: National Snow and Ice Data Center
High-resolution image

As of October 15, sea ice extent stood at 5.18 million square kilometers (2.00 million square miles). This is 3.49 million square kilometers (1.35 million square miles) below the 1979 to 2000 mean for this time of year and 70,000 square kilometers (27,000 square miles) below the same date in 2007. Although it is still at record low levels, extent is climbing fast.

Large areas of the Kara, Laptev, East Siberian, Chukchi, and Beaufort seas remain open for hundreds of kilometers offshore. East of Greenland, ice extent is near average.

Conditions in context

Figure 2. The graph above shows Arctic sea ice extent as of October 15, 2012, along with daily ice extent data for the previous five years. 2012 is shown in blue, 2011 in orange, 2010 in pink, 2009 in navy, 2008 in purple, and 2007 in green. The gray area around the average line shows the two standard deviation range of the data. Sea Ice Index data.

Credit: National Snow and Ice Data Center
High-resolution image

Arctic sea ice extent is increasing rapidly, at about 100,000 square kilometers (38,600 square miles) per day, expanding southward at the ice edge, as well as northward from the Arctic continental coasts. However, sea ice extent is still at record low levels for the date, compared to the satellite measurement period (1979 to 2012). On October 6, daily sea ice extent climbed above the 2007 record daily minimum (4.17 million square kilometers or 1.61 million square miles), having spent forty days below that level. On October 14, extent went above 5.0 million square kilometers (1.93 million square miles) for the first time since mid-August.

Open water warms the lower atmosphere

Figure 3. This figure shows air temperatures as a function of height and longitude at 75 degrees north latitude. Temperatures are for the period September 20 to October 10, 2012 compared to averages for the years 1981 to 2010. Between longitudes 120 degrees west to 150 degrees west, temperatures more than 4 degrees Celsius (7 degrees Fahrenheit) above normal are found up to the 850 hPa level (roughly 4500 feet above the surface), with temperatures near the surface, in closer proximity to the warming effects of the ocean, more than 6 degrees Celsius (11 degrees Fahrenheit) above normal.

Credit: NSIDC courtesy NOAA/ESRL PSD
High-resolution image

The past decade has seen much stronger increases in air temperature in the Arctic compared to the globe as a whole. While this strong warming, known as Arctic amplification, has a number of causes, a primary one is declining summer sea ice extent. Through summer, solar energy is readily absorbed within expanding areas of dark, open water. When the sun sets, this heat stored in the uppermost layers of the Arctic Ocean is released upwards, keeping the overlying atmosphere unusually warm.

This warming effect has been especially pronounced during the early autumn of 2012. Air temperatures averaged over the most recent thirty days of data are above average over nearly all of the Arctic Ocean. The warmest conditions compared to average are over northwestern Canada and extending into the Beaufort Sea. Here, the effect of heat released from the ocean is augmented by warm, southerly winds, and is linked to a pattern of unusually high pressure centered over the Gulf of Alaska.

Arctic wind patterns support melting, ice export

Figure 4. Sea level pressure for June 2007 to 2012 compared to averages over the period 1981 to 2010. The Arctic dipole anomaly refers to the combination of unusually high pressure over the northern Beaufort Sea and Greenland and unusually low pressure over northern Eurasia.

Credit: NSIDC courtesy NOAA/ESRL PSD
High-resolution image

Recent research led by James Overland of the National Oceanic and Atmospheric Administration (NOAA) and Jennifer Francis of Rutgers University shows that the Arctic dipole anomaly, featuring unusually high pressure over the northern Beaufort Sea and Greenland and unusually low pressure over northeastern Eurasia, has become more common in the early summer of recent years.

As discussed in previous posts, this pattern brings in warm southerly winds along the shores of the East Siberian and Chukchi seas. It favors strong ice melt in these sectors and pushes the ice away from the coast, leaving open water. The pressure pattern also favors the transport of ice out of the Arctic Ocean and into the North Atlantic through Fram Strait.

The Arctic dipole anomaly was very well developed throughout the summer of 2007 and was in part responsible for the very low September ice extent recorded that year (the second lowest in the satellite record). According to Overland and colleagues, no other six-year period matches the intensity and persistence of the June pattern for 2007 to 2012 in the past sixty-three years. The pattern is linked to the general weakening of the circumpolar jet stream and the greater meandering of this wind flow.

Recall from our previous post that the summer of 2012 as a whole saw a somewhat different pattern. Unusually low pressure was present along the Eurasian coastal seas and extended eastward into the Beaufort Sea, most prominently over the East Siberian Sea, with unusually high pressure centered over Greenland and the northern North Atlantic.

Antarctic sea ice extent remains above average

Figure 5. This graph shows the highest extent years for Antarctic sea ice. The blue line shows 2012, the orange line shows 2011, the green line shows 2007, and the pink line shows 2006. The 1979 to 2000 average is in dark gray. The gray area around this average line shows the two standard deviation range of the data. Sea Ice Index data.

Credit: National Snow and Ice Data Center
High-resolution image

Antarctic sea ice extent dropped below record levels seen for the date but remains well above average. Journalists inquired about the cause of gradual growth in wintertime Antarctic sea ice and the record high Antarctic sea ice extent in mid-September despite general climate warming and the dramatic sea ice losses in the Arctic. As we noted in the previous post, researchers cite stronger westerly winds surrounding Antarctica, in contrast to the Arctic. See also the following news stories on Antarctic sea ice, to which NSIDC scientists contributed, under “Further reading” below.

Further reading

Peter Aldhous, “Why sea ice records are poles apart,” New Scientist, October 8, 2012.

Justin Gillis, “Running the numbers on Antarctic sea ice,” New York Times Green blog, October 3, 2012.

Richard Harris, “Scientists watch Antarctica, Arctic sea ice levels,” National Public Radio Morning Edition, October 8, 2012.

Reference

Overland, J. E., J. A. Francis, E. Hanna, and M. Wang. 2012. The recent shift in early summer Arctic atmospheric circulation. Geophysical Research Letters 39, L19804, doi: 10.1029/2012GL053268.


Poles apart: A record-breaking summer and winter

The sun has set over the central Arctic Ocean and sea ice extent is now increasing. While much attention has been paid to the record minimum Arctic ice extent set on September 16, 2012, winter sea ice extent in Antarctica has reached a record high. The Antarctic extent increase is an interesting response to changes in circulation patterns in the Southern Hemisphere.

Overview of conditions

Figure 1. Arctic sea ice extent for September 2012 was 3.61 million square kilometers (1.39 million square miles). The magenta line shows the 1979 to 2000 median extent for that month. The black cross indicates the geographic North Pole. Sea Ice Index data. About the data

Credit: National Snow and Ice Data Center
High-resolution image

Following the record minimum that was set on September 16, 2012, Arctic sea ice has started its seasonal pattern of growth; maximum seasonal extent is expected to be reached by the end of March of next year.

Arctic sea ice extent averaged for September 2012 was 3.61 million square kilometers (1.39 million square miles). This was 3.43 million square kilometers (1.32 million square miles) below the 1979 to 2000 average extent. September 2012 ice extent was 690,000 square kilometers (266,000 square miles) less than the previous record low for the month that occurred in 2007.

Conditions in context

Figure 2. The graph above shows Arctic sea ice extent as of September 30, 2012, along with daily ice extent data for the previous five years. 2012 is shown in blue, 2011 in orange, 2010 in pink, 2009 in navy, 2008 in purple, and 2007 in green. The 1979 to 2000 average is in dark gray. The gray area around this average line shows the two standard deviation range of the data. Sea Ice Index data.

Credit: National Snow and Ice Data Center
High-resolution image

The seasonal minimum in extent that occurred this year on September 16 was three days later than the average date of the minimum (September 13). Because ice extent falls through the first part of September and rises in the latter part, statistics on the average daily rate of ice loss or gain through the month are largely meaningless. More relevant is the total ice loss through the melt season. Between the seasonal maximum extent that occurred on March 20, 2012 and the September 16 minimum, the Arctic Ocean lost a total of 11.83 million square kilometers (4.57 million square miles) of ice; this is by far the largest seasonal loss of sea ice in the satellite record. The second largest seasonal loss was 10.65 million square kilometers (4.11 million square miles), in 2008. Due in part to transfers of heat from extensive open water areas to the atmosphere, air temperatures at the 925 hPa level averaged for September 2012 were from 2 to 5 degrees Celsius (4 to 9 degrees Fahrenheit) above average over much of the Arctic Ocean; much larger departures from average were the rule at levels closer to the surface.

September 2012 compared to previous years

Figure 3. Monthly September ice extent for 1979 to 2012 shows a decline of 13.0% per decade.

Credit: National Snow and Ice Data Center
High-resolution image

Arctic sea ice extent averaged for September 2012 was the lowest in the satellite record, and was 16% lower than the previous low for the month, which occurred in 2007. Through 2012, the linear rate of decline for September Arctic ice extent over the satellite record is now 13.0% per decade, relative to the 1979 to 2000 average. The six lowest September ice extents over the satellite record have all occurred in the last six years. Compared to the 1979 to 2000 average ice conditions, the September 2012 ice cover represents a 49% reduction in the area of the Arctic Ocean covered by sea ice. It is 2.91 million square kilometers (1.12 million square miles), or 45%, below the 30-year average over 1981 to 2010.

Summer weather conditions: 2012 compared to 2007

Figure 4. These images compare sea level pressure and temperature anomalies (at the 925 hPa level) during summer 2007, the previous record low extent year, and summer 2012. Anomalies were less pronounced in 2012 than in 2007 (as shown in reds and oranges). While weather was a factor in the 2007 record low extent, the 2012 record extent occurred during near average weather conditions.

Credit: NSIDC courtesy NOAA/ESRL PSD
High-resolution image

Weather conditions prevailing over the summer of 2012 were quite different from those in 2007. The summer of 2007 featured unusually high sea level pressure centered north of the Beaufort Sea and Greenland, and unusually low pressure along northern Eurasia, bringing in warm southerly winds along the shores of the East Siberian and Chukchi seas (3 to 5 degrees Celsius, or 5 to 9 degrees Fahrenheit above normal), favoring strong ice melt in these sectors and pushing the ice away from the coast, leaving open water. The pressure pattern also favored the transport of ice out of the Arctic Ocean and into the North Atlantic through Fram Strait.

In contrast, the summer of 2012 saw unusually low pressure along the Eurasian coastal seas and extending eastward into the Beaufort sea, most prominently over the East Siberian Sea, with unusually high pressure centered over Greenland and the northern North Atlantic. Air temperatures for summer 2012 were above average over most of the Arctic Ocean (1 to 3 degrees Celsius, or 2 to 5 degrees Fahrenheit), most prominently over the Beaufort Sea, where, because of the pressure pattern, winds were anomalously from the south. Melt began two to three weeks earlier than average in the Barents and Kara seas, leading to earlier retreat of sea ice in the region; however, air temperatures remained below average during summer in this region. This points to the impact the continued loss of old, thick ice is having on the ability of the sea ice cover to survive summer melt. Other than the August storm, the pressure pattern in 2012 does not appear to have been as favorable in promoting ice loss as was the case in 2007, and yet a new record low occurred.

Old, thick ice dwindles; young, thin ice prevails

Figure 5. These images from September 2007 (top, left) and September 2012 (top, right) show the decline of multiyear ice since the previous record minimum extent was set in 2007. The chart at bottom shows the changes in multiyear ice from 1983 to 2012. Ice of all ages has declined; 5+ year old ice has declined quite sharply. Much of the Arctic ice cover now consists of first-year ice (shown in purple), which tends to melt rapidly in summer’s warmth.

Credit: M. Tschudi and J. Maslanik, University of Colorado Boulder
High-resolution image

Entering the melt season, a thinner ice cover made the Arctic sea ice cover more vulnerable to weather, such as the storm that tracked through the Arctic in early August. Because the ice was thin and already decaying by the time of the storm, it was quickly broken up and melted by winds and waves.

The end-of-summer sea ice cover was not only the least extensive in the satellite record, but also very likely the lowest volume, based on combined model-observation estimates from the University of Washington, and inferred from ice age. The extent of ice of nearly all age categories declined from last year and remained at record low levels. The only category that increased was 4-year-old ice. This is ice that has aged since the previous record low minimum extent in 2007, when substantial amounts of first-year ice were lost. This 4-year-old ice will now age into the 5+ year category as the ice-growth season begins. However, even with this replenishment this winter will see only approximately 20% of the old (5+ year) ice compared to the 1980s. Because of the record summer ice loss, this winter will see the Arctic Ocean region even more dominated by the thinner first-year ice. As shown in Figure 5, the amount of ice in nearly all age categories has decreased since 2007, particularly the oldest ice.

For more information and visualizations of thinning sea ice, see the NOAA Climate Watch article, “Arctic Sea Ice Getting Thinner, Younger.”

A view towards the south

Figure 6a. Antarctic sea ice extent for September 26, 2012 (top image) was 19.44 million square kilometers (7.51 million square miles). The orange line shows the 1979 to 2000 median extent for that day of the year. The black cross indicates the geographic South Pole. The graph (bottom) shows Antarctic sea ice extent as of September 30, 2012. The 1979 to 2000 average is in dark gray. The gray area around this average line shows the two standard deviation range of the data. Sea Ice Index data.

Credit: National Snow and Ice Data Center
High-resolution image

Figure 6b. The monthly September Antarctic extent trend for 1979 to 2012 is +0.9% per decade.

Credit: National Snow and Ice Data Center
High-resolution image

As the Arctic was experiencing a record low minimum extent, the Antarctic was reaching record high levels in the satellite record, culminating in a winter maximum extent of 19.44 million square kilometers (7.51 million square miles) on September 26. The September 2012 monthly average was also a record high, at 19.39 million square kilometers (7.49 million square miles) slightly higher than the previous record in 2006.

The September extent trend for 1979 to 2012 is just above the statistical significance level (0.9% per decade, plus or minus 0.6%). The new Antarctic sea ice September value is slightly greater than typical year-to-year variations, and is roughly equal to a 25 mile (40 kilometer) northward shift in the location of the ice edge relative to the 1979 to 2000 average. The trend for ice extent growth during Antarctic winters is about 16,000 square kilometers per year (6,200 square miles) or roughly an area the size of Connecticut. In comparison, the decline in Arctic summer sea ice extent is an area about the size of Indiana (91,600 square kilometers per year, or about 35,400 square miles).

Our colleague, Dr. Sharon Stammerjohn of INSTAAR, University of Colorado, provides a review of the differences between Arctic and Antarctic climate controls on sea ice and helps place the events in context. First, climate is warming over much of the Antarctic continent, as shown in several recent studies (e.g., Chapman and Walsh, 2007, Monaghan et al., 2008, Steig et al., 2009) and is related to Pacific Ocean warming (Ding et al., 2010) and circumpolar winds. Both warming and ozone loss act to strengthen the circumpolar winds in the south. This is due primarily to persistently cold conditions prevailing on Antarctica year-round, and a cold stratosphere above Antarctica due to the ozone hole. Stronger winds generally act to blow the sea ice outward, slightly increasing the extent, except in the Antarctic Peninsula region, where due to geography, winds from the north have also increased, pushing the ice southward. Thus, sea ice extent near the northwestern Antarctic Peninsula continues to decline rapidly, while areas in the Ross Sea and the southern Indian Ocean show significant increases (Stammerjohn et al., 2012). Circumpolar-averaged sea ice extent changes nearly cancel each other out for all months of the year (Parkinson and Cavalieri, 2012). This winter, atmospheric conditions were near average overall, with roughly equal areas of cooler and warmer air temperatures over the sea ice.

Comparing winter and summer sea ice trends for the two poles is problematic since different processes are in effect. During summer, surface melt and ice-albedo feedbacks are in effect; winter processes include snowfall on the sea ice, and wind. Small changes in winter extent may be a more mixed signal than the loss of summer sea ice extent. An expansion of winter Antarctic ice could be due to cooling, winds, or snowfall, whereas Arctic summer sea ice decline is more closely linked to decadal climate warming.

For more information on Antarctic climate and sea ice, see NSIDC’s Icelights, our Sea Ice Index, and our State of the Cryosphere Web sites. The NASA Goddard Ozone Watch site also provides additional background information.

Table 1: Previous Arctic sea ice extents for the month of September

Year Average Arctic Sea Ice Extent for September Trend, in % per decade (relative to 1979-2000 avg.)
in millions of square kilometers in millions of square miles
2007 4.30 1.66 -10.2
2008 4.73 1.83 -11.0
2009 5.36 2.08 -11.1
2010 4.90 1.90 -11.5
2011 4.61 1.78 -12.0
2012 3.61 1.39 -13.0
1979 to 2000 average 7.04 2.72
1979 to 2010 average 6.52 2.52

References

Parkinson, C., and D. Cavalieri. 2012. Antarctic sea ice variability and trends. The Cryosphere 6, 871-880, doi:10.5194/tc-6-871-2012.

Stammerjohn, S., R. Massom, D. Rind, and D. Martinson. 2012. Regions of rapid sea ice change: an inter-hemispheric seasonal comparison. Geophysical Research Letters 39, L06501, doi:10.1029/2012GL050874.

Ding, Q., E. Steig, D. Battisi, and M. Kuttel. 2011. Winter warming in West Antarctica caused by central tropical Pacific warming. Nature Geoscience 4, doi:10.1038/ngeo1129.

Steig, E., D. P. Schneider, S. D. Rutherford, M. Mann, J. C. Comiso, and D. T. Shindell. 2009. Warming of the Antarctic ice-sheet surface since the 1957 International Geophysical Year. Nature 457, 459-462, doi:10.1038/nature07669.

Monaghan, A. J., D. H. Bromwich, W. Chapman, and J. Comiso. 2008. Recent variability and trends of Antarctic near-surface temperature. Journal of Geophysical Research 113, D04105, doi:10.1029/2007JD009094.

Chapman, W. L., and J. E. Walsh. 2007. A synthesis of Antarctic temperatures. Journal of Climate 20 (16), 4096-4117, doi:10.1175/JCLI4236.1.

Video animations of sea ice extent

Arctic sea ice extent settles at record seasonal minimum

On September 16, Arctic sea ice appeared to have reached its minimum extent for the year of 3.41 million square kilometers (1.32 million square miles). This is the lowest seasonal minimum extent in the satellite record since 1979 and reinforces the long-term downward trend in Arctic ice extent. The sea ice extent will now begin its seasonal increase through autumn and winter.

Please note that this is a preliminary announcement. Changing winds could still push ice floes together, reducing ice extent further. NSIDC scientists will release a full analysis of the melt season in early October, once monthly data are available for September.

Overview of conditions

Figure 1. Arctic sea ice extent for September 16, 2012 was 3.41 million square kilometers (1.32 million square miles). The orange line shows the 1979 to 2000 median extent for that day. The black cross indicates the geographic North Pole. Sea Ice Index data. About the data

Credit: National Snow and Ice Data Center
High-resolution image

On September 16, 2012 sea ice extent dropped to 3.41 million square kilometers (1.32 million square miles). This appears to have been the lowest extent of the year. In response to the setting sun and falling temperatures, ice extent will now climb through autumn and winter. However, a shift in wind patterns or a period of late season melt could still push the ice extent lower. The minimum extent was reached three days later than the 1979 to 2000 average minimum date of September 13.

This year’s minimum was 760,000 square kilometers (293,000 square miles) below the previous record minimum extent in the satellite record, which occurred on September 18, 2007.  This is an area about the size of the state of Texas. The September 2012 minimum was in turn 3.29 million square kilometers (1.27 million square miles) below the 1979 to 2000 average minimum, representing an area nearly twice the size of the state of Alaska. This year’s minimum is 18% below 2007 and 49% below the 1979 to 2000 average.

Overall there was a loss of 11.83 million square kilometers (4.57 million square miles) of ice since the maximum extent occurred on March 20, 2012, which is the largest summer ice extent loss in the satellite record, more than one million square kilometers greater than in any previous year.

Conditions in context

Figure 2. The graph above shows Arctic sea ice extent as of September 17, 2012, along with daily ice extent data for 2007 and 2005, the previous record low years. 2012 is shown in blue and 2007 in green. The gray area around the average line shows the two standard deviation range of the data. Sea Ice Index data.

Credit: National Snow and Ice Data Center
High-resolution image

The six lowest seasonal minimum ice extents in the satellite record have all occurred in the last six years (2007 to 2012). In contrast to 2007, when climatic conditions (winds, clouds, air temperatures) favored summer ice loss, this year’s conditions were not as extreme. Summer temperatures across the Arctic were warmer than average, but cooler than in 2007. The most notable event was a very strong storm centered over the central Arctic Ocean in early August. It is likely that the primary reason for the large loss of ice this summer is that the ice cover has continued to thin and become more dominated by seasonal ice. This thinner ice was more prone to be broken up and melted by weather events, such as the strong low pressure system just mentioned. The storm sped up the loss of the thin ice that appears to have been already on the verge of melting completely.

 Varying distribution of ice in 2012 vs. 2007

Figure 3. The image above shows the different distribution of ice extent at the time of the September 2012 minimum, compared to the September 2007 minimum. Dark gray indicates where ice extent was present only in 2007; white indicates where ice extent was present only in 2012; and light gray shows where ice extent was present in both 2007 and 2012.

Credit: National Snow and Ice Data Center
High resolution image

The spatial pattern of ice extent at this year’s seasonal minimum is different than that observed for 2007. This year the ice is more extensive in some parts of the central Arctic Ocean. However, the ice is less extensive this year compared to 2007 in the Beaufort Sea, the western Laptev Sea, the East Greenland Sea, and parts of the Canadian Archipelago. As mentioned in our previous post, the Northern Sea Route opened around mid August this year, compared to 2007 when a tongue of ice extended to the coast, blocking the route throughout the summer.

Previous minimum Arctic sea ice extents

Table 1. Previous minimum Arctic sea ice extents
 Year Minimum Ice Extent Date
in millions of square kilometers in millions of square miles
2007 4.17 1.61 September 18
2008 4.59 1.77 September 20
2009 5.13 1.98 September 13
2010 4.63 1.79 September 21
2011 4.33 1.67 September 11
2012 3.41 1.32 September 16
1979 to 2000 average 6.70 2.59 September 13
1979 to 2010 average 6.14 2.37 September 15

Note that the dates and extents of the minimums have changed since we originally posted in 2007; see our Frequently Asked Questions for more information.

Arctic sea ice extent near the minimum

On September 17, Arctic sea ice extent was 3.41 million square kilometers. Within the next couple of days, we expect to announce that the minimum extent has been reached for the year.

Overview of conditions

Figure 1. Arctic sea ice extent for September 17, 2012 was 3.41 million square kilometers (1.32 million square miles). The orange line shows the 1979 to 2000 median extent for that day. The black cross indicates the geographic North Pole. Sea Ice Index data. About the data

Credit: National Snow and Ice Data Center
High-resolution image

Sea ice extent for September 17 was 3.41 million square kilometers (1.32 million square miles). Weather conditions near the ice edge heavily influence the timing of the minimum, which has occurred as late as September 23. We are now five days past the 1979 to 2000 average minimum date of September 13. The decline has slowed in recent days and the minimum will likely be confirmed any day now.

The current extent is 760,000 square kilometers (293,000 square miles) below the previous record minimum extent in the satellite record (4.17 million square kilometers or 1.61 million square miles) which occurred on September 18, 2007. This difference is larger than the size of the state of Texas. The ice extent currently tracks nearly 50% below the 1979 to 2000 average minimum extent.

Conditions in context

Figure 2. The graph above shows Arctic sea ice extent as of September 17, 2012, along with daily ice extent data for 2007. 2012 is shown in blue and 2007 in green. The gray area around the average line shows the two standard deviation range of the data. Sea Ice Index data.

Credit: National Snow and Ice Data Center
High-resolution image

Since September 1, extent declined 316,000 square kilometers (122,000 square miles), or 19,800 square kilometers (7,600 square miles) per day. Freeze up has begun over the high latitude Arctic areas, such as the North Pole, and extent has started to increase in the Beaufort Sea region. However, extent is still decreasing on the Atlantic side of the Arctic, leading to the continued overall decline in recent days. The Northern Sea Route along the coast of Siberia has been largely free of ice since mid August. This is in contrast with 2007, when a persistent tongue of ice reaching the coast of the Laptev Sea clogged the Northern Sea Route.

The Northwest Passage

Figure 3. This time series shows total sea ice area (top) and multiyear ice area (bottom) for selected years within the Western Parry Channel route of the Northwest Passage. The black line with red dots shows 2012, and other colors show ice conditions in different years.

Credit: NSIDC courtesy Stephen Howell, Environment Canada, from Canadian Ice Service data
High-resolution image

The situation in the Northwest Passage this year also contrasts with 2007. Both the narrow and shallow southern route used by the late polar explorer Roald Amundsen and the wide and deep northern route through the Parry Channel opened in 2007. This year only the southern route has opened. According to Stephen Howell of the Canadian Ice Service, rapid ice loss occurred in the Parry Channel in July. However, due in part to the August storm, a subsequent influx of multiyear ice from the north has kept at least some of the channel blocked.

These different patterns of ice loss in the sea routes between 2007 and 2012 highlight how a focus on overall total extent can overshadow regional aspects that have important implications. That 2007 was a record low extent at the time meant nothing to a ship trying to traverse the Northern Sea Route; likewise, the new record this year was meaningless to a ship trying to navigate through the Parry Channel.

Conditions in the Chukchi Sea, where Shell has started to drill for oil, provide another example. Shell’s operations were delayed in part because of greater than expected ice cover in the early summer. In the late summer, although passive microwave data showed that the Chukchi Sea was nearly ice-free, small floes of ice threatened Shell’s drilling platform, forcing the company to temporarily cease operations in the Arctic.

A report from the field

Figure 4. Above are photos of varying sea ice conditions north of Svalbard. The top photo shows shows denser ice cover, around 90% concentration, with a mixture of small floes and brash ice (i.e., slushy ice remnants of melt). The bottom photo shows lower concentrations of small ice floes with considerable open water.

Credit: National Snow and Ice Data Center, Julienne Stroeve

NSIDC scientist Julienne Stroeve has been traveling in the Arctic by ship, taking sea ice and temperature measurements on the Atlantic side of the Arctic Ocean. Her reports also show the regional variability of the ice cover. She reached the ice edge on September 10 at roughly 82 degrees North latitude, 15 degrees East longitude (essentially due north of Svalbard). Concentrations were quite high (around 90%) at the ice edge, but as the ship cruised north, concentration dropped to about 40% with considerable regions of open water.

Since entering the ice, Stroeve has encountered an average of up to 65% ice concentration primarily consisting of small floes (20 to 50 meters, or 66 to 164 feet) of mostly first-year ice. These floes are too small and thin to safely embark on to take measurements. However, the ship eventually found larger floes and Stroeve took ice thickness measurements indicating thicknessess of around 2 meters (6.5 feet). So far, air temperatures have remained above freezing and Stroeve has not observed any ice formation. The surface measurements taken by Stroeve and other scientists on board the ship are useful for validating satellite data and will provide more detail on the state of the sea ice cover. Stroeve sighted several polar bears, including a mother and her cub.

Arctic sea ice falls below 4 million square kilometers

Following the new record low recorded on August 26, Arctic sea ice extent continued to drop and is now below 4.00 million square kilometers (1.54 million square miles). Compared to September conditions in the 1980s and 1990s, this represents a 45% reduction in the area of the Arctic covered by sea ice. At least one more week likely remains in the melt season.

Overview of conditions

Figure 1. Arctic sea ice extent for August 2012 was 4.72 million square kilometers (1.82 million square miles). The magenta line shows the 1979 to 2000 median extent for that month. The black cross indicates the geographic North Pole. Sea Ice Index data. About the data

Credit: National Snow and Ice Data Center
High-resolution image

Throughout the month of August, Arctic sea ice extent tracked below levels observed in 2007, leading to a new record low for the month of 4.72 million square kilometers (1.82 million square miles), as assessed over the period of satellite observations,1979 to present. Extent was unusually low for all sectors of the Arctic, except the East Greenland Sea where the ice edge remained near its normal position. On August 26, the 5-day running average for ice extent dropped below the previous record low daily extent, observed on September 18, 2007, of 4.17 million square kilometers (1.61 million square miles). By the end of the month, daily extent had dropped below 4.00 million square kilometers (1.54 million square miles). Typically, the melt season ends around the second week in September. 

Conditions in context

Figure 2. The graph above shows Arctic sea ice extent as of September 3, 2012, along with daily ice extent data for the previous five years. 2012 is shown in blue, 2011 in orange, 2010 in pink, 2009 in navy, 2008 in purple, and 2007 in green. The 1979 to 2000 average is in dark gray. The gray area around this average line shows the two standard deviation range of the data. Sea Ice Index data.

Credit: National Snow and Ice Data Center
High-resolution image

In 2012, the rate of ice loss for August was 91,700 square kilometers (35,400 square miles) per day, the fastest observed for the month of August over the period of satellite observations. In August 2007, ice was lost at a rate of 66,000 square kilometers (25,400 square miles) per day, and in 2008, the year with the previous highest August ice loss, the rate was 80,600 square kilometers (31,100 square miles) per day. The average ice loss for August is 55,100 square kilometers (21,300 square miles) per day. This rapid pace of ice loss in 2012 was dominated by large losses in the East Siberian and the Chukchi seas, likely caused in part by the strong cyclone that entered the region earlier in the month and helped to break up the ice. However, even after the cyclone had dissipated, ice loss continued at a rate of 77,800 square kilometers (30,000 square miles) per day.

August air temperatures at the 925 hPa level (approximately 3,000 feet above the surface) remained slightly above average (1 to 3 degrees Celsius, or 2 to 5 degrees Fahrenheit) over the much of the Pacific sector of the Arctic Ocean as well as at its central sector, with slightly higher temperatures in the Beaufort Sea (approximately 4 degrees Celsius, or 7 degrees Fahrenheit above average). On the Atlantic side, the Kara and Barents seas continued to have air temperatures around 1 to 4 degrees Celsius (2 to 7 degrees Fahrenheit) below average.

At the end of August, ice remained in the Western Parry Channel, and neither the northern or southern routes of the Northwest Passage were open. While much of the ice has cleared out, ice still remains, as confirmed by our colleague Steve Howell at the Canadian Ice Service. In the latter half of August, more ice actually moved into the passage routes when ice was pushed down into the channels from the north. Whether that ice will clear out remains to be seen.

August 2012 compared to previous years

Figure 3. Monthly August ice extent for 1979 to 2012 shows a decline of 10.2% per decade.


Credit: National Snow and Ice Data Center
High-resolution image

The monthly averaged ice extent for August was 4.72 million square kilometers (1.82 square miles). This is 2.94 million square kilometers (1.14 million square miles) below the 1979 to 2000 average extent, and 640,000 square kilometers (247,000 square miles) below the previous record low for August set in 2007. Including 2012, the August trend is -78,100 square kilometers (-30,200 square miles) per year, or -10.2 % per decade relative to the 1979 to 2000 average.

Evolution of sea surface temperatures in August

sea surface temperature images

Figure 4. A buoy deployed on August 8, 2012 in open water during the storm initially shows a very warm 10-meter (33-foot) thick surface mixed layer (upper left image). On August 12 (upper right image), the buoy enters a relatively cooler patch, gradually warms, enters another cool patch 12 days later (bottom left image), and then starts to warm again through August 26 (bottom right image). Red, orange, and yellow indicate higher temperatures, while blues and purples indicate lower temperatures.

Credit: University of Washington Polar Science Center
High-resolution image

In recent summers, Arctic Ocean sea surface temperatures (SSTs) have been anomalously high (see our 2010 and 2011 end-of-summer posts), in part linked to loss of the reflective ice cover that allows darker open water areas to readily absorb solar radiation and warm the mixed layer of the ocean. According to Mike Steele, Wendy Ermold and Ignatius Rigor of the University of Washington, SSTs in the Beaufort, Chukchi, and Laptev seas were once again anomalously high before the strong cyclone (mentioned earlier and discussed in our previous post) entered the East Siberian and Chukchi seas on August 5, 2012. SSTs were as much as 5 degrees Celsius (9 degrees Fahrenheit) above normal along the coastal areas in those seas. After the storm, the warm water that developed through summer was interspersed with large areas of cold water created by ice melt. By the third week of August, sea surface temperatures were mostly back to levels observed before the storm, but with a few more patches of colder water interspersed from additional ice melt.

A closer view of the variation in SSTs before and after the storm is recorded in the University of Washington Polar Science Center UpTempO buoy data. A buoy deployed on August 8, 2012 in open water during the storm initially shows a very warm 10-meter (33-foot) thick surface mixed layer, likely the result of solar heating. On August 12, the buoy enters a relatively cooler patch, gradually warms, enters another cool patch 12 days later and then starts to warm again through August 26. These patches of cooler water may be a result of ice melt and/or the impact of advection from the storm.

Old ice continues to decline

Figure 5. These images from March 2012 (left) and August 2012 (right) show the age of the ice cover in spring and at the end of summer. Much of the Arctic ice cover now consists of first-year ice (shown in purple), which tends to melt rapidly in summer’s warmth. However, the oldest ice, that had survived five or more summers (shown in white), declined by 51%.

Credit: M. Tschudi and J. Maslanik, University of Colorado Boulder
High-resolution image

Ice age is an important indicator of the health of the ice cover. Old ice, also called multiyear ice, tends to be thicker ice and less prone to melting out in summer. The last few summers have seen increased losses of multiyear ice in the Pacific sector of the Arctic; multiyear ice that is transported into the Beaufort and Chukchi seas tends to melt out in summer before being transported back to the central Arctic Ocean through the clockwise Beaufort Gyre circulation. This summer, the tongue of multiyear ice along the Alaska coast mostly melted out by the end of August, with a small remnant left in the Chukchi Sea. The ice on the Pacific side of the Arctic has melted back to the edge of the multiyear ice cover, which should help to slow further ice loss in the region. In the Laptev Sea, by contrast, a large amount of first-year ice remains. In the last two weeks, open water areas have developed within the first-year ice in the Laptev Sea, helping to further foster melt in that region.

Between mid-March and the third week of August, the total amount of multiyear ice within the Arctic Ocean declined by 33%, and the oldest ice, ice older than five years, declined by 51%.

Further reading

Kwok, R., and G. F. Cunningham. 2010. Contribution of melt in the Beaufort Sea to the decline in Arctic multiyear sea ice coverage: 1993–2009. Geophys. Res. Lett., 37, L20501, doi:10.1029/2010GL044678.

Maslanik, J.A., C. Fowler, J. Stroeve, and W. Emery. 2011. Distribution and trends in Arctic sea ice age through spring 2011. Geophys. Res. Lett., 38, L13502, doi:10.1029/2011GL047735.

Arctic sea ice extent breaks 2007 record low

Arctic sea ice appears to have broken the 2007 record daily extent and is now the lowest in the satellite era. With two to three more weeks left in the melt season, sea ice continues to track below 2007 daily extents.

Please note that this is not an announcement of the sea ice minimum extent for 2012. NSIDC will release numbers for the 2012 daily minimum extent when it occurs. A full analysis of the melt season will be published in early October, once monthly data are available for September.

Overview of conditions

Figure 1. Arctic sea ice extent for August 26, 2012 (right) was 4.10 million square kilometers (1.58 million square miles), which was 70,000 square kilometers (27,000 square miles) below the September 18, 2007 daily extent of 4.17 million square kilometers (1.61 million square miles, left). The orange line shows the 1979 to 2000 median extent for that day. The black cross indicates the geographic North Pole. Sea Ice Index data. About the data.


Credit: National Snow and Ice Data Center
High-resolution images: Figure 1a , Figure 1b

Arctic sea ice extent fell to 4.10 million square kilometers (1.58 million square miles) on August 26, 2012. This was 70,000 square kilometers (27,000 square miles) below the September 18, 2007 daily extent of 4.17 million square kilometers (1.61 million square miles).

Including this year, the six lowest ice extents in the satellite record have occurred in the last six years (2007 to 2012).

Conditions in context

Figure 2. The graph above shows Arctic sea ice extent as of August 26, 2012, along with daily ice extent data for 2007, the previous record low year, and 1980, the record high year. 2012 is shown in blue, 2007 in green, and 1980 in orange. The 1979 to 2000 average is in dark gray. The gray area around this average line shows the two standard deviation range of the data. The 1981 to 2010 average is in sky blue. Sea Ice Index data.

Credit: National Snow and Ice Data Center
High-resolution image  


After tracking near 2007 levels through July, the extent declined rapidly in early August. Since then, the loss rate has slowed some, averaging about 75,000 square kilometers (29,000 square miles) per day—equivalent to the size of the state of South Carolina. However, this is still much faster than the normal rate at this time of year of about 40,000 square kilometers per day (15,000 square miles).

Note that the date and extent of the 2007 minimum have changed since we originally posted in 2007; see our Frequently Asked Questions for more information.