Arctic sea ice extent is now tracking below 2010, 2013, and 2014. Openings in the ice cover have continued to expand within the Beaufort and Chukchi seas. While the Northern Sea Route has opened, the Northwest Passage remains clogged with considerable ice in the channels of the Canadian Archipelago. However, some data sources indicate narrow openings in the ice where navigation may be possible.
Overview of conditions
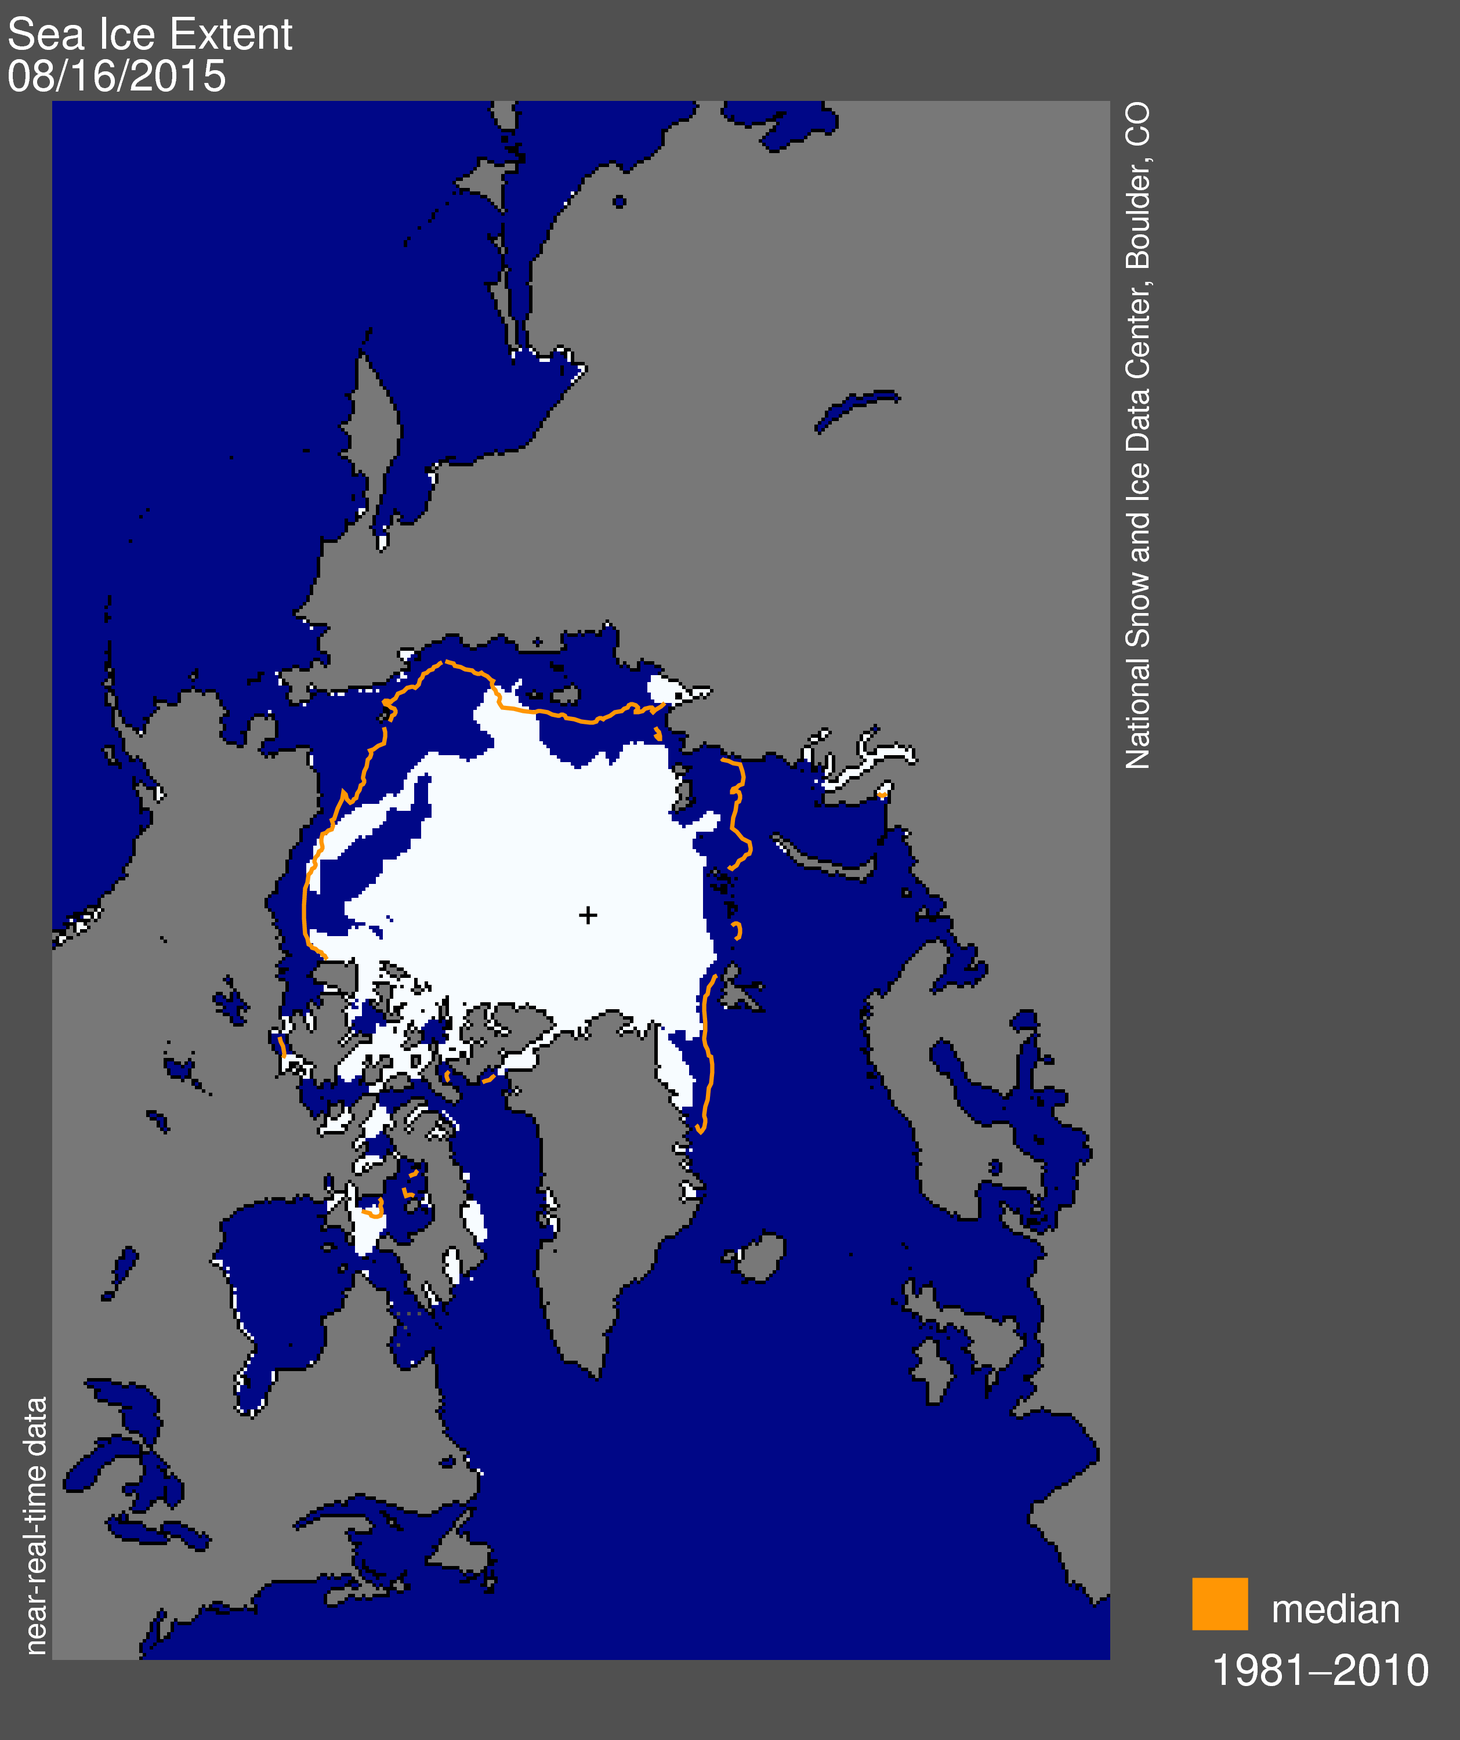
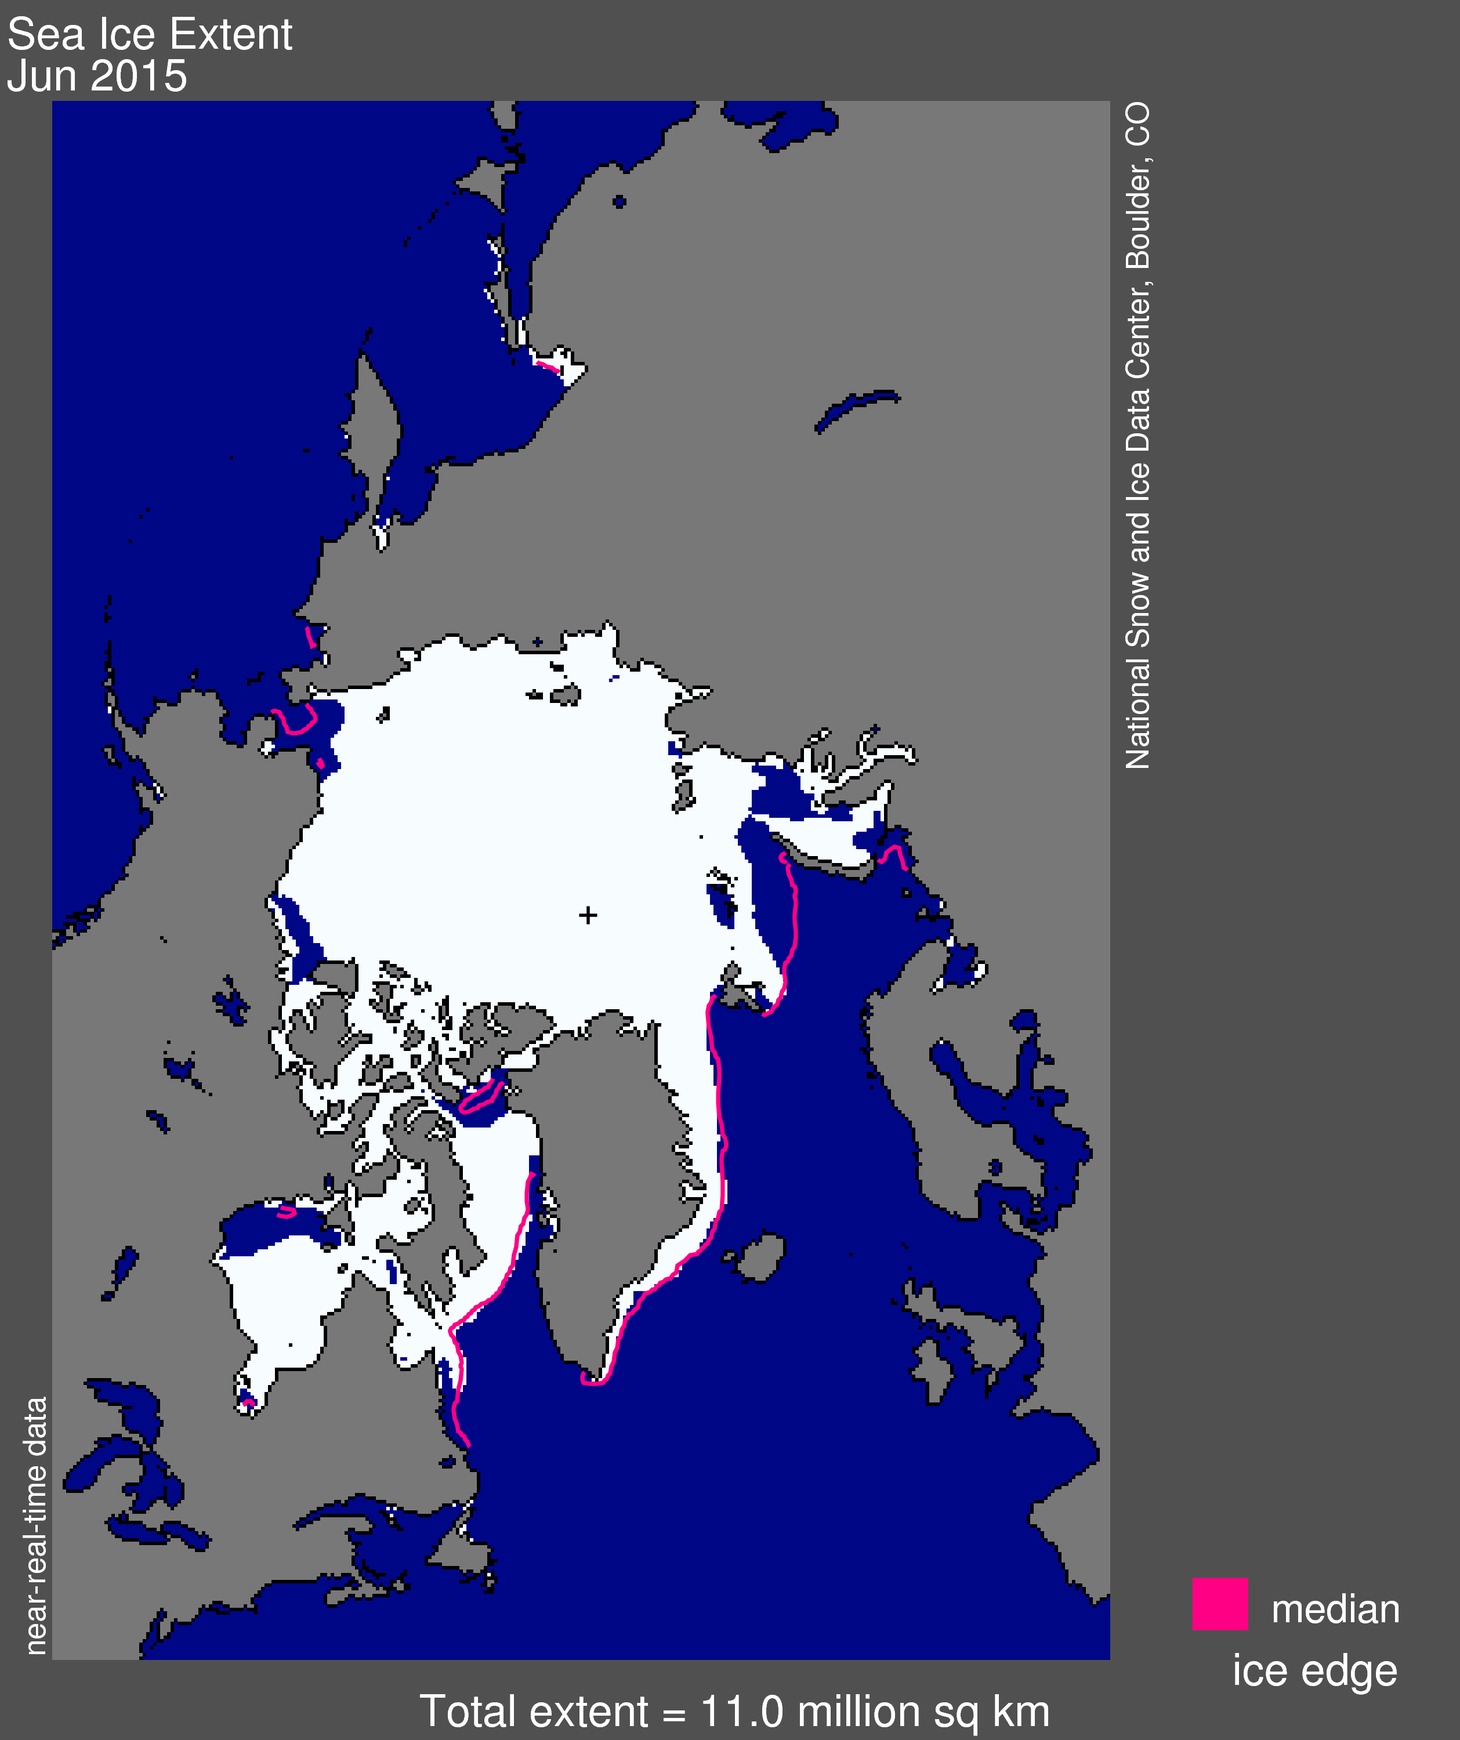
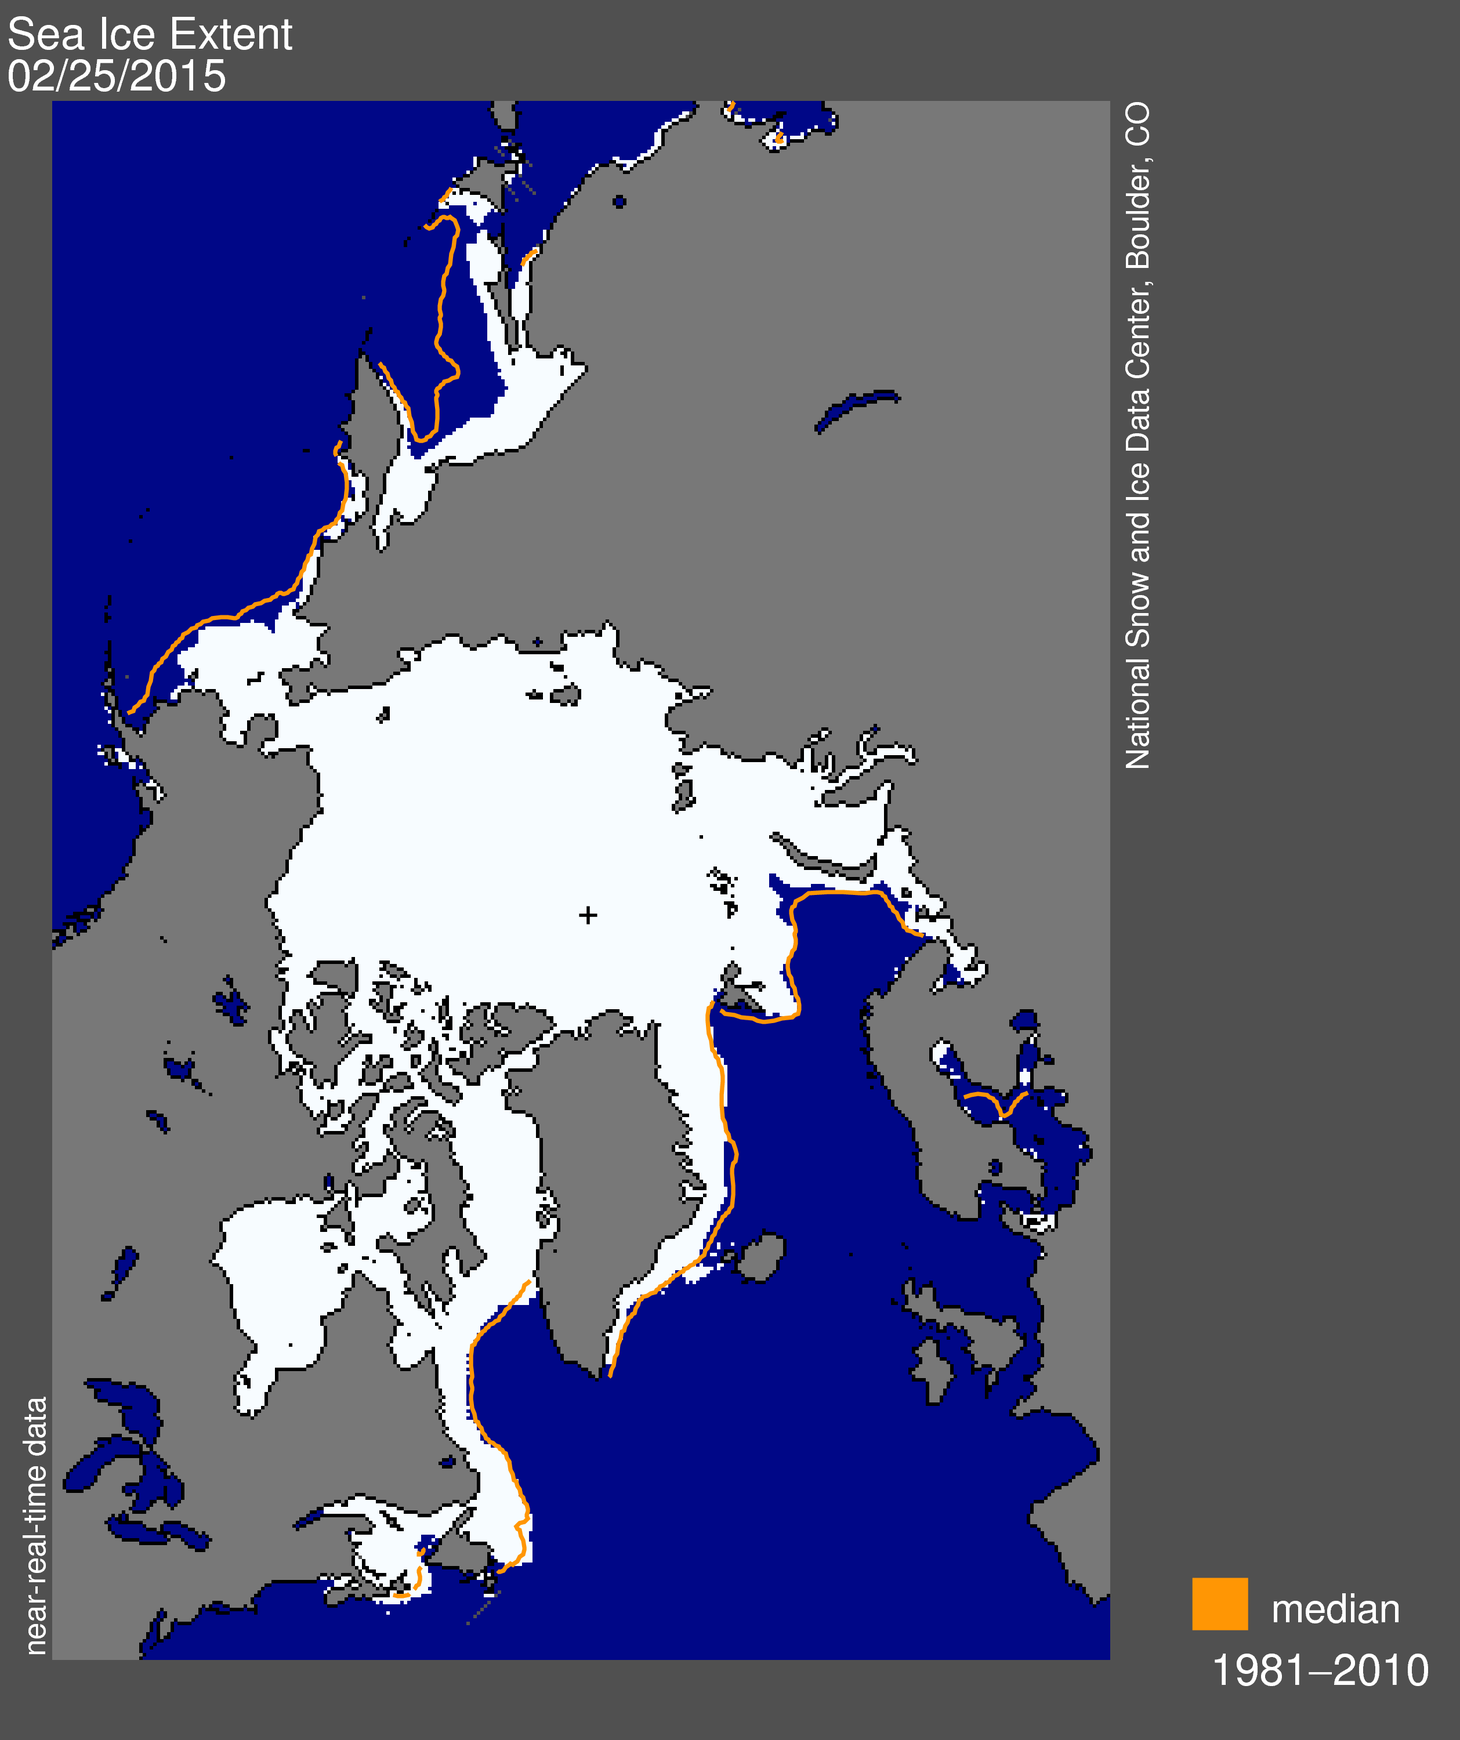
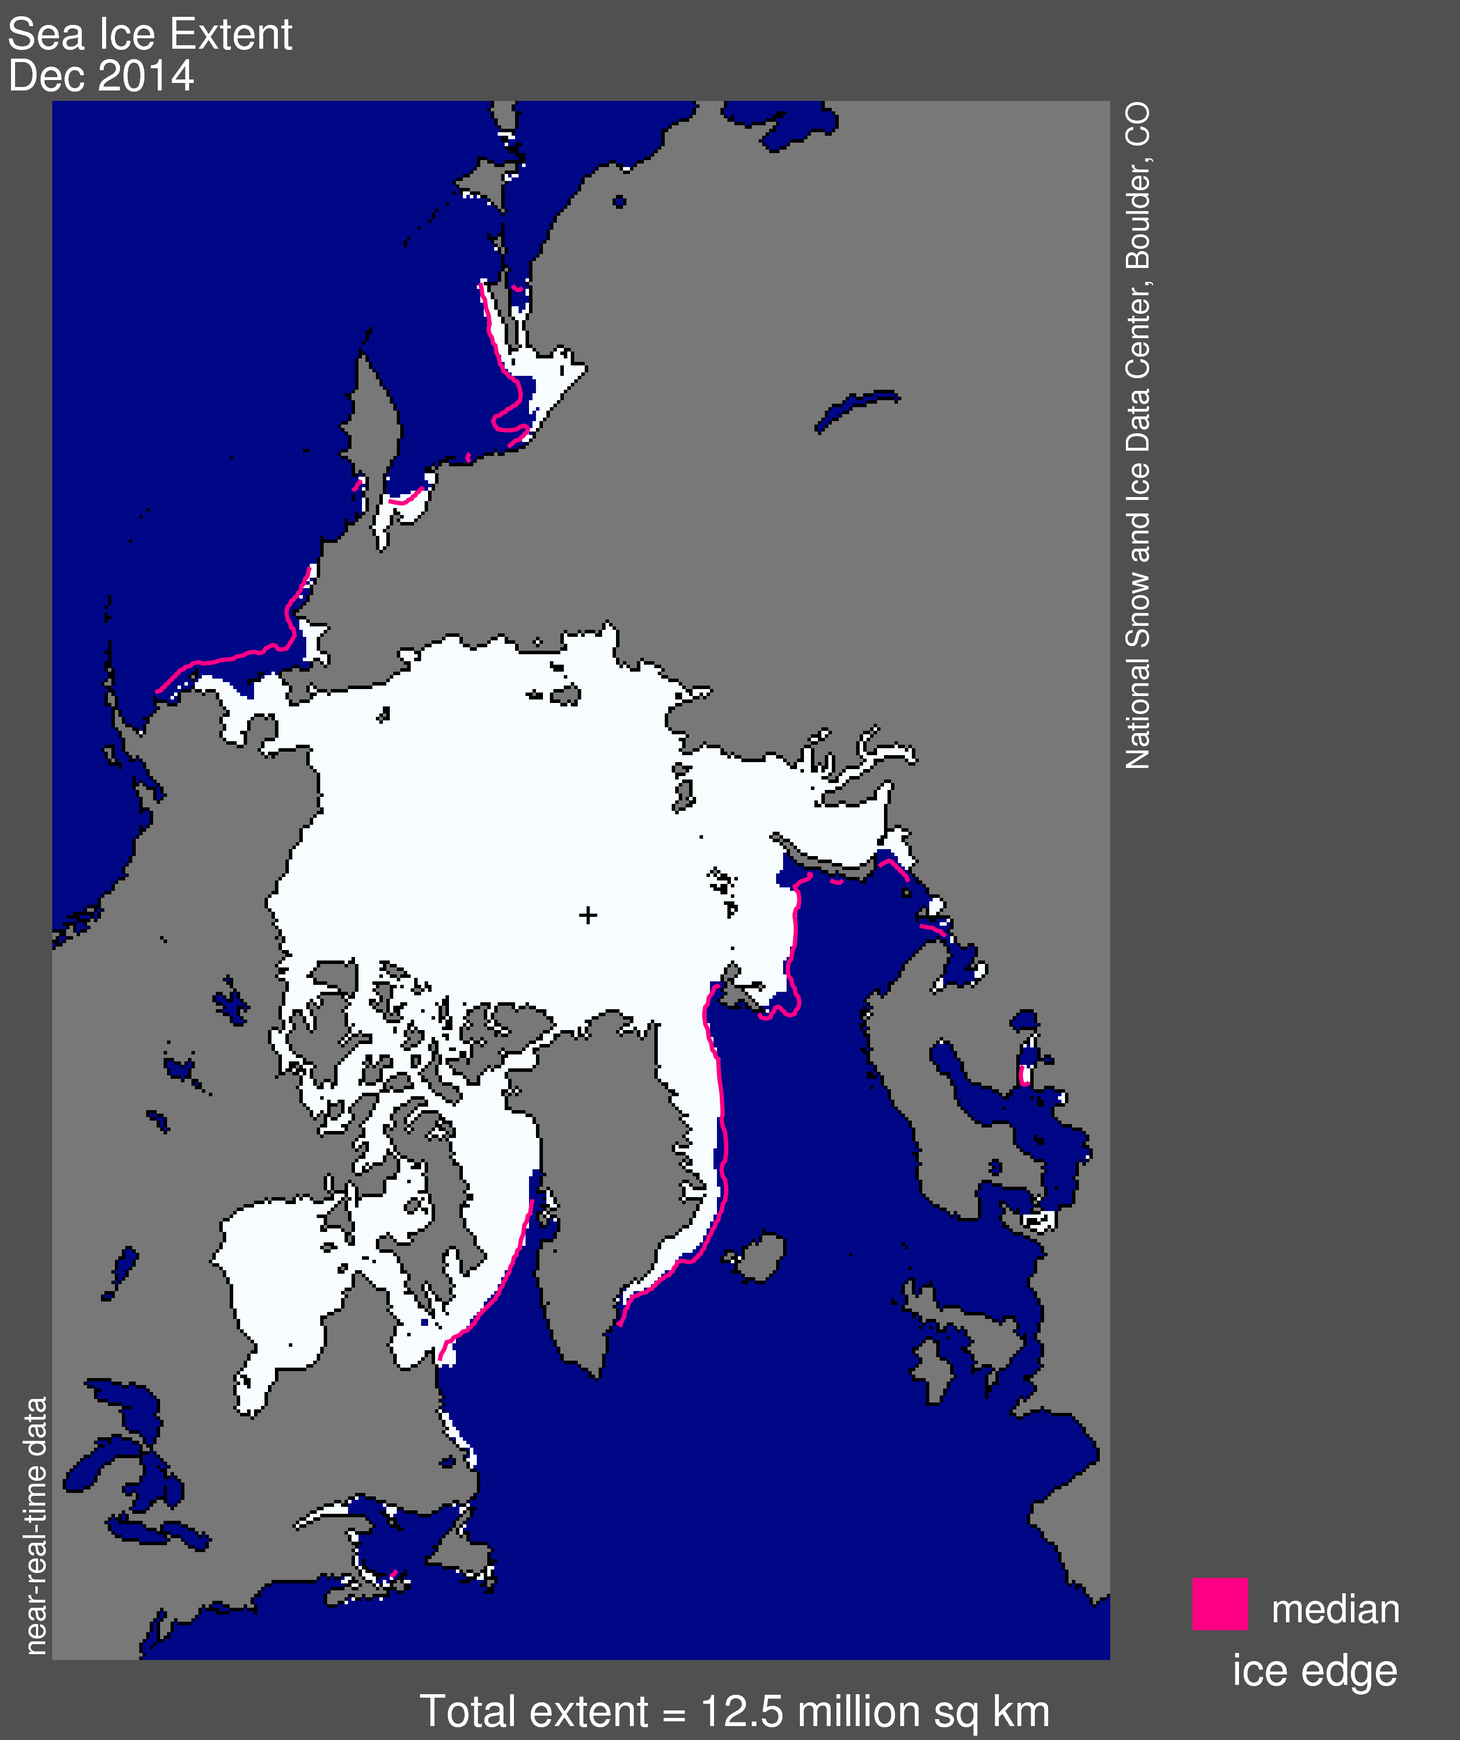
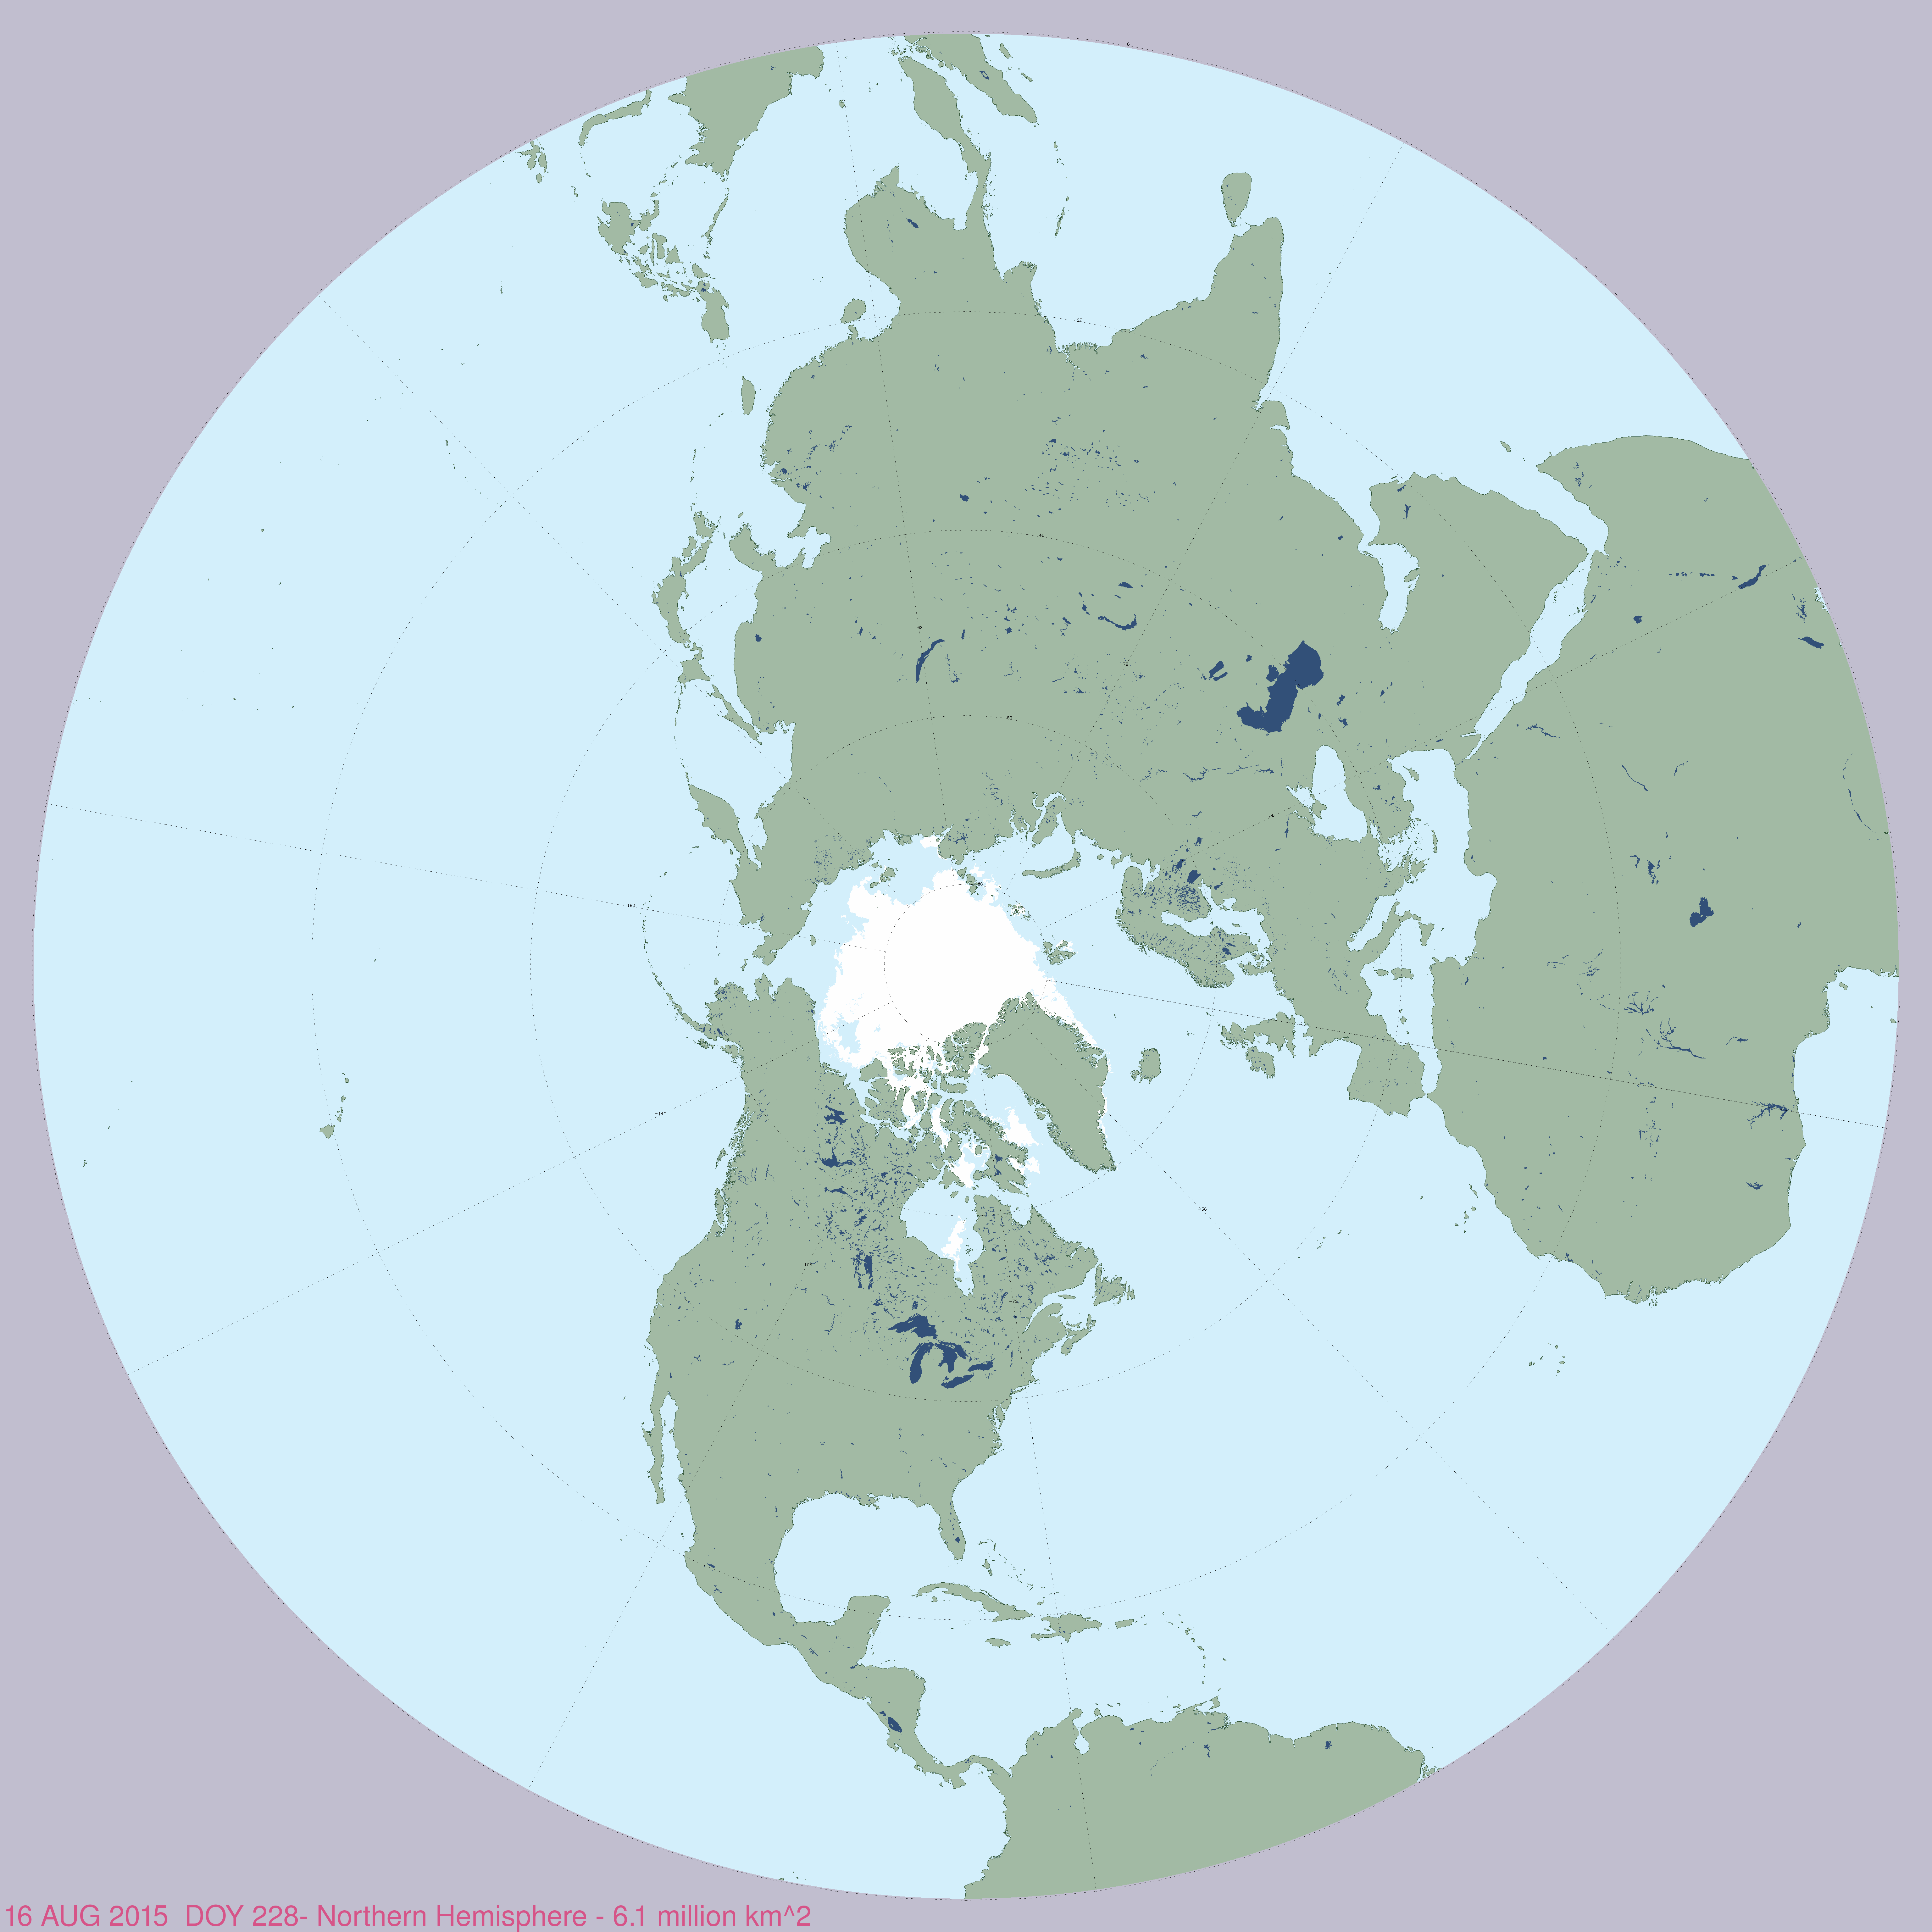
Figure 1. Arctic sea ice extent for August 16, 2015 was 5.79 million square kilometers (2.24 million square miles). The orange line shows the 1981 to 2010 median extent for that day. The black cross indicates the geographic North Pole. Sea Ice Index data. About the data
Credit: National Snow and Ice Data Center
High-resolution image
On August 16, 2015 sea ice extent stood at 5.79 million square kilometers (2.24 million square miles). This is 1.35 million square kilometers (521,200 square miles) below the 1981 to 2010 average, and 1.17 million square kilometers (451,700 square miles) above the level for the same date in 2012, the year of the record low extent.
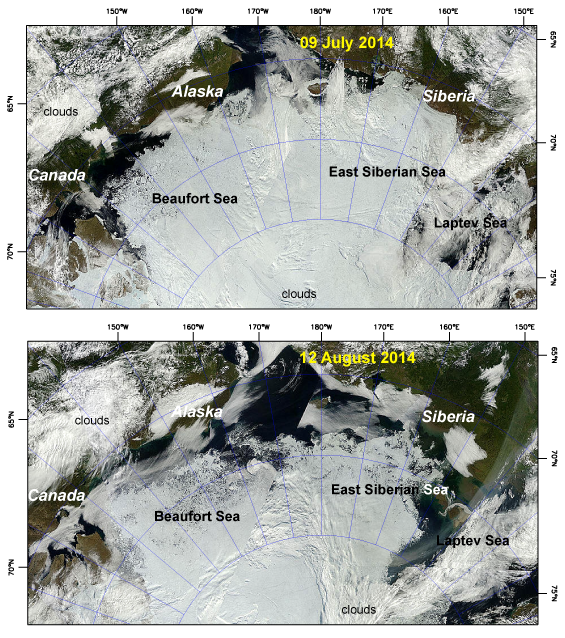
The rate of ice retreat slowed compared to July, but remained faster than is typical for the month through the first half of August. Most of the ice in Baffin and Hudson bays has finally melted out. Large areas of open water and low concentration ice within the Beaufort and Chukchi seas continued to expand. Some of the low concentration ice depicted in the passive microwave data could be due to the presence of melt ponds on higher concentration ice. However, visible imagery from the Moderate Resolution Imaging Spectroradiometer (MODIS) sensor on the NASA Terra and Aqua satellites confirm a very loose ice pack with considerable open water in the region. Most of the remaining ice appears to be fairly thick multiyear floes interspersed by thinner first-year ice that is rapidly melting out. In the eastern Arctic, the ice pack remains more consolidated.
Conditions in context
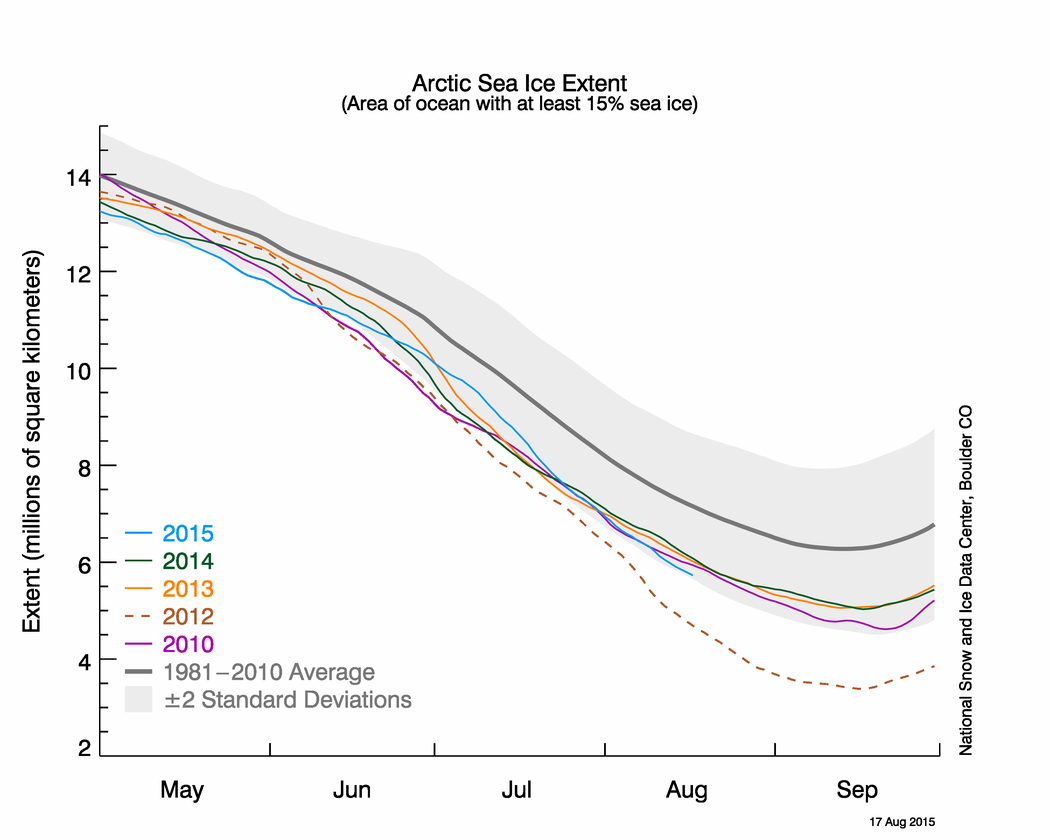
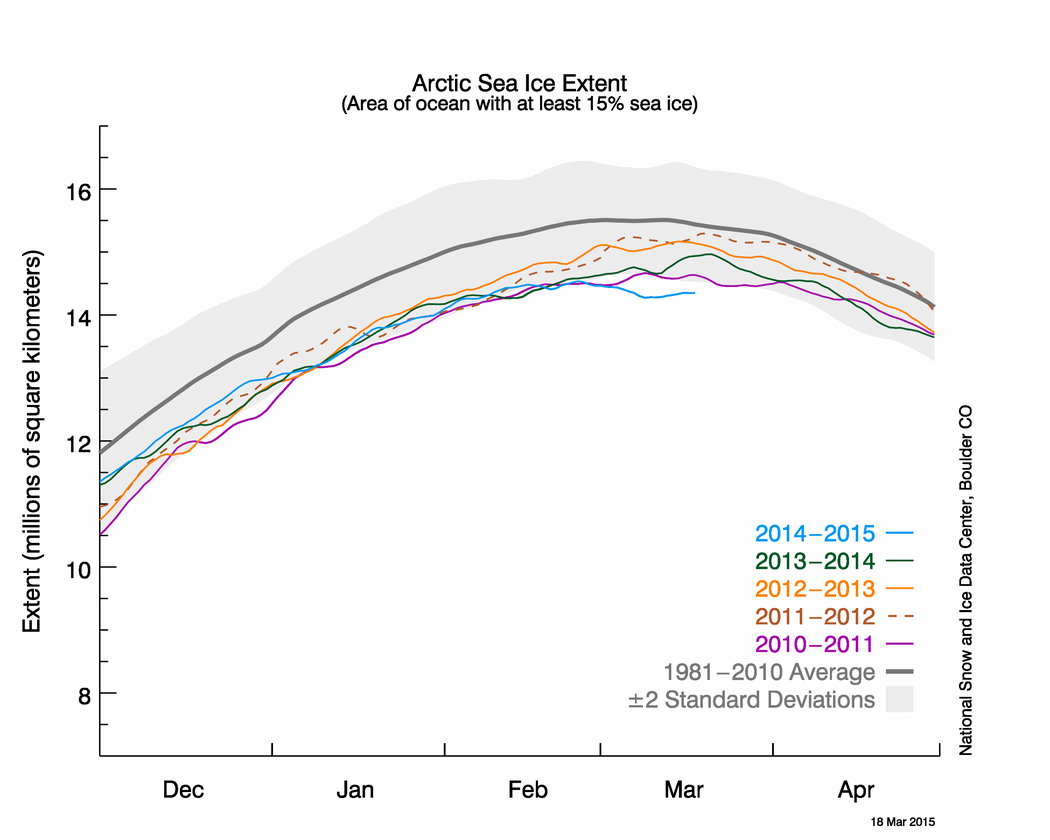
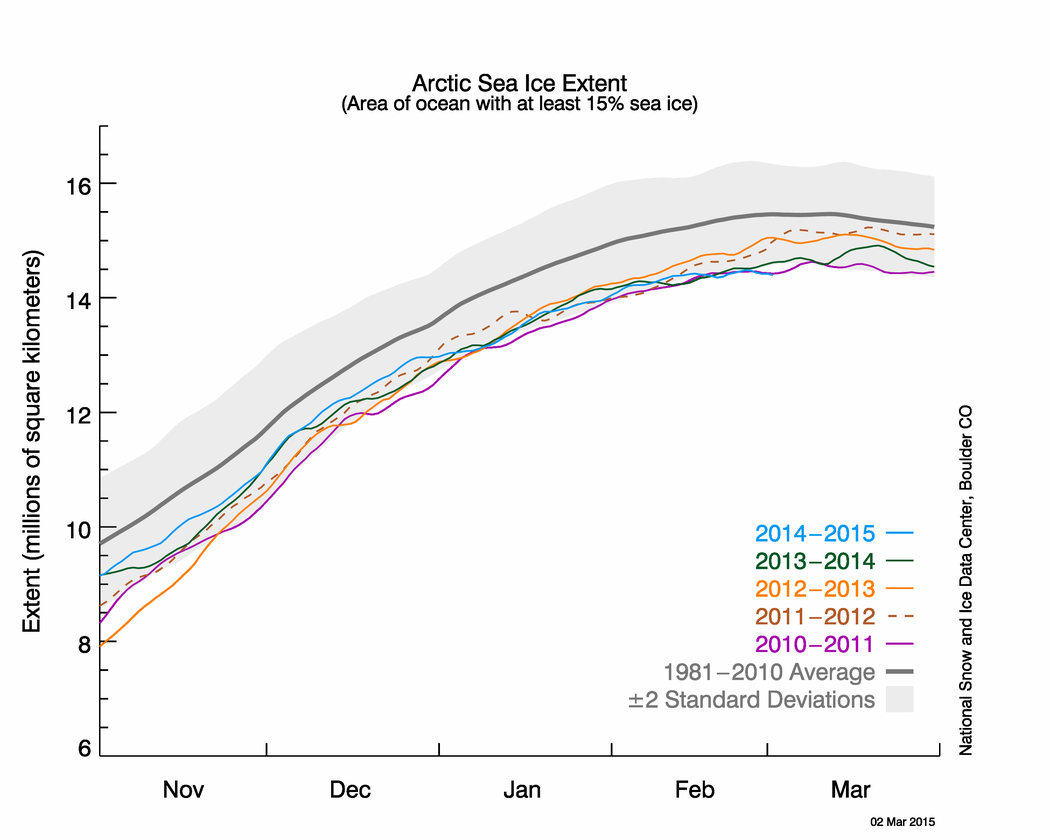
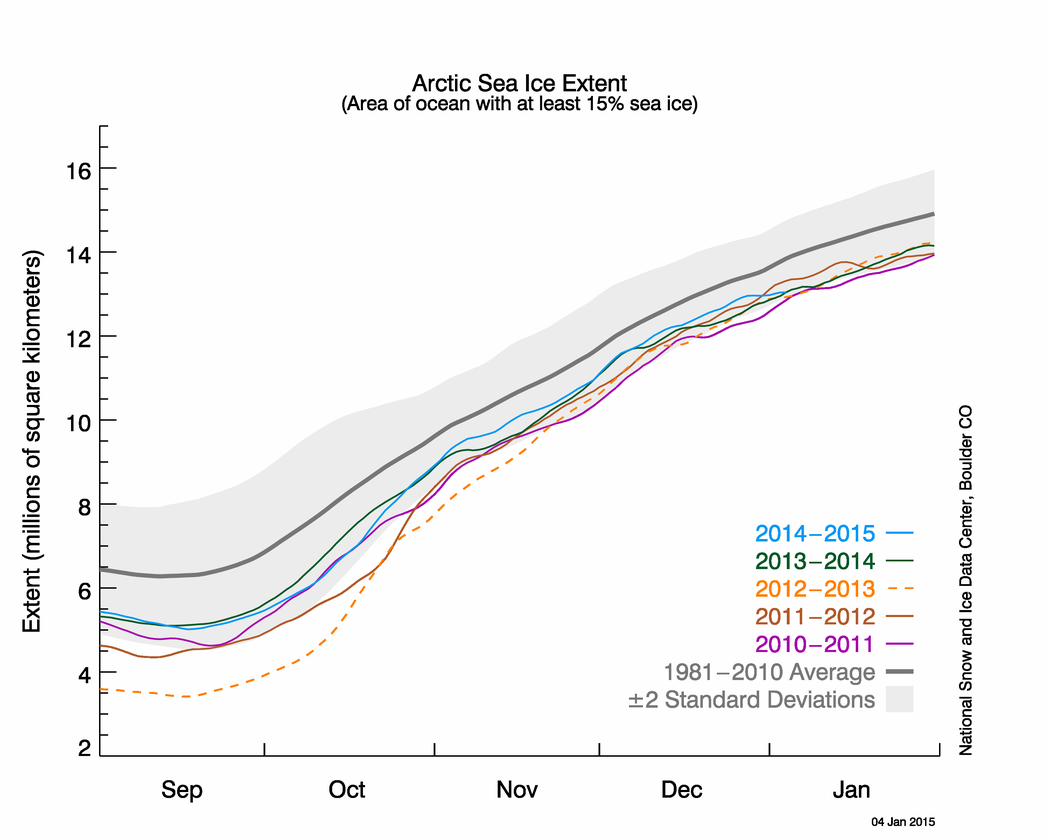
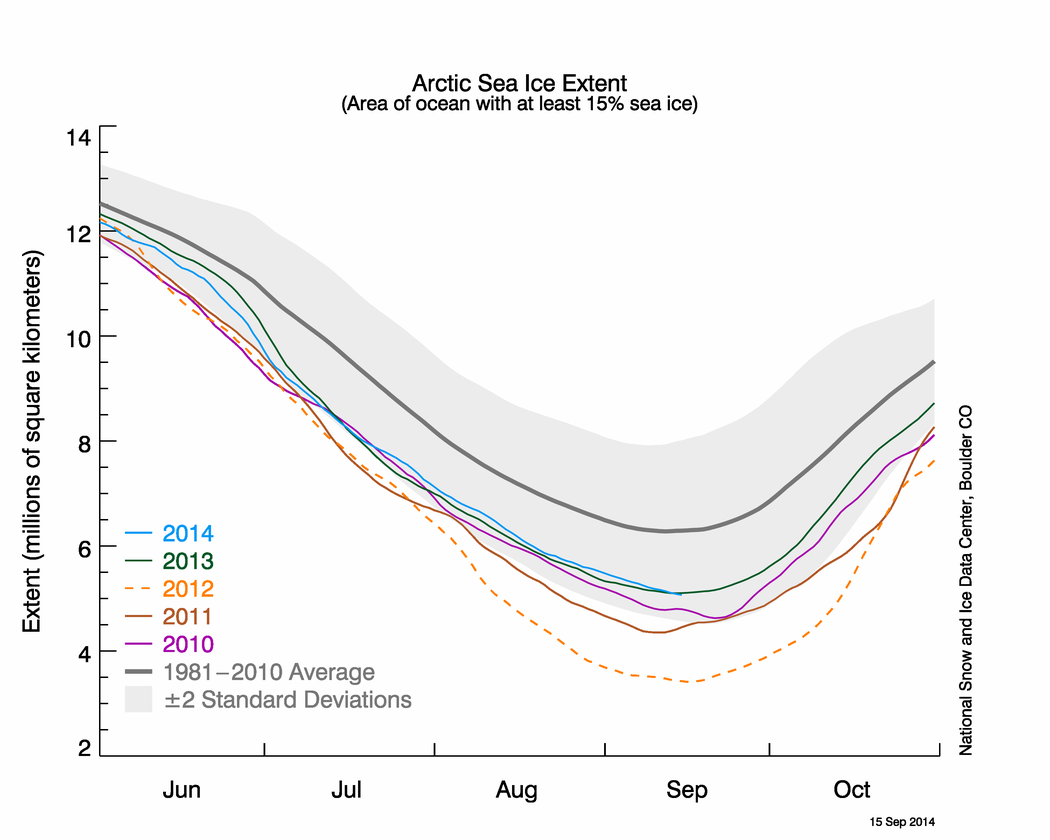
Figure 2. The graph above shows Arctic sea ice extent as of August 16, 2015, along with daily ice extent data for 2014, 2013, 2012, and 2010. 2015 is shown in blue, 2014 in green, 2013 in orange, 2012 in brown, and 2010 in purple. The 1981 to 2010 average is in dark gray. The gray area around the average line shows the two standard deviation range of the data. Sea Ice Index data.
Credit: National Snow and Ice Data Center
High-resolution image
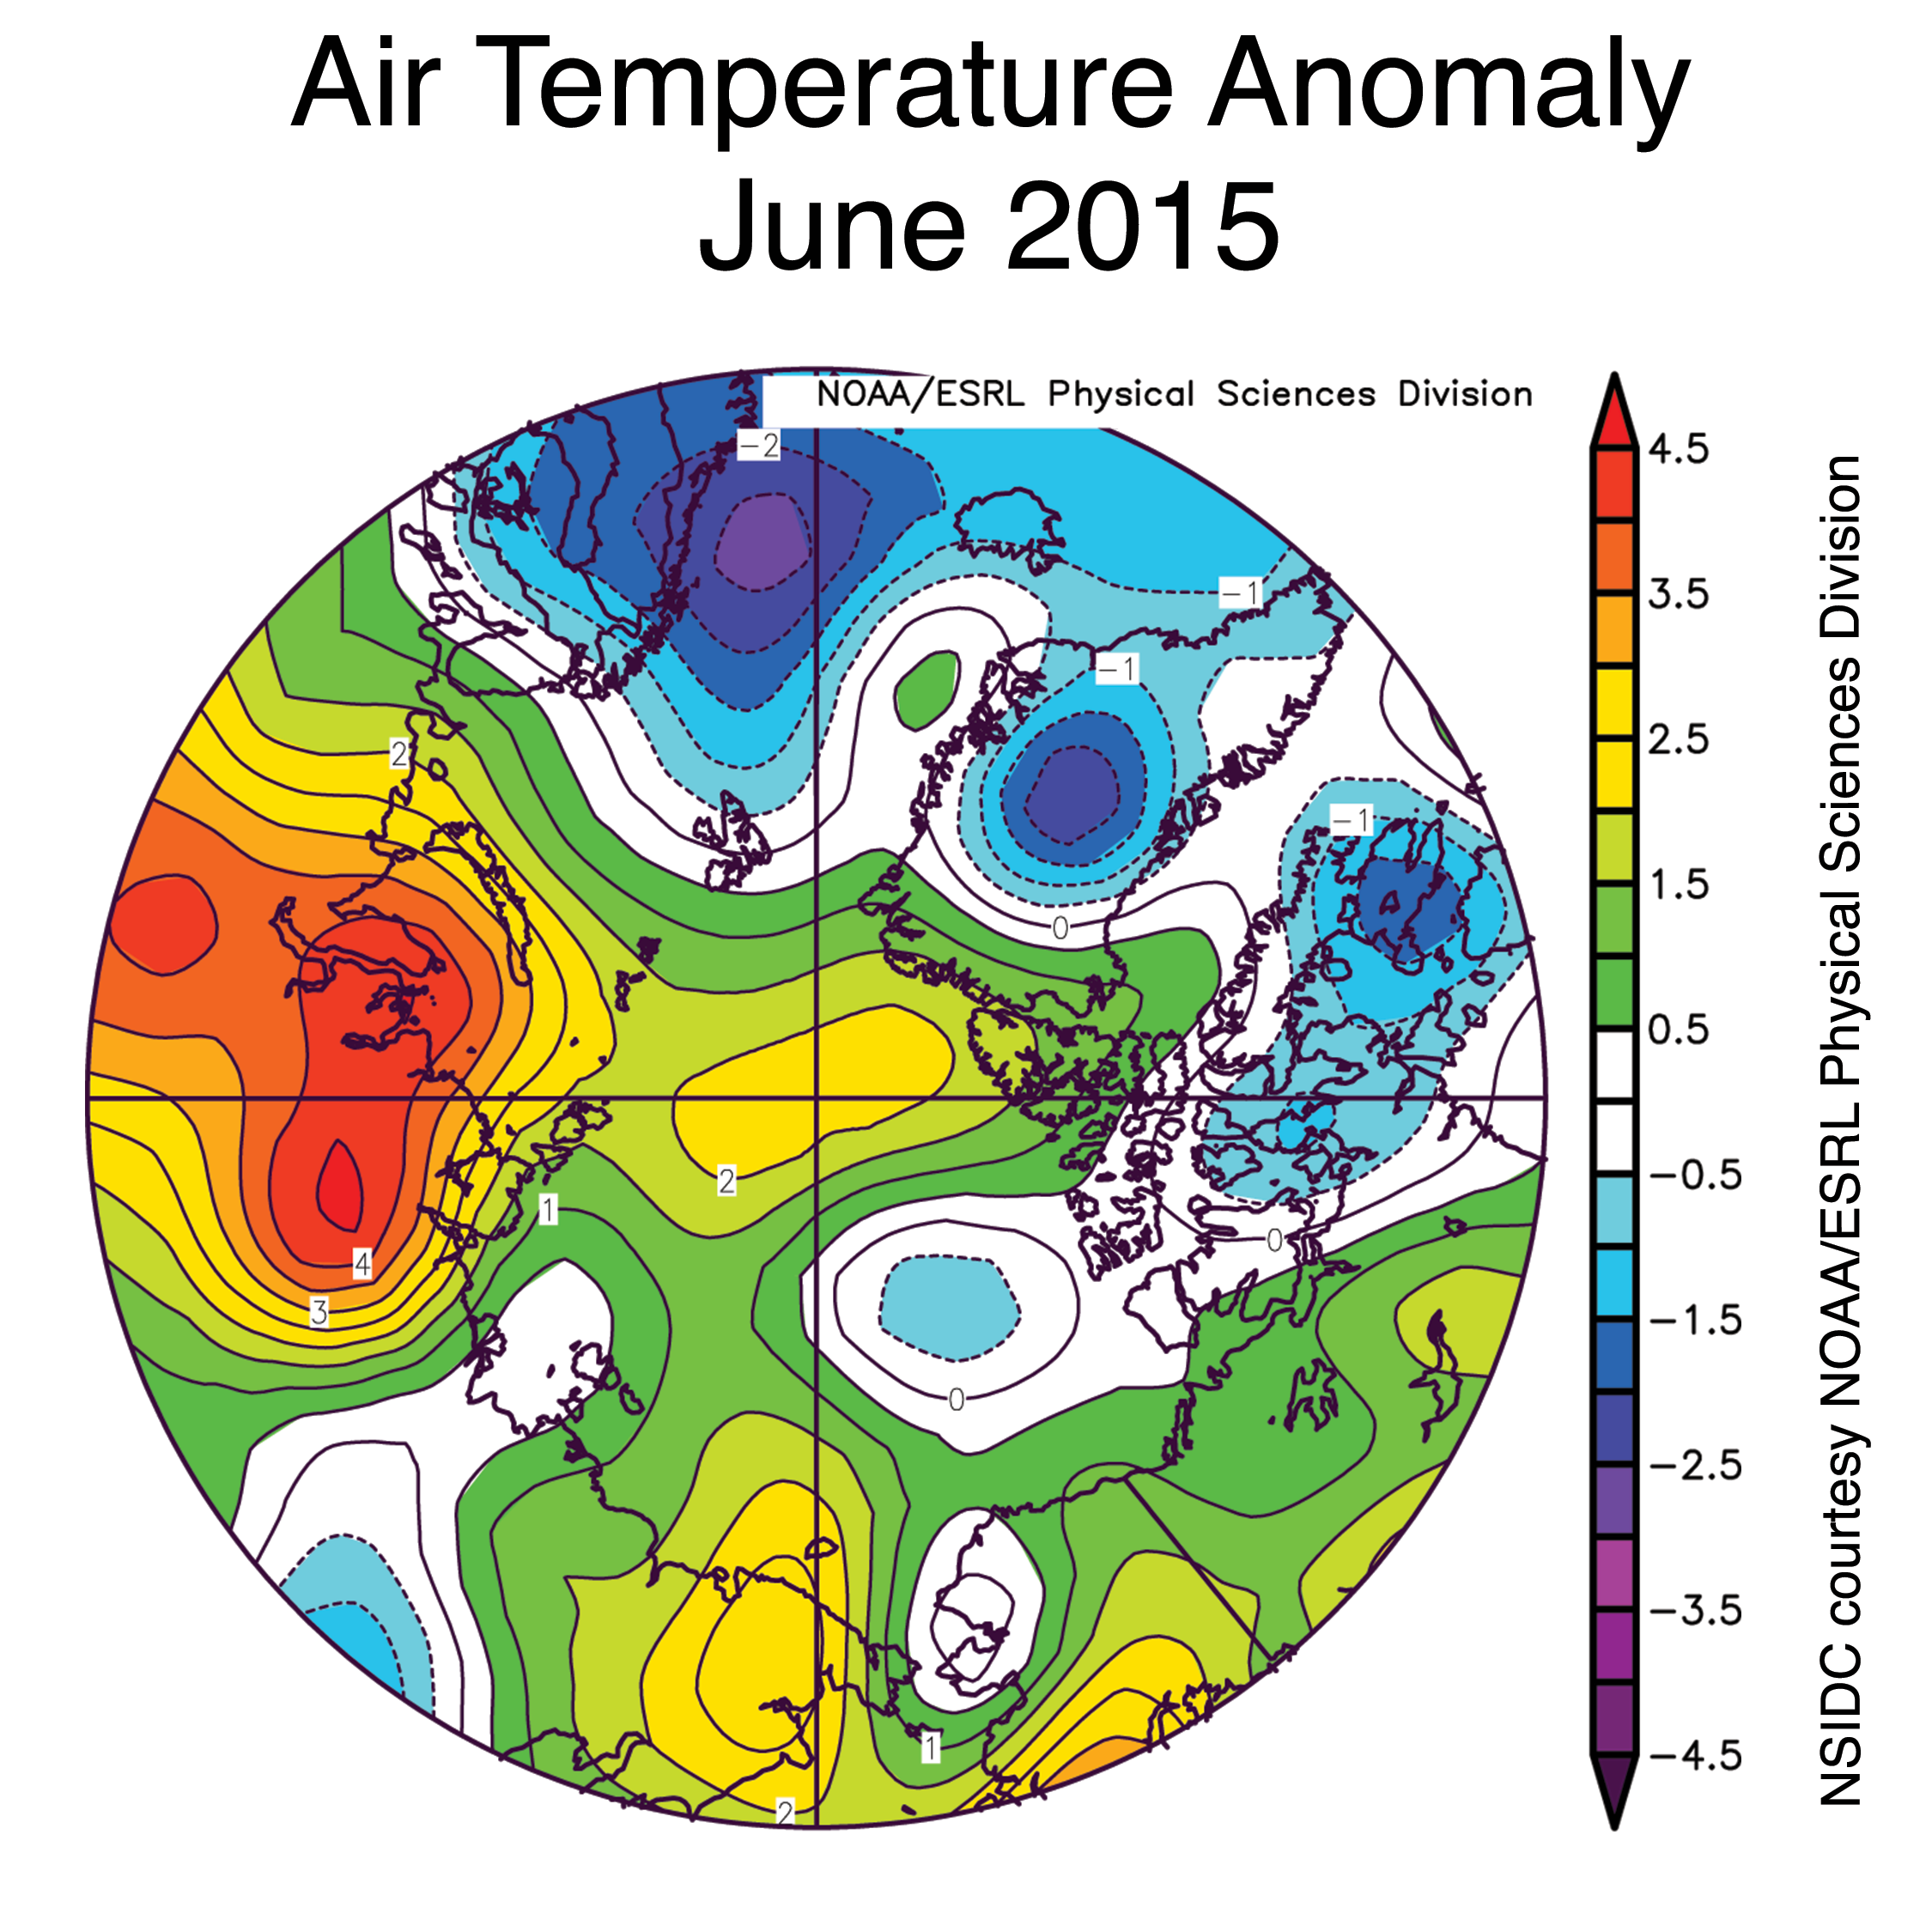
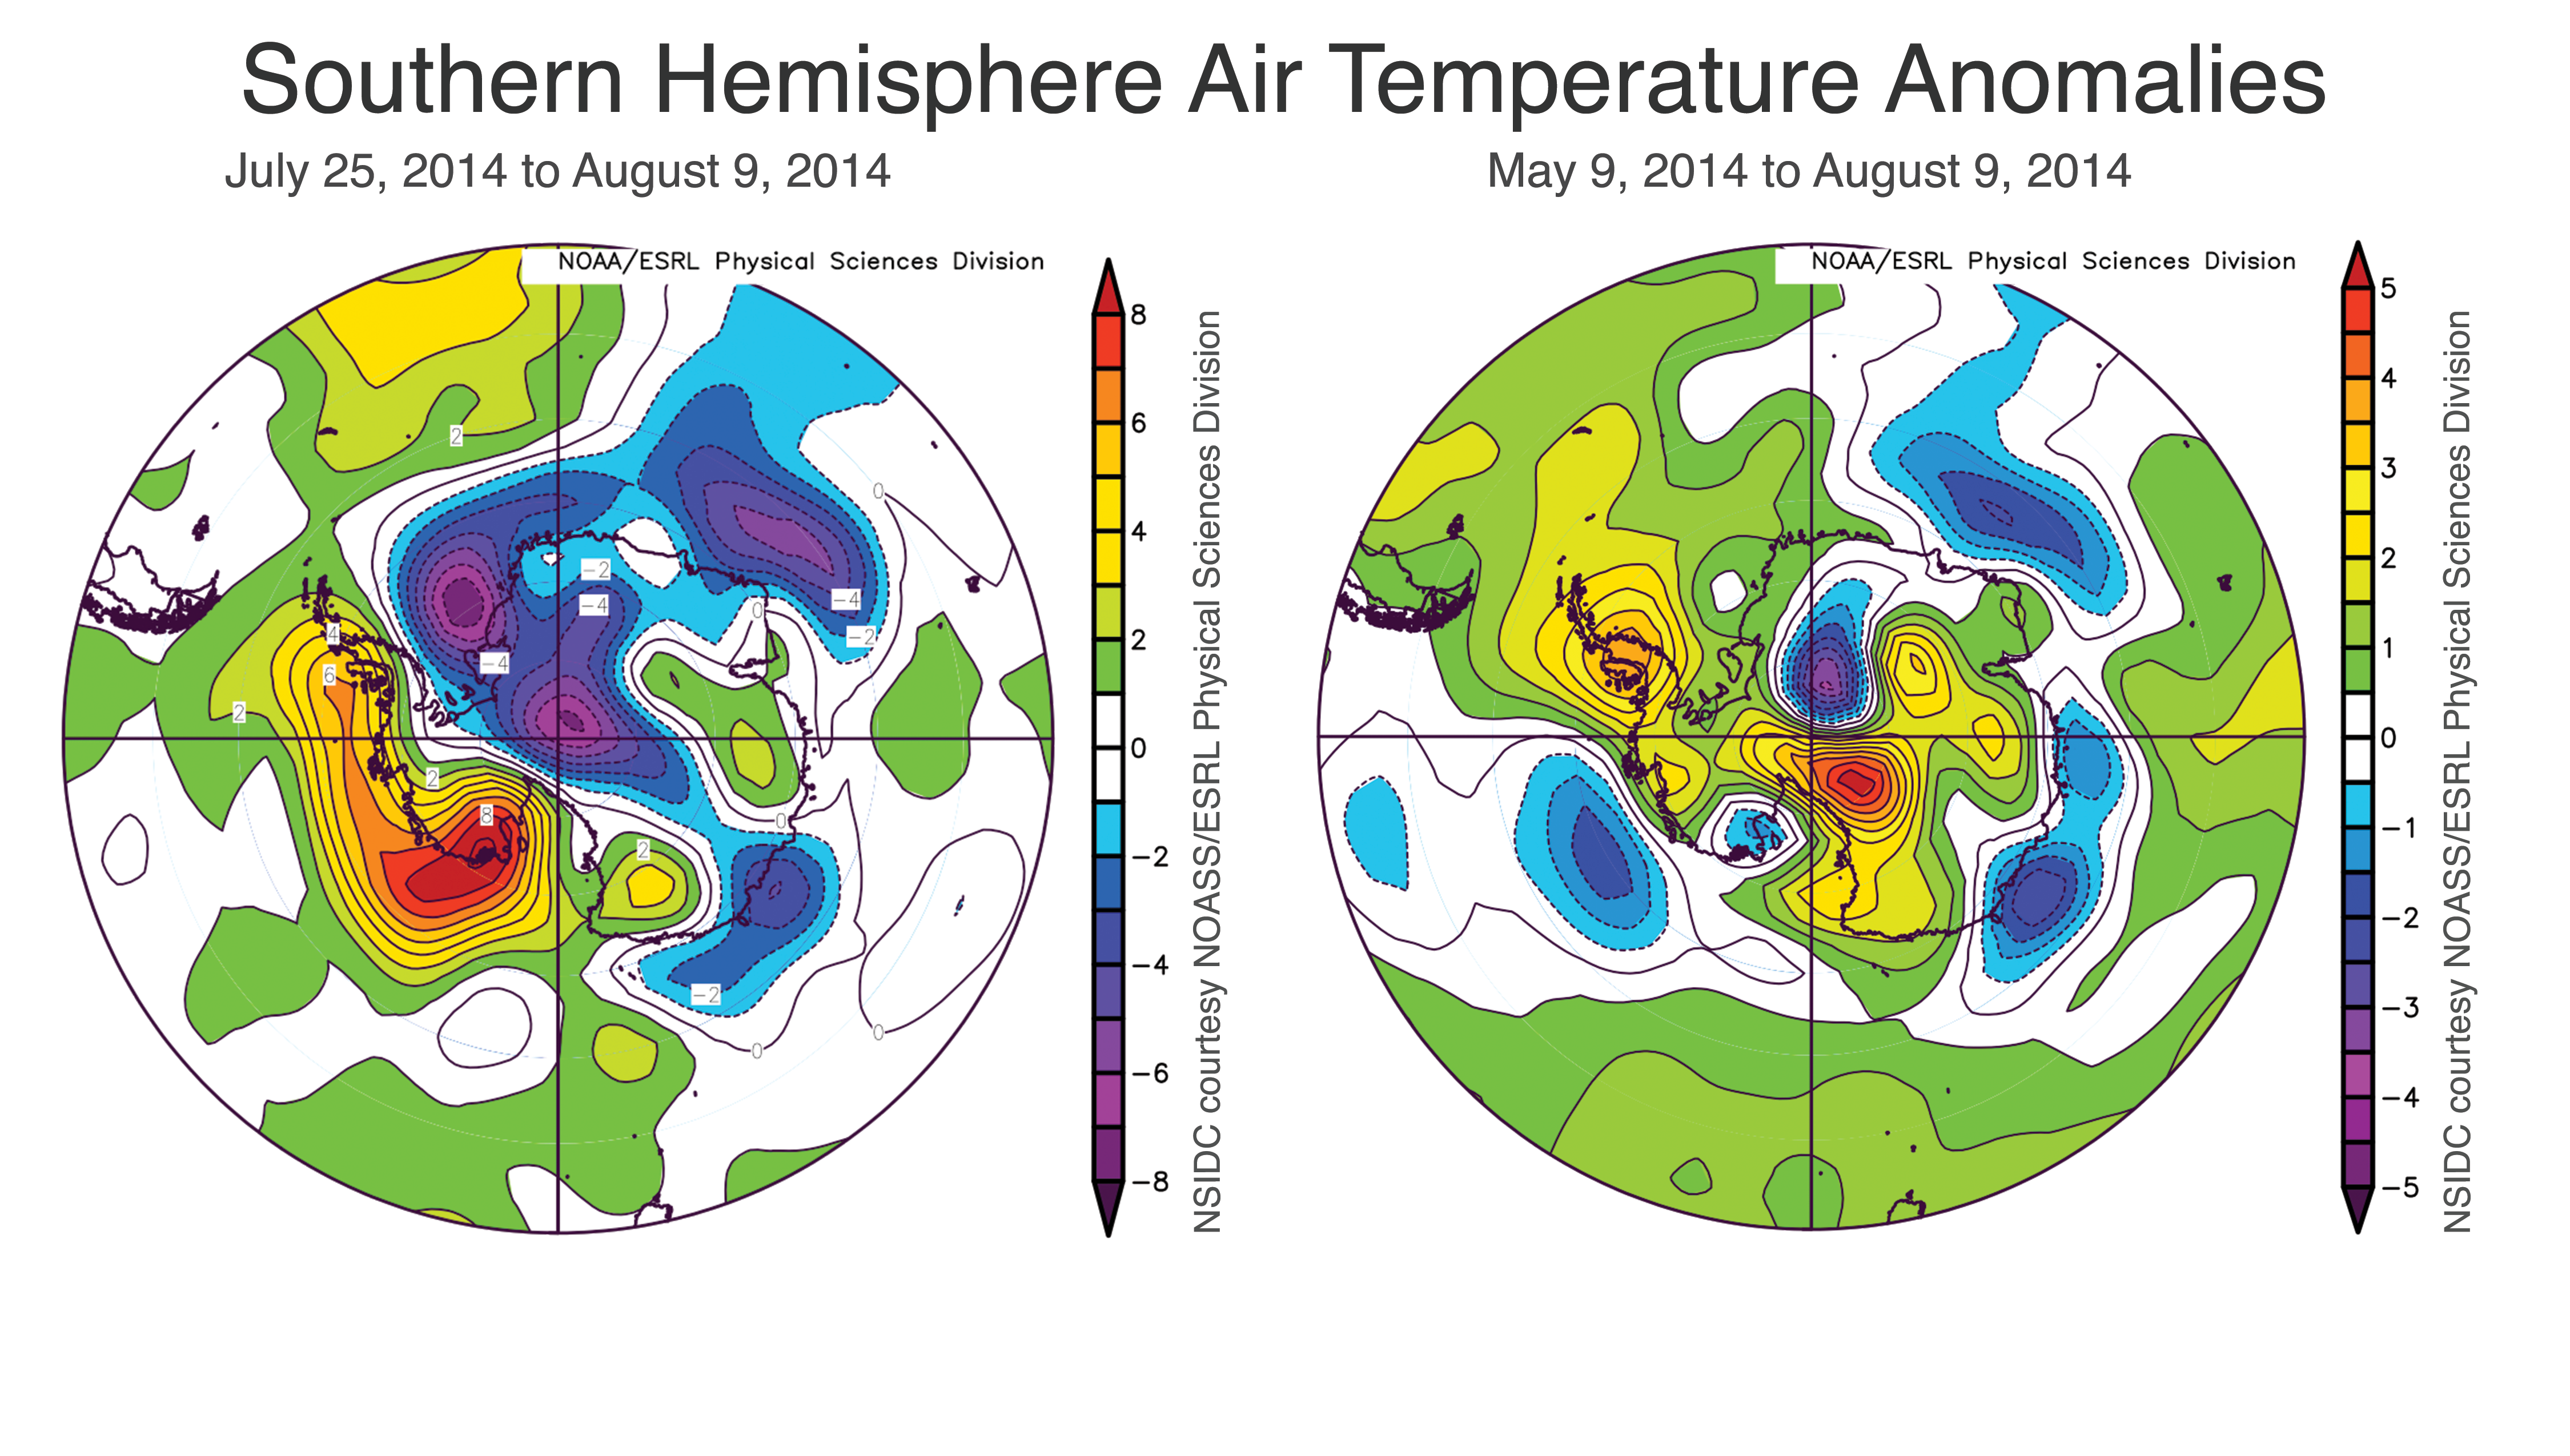
Atmospheric temperatures at the 925 millibar level during the first half of August were above average over the North Pole region and the Barents and Kara seas, but below average in the Laptev, East Siberian, Beaufort and Chukchi seas. This is a notable change from July, when above-average temperatures prevailed over most of the Arctic Ocean, including much of the Beaufort and Chukchi seas. Current conditions are likely due to a shift in atmospheric circulation from the July pattern of high sea level pressure centered roughly over the pole to a pattern of high pressure centered over the Kara and Laptev seas, and low pressure centered over the eastern Beaufort Sea. This low pressure brought colder air from the north into the western Beaufort Sea and the Chukchi Sea, and generally cloudier conditions to the region.
Forecasting the seasonal minimum
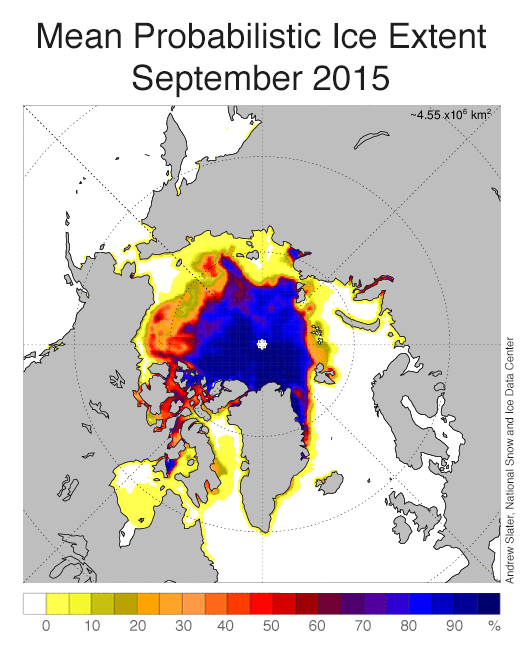
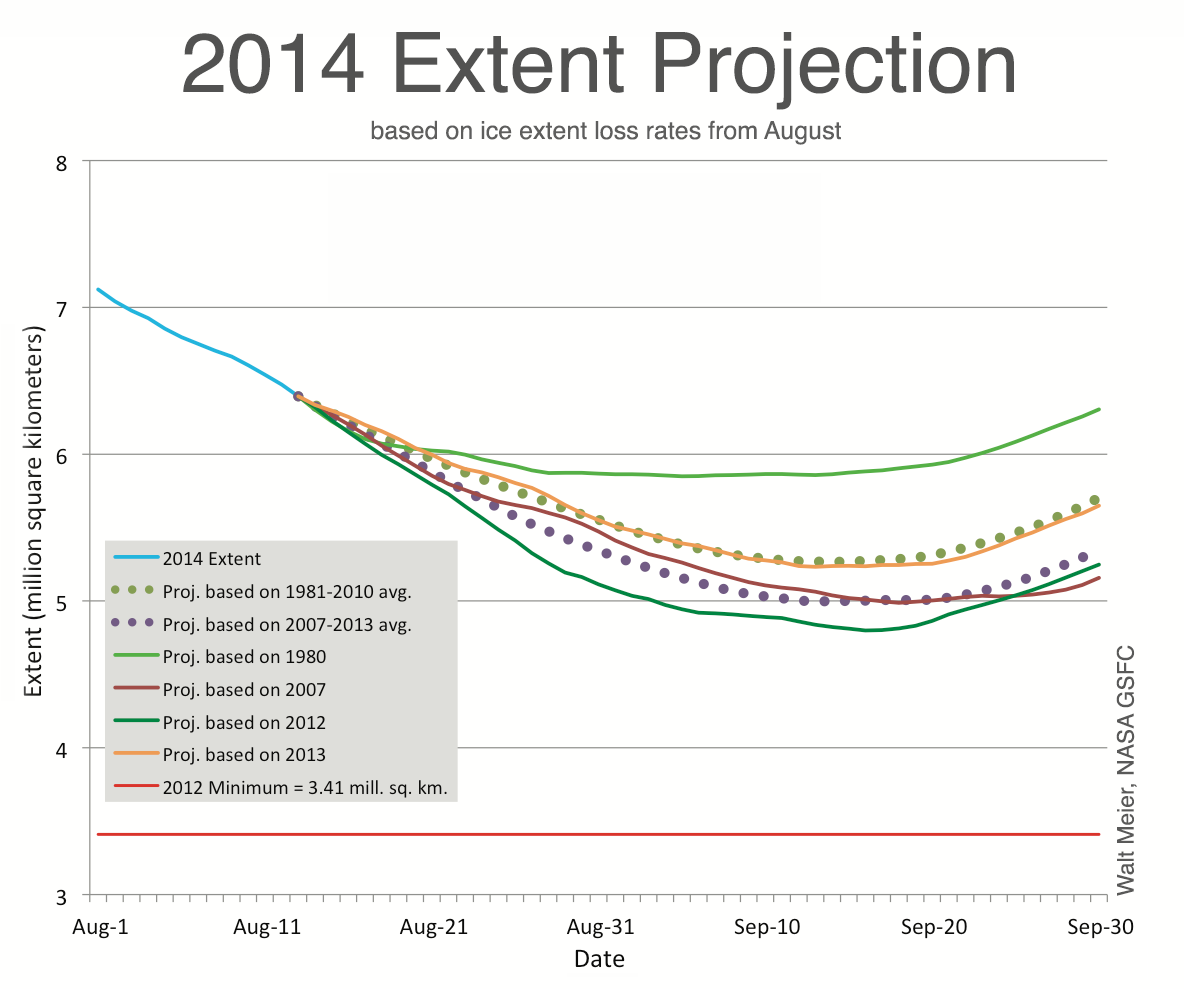
Figure 3. The above graph shows a forecast of mean probabilistic Arctic sea ice extent for September 2015 (issued August 9, 2015). The forecast value, or expected September mean Arctic sea ice extent, is 4.55+/-0.35 million square kilometers.
Credit: Andrew Slater, National Snow and Ice Data Center.
High-resolution image
Several methods have been developed to make predictions of the September minimum in Arctic sea ice extent. NSIDC research scientist Andrew Slater developed a method that uses a statistical approach to calculate the probability of ice being present at each location (i.e., at each grid cell). The method correlates ice concentration at the time the forecast is made (issue date) with concentration at a desired later time (forecast); the difference between those two times or dates is known as the lead-time. While not as sophisticated as approaches using coupled ocean-ice-atmosphere models, this statistical method has the advantage that the forecasts for all points are completely independent in both space and time; that is, the forecast at any given point is not affected by its neighbors, nor its result from the prior day. Forecast skill improves as lead-time decreases.
The model has performed well compared to forecasts submitted to the Sea Ice Outlook prediction network. For example, the years 2005, 2007, and 2012 were correctly predicted as being record breaking (at the time) 50 days in advance. September average extent at 50-days lead time has been predicted to within 100,000 square kilometers (2009, 2010, 2011), but has also been as far off as 600,000 square kilometers (2007, 2008). Forecasting at seasonal time scales is difficult, but the model does have genuine skill in September (using a metric of comparison of the forecast error variance with the historically observed [de-trended] variance as was used in Schröder et al, [2014]) at lead times as long as ninety days.
A passage to India by way of Russia
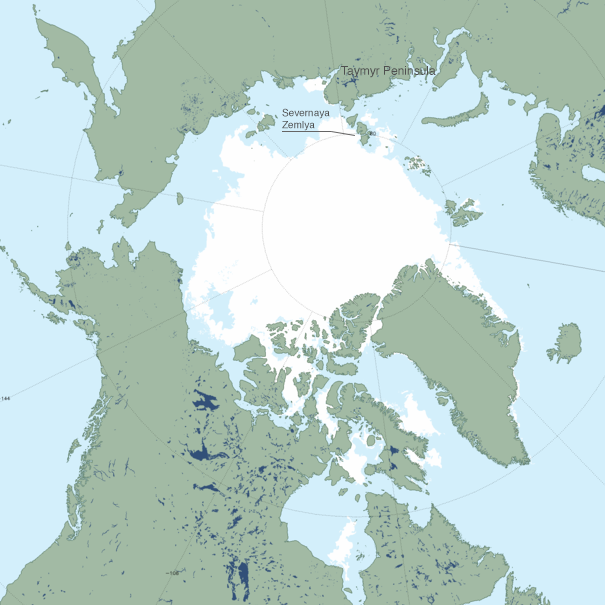
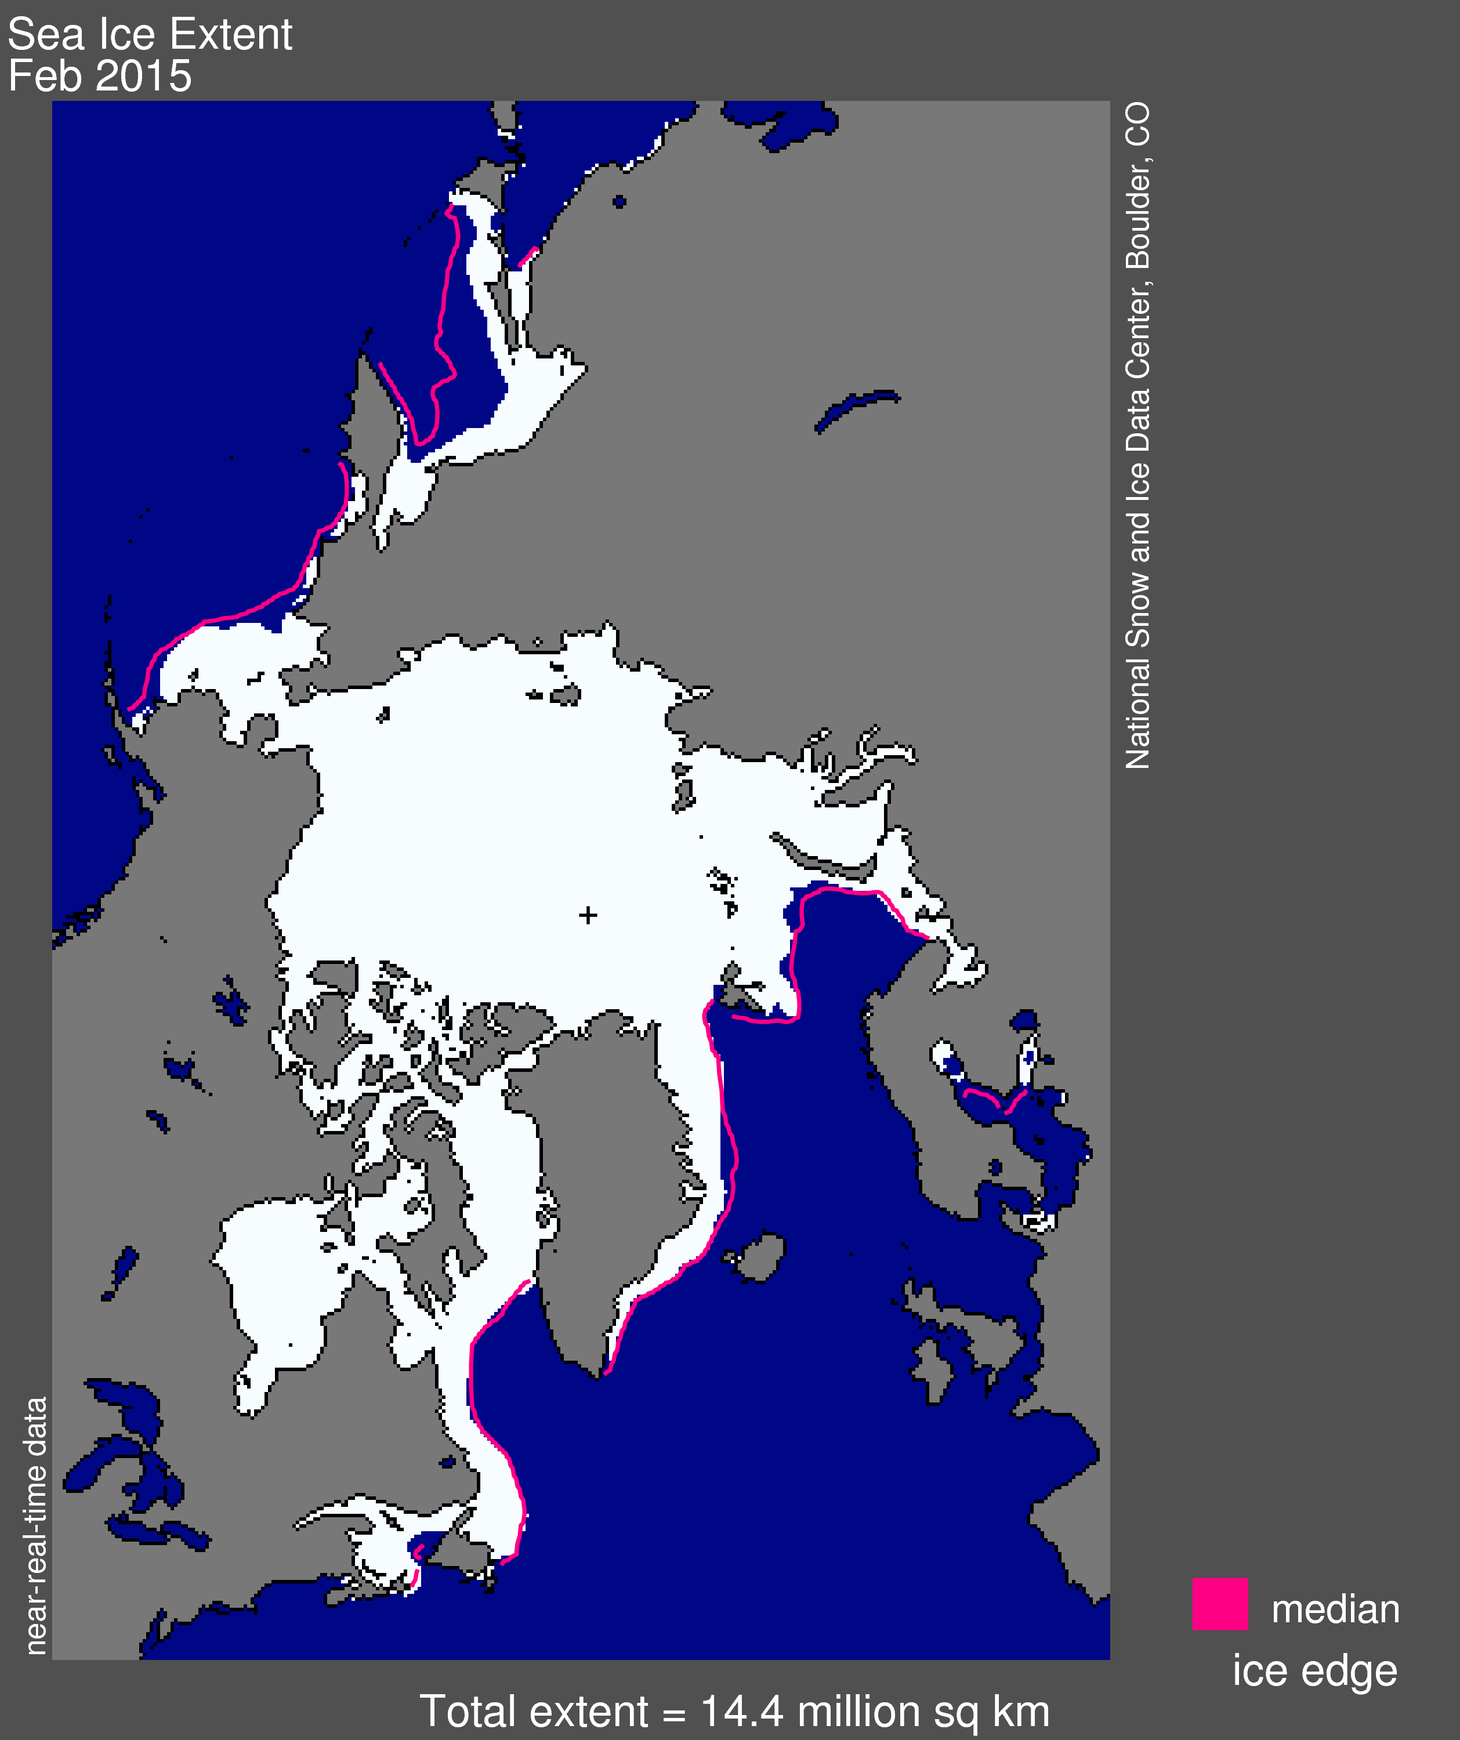
Figure 4. The image above shows Arctic sea ice extent on August 16, 2015 from the Multisensor Analyzed Sea Ice Extent (MASIE) data product.
Credit: National Snow and Ice Data Center
High-resolution image
The Northern Sea Route along the Russian coast appears to be open, both in the passive microwave imagery and in the Multisensor Analyzed Sea Ice Extent (MASIE) product that is more adept at detecting thin and deteriorating ice. MASIE still shows considerable ice north of the Taymyr Peninsula and the Severnaya Zemlya islands, but there is a narrow open water passage through the ice. On the other side of the Arctic, the Northwest Passage still contains a considerable amount of ice. According to MASIE, there is as yet no completely open route. Some passive microwave products, such as from the University of Bremen’s Advanced Microwave Scanning Radiometer 2 (AMSR2), indicate an open water route along Norwegian explorer Roald Amundsen’s historical route through the southern part of the Archipelago. The apparent discrepancy between MASIE and the Bremen product is likely due to thin, heavily melting ice not detected by passive microwave imagery.
A change in Antarctic sea ice
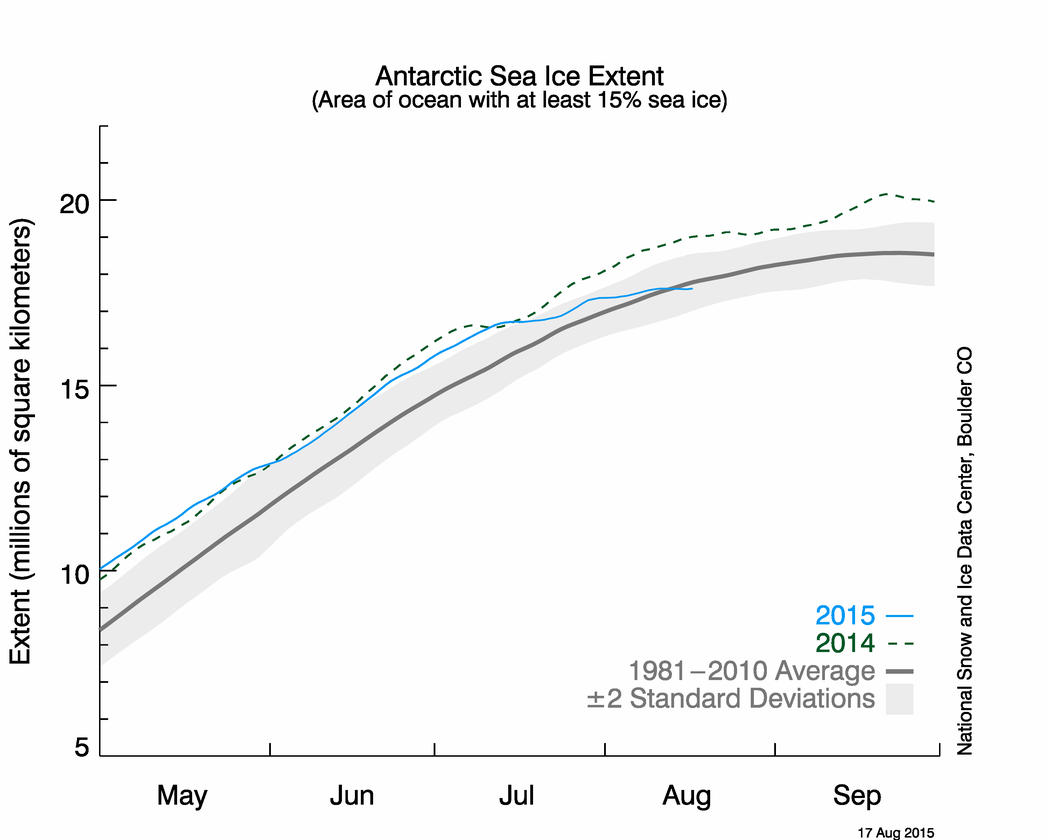
Figure 5a. The graph above shows Antarctic sea ice extent as of August 17, 2015, along with daily ice extent data for the record low year. 2015 is shown in blue and 2012 in green. The 1981 to 2010 average is in dark gray. The gray area around the average line shows the two standard deviation range of the data. Sea Ice Index data.
Credit: National Snow and Ice Data Center
High-resolution image

Figure 5b. The above images compare Antarctic sea ice concentration for August 1, 2015 and August 16, 2015. Data are from the Advanced Microwave Scanning Radiometer 2 (AMSR2) sensor on the Global Change Observation Mission 1st – Water (GCOM-W1) satellite.
Credit: Institute of Environmental Physics, University of Bremen
High-resolution image
Growth in Antarctic sea ice extent has leveled off, increasing by just 250,000 square kilometers (96,500 square miles) between August 1 and August 17. This slow rate of growth has brought this year’s sea ice extent to below the 1981 to 2010 average for the first time in nearly four years. Figure 5b shows ice retreat around the Antarctic Peninsula, in the Ross Sea, and around the coast of Wilkes Land. These areas of retreat are offset by some ice growth in the northern Amundsen Sea and off the coast of Enderby Land.


