Antarctic sets a record low maximum by wide margin

On September 10, Antarctic sea ice likely reached its annual maximum extent of 16.96 million square kilometers (6.55 million square miles). This is the lowest sea ice maximum in the 1979 to 2023 sea ice record by a wide margin.

Please note that this is a preliminary announcement. Changing winds or late-season growth could still increase the Antarctic ice extent. NSIDC scientists will release a full analysis of the Antarctic and Arctic September conditions in early October.

Overview of conditions

Antarctic sea ice extent on September 10, 2023

Figure 1. Antarctic sea ice extent for September 10 2023, was 16.96 million square kilometers (6.55 million square miles). The orange line shows the 1981 to 2010 average extent for that day. Sea Ice Index data. About the data

Credit: National Snow and Ice Data Center
High-resolution image

On September 10, 2023, sea ice in the Antarctic reached an annual maximum extent of 16.96 million square kilometers (6.55 million square miles), setting a record low maximum in the satellite record that began in 1979 (Figure 1). This year’s maximum is 1.03 million square kilometers (398,000 square miles) below the previous record low set in 1986. It is also 1.75 million square kilometers below (676,000 square miles) below the 1981 to 2010 average Antarctic maximum extent. Sea ice extent is markedly below average north of Queen Maud Land and west of the Antarctic Peninsula. Other low areas include the Indian Ocean and Ross Sea. Extent is above average stretching out of the Amundsen Sea.

The Antarctic maximum extent is one of the earliest on record, having reached it 13 days earlier than the 1981 to 2010 median date of September 23. The interquartile range for the date of the Antarctic maximum is September 18 to September 30.

Conditions in context

Antarctic sea ice extent compared to other years

Figure 2. The graph above shows Antarctic sea ice extent as of September 10, 2023, along with daily ice extent data for four previous years and the record maximum year. 2023 is shown in blue, 2022 in green, 2021 in orange, 2020 in brown, 2019 in magenta, and 2014 in dashed brown. The 1981 to 2010 median is in dark gray. The gray areas around the median line show the interquartile and interdecile ranges of the data. Sea Ice Index data.

Credit: National Snow and Ice Data Center
High-resolution image

This year marks a significant record low maximum in Antarctic sea ice extent (Figure 2). Since early April 2023, sea ice maintained record low ice growth. From early to mid-August, growth slowed considerably, maintaining a difference of nearly 1.5 million square kilometers (579,000 square miles) between 2023 and 1986, the second lowest year on satellite record. After that period, ice growth quickened and narrowed the gap to about 1 million square kilometers (386,000 square miles). This is the first time that sea ice extent has not surpassed 17 million square kilometers (6.56 million square miles), falling more than one million square kilometers below the previous record low maximum extent set in 1986. 

While weather conditions like winds and temperature control much of the day-to-day variations in ice extent, the long-term downward trend is a topic of much debate. The overall, trend in the maximum extent from 1979 to 2023 is 0.1 percent per decade relative to the 1981 to 2010 average, which is not a significant trend.
However, since August 2016, the Antarctic sea ice extent trend took a sharp downturn across nearly all months (Figure 4c in previous post). Most research has suggested that changes in the near-surface ocean heat content is responsible for the sluggish growth in the past several months. A downturn in 2016 was attributed to a series of storms in the Weddell and Ross Sea regions that pushed the ice edge southward (Turner et al., 2017). Similar extremes in long-lived weather patterns like the record Amundsen Sea Low strength are implicated in the generally low ice extents of 2022 (Turner et al., 2022). However, this more recent excursion, beginning in May of 2023, and the general persistence of low sea ice extent near Antarctica since 2016, is now thought to be linked to warming in the uppermost ocean layer caused by lateral and upward mixing of warmer water (Zhang et al., 2022; Haumann et al., in press)
 
There is some concern that this may be the beginning of a long-term trend of decline for Antarctic sea ice, since oceans are warming globally, and warm water mixing in the Southern Ocean polar layer could continue. The Southern Ocean and its sea ice is an important component of Earth’s energy balance, reflecting sunlight back into space, and supporting a rich ice-edge ecosystem. Moreover, if dramatically lower sea ice extent continues to the 2024 summer minimum and beyond, much more of the Antarctic coastline will be exposed to ocean waves and marine climate. This may lead to two opposing impacts: erosion of more perennial coastal ice and ice shelves, destabilizing the ice sheet; or increased accumulation near the coast, offsetting in part the threat of rising sea level.

Ten lowest maximum Antarctic sea ice extents (satellite record, 1979 to present)

Table 1. Ten lowest maximum Antarctic sea ice extents (satellite record, 1979 to present)
RANK YEAR Maximum ICE EXTENT DATE
IN MILLIONS OF SQUARE KILOMETERS IN MILLIONS OF SQUARE MILES
1 2023 16.96 6.55 Sept. 10
2 1986 17.99 6.95 Oct. 10
3 2002 18.05 6.97 Oct. 12
4 2017 18.10 6.99 Oct. 10
7 1989
2022
2018
2008
18.22
18.25
18.25
18.26
7.03
7.05
7.05
7.05
Sept. 25
Sept. 16
Oct. 03
Sept. 06

Values within 40,000 square kilometers (15,000 square miles) are considered tied.

References

Purich, A. and E. W. Doddridge. 2023. Record low Antarctic sea ice coverage indicates a new sea ice state. Communications Earth and Environment 4, 314, doi:10.1038/s43247-023-00961-9.

Turner, J., T. Phillips, G. J. Marshall, J. S. Hosking, J. O. Pope, T. J. Bracegirdle, and P. Deb. 2017. Unprecedented springtime retreat of Antarctic sea ice in 2016Geophysical Research Letters, 44(13), 6868-6875, doi:10.1002/2017GL073656.

Turner, J., C. Holmes, T. Caton Harrison, T. Phillips, B. Jena, T. Reeves‐Francois, R. Fogt, E. R. Thomas, C. C. and Bajish. 2022. Record low Antarctic sea ice cover in February 2022. Geophysical Research Letters, 49(12), e2022GL098904, doi:10.1029/2022GL098904.

Zhang, L., T. L. Delworth, X. Yang, F. Zeng, F. Lu, Y. Morioka, and M. Bushuk. 2022. The relative role of the subsurface Southern Ocean in driving negative Antarctic Sea ice extent anomalies in 2016–2021, 3, 302, Communications Earth and Environment doi:10.1038/s43247-022-00624-1.

For more information

NASA visualization of 2023 Arctic sea ice minimum extent

Arctic sea ice minimum at sixth lowest extent on record

On September 19, Arctic sea ice likely reached its annual minimum extent of 4.23 million square kilometers (1.63 million square miles). The 2023 minimum is sixth lowest in the nearly 45-year satellite record. The last 17 years, from 2007 to 2023, are the lowest 17 sea ice extents in the satellite record.

In the Antarctic, sea ice extent set unprecedented record lows through most of the growth season. Highly variable conditions are typical of Antarctic sea ice extent near the seasonal maximum, and ice may still continue to grow but will unlikely avoid setting a record low. The previous five lowest maximums on record include 1986, 2002, 2017, 1989, and 2022. The maximum for Antarctic sea ice typically occurs in late September or early October, but has been as early as August 30.

Please note that this is a preliminary announcement. Changing winds or late-season melt could still reduce the Arctic ice extent, as happened in 2005 and 2010. NSIDC scientists will release a full analysis of the Arctic melt season, and discuss the Antarctic winter sea ice growth, in early October.

Overview of conditions

Figure 1. Arctic sea ice extent for XXXX XX, 20XX, was X.XX million square kilometers (X.XX million square miles). The orange line shows the 1981 to 2010 average extent for that day. Sea Ice Index data. About the data||Credit: National Snow and Ice Data Center|High-resolution image

Figure 1. Arctic sea ice extent for September 19 2023, was 4.23 million square kilometers (1.63 million square miles). The orange line shows the 1981 to 2010 average extent for that day. Sea Ice Index data. About the data

Credit: National Snow and Ice Data Center
High-resolution image

On September 19, sea ice reached its annual minimum extent of 4.23 million square kilometers (1.63 million square miles) (Figure 1). As the sun continues to lower on the horizon, air temperatures will drop further, expanding ice extent through autumn and winter. However, with significant patches of low ice concentration a late season storm may compress the sea ice and push the ice extent lower.

The minimum extent was reached five days later than the 1981 to 2010 median minimum date of September 14. The interquartile range of minimum dates is September 11 to September 19.

Conditions in context

Figure 2. The graph above shows Arctic sea ice extent as of XXXXX XX, 20XX, along with daily ice extent data for four previous years and the record low year. 2023 is shown in blue, 2022 in green, 2021 in orange, 2020 in brown, 2019 in magenta, and 2012 in dashed brown. The 1981 to 2010 median is in dark gray. The gray areas around the median line show the interquartile and interdecile ranges of the data. Sea Ice Index data.||Credit: National Snow and Ice Data Center|High-resolution image

Figure 2. The graph above shows Arctic sea ice extent as of September 19, 2023, along with daily ice extent data for four previous years and the record low year. 2023 is shown in blue, 2022 in green, 2021 in orange, 2020 in brown, 2019 in magenta, and 2012 in dashed brown. The 1981 to 2010 median is in dark gray. The gray areas around the median line show the interquartile and interdecile ranges of the data. Sea Ice Index data.

Credit: National Snow and Ice Data Center
High-resolution image

This year’s minimum set on September 19 was 840,000 square kilometers (324,000 square miles) above the satellite-era record minimum extent of 3.39 million square kilometers (1.31 million square miles), which occurred on September 17, 2012 (Figure 2). It is also 1.99 million square kilometers (770,000 square miles) below the 1981 to 2010 average minimum extent, which is equivalent to nearly three times the size of Texas.

In the 45-year-satellite record, 17 of the lowest minimums have all occurred in the last 17 years.

The overall, downward trend in the minimum extent from 1979 to 2023 is 12.5 percent per decade relative to the 1981 to 2010 average. The loss of sea ice is about 77,800 square kilometers (30,000 square miles) per year, equivalent to losing the state of Nebraska or the Czech Republic annually.

Seventeen lowest minimum Arctic sea ice extents (satellite record, 1979 to present)

Table 1. Seventeen lowest minimum Arctic sea ice extents (satellite record, 1979 to present)
RANK YEAR MINIMUM ICE EXTENT DATE
IN MILLIONS OF SQUARE KILOMETERS IN MILLIONS OF SQUARE MILES
1 2012 3.39 1.31 Sept. 17
2 2020 3.82 1.47 Sept. 16
3 2007
2016
2019
4.16
4.17
4.19
1.61
1.61
1.62
Sept. 18
Sept. 10
Sept. 18
6 2023 4.23 1.63 Sept. 19
7 2011 4.34 1.68 Sept. 11
8 2015 4.43 1.71 Sept. 9
9 2008
2010
4.59
4.62
1.77
1.78
Sept. 19
Sept. 21
11 2018
2017
2022
4.66
4.67
4.70
1.80
1.80
1.81
Sept. 23
Sept. 13
Sept. 19
14 2021 4.77 1.84 Sept. 16
15 2014
2013
5.03
5.05
1.94
1.95
Sept. 17
Sept. 13
17 2009 5.12 1.98 Sept. 13

Values within 40,000 square kilometers (15,000 square miles) are considered tied. The 2022 value has changed from 4.67 to 4.70 million square kilometers (1.81 million square miles) and the date of the minimum moved from September 18 to September 19 when final analysis data updated near-real-time data. 

For more information

NASA visualization of 2023 Arctic sea ice minimum extent

Rounding the curve

Both Arctic and Antarctic sea ice appear to be heading toward their respective seasonal limits, reaching the lowest extent at the end of summer in the north, and the highest extent as winter ends in the south. In the Antarctic, high variability typically characterizes the period around the maximum, but at present the sea ice extent is more than 1 million square kilometers (386,000 square miles) below the previous record low maximum set in 1986.

Overview of conditions

Figure 1a. This figure shows Arctic sea ice concentration for September 13. The orange line shows the 1981 to 2010 average extent for that day. Sea Ice Index data. About the data||Credit: National Snow and Ice Data Center|High-resolution image

Figure 1a. This figure shows Arctic sea ice concentration for September 13. The orange line shows the 1981 to 2010 average extent for that day. Sea Ice Index data. About the data

Credit: National Snow and Ice Data Center
High-resolution image

Figure 1b. The graph above shows Arctic sea ice extent as of September 13, 2023, along with daily ice extent data for four previous years and the record low year. 2023 is shown in blue, 2022 in green, 2021 in orange, 2020 in brown, 2019 in magenta, and 2012 in dashed brown. The 1981 to 2010 median is in dark gray. The gray areas around the median line show the interquartile and interdecile ranges of the data. Sea Ice Index data.||Credit: National Snow and Ice Data Center|High-resolution image

Figure 1b. The graph above shows Arctic sea ice extent as of September 13, 2023, along with daily ice extent data for four previous years and the record low year. 2023 is shown in blue, 2022 in green, 2021 in orange, 2020 in brown, 2019 in magenta, and 2012 in dashed brown. The 1981 to 2010 median is in dark gray. The gray areas around the median line show the interquartile and interdecile ranges of the data. Sea Ice Index data.

Credit: National Snow and Ice Data Center
High-resolution image

Figure 1c. The graph above shows Antarctic sea ice extent as of September 13, 2023, along with daily ice extent data for four previous years and the record high year. 2023 is shown in blue, 2022 in green, 2021 in orange, 2020 in brown, 2019 in magenta, and 2014 in dashed brown. The 1981 to 2010 median is in dark gray. The gray areas around the median line show the interquartile and interdecile ranges of the data. Sea Ice Index data.||Credit: National Snow and Ice Data Center|High-resolution image

Figure 1c. The graph above shows Antarctic sea ice extent as of September 13, 2023, along with daily ice extent data for four previous years and the record high year. 2023 is shown in blue, 2022 in green, 2021 in orange, 2020 in brown, 2019 in magenta, and 2014 in dashed brown. The 1981 to 2010 median is in dark gray. The gray areas around the median line show the interquartile and interdecile ranges of the data. Sea Ice Index data.

Credit: National Snow and Ice Data Center
High-resolution image

Figure 1d. Antarctic sea ice extent for September 13, 2023 was 16.94 million square kilometers (6.54 million square miles). The orange line shows the 1981 to 2010 average extent for that day. Sea Ice Index data. About the data||Credit: National Snow and Ice Data Center|High-resolution image

Figure 1d. Antarctic sea ice extent for September 13, 2023 was 16.94 million square kilometers (6.54 million square miles). The orange line shows the 1981 to 2010 average extent for that day. Sea Ice Index data. About the data

Credit: National Snow and Ice Data Center
High-resolution image

Retreat of Arctic sea ice cover has been primarily in the central Arctic region north of the Laptev and East Siberian Seas in an area of low sea ice concentration (Figure 1a). A few large areas of open water are present between several areas of higher-concentration sea ice. On the Pacific side, the Beaufort and Chukchi Seas have very little sea ice remaining; on the Atlantic side, both the Svalbard archipelago and Franz Josef Land are largely ice free (Figure 1a). Both passages of the Northwest Passage are largely clear of ice at the resolution of passive microwave satellite data, but likely have patchy ice remaining. Ice blocks the western end of the Parry Channel near M’Clure Strait, but the ice edge has pulled away from the coast in recent days and it appears that there is a narrow ice-free region along the northwest coast of Banks Island.

Antarctic sea ice grew at a much faster-than-average pace through the first eight days of September, increasing at 65,000 square kilometers (25,000 square miles) per day relative to the 1981 to 2010 average rate of 25,000 square kilometers (9,700 square miles) per day (Figure 1c). Much of this expansion occurred in the northeastern Ross Sea and along the Weddell Sea ice front (Figure 1d). However, growth slowed after September 8. If no further net growth occurs, the sea ice maximum will be below 17 million square kilometers (6.56 million square miles) for the first time in the satellite record, and about one million square kilometers (386,000 square miles) below the previous record low maximum of 1986. The five low maximum sea ice extents for Antarctica include 1986, 2002, 2017, 1989, and 2022. High variability is typical of the sea ice maximum period, and further growth is likely from storms or high winds along the vast circumpolar sea ice edge.

Conditions in context

Figure 2a. This plot shows average sea level pressure in the Arctic in millibars for September 1 to 11, 2023. Yellows and reds indicate high air pressure; blues and purples indicate low pressure. ||Credit: NSIDC courtesy NOAA Earth System Research Laboratory Physical Sciences Laboratory| High-resolution image

Figure 2a. This plot shows average sea level pressure in the Arctic in millibars for September 1 to 11, 2023. Yellows and reds indicate above average air pressure; blues and purples indicate below average pressure.

Credit: NSIDC courtesy NOAA Earth System Research Laboratory Physical Sciences Laboratory
High-resolution image

Figure 2b. This plot shows the departure from average air temperature in the Arctic at the 925 hPa level, in degrees Celsius, for September 1 to 11, 2023. Yellows and reds indicate higher than average temperatures; blues and purples indicate lower than average temperatures. ||Credit: NSIDC courtesy NOAA Earth System Research Laboratory Physical Sciences Laboratory| High-resolution image

Figure 2b. This plot shows the departure from average air temperature in the Arctic at the 925 hPa level, in degrees Celsius, for September 1 to 11, 2023. Yellows and reds indicate higher than average temperatures; blues and purples indicate lower than average temperatures.

Credit: NSIDC courtesy NOAA Earth System Research Laboratory Physical Sciences Laboratory
High-resolution image

Figure 2c. This plot shows the departure from average sea level pressure in the Antarctic in millibars for September 1 to 11, 2023. Yellows and reds indicate high air pressure; blues and purples indicate low pressure. ||Credit: NSIDC courtesy NOAA Earth System Research Laboratory Physical Sciences Laboratory| High-resolution image

Figure 2c. This plot shows the departure from average sea level pressure in the Antarctic in millibars for September 1 to 11, 2023. Yellows and reds indicate high air pressure; blues and purples indicate low pressure.

Credit: NSIDC courtesy NOAA Earth System Research Laboratory Physical Sciences Laboratory
High-resolution image

Figure 2d. This plot shows the departure from average air temperature in the Antarctic at the 925 hPa level, in degrees Celsius, for September 1 to 11, 2023. Yellows and reds indicate higher than average temperatures; blues and purples indicate lower than average temperatures. ||Credit: NSIDC courtesy NOAA Earth System Research Laboratory Physical Sciences Laboratory| High-resolution image

Figure 2d. This plot shows the departure from average air temperature in the Antarctic at the 925 hPa level, in degrees Celsius, for September 1 to 11, 2023. Yellows and reds indicate higher than average temperatures; blues and purples indicate lower than average temperatures.

Credit: NSIDC courtesy NOAA Earth System Research Laboratory Physical Sciences Laboratory
High-resolution image

For the first two weeks of September, high air pressure prevailed over northern Siberia, with low pressure over Greenland, which created significant winds along the Eurasian coast (Figure 2a). Air temperatures were generally above average in Western Europe and Scandinavia, and below average in eastern Siberia (Figure 2b). The outlook for a few more days is for continued warm conditions and airflow that may cause further contraction of the low-concentration sea ice.

In Antarctica, a strong high-pressure area over the Peninsula region with counterclockwise airflow helped push sea ice outward along the northwestern Weddell Sea, where the air temperature was quite low (Figure 2c). Low air pressure and below average temperatures in the central and western Ross Sea helped push sea ice outward in the eastern Ross Sea (Figure 2d). Storms will very likely cause the sea ice edge to fluctuate.

Late summer heat wave avoids central Arctic

While the first half of August saw a rapid pace of Arctic sea ice loss, the pace slowed during the latter half of the month as mostly cooler conditions set in. Antarctic sea ice extent increased during the second half of the month.

Overview of conditions

Arctic sea ice extent map for August 2023

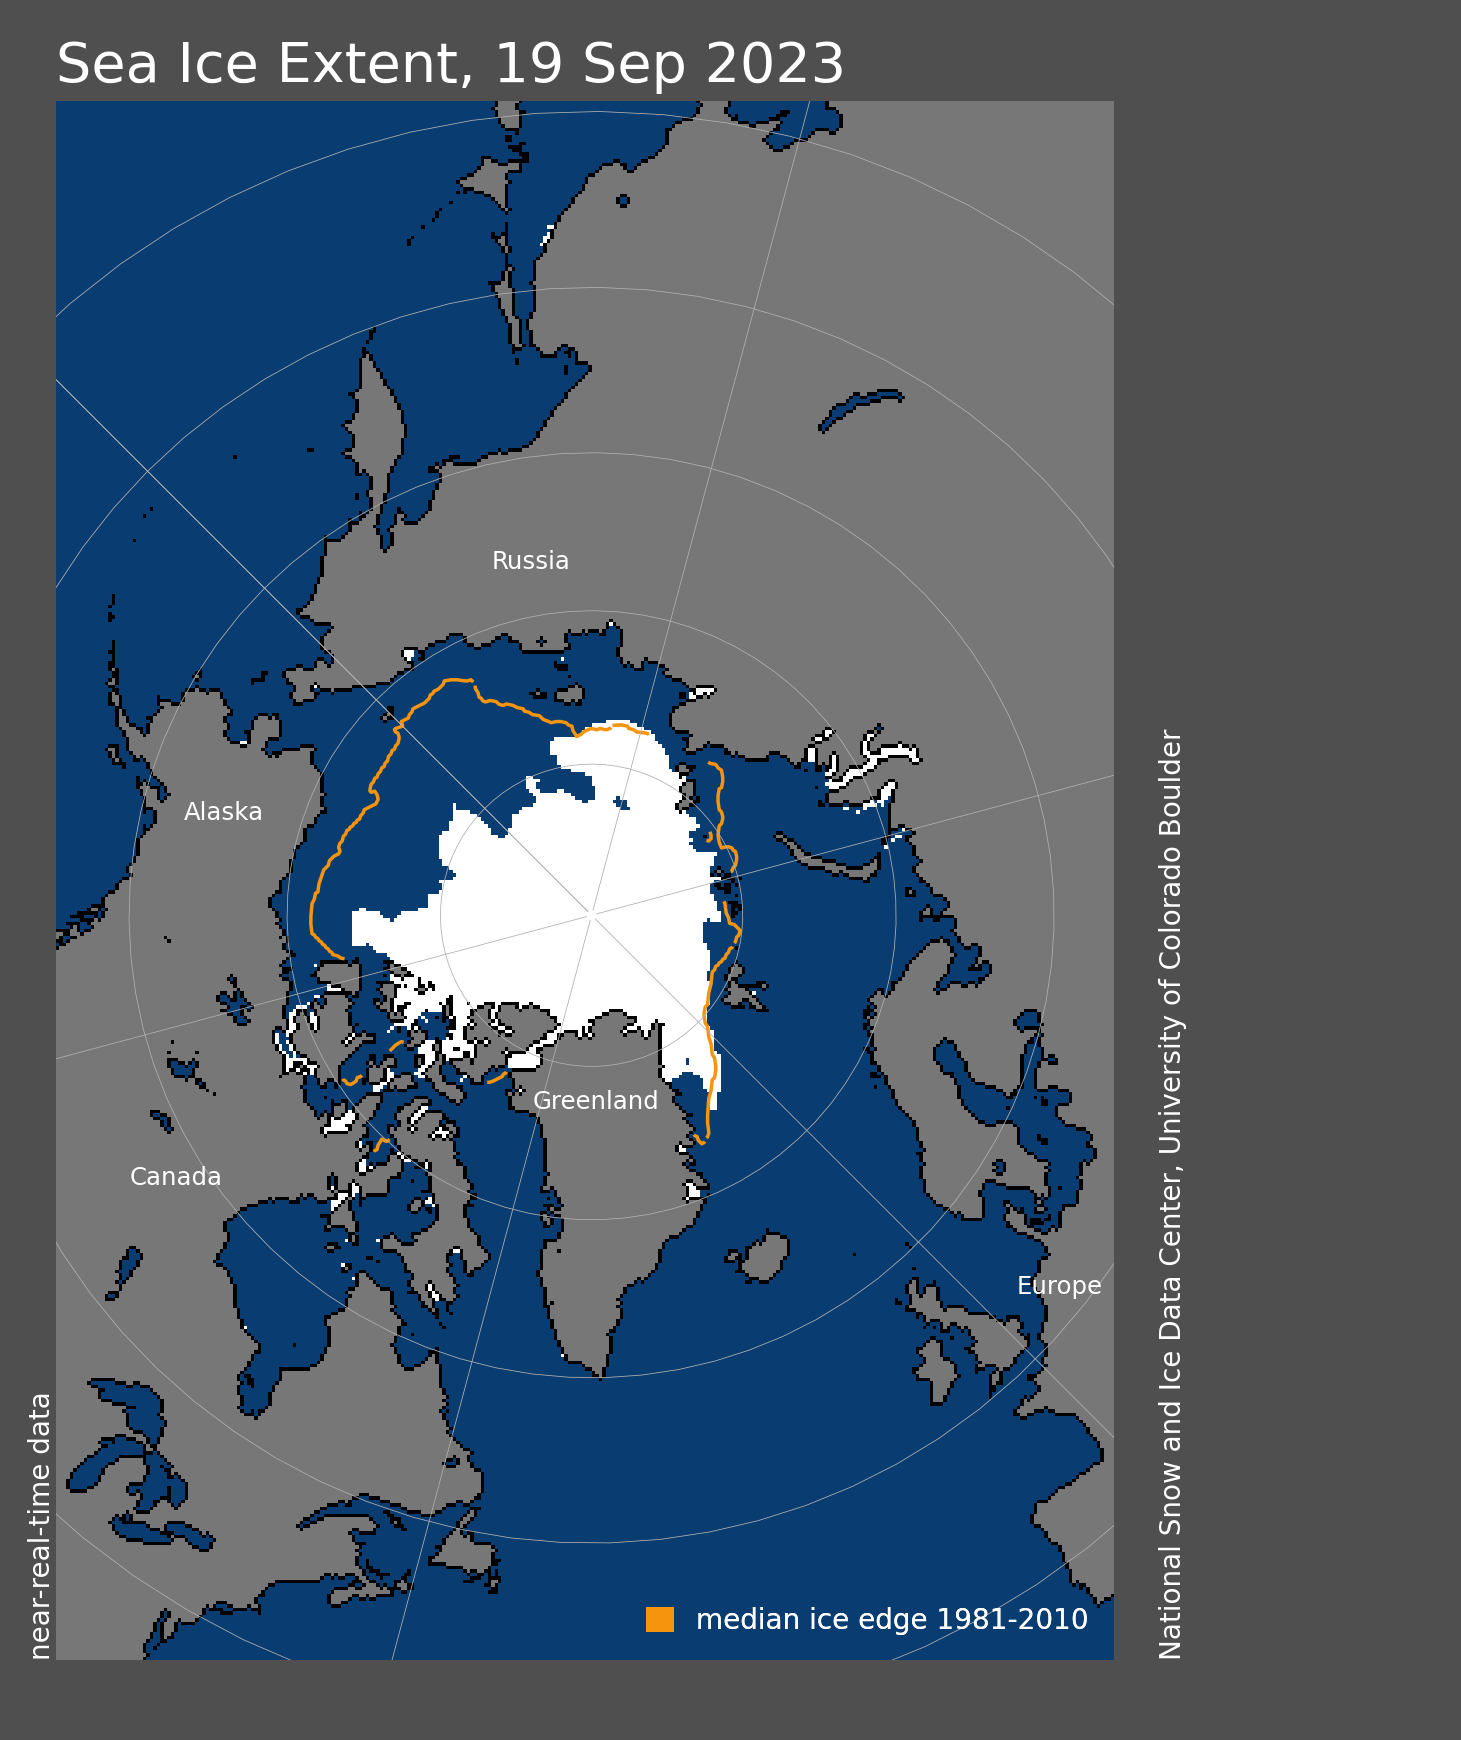
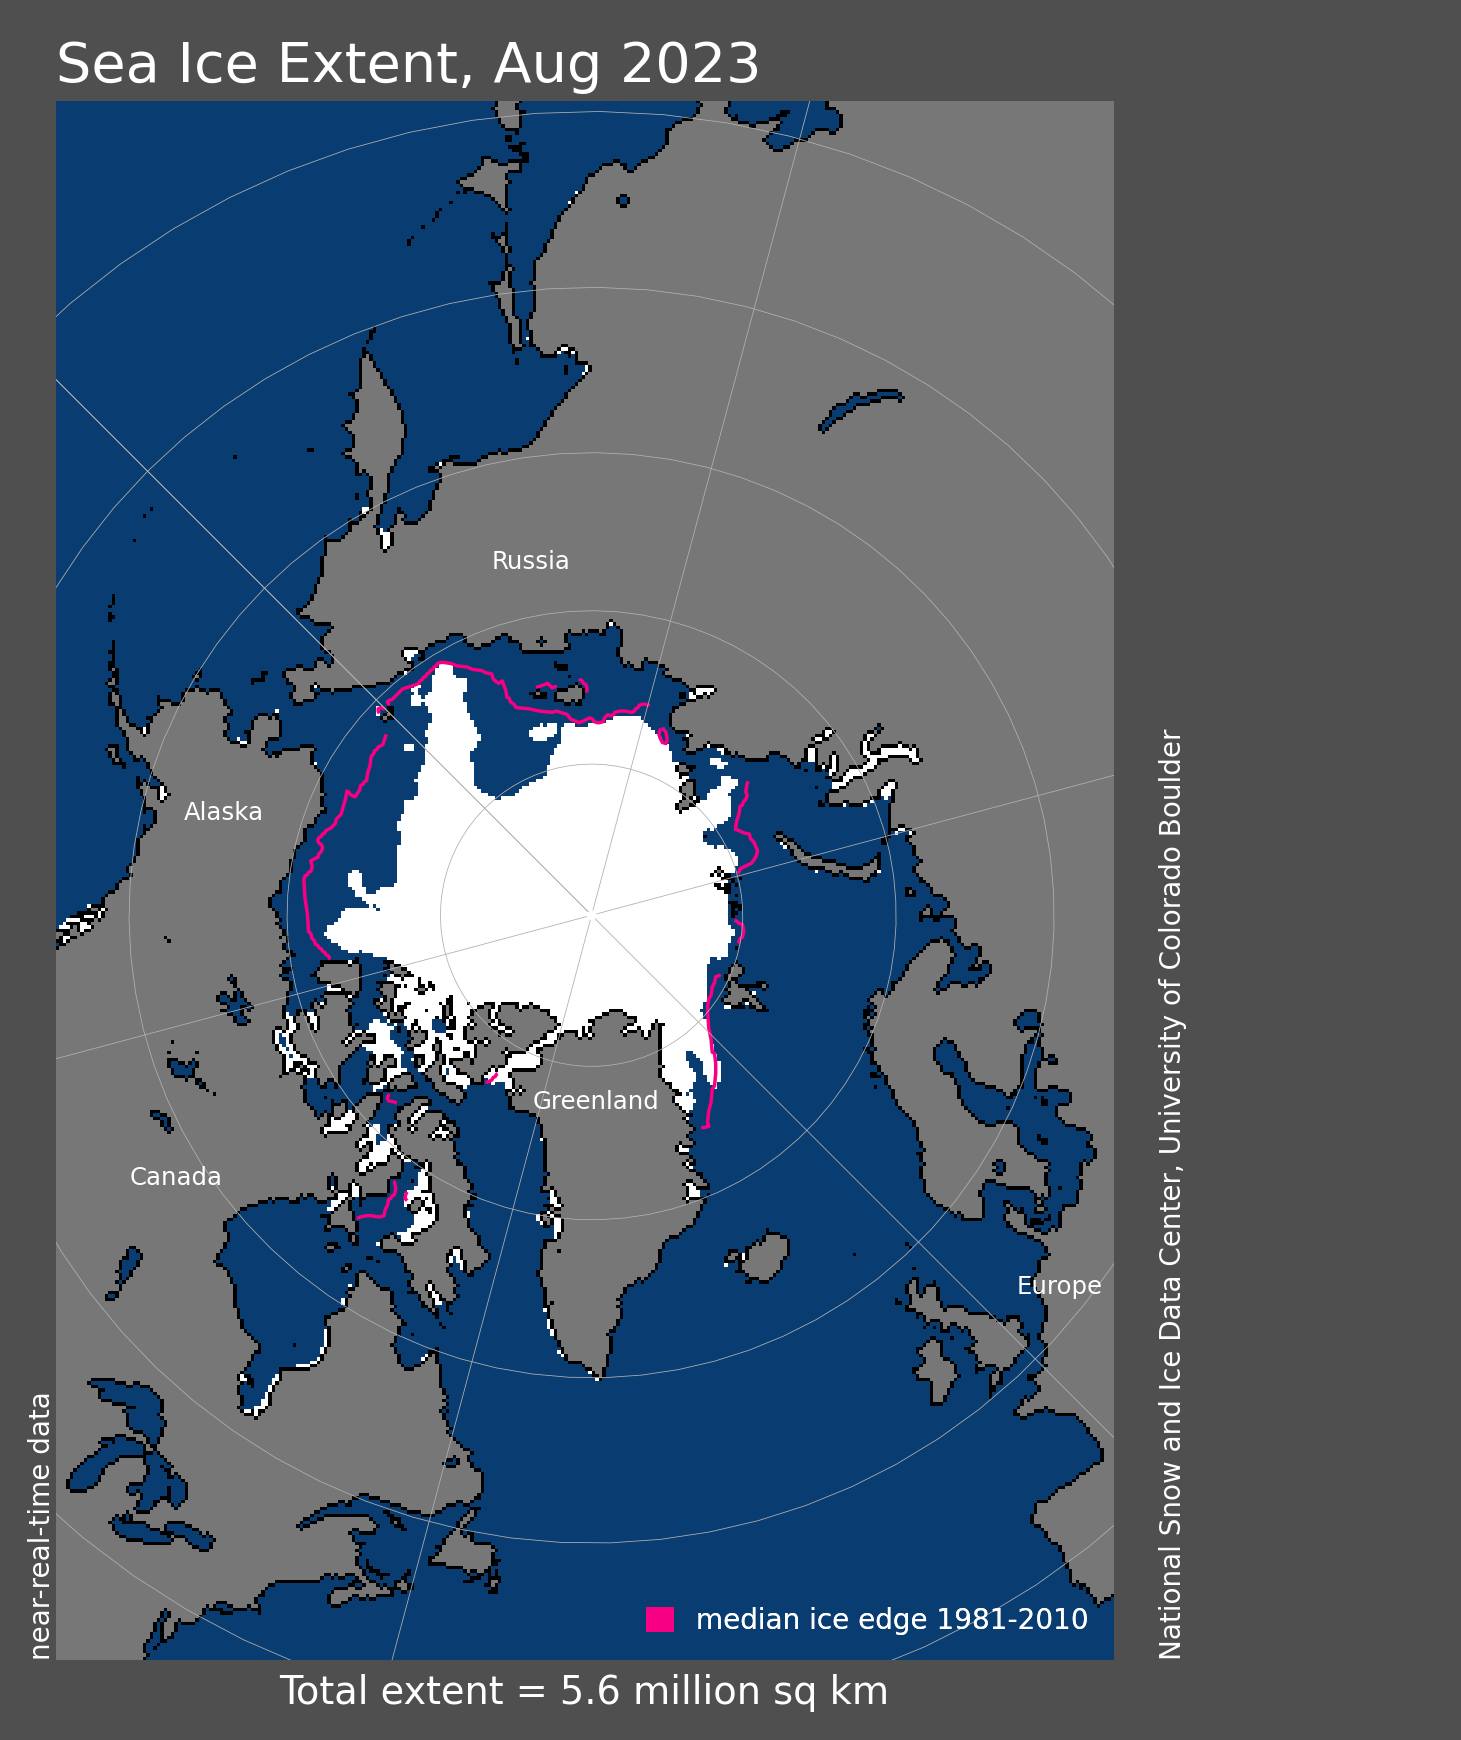
Figure 1a. Arctic sea ice extent for August 2023 was 5.57 million square kilometers (2.15 million square miles). The magenta line shows the 1981 to 2010 average extent for that month. Sea Ice Index data. About the data

Credit: National Snow and Ice Data Center
High-resolution image

Graph of Arctic sea ice extent for 2023 and several other years

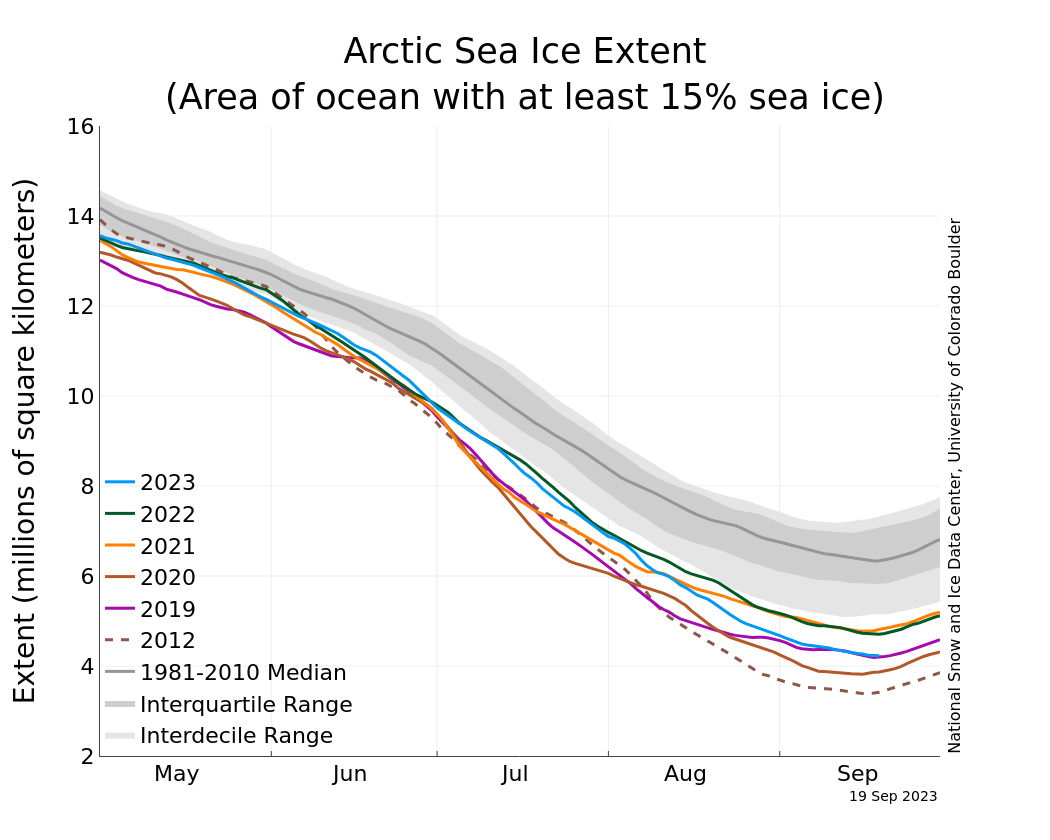
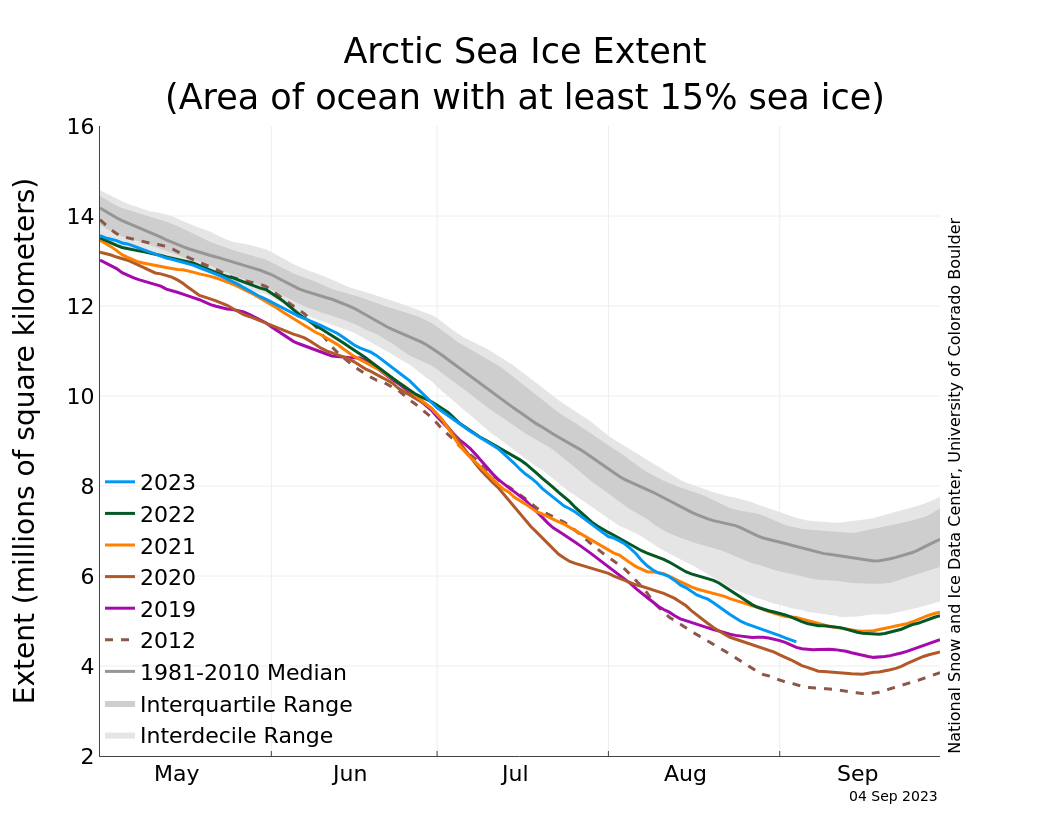
Figure 1b. The graph above shows Arctic sea ice extent as of September 4, 2023, along with daily ice extent data for four previous years and the record low year. 2023 is shown in blue, 2022 in green, 2021 in orange, 2020 in brown, 2019 in magenta, and 2012 in dashed brown. The 1981 to 2010 median is in dark gray. The gray areas around the median line show the interquartile and interdecile ranges of the data. Sea Ice Index data.

Credit: National Snow and Ice Data Center
High-resolution image

August Arctic sea ice extent averaged 5.57 million square kilometers (2.15 million square miles), or the eighth lowest in the 45-year satellite record (Figure 1a). Extent was 1.63 million square kilometers (629,000 square miles) below the 1981 to 2010 reference period and 850,000 square kilometers (328,000 square miles) above the previous record low for the month set in 2012. As of the end of August, 2.24 million square kilometers (860,000 square miles) of sea ice was lost in the Arctic.

As is typical during the latter half of August, the pace of ice loss slowed (Figure 1b).  Nevertheless, the daily ice loss rate of 72,100 square kilometers (27,800 square miles) per day was faster than the 1981 to 2010 average of 57,200 square kilometers (22,100 square miles) per day.

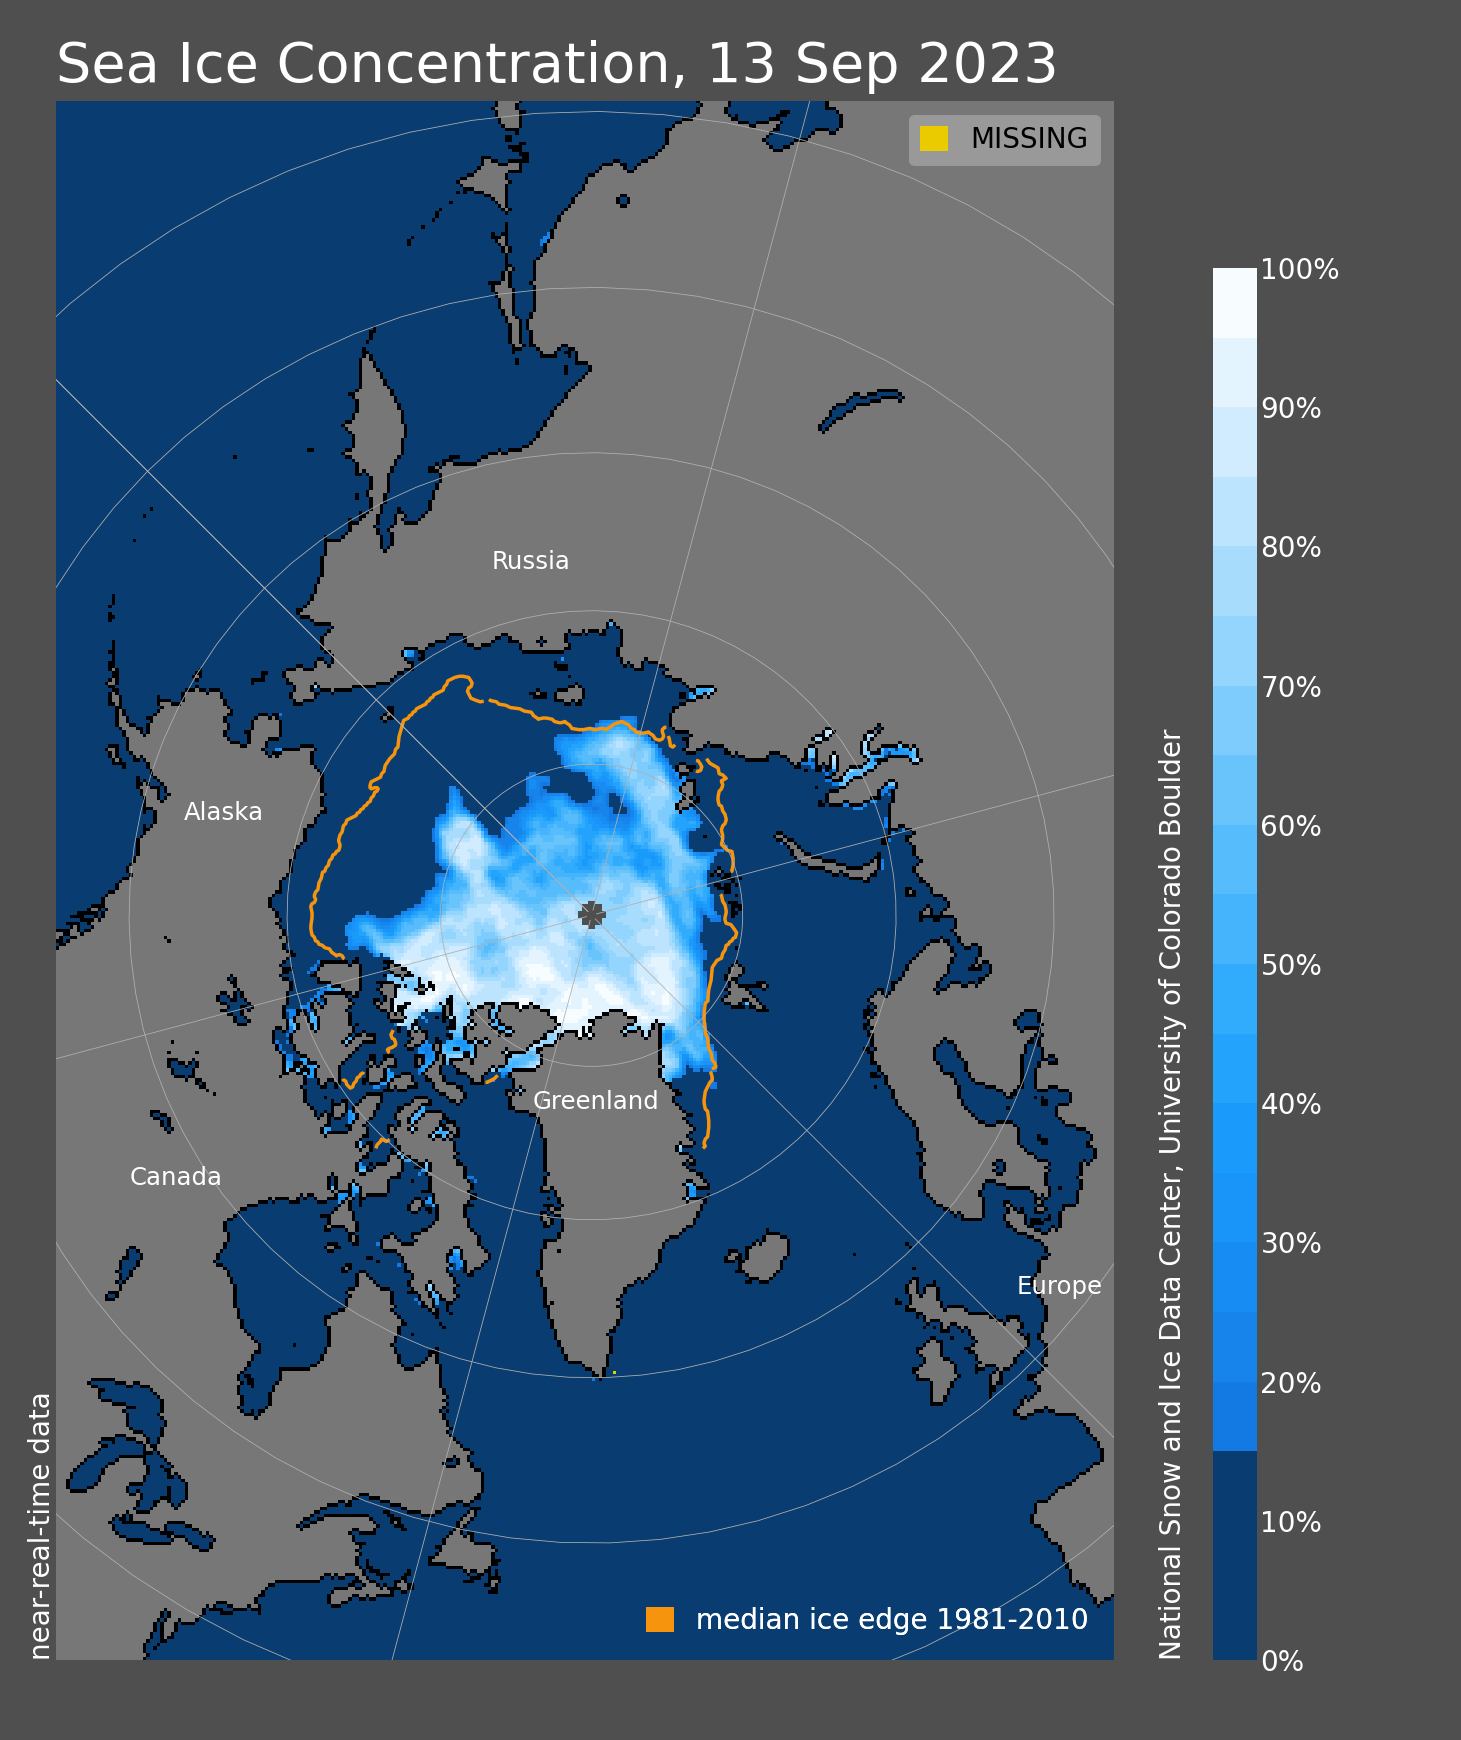
At month’s end, the ice edge remained considerably farther north than average in the Beaufort, Chukchi and East Siberian Seas, while in the Kara and Barents Seas the ice edge was near its typical location, albeit farther north in a few scattered regions. In the East Greenland Sea the ice was also well north of its usual position, in large part because of reduced ice export out of Fram Strait. While the ice edge in the Laptev Sea was near average, large areas of low ice concentration and open water were present.

The southern Northwest Passage, known as Amundsen’s route, remains nearly ice free, and the northern deepwater route between M’Clure Strait and Lancaster Sound has less ice than the previous record low for this time of year set in 2011. However, some ice still clogs M’Clure Strait and ice in the Beaufort Sea hinders easy access.

Conditions in context

Arctic air temperature August 15 to 31, 2023

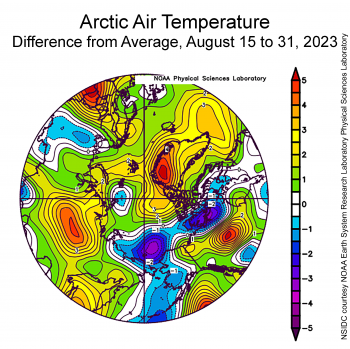
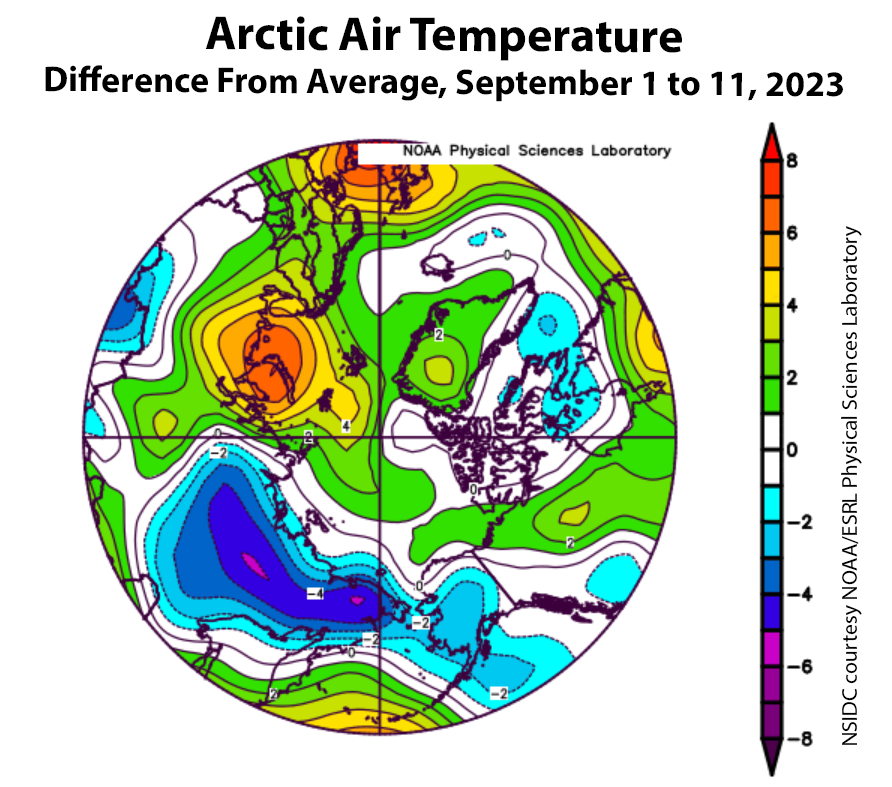
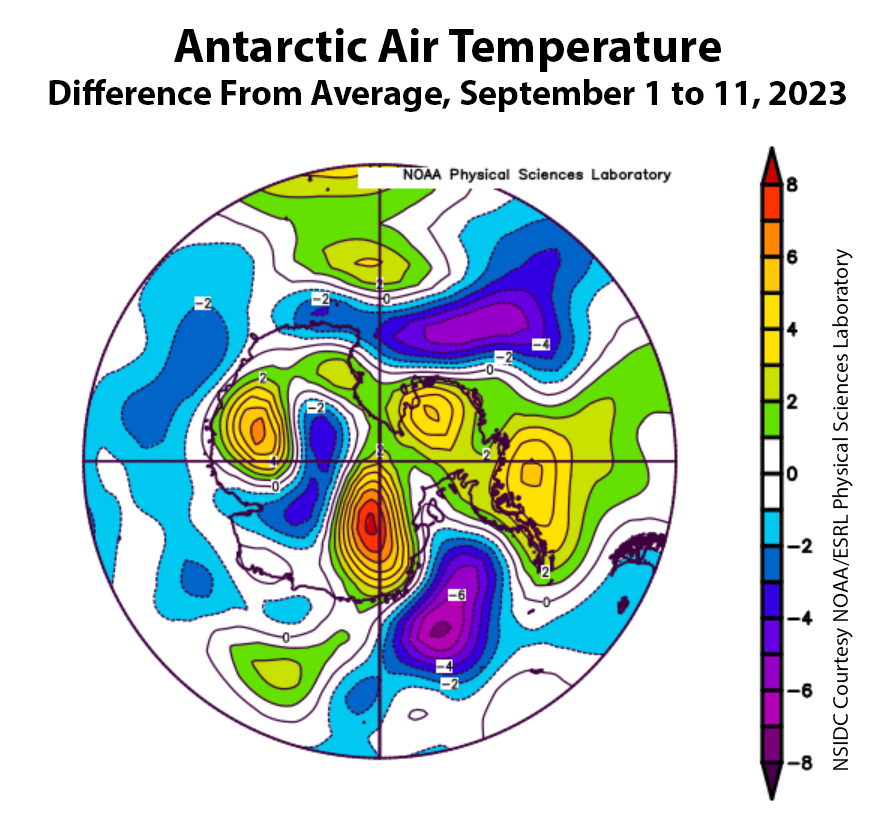
Figure 2a. This plot shows the departure from average air temperature in the Arctic at the 925 hPa level, in degrees Celsius, from August 15 to 31, 2023. Yellows and reds indicate higher than average temperatures; blues and purples indicate lower than average temperatures.

Credit: NSIDC courtesy NOAA Earth System Research Laboratory Physical Sciences Laboratory
High-resolution image

Average sea level pressure for Arctic August 15 to 31, 2023

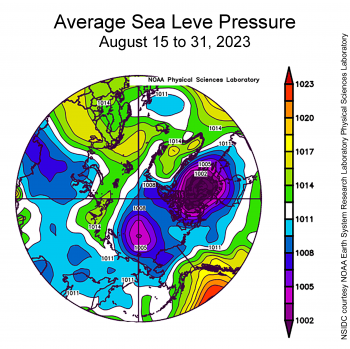
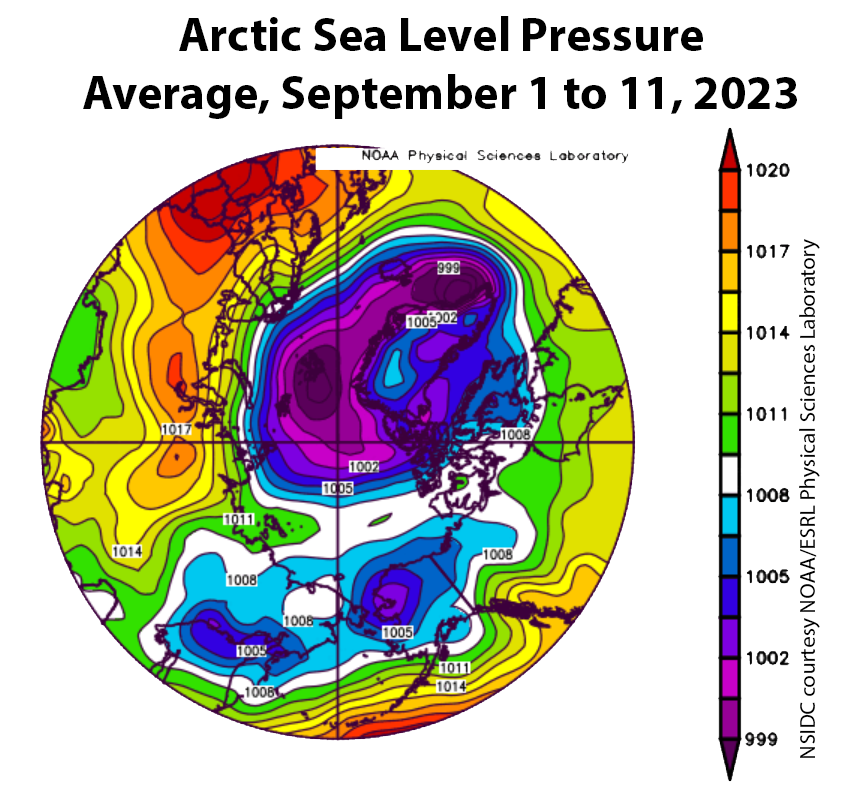
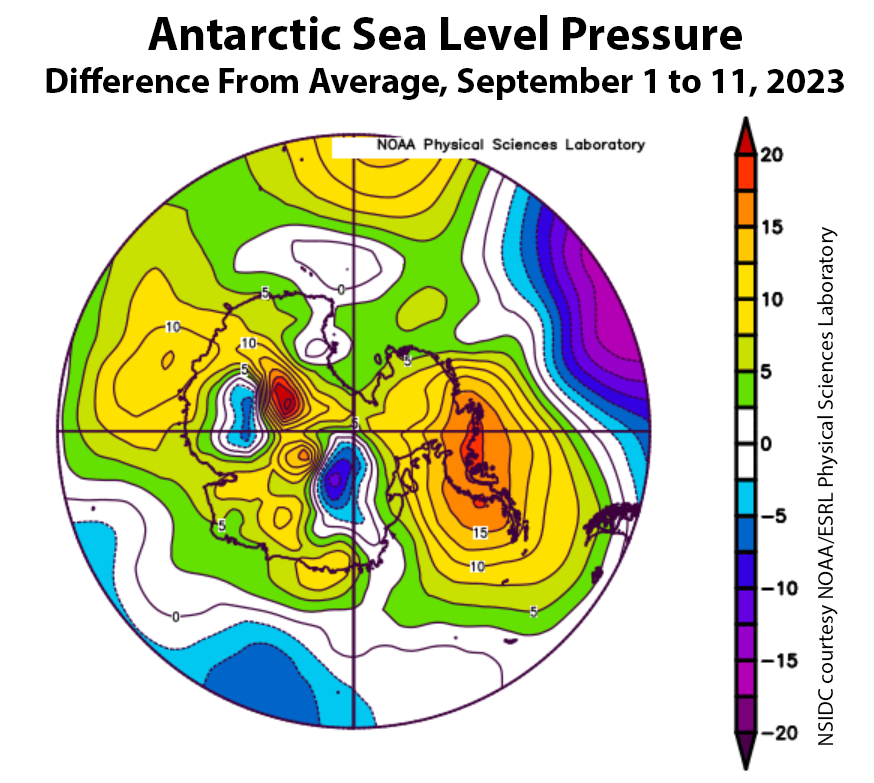
Figure 2b. This plot shows average sea level pressure in the Arctic in millibars from August 15 to 31, 2023. Yellows and reds indicate high air pressure; blues and purples indicate low pressure.

Credit: NSIDC courtesy NOAA Earth System Research Laboratory Physical Sciences Laboratory
High-resolution image

During the second half of August, air temperatures at the 925 millibar level (about 2,500 feet above the surface) averaged 1 to 5 degrees Celsius (2 to 9 degrees Fahrenheit) below average in the Chukchi and East Siberian Seas, whereas above-average air temperatures prevailed in northern Greenland at 1 to 6 degrees Celsius (2 to 11 degrees Fahrenheit) (Figure 2a). Patches of warm conditions persisted in the Kara and Barents Seas of 1 to 3 degrees Celsius (2 to 5 degrees Fahrenheit) above average, though cool conditions were nearby. This contrasts with the pattern observed in the first half of the month when temperatures were below average north of Greenland, above average in the Chukchi and East Siberian Seas, and considerably above average in the Kara and Barents Seas.

Conditions shifted with the development of prominent areas of low sea level pressure over northern Canada and the Central Arctic Ocean; the latter feature is typical for this time of year (Figure 2b). By contrast, high pressure lingered over Greenland, the Norwegian Sea, and extended eastward along the Russian coast into the Laptev Sea. The high pressure over the Norwegian Sea and the implied winds from the south helped to transport warm air northward and also inhibited ice transport out of Fram Strait. Low pressure over the central Arctic Ocean helped to transport cold air southwards, contributing to the cool conditions over the Chukchi Sea.

August 2023 compared to previous years

trend line of decline for August sea ice extent from 1979 to 2023

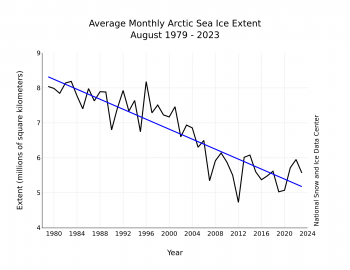
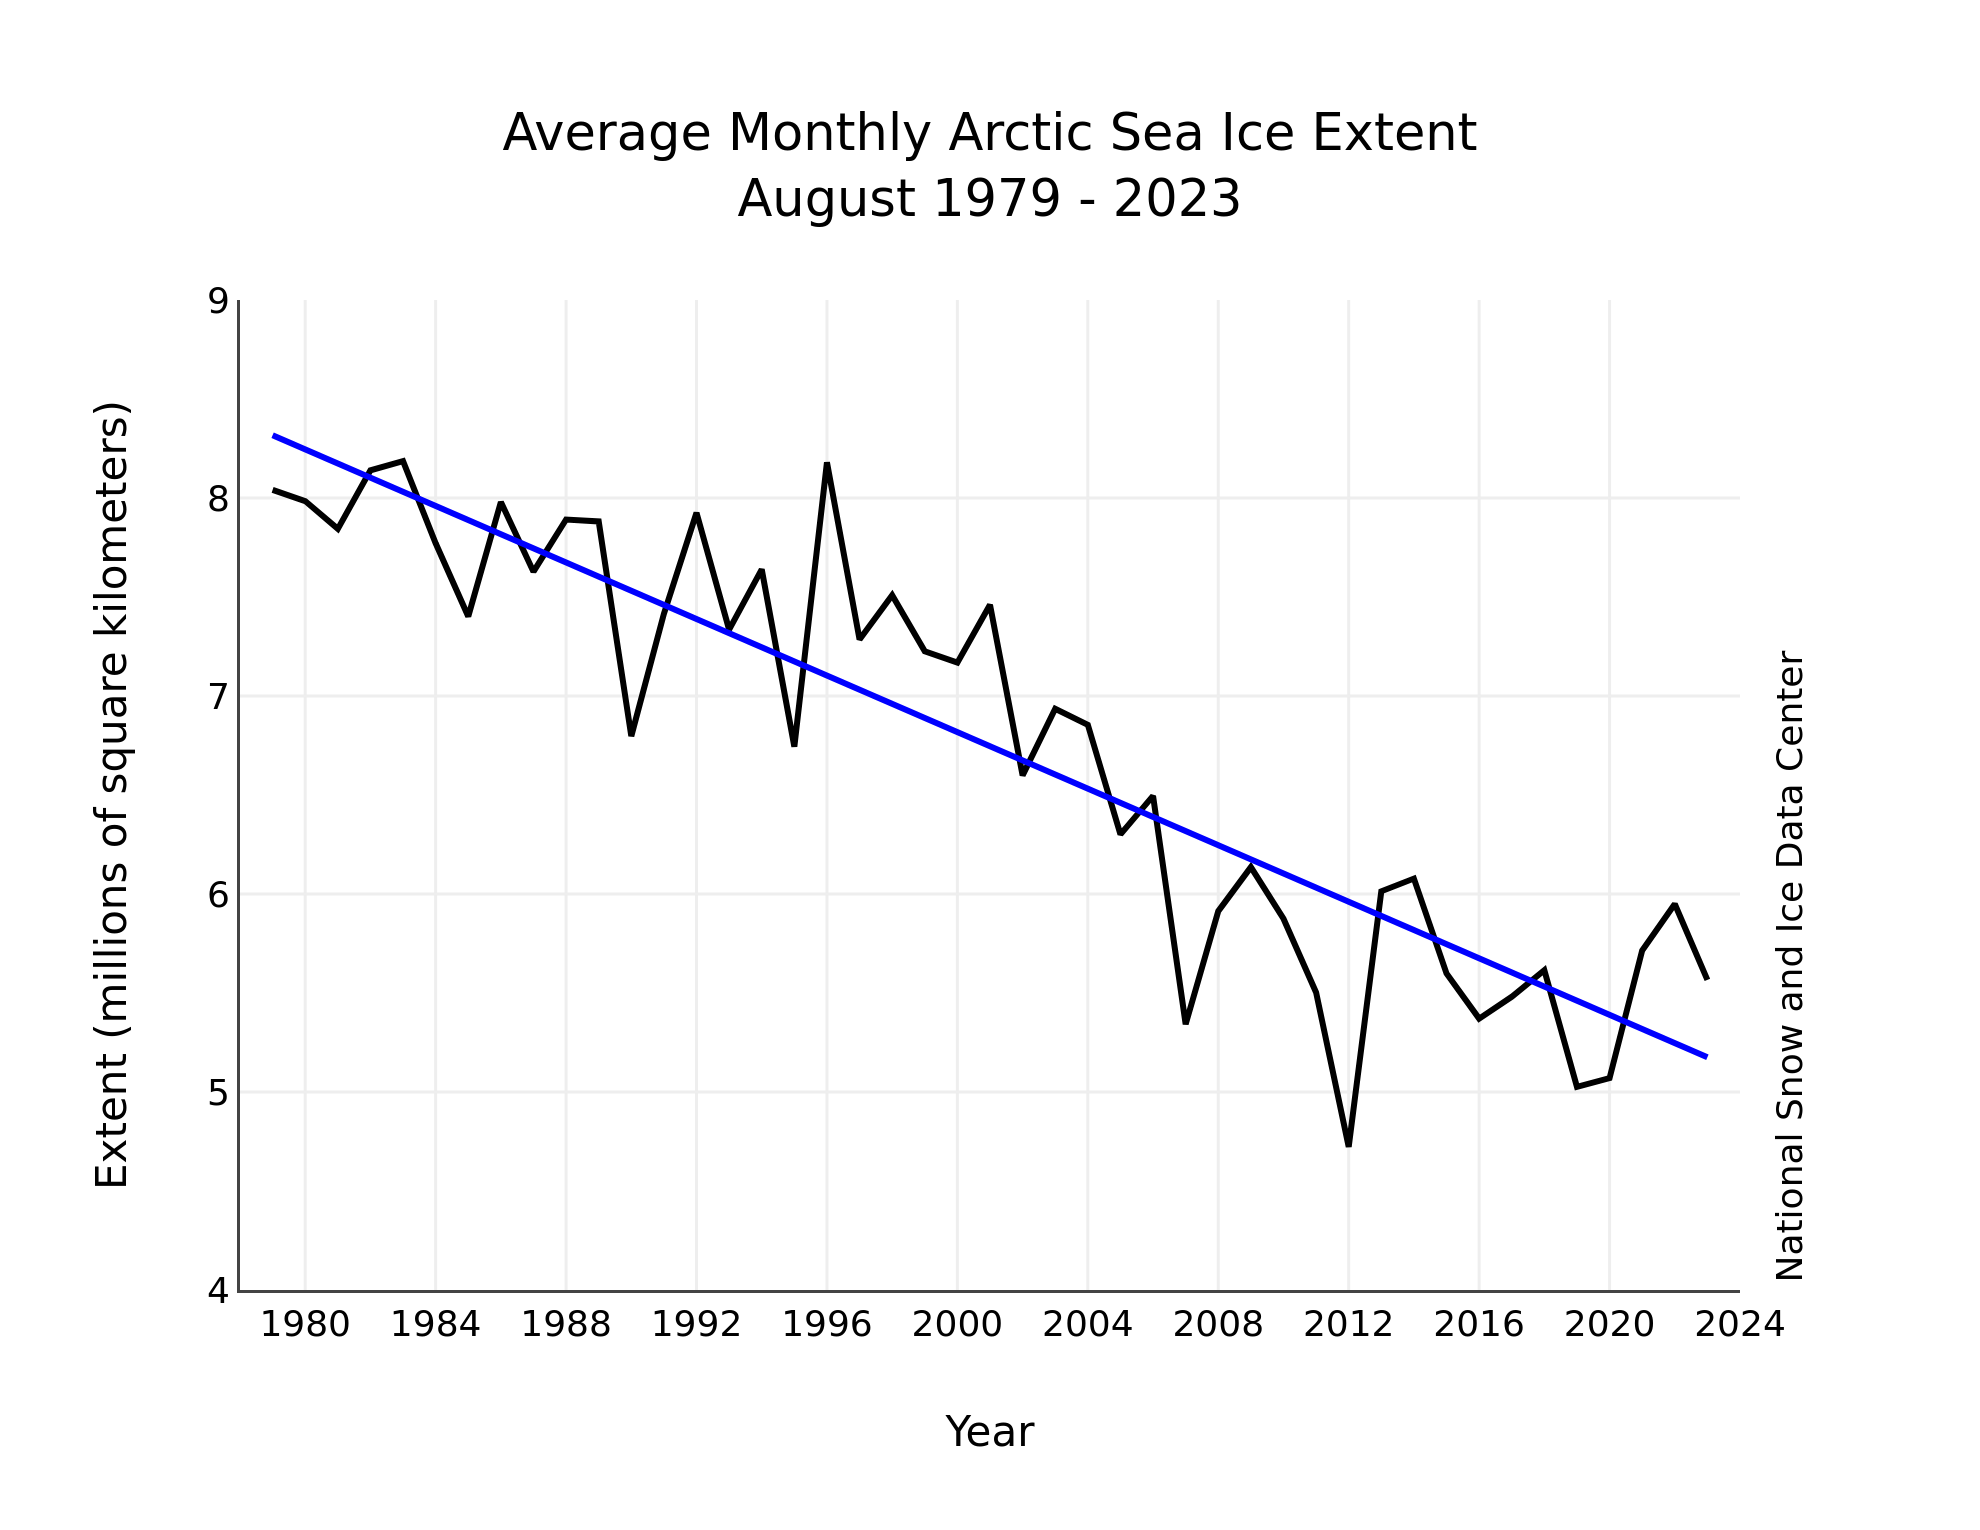
Figure 3. Monthly August ice extent for 1979 to 2023 shows a decline of 9.9 percent per decade.

Credit: National Snow and Ice Data Center
High-resolution image

The downward linear trend in Arctic sea ice extent in August over the 45-year satellite record is 71,400 square kilometers (27,600 square miles) per year, or 9.9 percent per decade relative to the 1981 to 2010 average (Figure 3). Based on the linear trend, since 1979, August has lost 3.14 million square kilometers (1.21 million square miles) of ice. This is roughly equivalent to twice size of state of Alaska or the country of Iran.

Cascading impacts of changing sea ice conditions on marine ecosystems

present and future illustrations of phytoplankton blooms

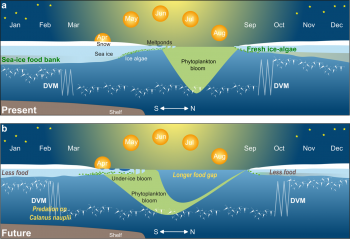
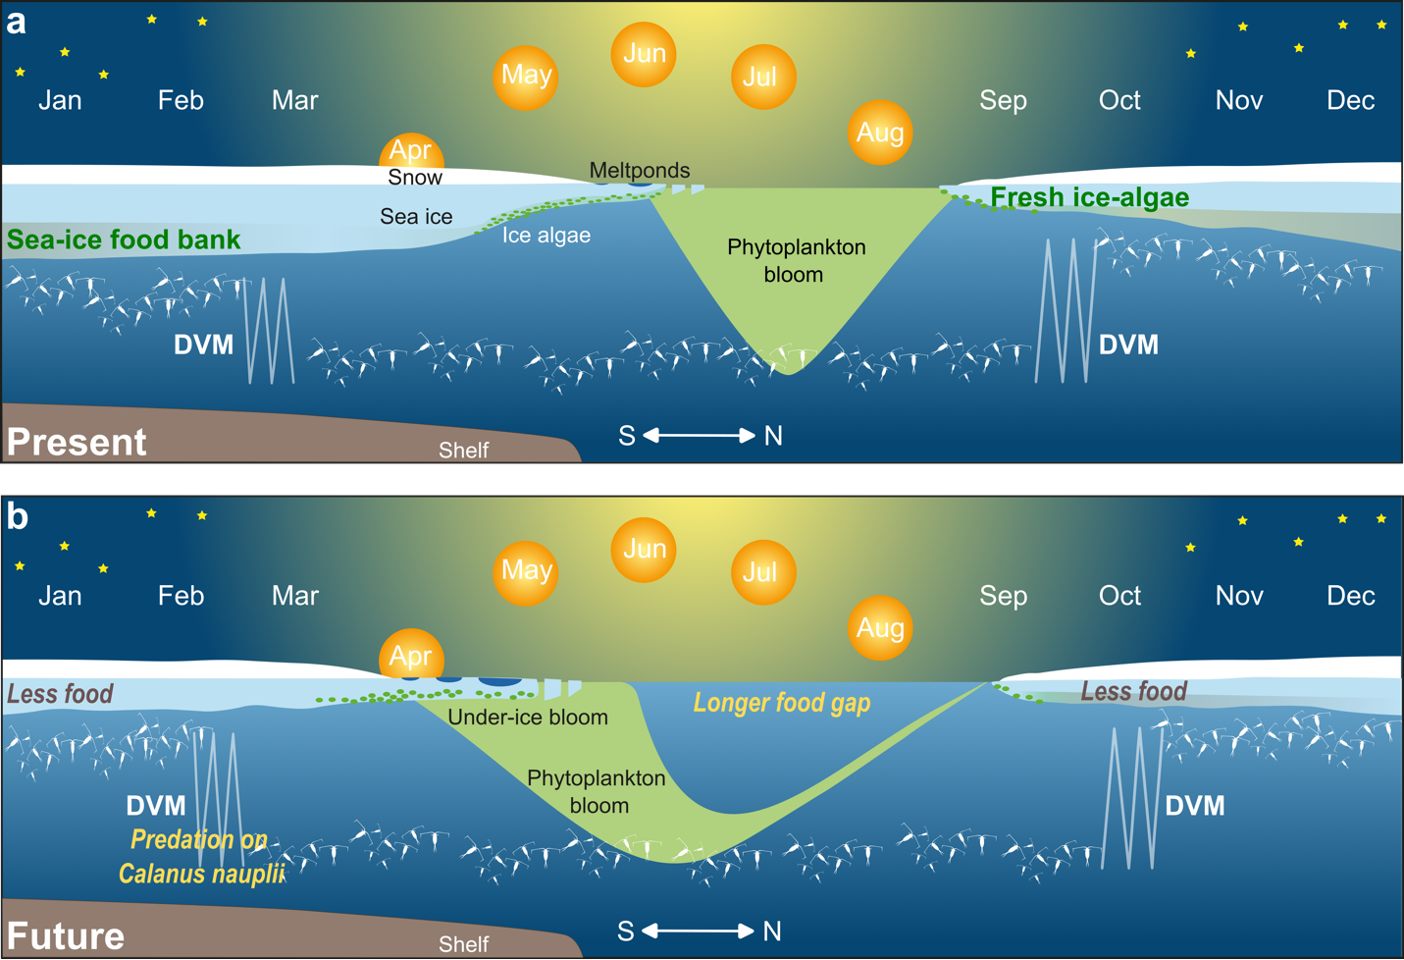
Figure 4. The top illustration shows the current seasonal cycle in the diel vertical migration (DVM), also known as diurnal vertical migration of zooplankton and its links to sunlight. The bottom panel shows a possible future scenario of the impact of earlier spring light penetration and later autumn freeze up on the DVM within the surface layer, up to 50 meters (164 feet) of the Arctic Ocean. This assumes a ‘business-as-usual’ (SSP5-8.5) emission scenario. The intensity of the green-brown shading in the sea ice reflects potential changes in sea ice algae while the green shading of phytoplankton blooms is not scaled to productivity or biomass.

Credit: Based on scenarios shown in Soreide et al. 2010, Leu et al. 2011, Wassmann and Reigstad 2011, and Ardyna and Arrigo 2020
High-resolution image

The largest biomass migration on Earth each day happens within our oceans. Zooplankton, including tiny copepods and krill, migrate during the night towards the ocean surface to feed and then retreat to deeper depths during daylight to avoid predation. In the Arctic, however, the alternation of winter’s polar night and summer’s polar day results in a seasonal migration pattern. During the polar day, zooplankton primarily feed on phytoplankton blooms but during the polar night, they travel to the underside of the ice to feed on ice algae. As sea ice shrinks and thins, more light enters the ocean and shifts the seasonal migration. According to researchers at the Alfred Wegener Institute (AWI) and National Snow and Ice Data Center (NSIDC) scientist Julienne Stroeve, zooplankton prefer to stay at depths where light levels are below a certain intensity. Using mooring data deployed at the end of the year-long Multidisciplinary drifting Observatory for the Study of Arctic Climate (MOSAiC) expedition, they quantify this critical light threshold. Using this threshold in climate model simulations, they conclude that as sea ice continues to thin, the ocean level at which this critical light threshold is reached deepens earlier in the year, resulting in zooplankton remaining at depth for longer before coming to the surface to feed on sea ice algae. Currently, the zooplankton begin their springtime downward migration after nauplius larvae of the copepod C. hyperboreus have migrated to the surface and developed to copepodites. As the ice cover reduces, this springtime migration will start earlier. This will change their feeding habits, perhaps feeding on the C. hyperboreus nauplii before they have fully developed. Changing light levels will also shift the biomass and seasonality of ice algae and phytoplankton, the food sources for zooplankton. Since zooplankton feed the fish that feed the seals and whales, this change can cascade through the marine ecosystem.

Northwest Passage

sea ice extent in southern route of Northwest Passage

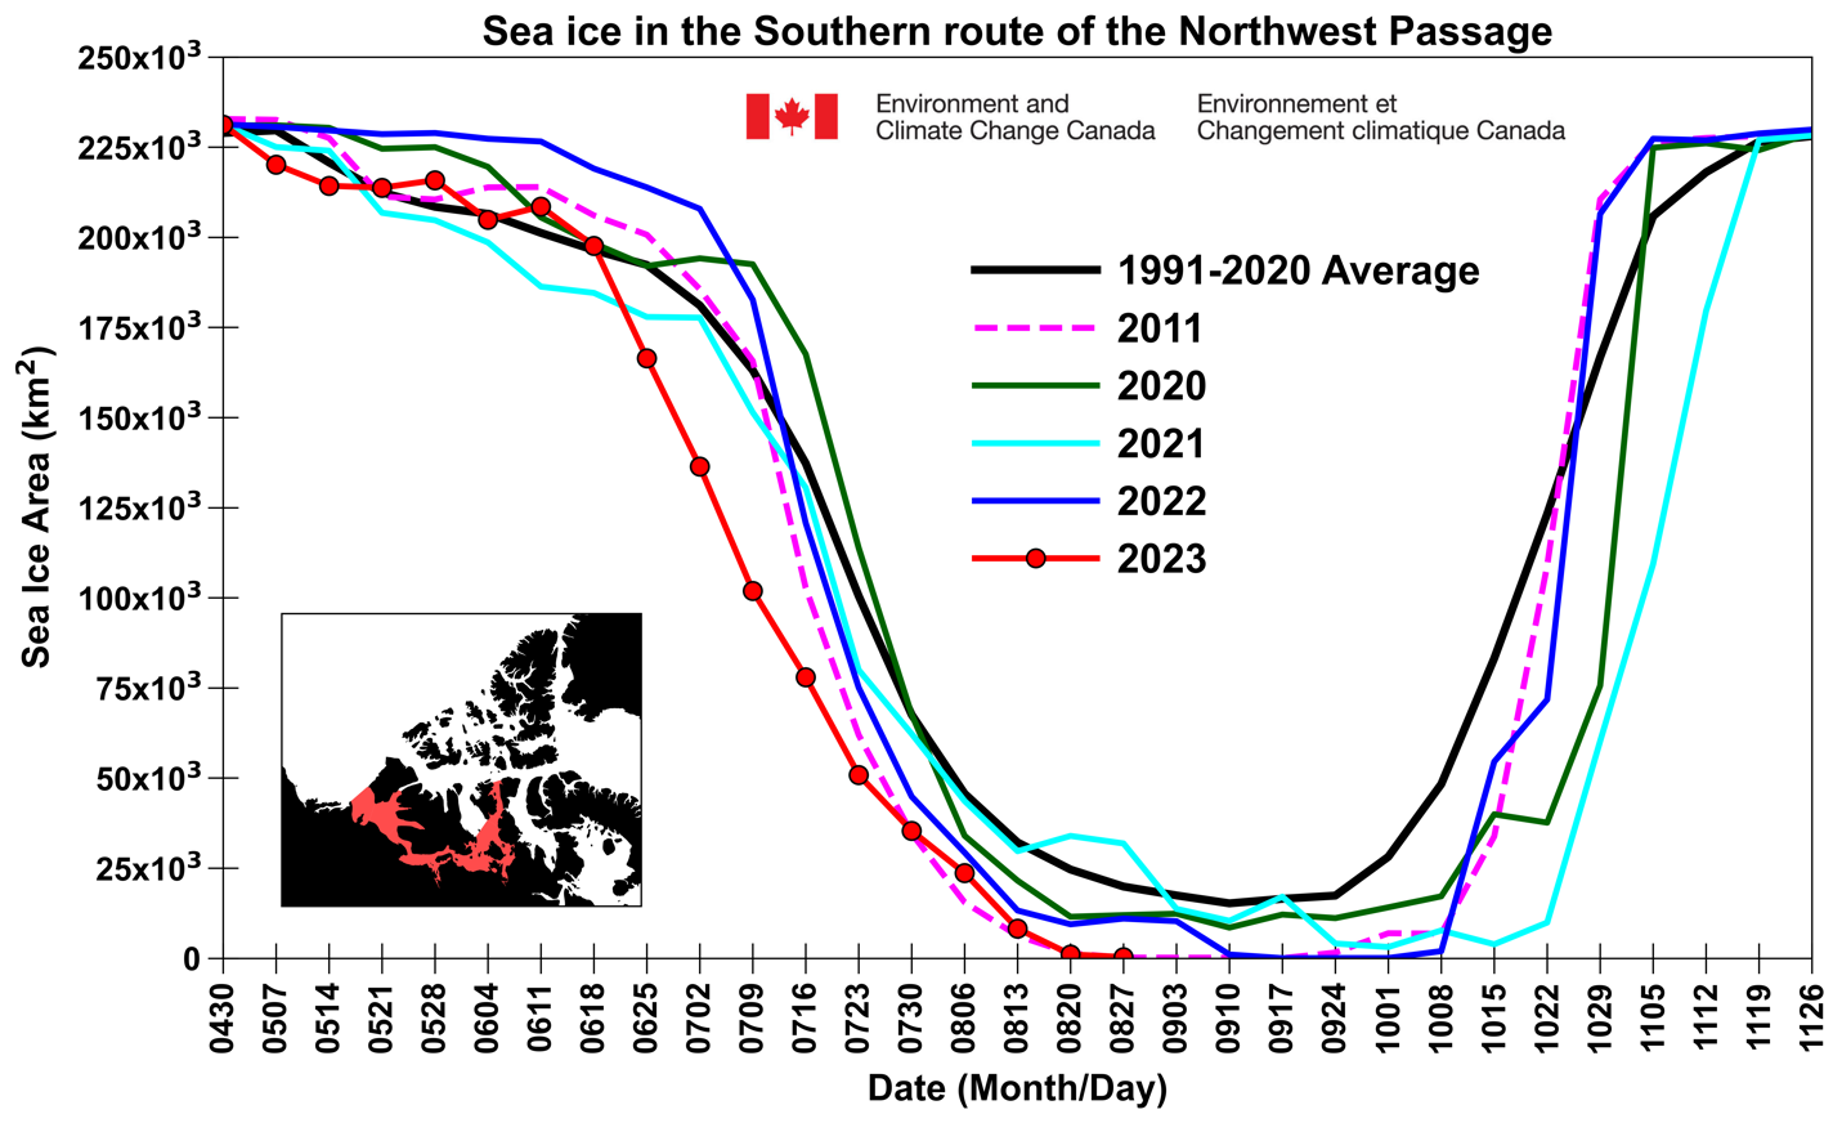
Figure 5a. This time series graph shows total sea ice area for 2023, 2022, 2021, 2020, 2011, and the 1991 to 2020 average within the southern route of the Northwest Passage.

Credit: S. Howell, Canadian Ice Service
High-resolution image

Sea ice are in northern route of Northwest Passage for 2023 and other years

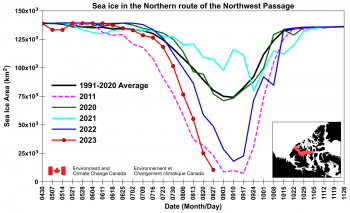
Figure 5b. This time series graph shows total sea ice area for 2023, 2022, 2021, 2020, 2011, and the 1991 to 2020 average within the northern route of the Northwest Passage.

Credit: S. Howell, Canadian Ice Service
High-resolution image

As of August 28, the southern route of the Northwest Passage, known as Amundsen’s route, is almost completely free of sea ice (Figure 5a). The sea ice area in the northern route (deep water) is currently tracking just above 2011 record low conditions (Figure 5b). The route is almost sea ice free with the exception of the vicinity of the western end of M’Clure Strait. Although ice conditions have been very light this year as well as in 2022, it is important to note that ice conditions can be highly variable. While light ice years in the Northwest Passage may occur more frequently as the Arctic continues to warm, the processes of sea ice transport and the aging of seasonal first year ice that lead to heavy ice years in the Northwest Passage, such as in 2021 and 2020, still continue to operate.

Floe-ing with the landscape

satellite images of buoys drifting over time in summer of 2020

Figure 6. These three satellite images show buoy positions in red and sea ice conditions from the Moderate Resolution Imaging Spectroradiometer (MODIS) on July 12, July 26, and August 6, from left to right. The blue star shows the location of the Multidisciplinary drifting Observatory for the Study of Arctic Climate (MOSAiC) Central Observatory where one of the buoys was deployed.

Credit: Watkins, D. M. et al, 2023
High-resolution image

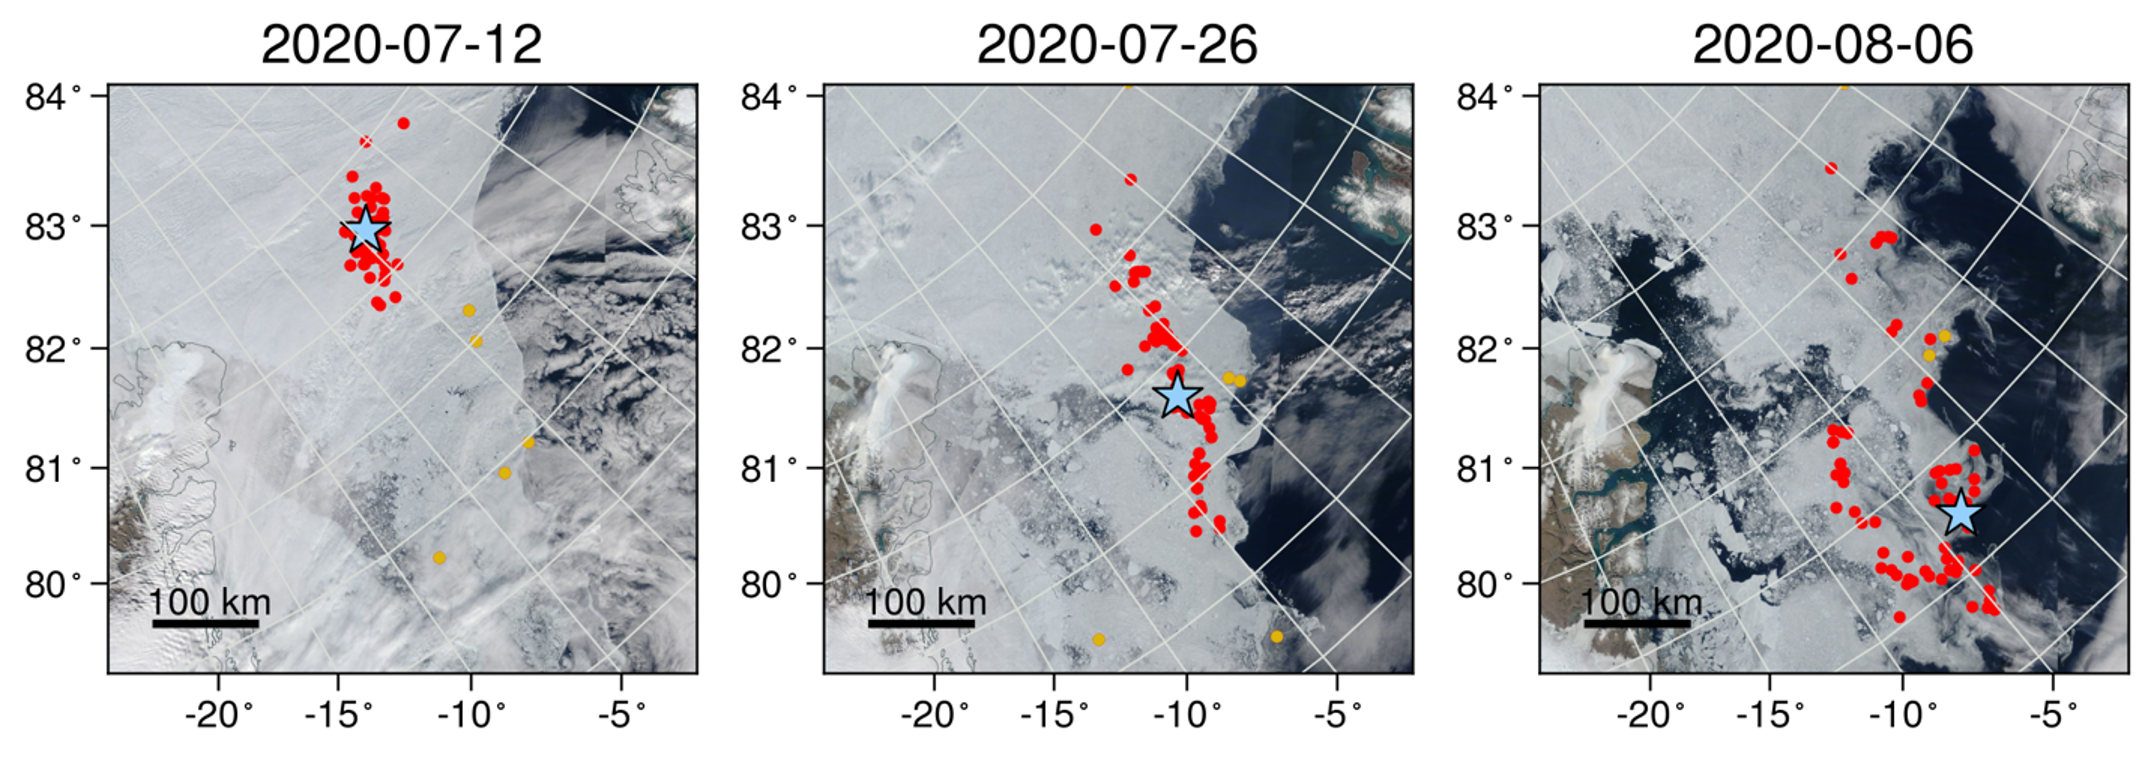
A recent paper led by colleagues at Brown University highlights the tight coupling between sea ice and ocean dynamics in the Fram Strait region. Fram Strait—the passage between Greenland and the Svalbard archipelago—is the key deepwater connection between the Arctic and Atlantic Oceans. It is also the primary region where sea ice is exported from the Arctic Ocean into the Atlantic. Figure 6 shows an ensemble of drifting buoys that were deployed as part of the international Multidisciplinary drifting Observatory for the Study of Arctic Climate (MOSAiC) expedition in Fall 2019 in the Laptev Sea. The buoys were carried westward by the Transpolar Drift Stream, and then flushed through Fram Strait and into the East Greenland Sea during spring and summer 2020. The authors documented clear changes in sea ice dynamics as the buoys crossed over undersea features, such as the Yermak Plateau north of Svalbard and the East Greenland Continental Shelf. These changes are concentrated at frequencies corresponding to tides and inertial oscillations, which show how the seafloor topography influences sea ice. The importance of ocean currents for the sea ice drift was further shown using a new ice tracking algorithm called Ice Floe Tracker. The team showed an increased role for ocean forcing relative to wind forcing on marginal ice zone sea ice in shallow seas and near the edge of the continental shelf.

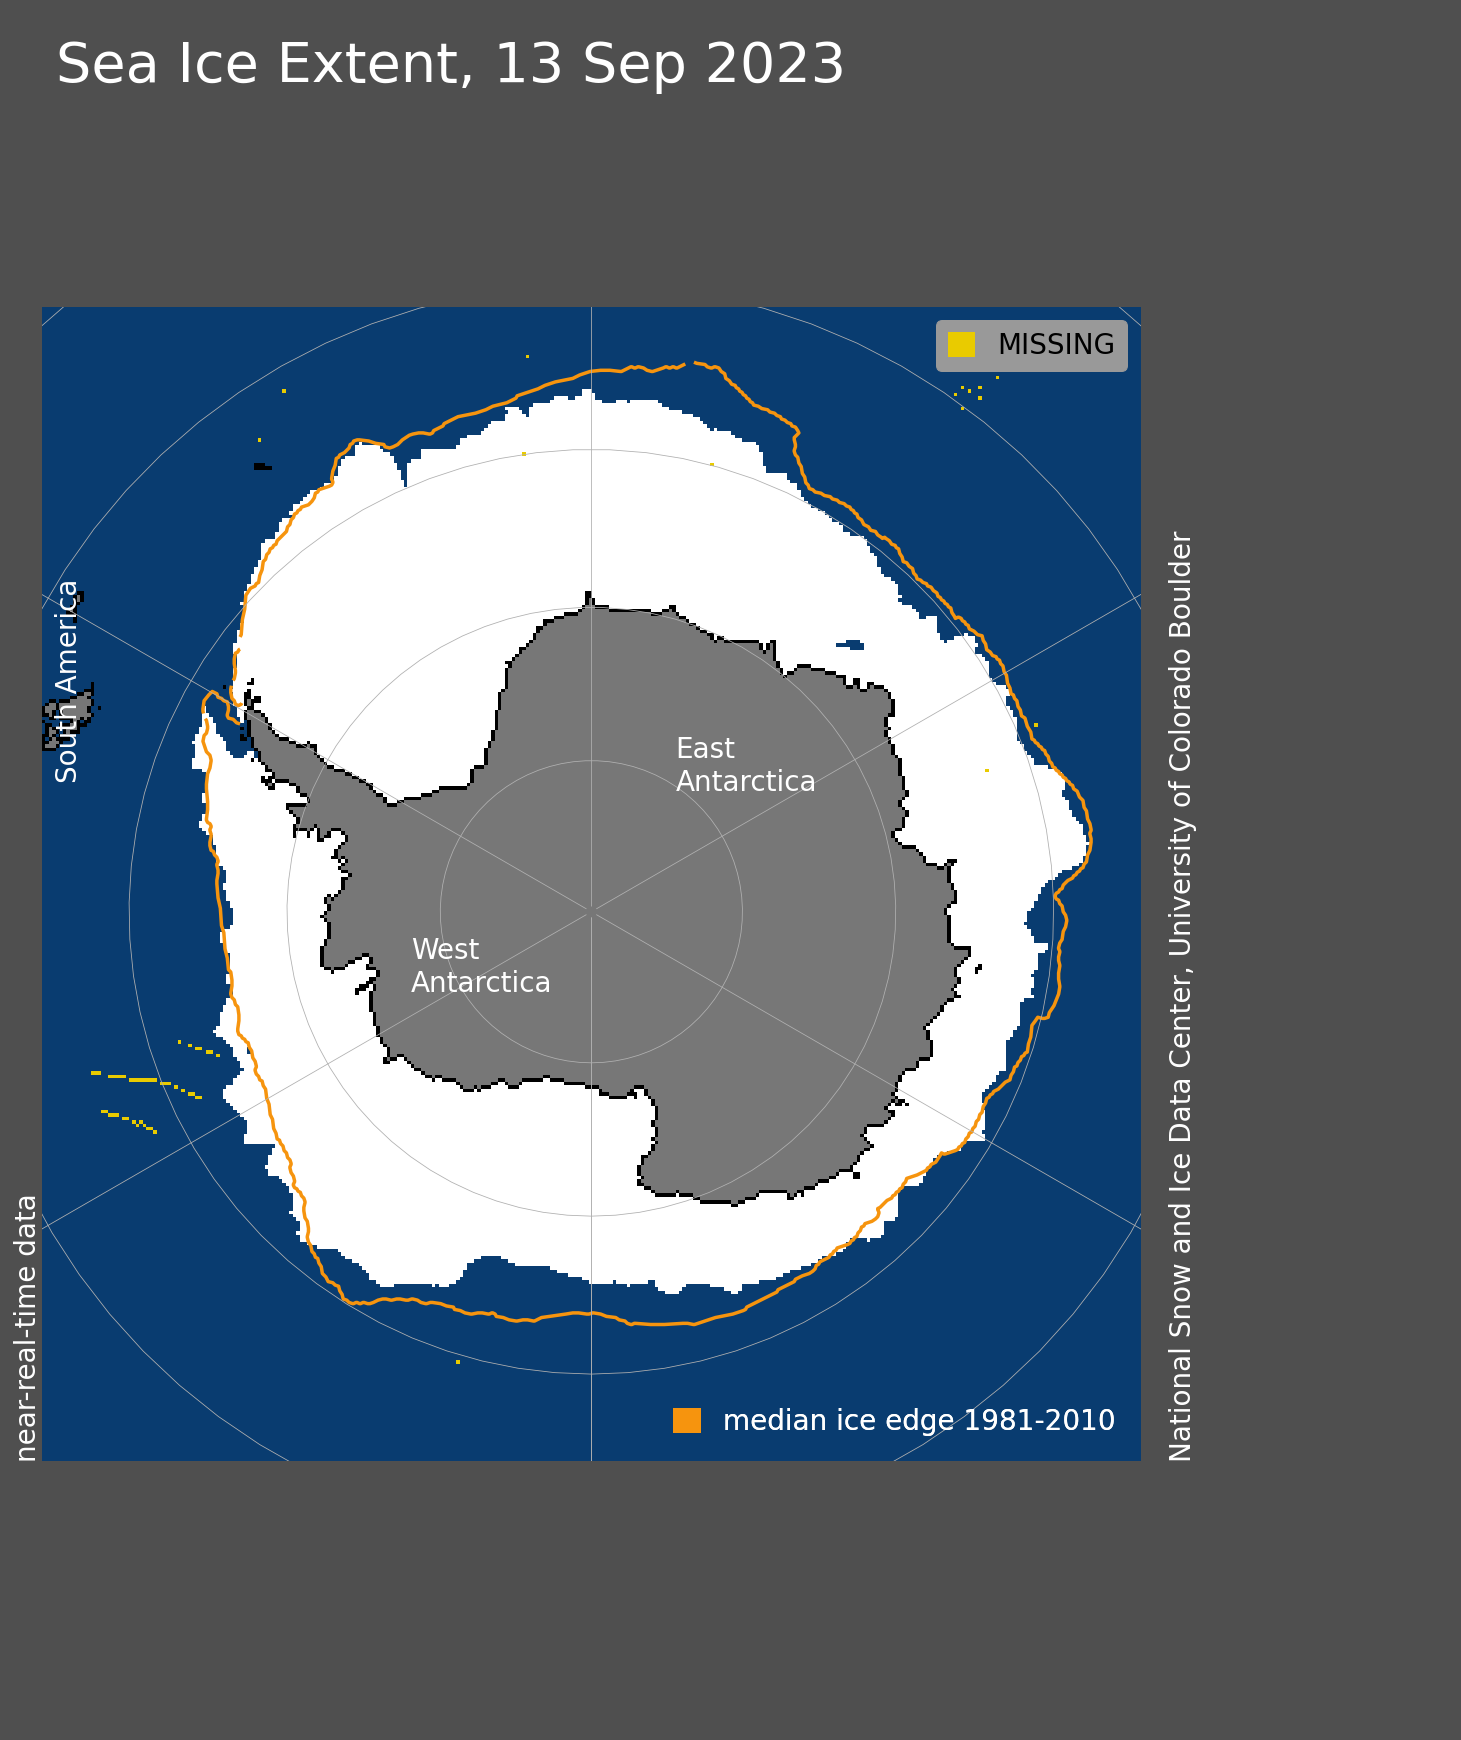
Antarctic growth accelerates

Antarctic sea ice extent as of September 4, 2023 with other years for comparison

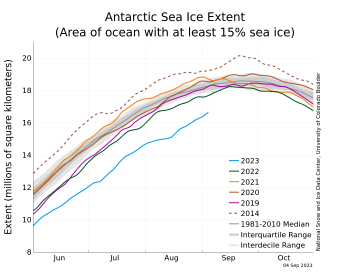
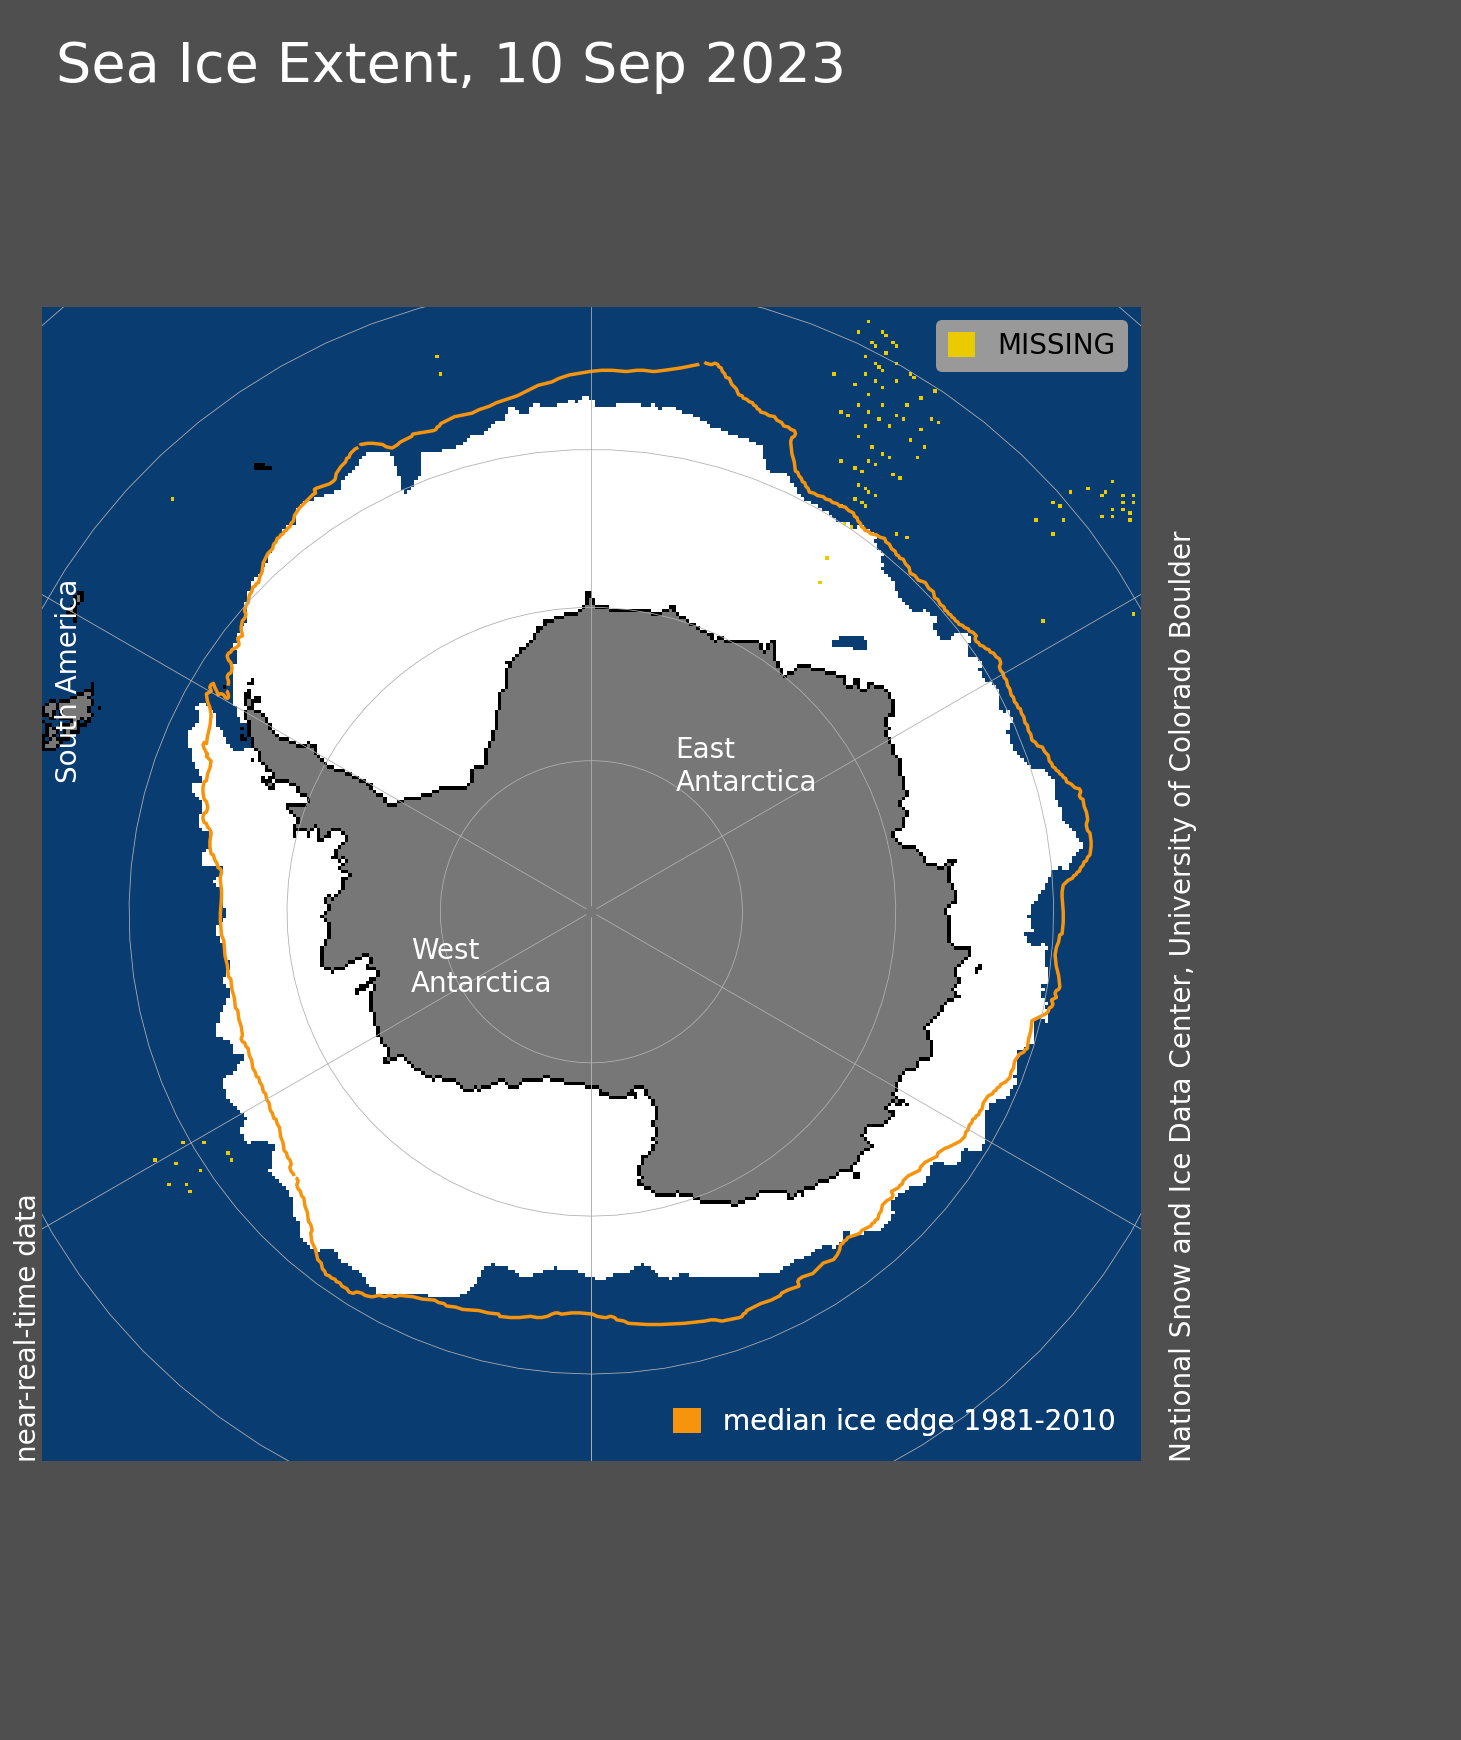
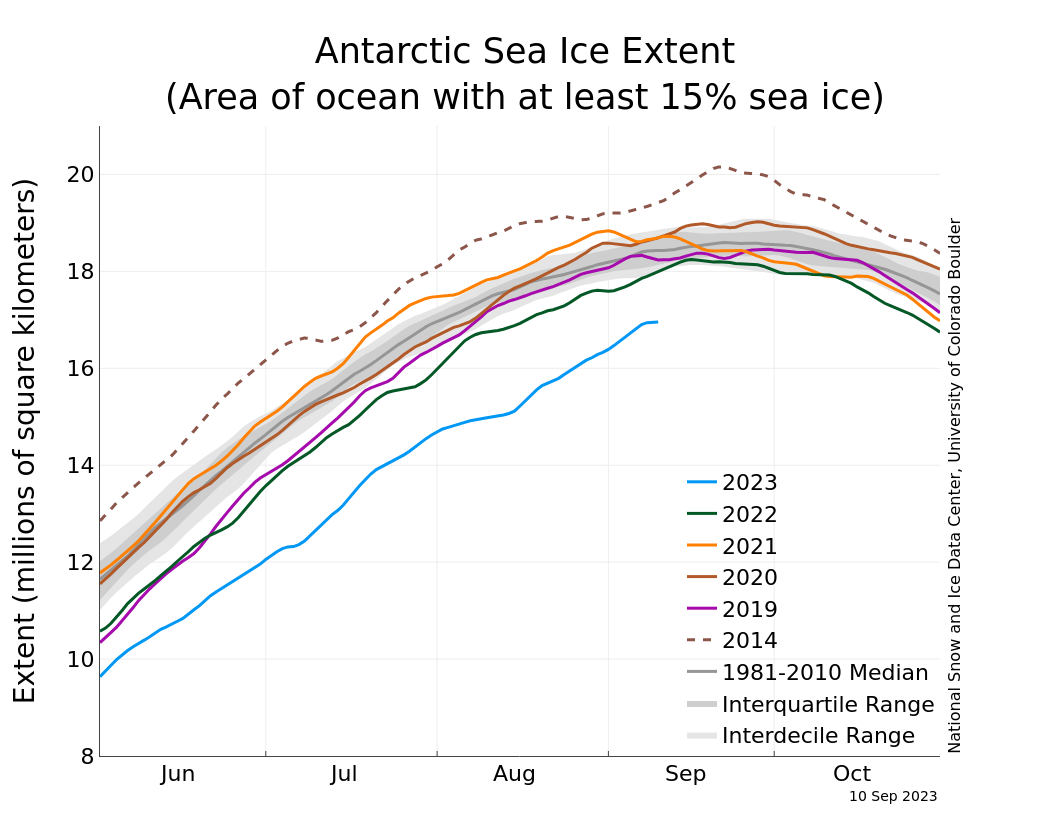
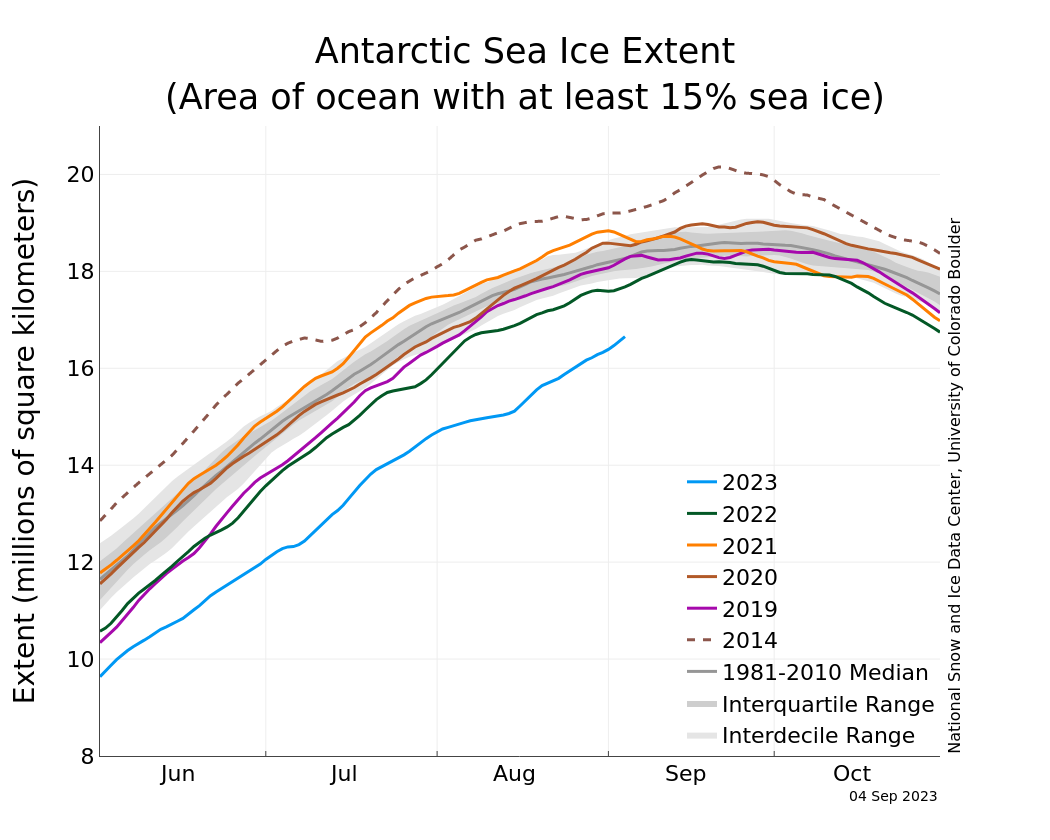
Figure 7. The graph above shows Antarctic sea ice extent as of September 4, 2023, along with daily ice extent data for four previous years and the record high year. 2023 is shown in blue, 2022 in green, 2021 in orange, 2020 in brown, 2019 in magenta, and 2014 in dashed brown. The 1981 to 2010 median is in dark gray. The gray areas around the median line show the interquartile and interdecile ranges of the data. Sea Ice Index data.

Credit: National Snow and Ice Data Center
High-resolution image

After a brief period of slow growth during the first half of August, ice growth quickened in the Southern Hemisphere. While the total Antarctic sea ice extent is still tracking at record low levels, the ice extent has increased more than average in the Bellingshausen and Amundsen Seas as well as in the Pacific Ocean. Elsewhere the ice edge remains further poleward than average.


References

Flores, H., G. Veyssière, G. Castellani, et al. 2023. Sea-ice decline could keep zooplankton deeper for longerNature Climate Change, doi:10.1038/s41558-023-01779-1

Howell, S. E. L., D. G. Babb, J. C. Landy, and M. Brady. 2022. Multi-year sea ice conditions in the Northwest Passage: 1968-2020. Atmosphere-Ocean, 1, 15, doi:10.1080/07055900.2022.2136061

Howell, S. E. L., D. G. Babb, J. C. Landy, G. W. K. Moore, B. Montpetit, and M. Brady. 2023. A comparison of Arctic Ocean sea ice export between Nares Strait and the Canadian Arctic Archipelago. Journal of Geophysical Research: Oceans, 128, e2023JC019687, doi:10.1029/2023JC019687

Watkins, D. M., A. C. Bliss, J. K. Hutchings, and M. M. Wilhelmus. 2023. Evidence of abrupt transitions between sea ice dynamical regimes in the East Greenland marginal ice zone. Geophysical Research Letters, 50, e2023GL103558, doi:10.1029/2023GL103558