After declining at a near-average pace for much of the summer, Arctic sea ice loss accelerated during early August. Antarctic sea extent continues to increase but at an unusually slow pace, exacerbating the record low extent levels seen throughout the austral autumn and winter.
Overview of conditions
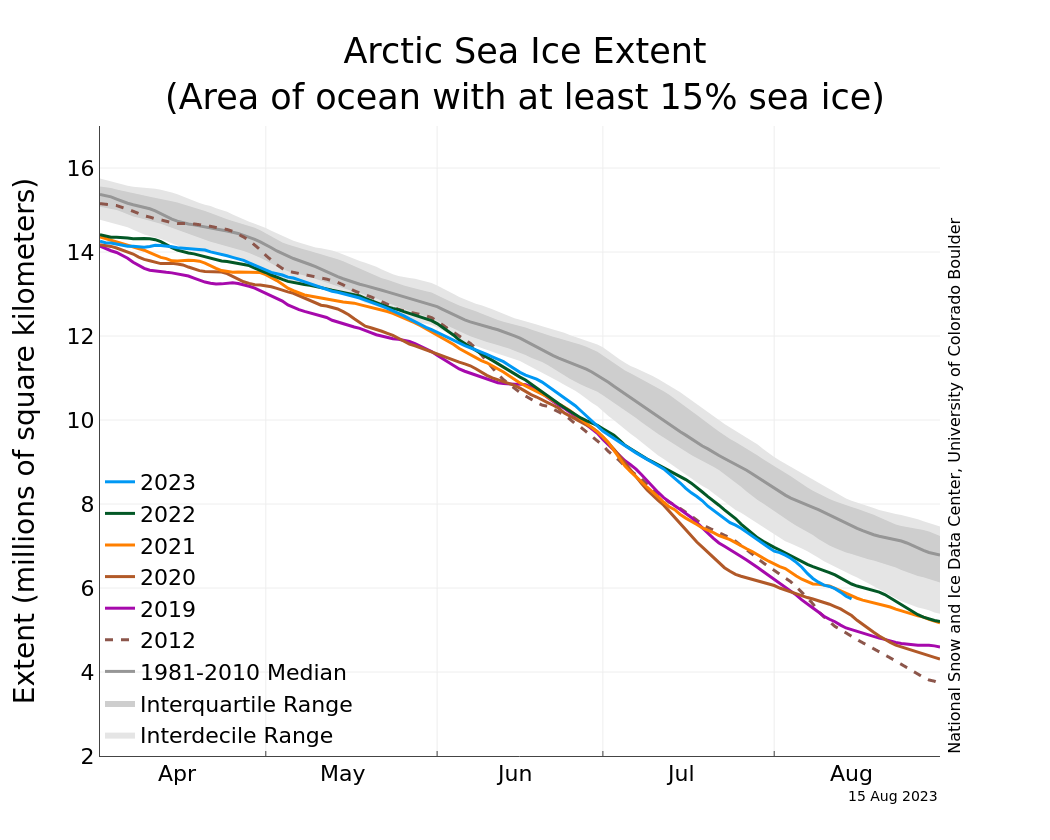
Figure 1a. The graph above shows Arctic sea ice extent as of August 15, 2023, along with daily ice extent data for four previous years and the record low year. 2023 is shown in blue, 2022 in green, 2021 in orange, 2020 in brown, 2019 in magenta, and 2012 in dashed brown. The 1981 to 2010 median is in dark gray. The gray areas around the median line show the interquartile and interdecile ranges of the data. Sea Ice Index data.
Credit: National Snow and Ice Data Center
High-resolution image
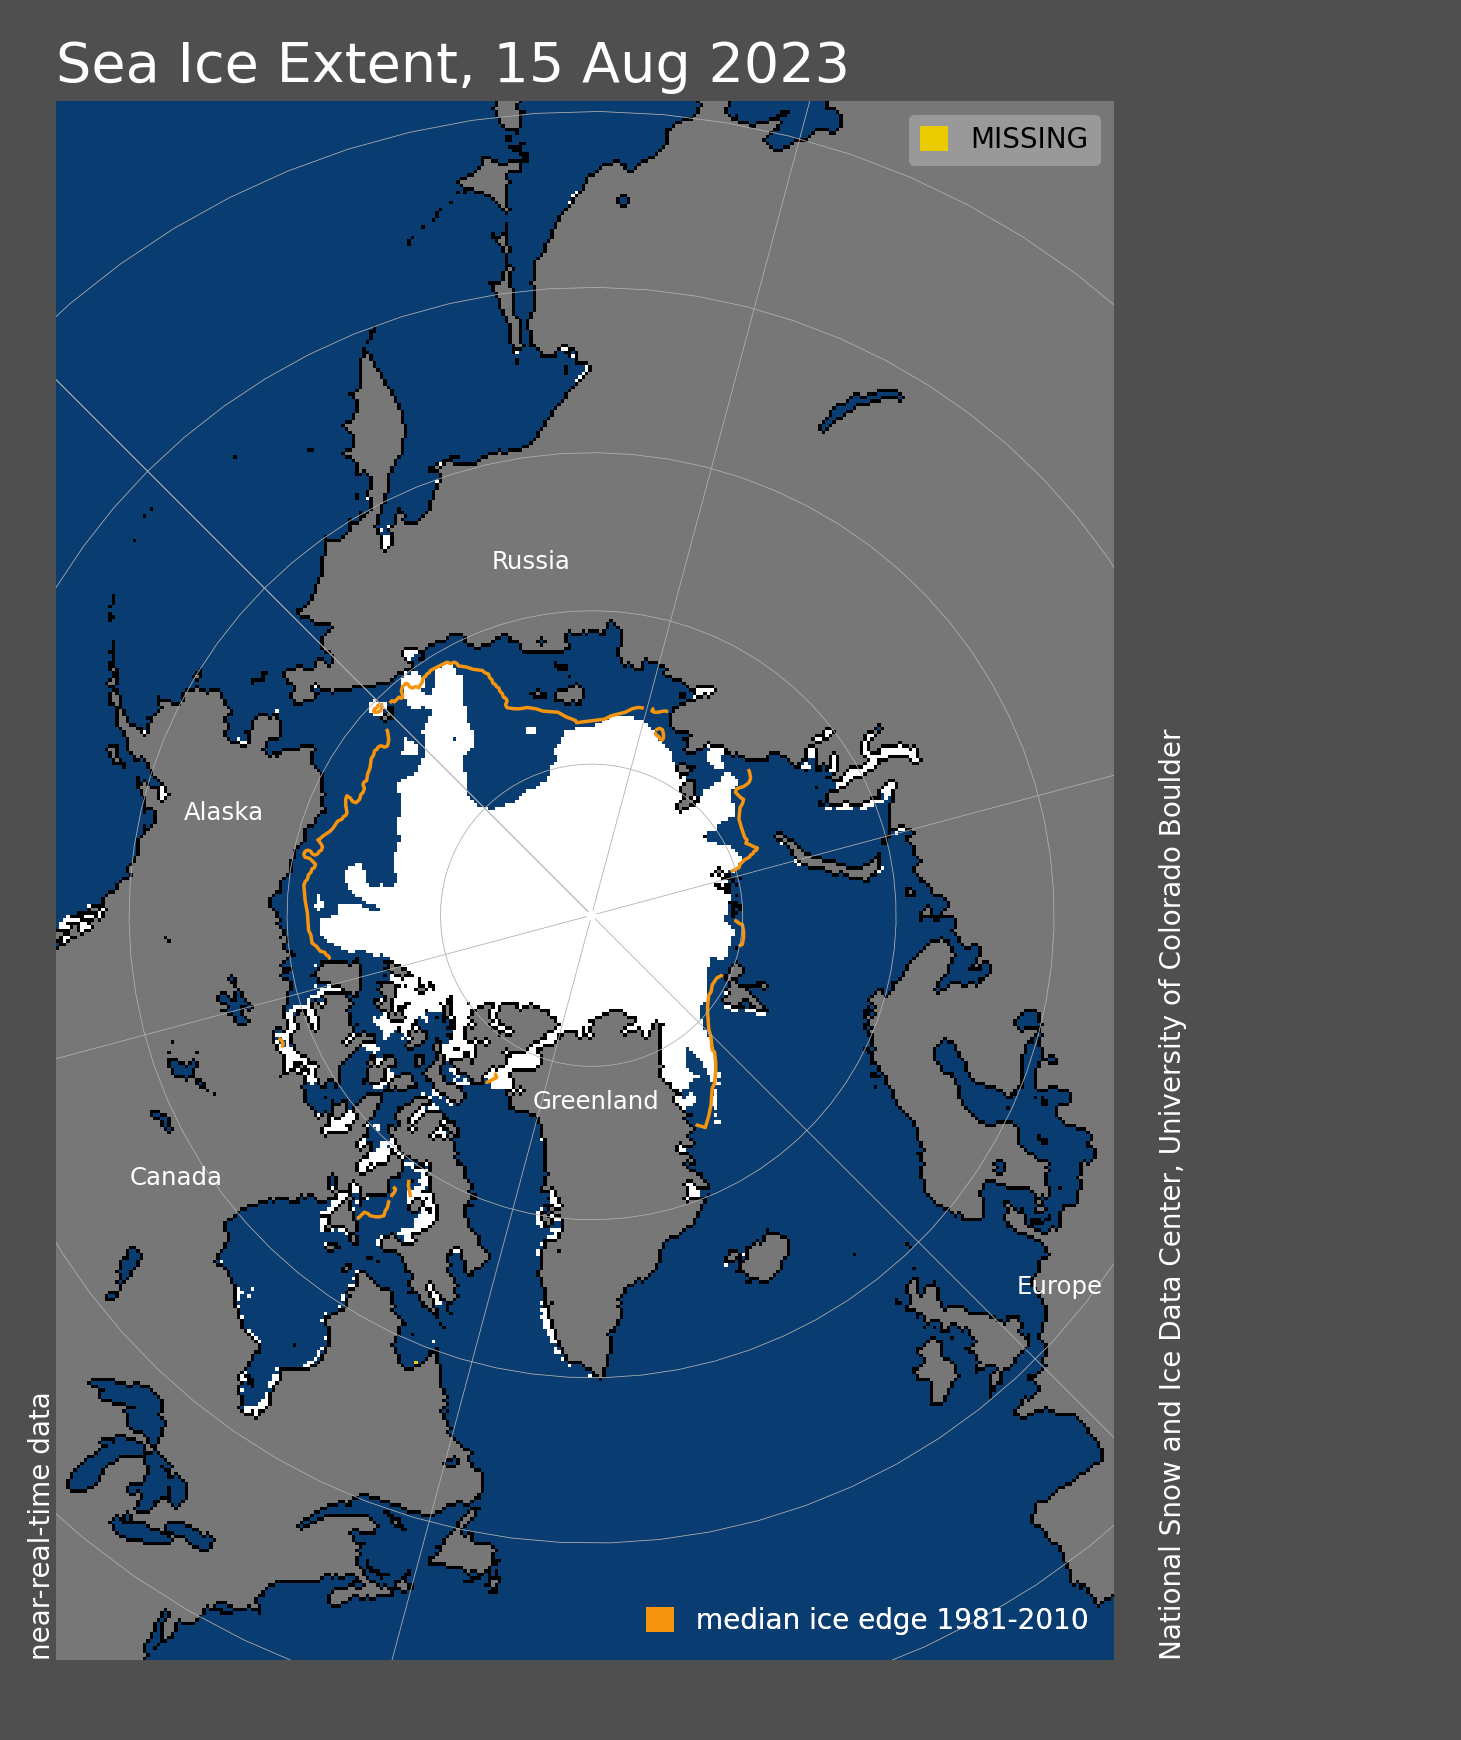
Figure 1b. Arctic sea ice extent for August 15, 2023, was 5.74 million square kilometers (2.22 million square miles). The orange line shows the 1981 to 2010 average extent for that day. Sea Ice Index data. About the data
Credit: National Snow and Ice Data Center
High-resolution image
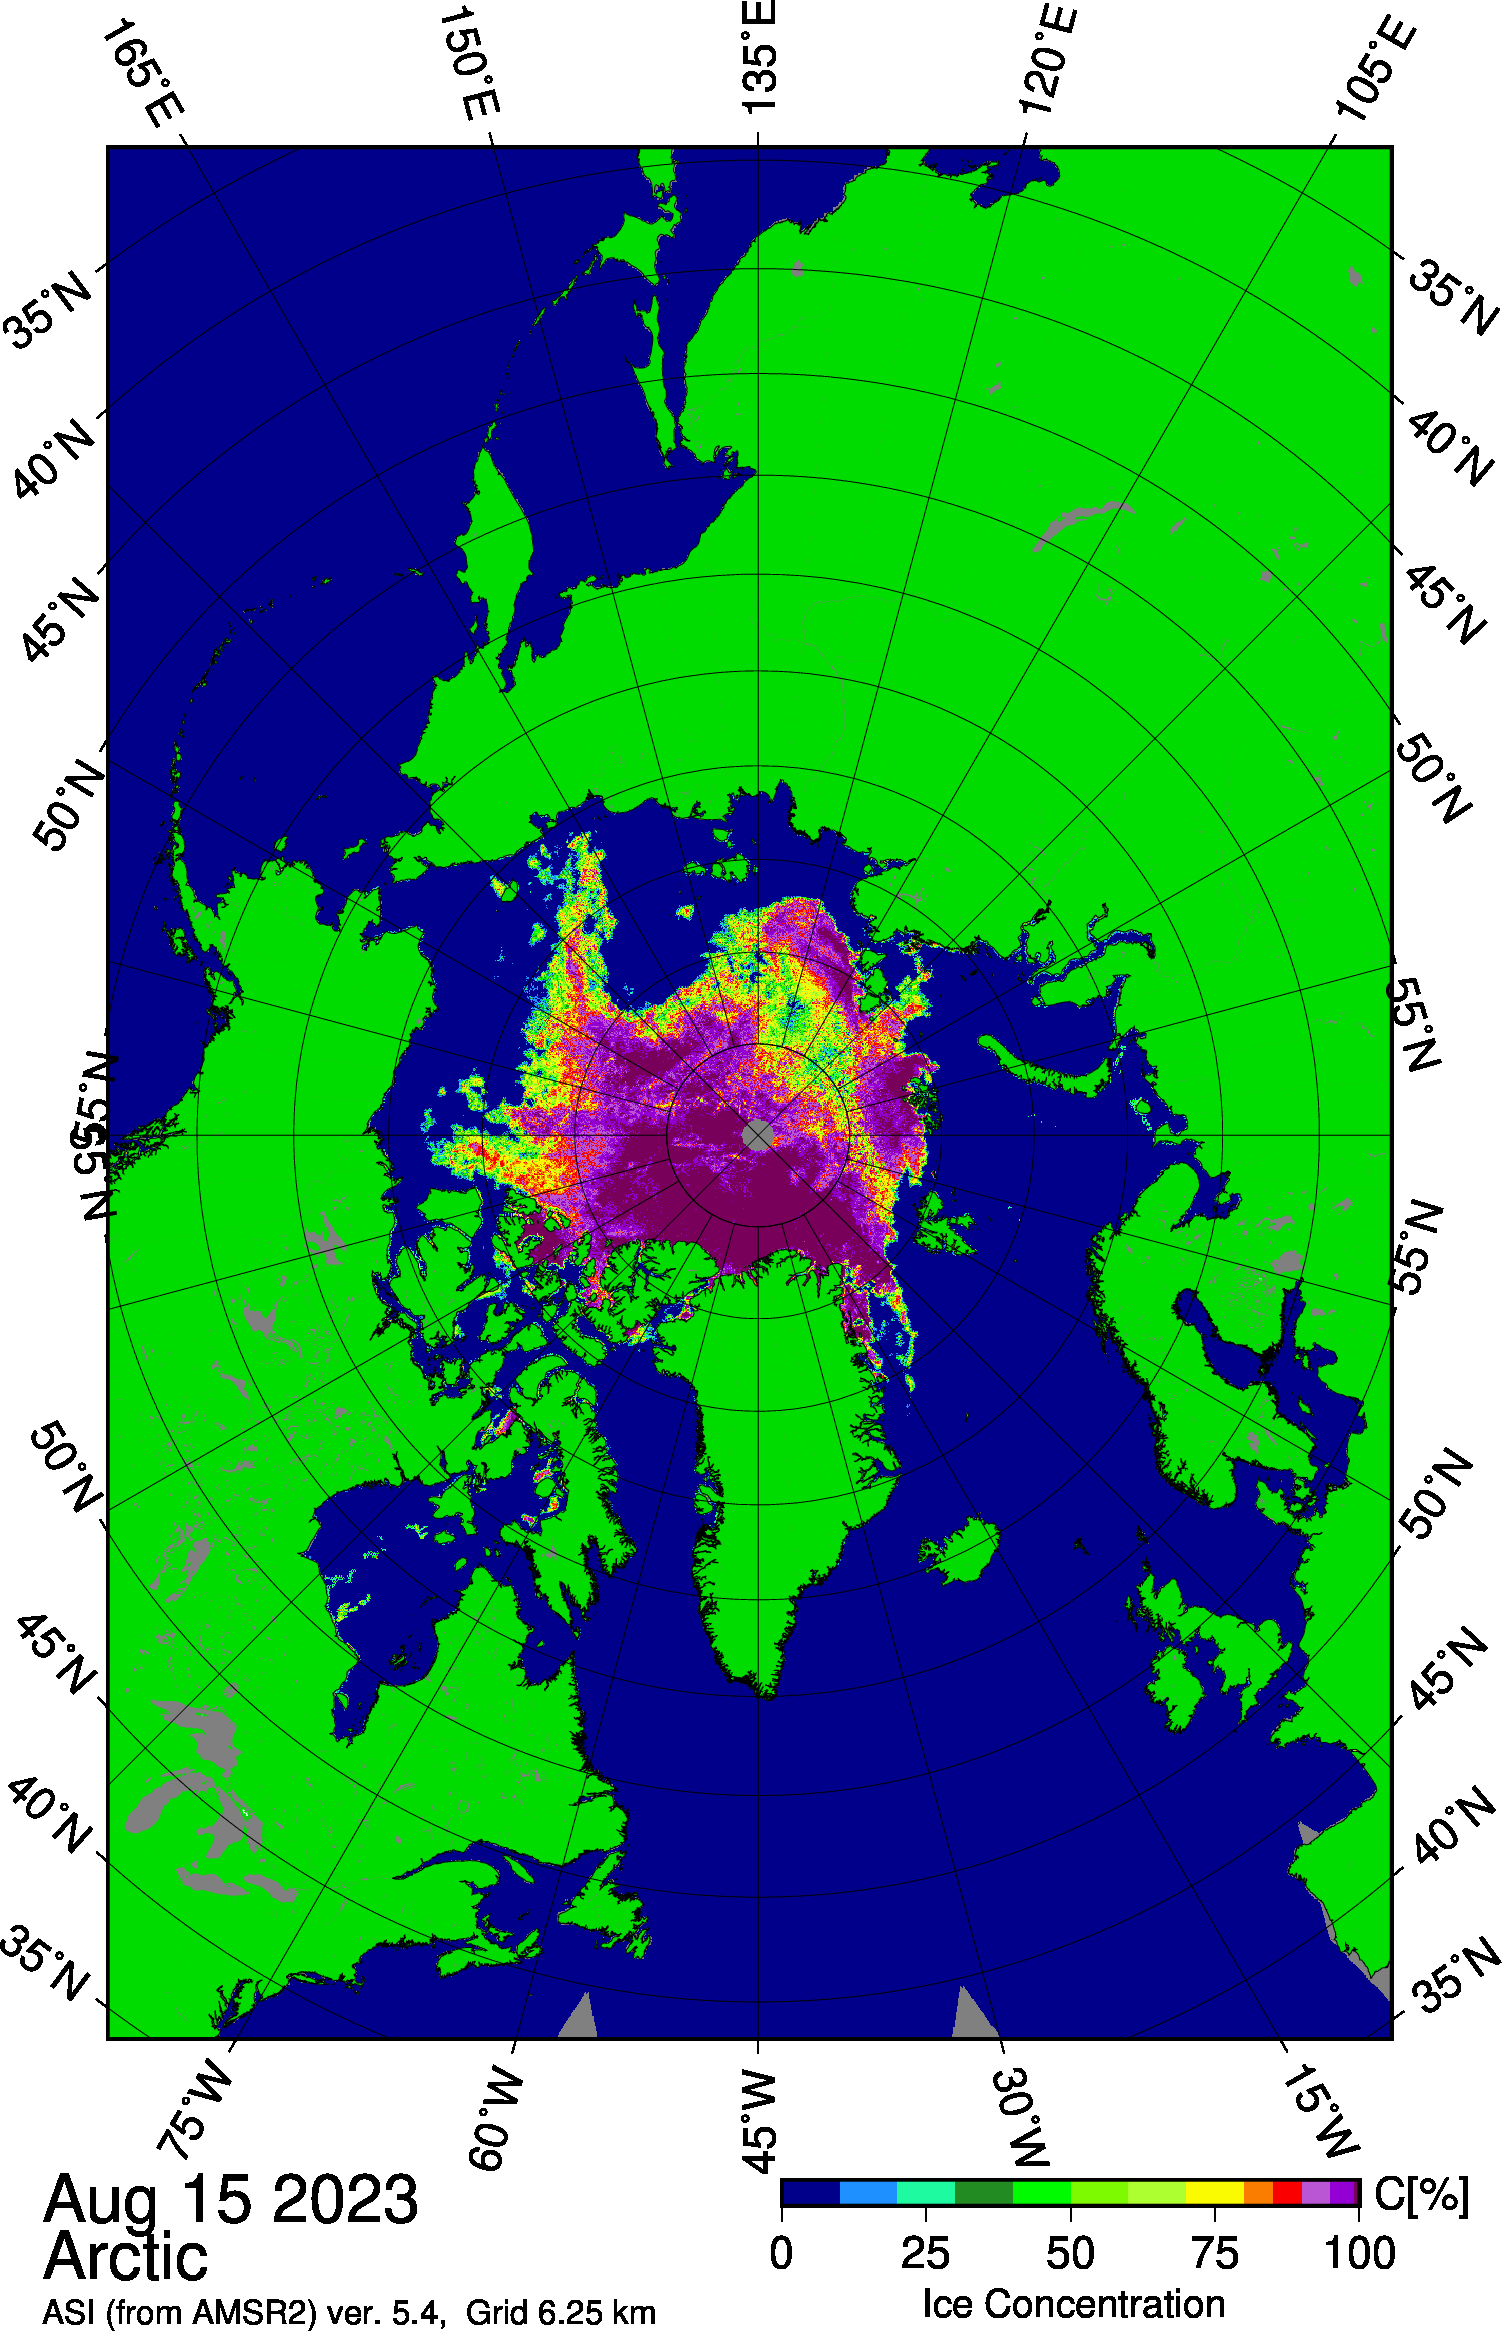
Figure 1c. This map shows a swath of low concentration within the sea ice extent north of the Laptev Sea on August 15, 2023. Sea ice concentration data are from Advanced Microwave Scanning Radiometer 2 (AMSR2) imagery.
Credit: University of Bremen
High-resolution image
The decline in Arctic sea ice extent through the first half of August was faster than average (Figure 1a). Over the period August 1 to 15, 2023, extent decreased at a rate of 81,000 square kilometers (31,000 square miles) per day, compared to the 1981 to 2010 average of 69,000 square kilometers (27,000 square miles) per day. As of August 15, extent stood at 5.74 million square kilometers (2.22 million square miles) (Figure 1b), 1.56 million square kilometers (600,000 square miles) below the 1981 to 2010 average for that date. The mid-August extent is the ninth lowest in the 45-year satellite record.
At mid-month, extent remains near average on the Atlantic side of the Arctic, but elsewhere is well below average other than a tongue of ice extending toward the coast in the East Siberian Sea just west of Wrangel Island. There is also a small area of ice extending near the shore along the western part of the Northern Sea Route near Severnaya Zemlya in the Kara Sea. Both of these regions of ice may melt out within the next couple of weeks.
The Northwest Passage appears to be on the verge of becoming nearly ice free, particularly the southern route, known as Amundsen’s route. The northern route through the relatively wide Parry Channel, is still blocked by ice, but at relatively low concentration.
Elsewhere, a swath of low concentration extended into the ice pack north of the Laptev Sea (Figure 1c). This may represent a response to a low-pressure system that moved into the region on August 14. While not particularly strong (994 millibar), such storms tend to cause divergent flow in the sea ice pack and increase wave action that break up the ice.
Conditions in context
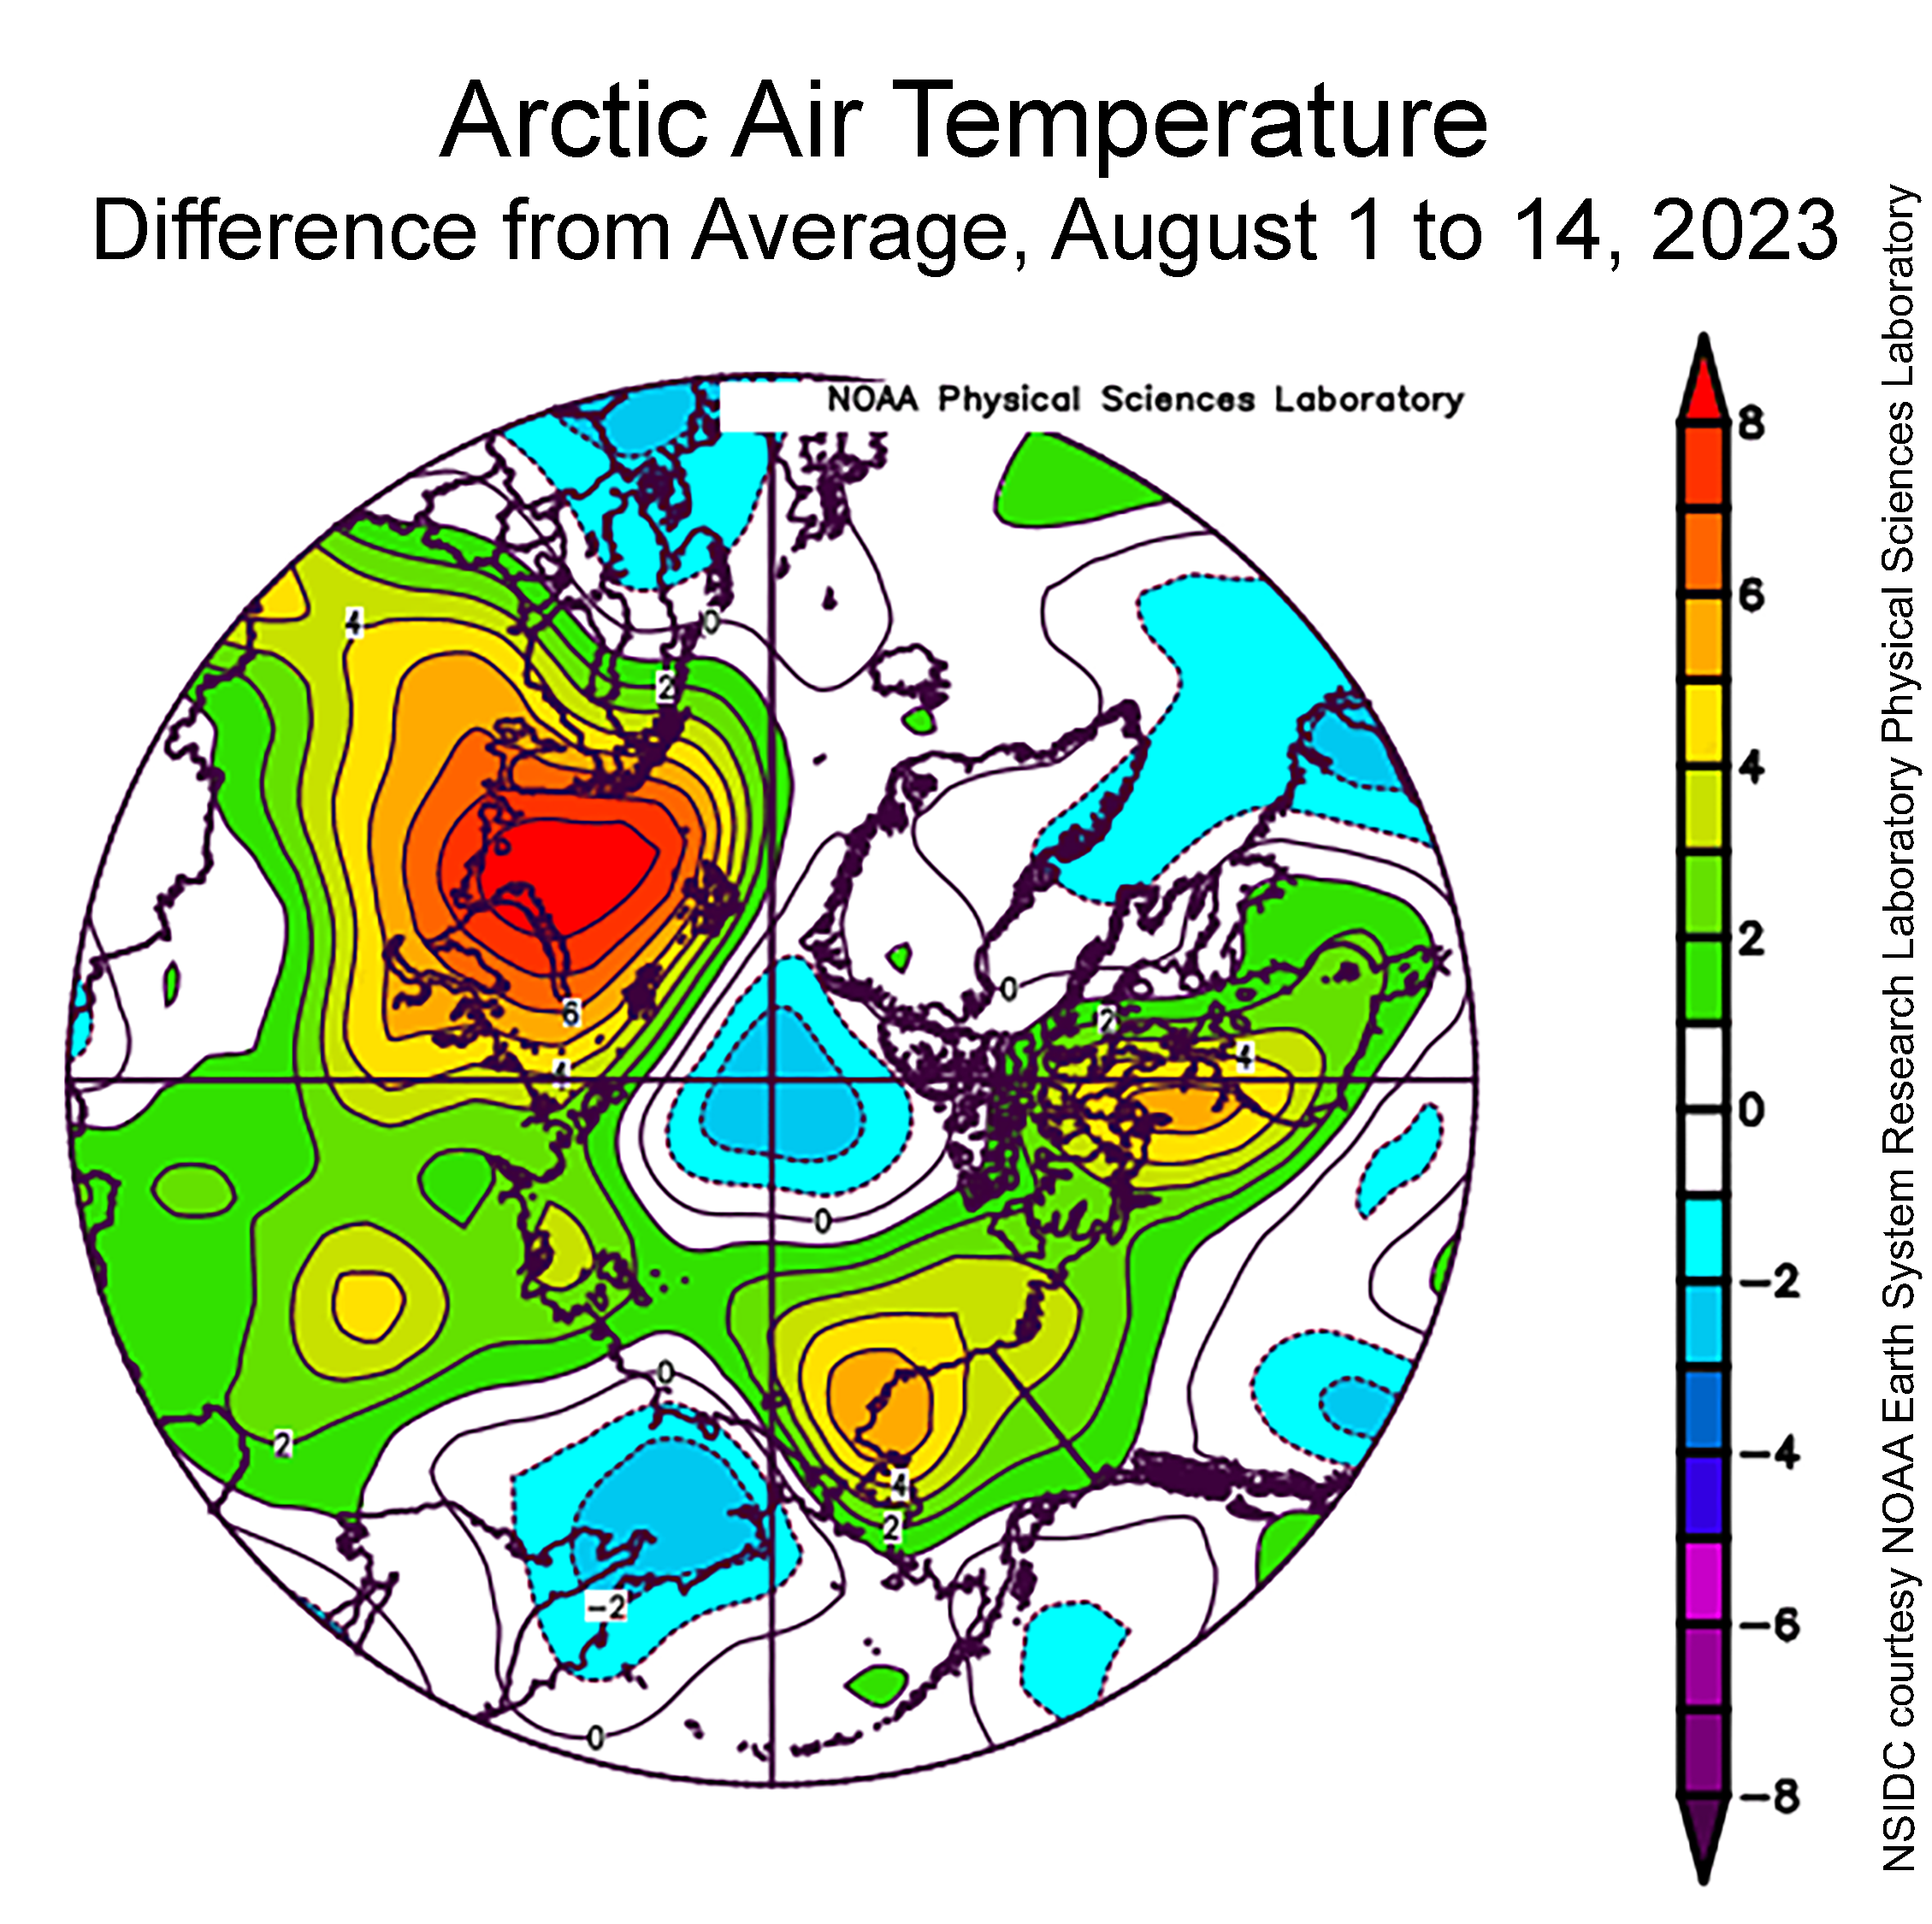
Figure 2a. This plot shows the departure from average air temperature in the Arctic at the 925 hPa level, in degrees Celsius, from August 1 to 14, 2023. Yellows and reds indicate higher than average temperatures; blues and purples indicate lower than average temperatures.
Credit: NSIDC courtesy NOAA Earth System Research Laboratory Physical Sciences Laboratory
High-resolution image
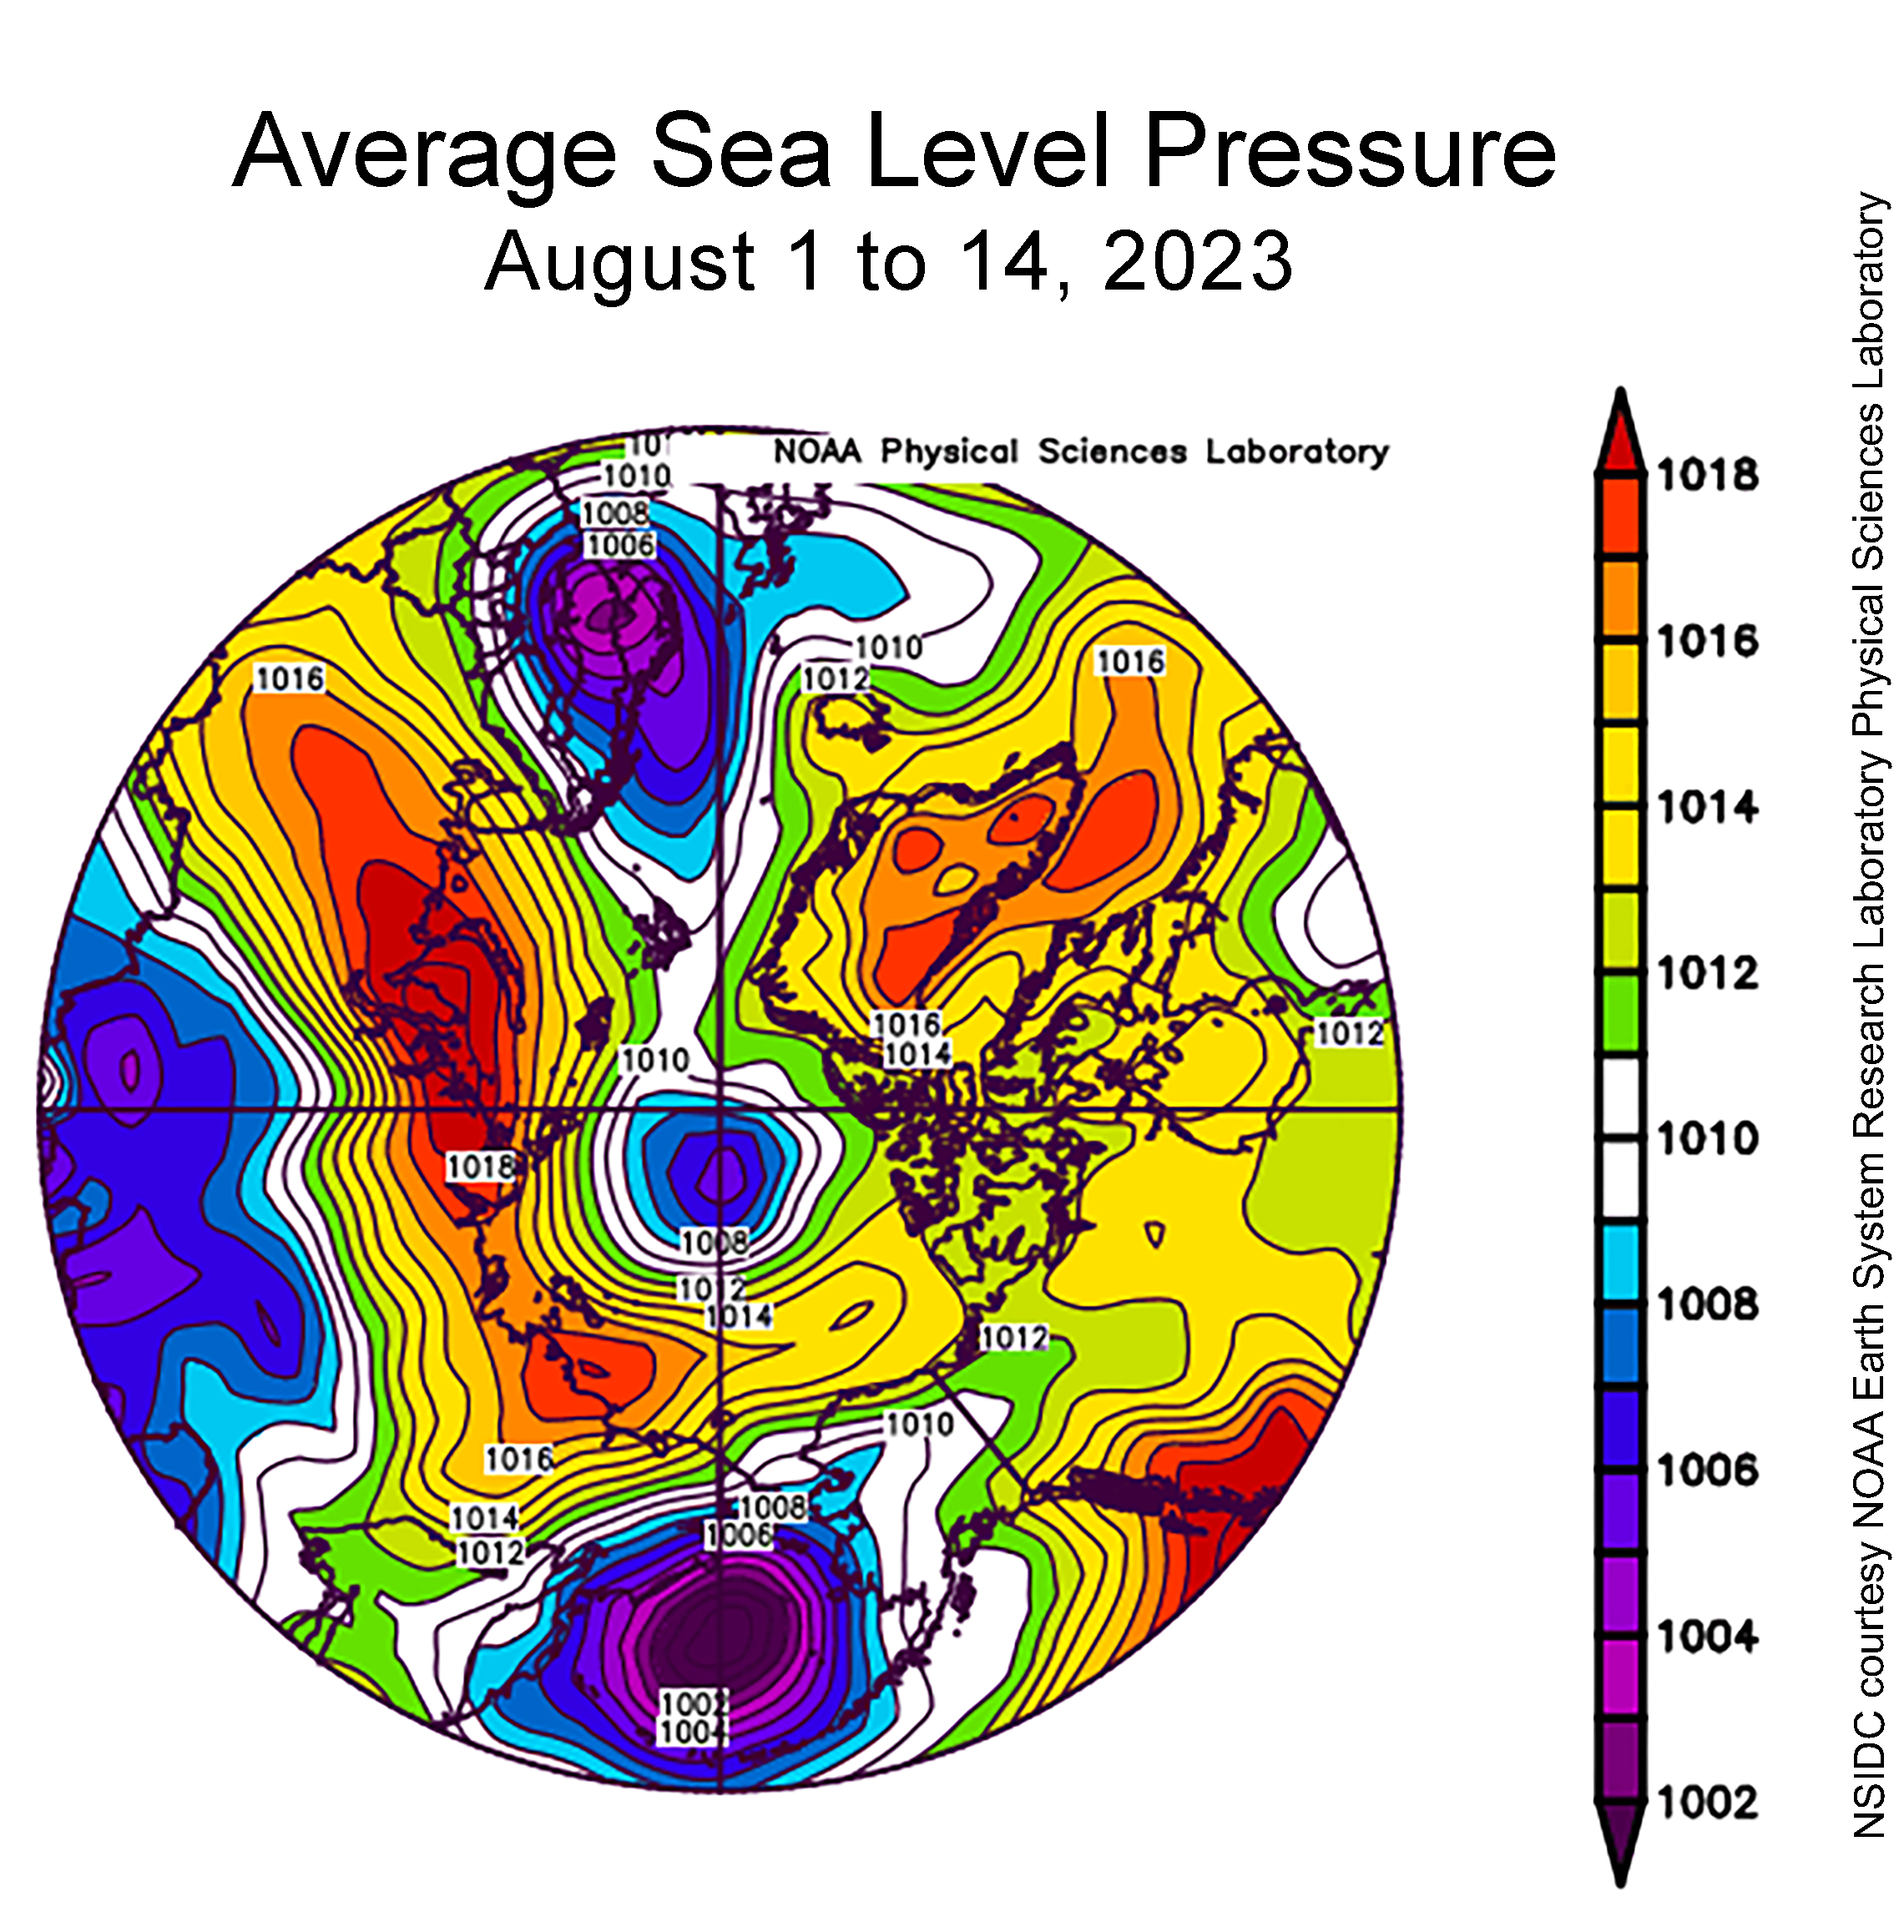
Figure 2b. This plot shows average sea level pressure in the Arctic in millibars from August 1 to 14, 2023. Yellows and reds indicate high air pressure; blues and purples indicate low pressure.
Credit: NSIDC courtesy NOAA Earth System Research Laboratory Physical Sciences Laboratory
High-resolution image
Through the first half of August, air temperatures conditions at the 925 millibar level (about 2,500 feet above the surface) varied widely across the Arctic (Figure 2a). Temperatures prevailed at 1 to 3 degrees Celsius (2 to 5 degrees Fahrenheit) below average over the Pole and north of Greenland, while temperatures were above average over most of the rest of the Arctic Ocean. Conditions over the Barents Sea were unusually warm during the first two weeks of August, with temperatures up to 8 degrees Celsius (14 degrees Fahrenheit) above average. The Beaufort and Chukchi Sea regions saw temperatures 1 to 6 degrees Celsius (2 to 11 degrees Fahrenheit) above average.
The sea level pressure pattern during the first half of the month featured low pressure over the pole and high pressure elsewhere (Figure 2b). As noted above, a low-pressure system, a cyclone, did move in the Laptev Sea area on August 14, but the region was still under high pressure as averaged for August 1 to 14.
Extreme ice conditions in the Southern Ocean persist
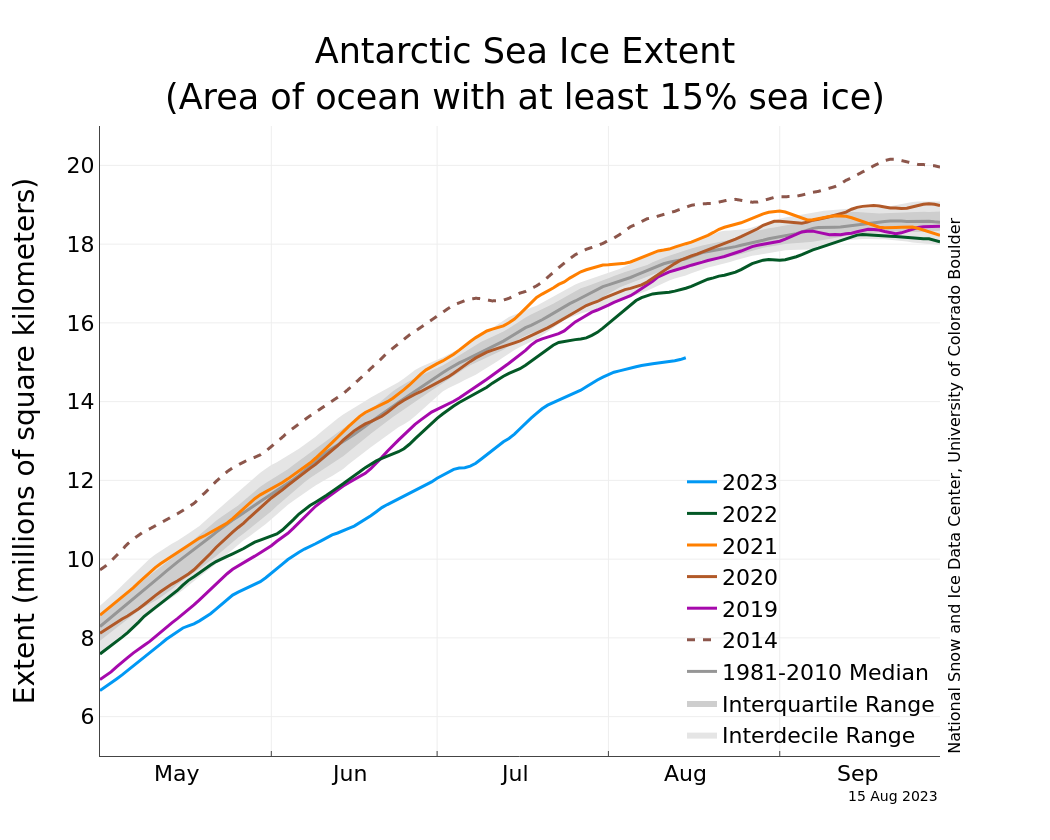
Figure 3a. The graph above shows Antarctic sea ice extent as of August 15, 2023, along with daily ice extent data for four previous years and the record high year. 2023 is shown in blue, 2022 in green, 2021 in orange, 2020 in brown, 2019 in magenta, and 2014 in dashed brown. The 1981 to 2010 median is in dark gray. The gray areas around the median line show the interquartile and interdecile ranges of the data. Sea Ice Index data.
Credit: National Snow and Ice Data Center
High-resolution image
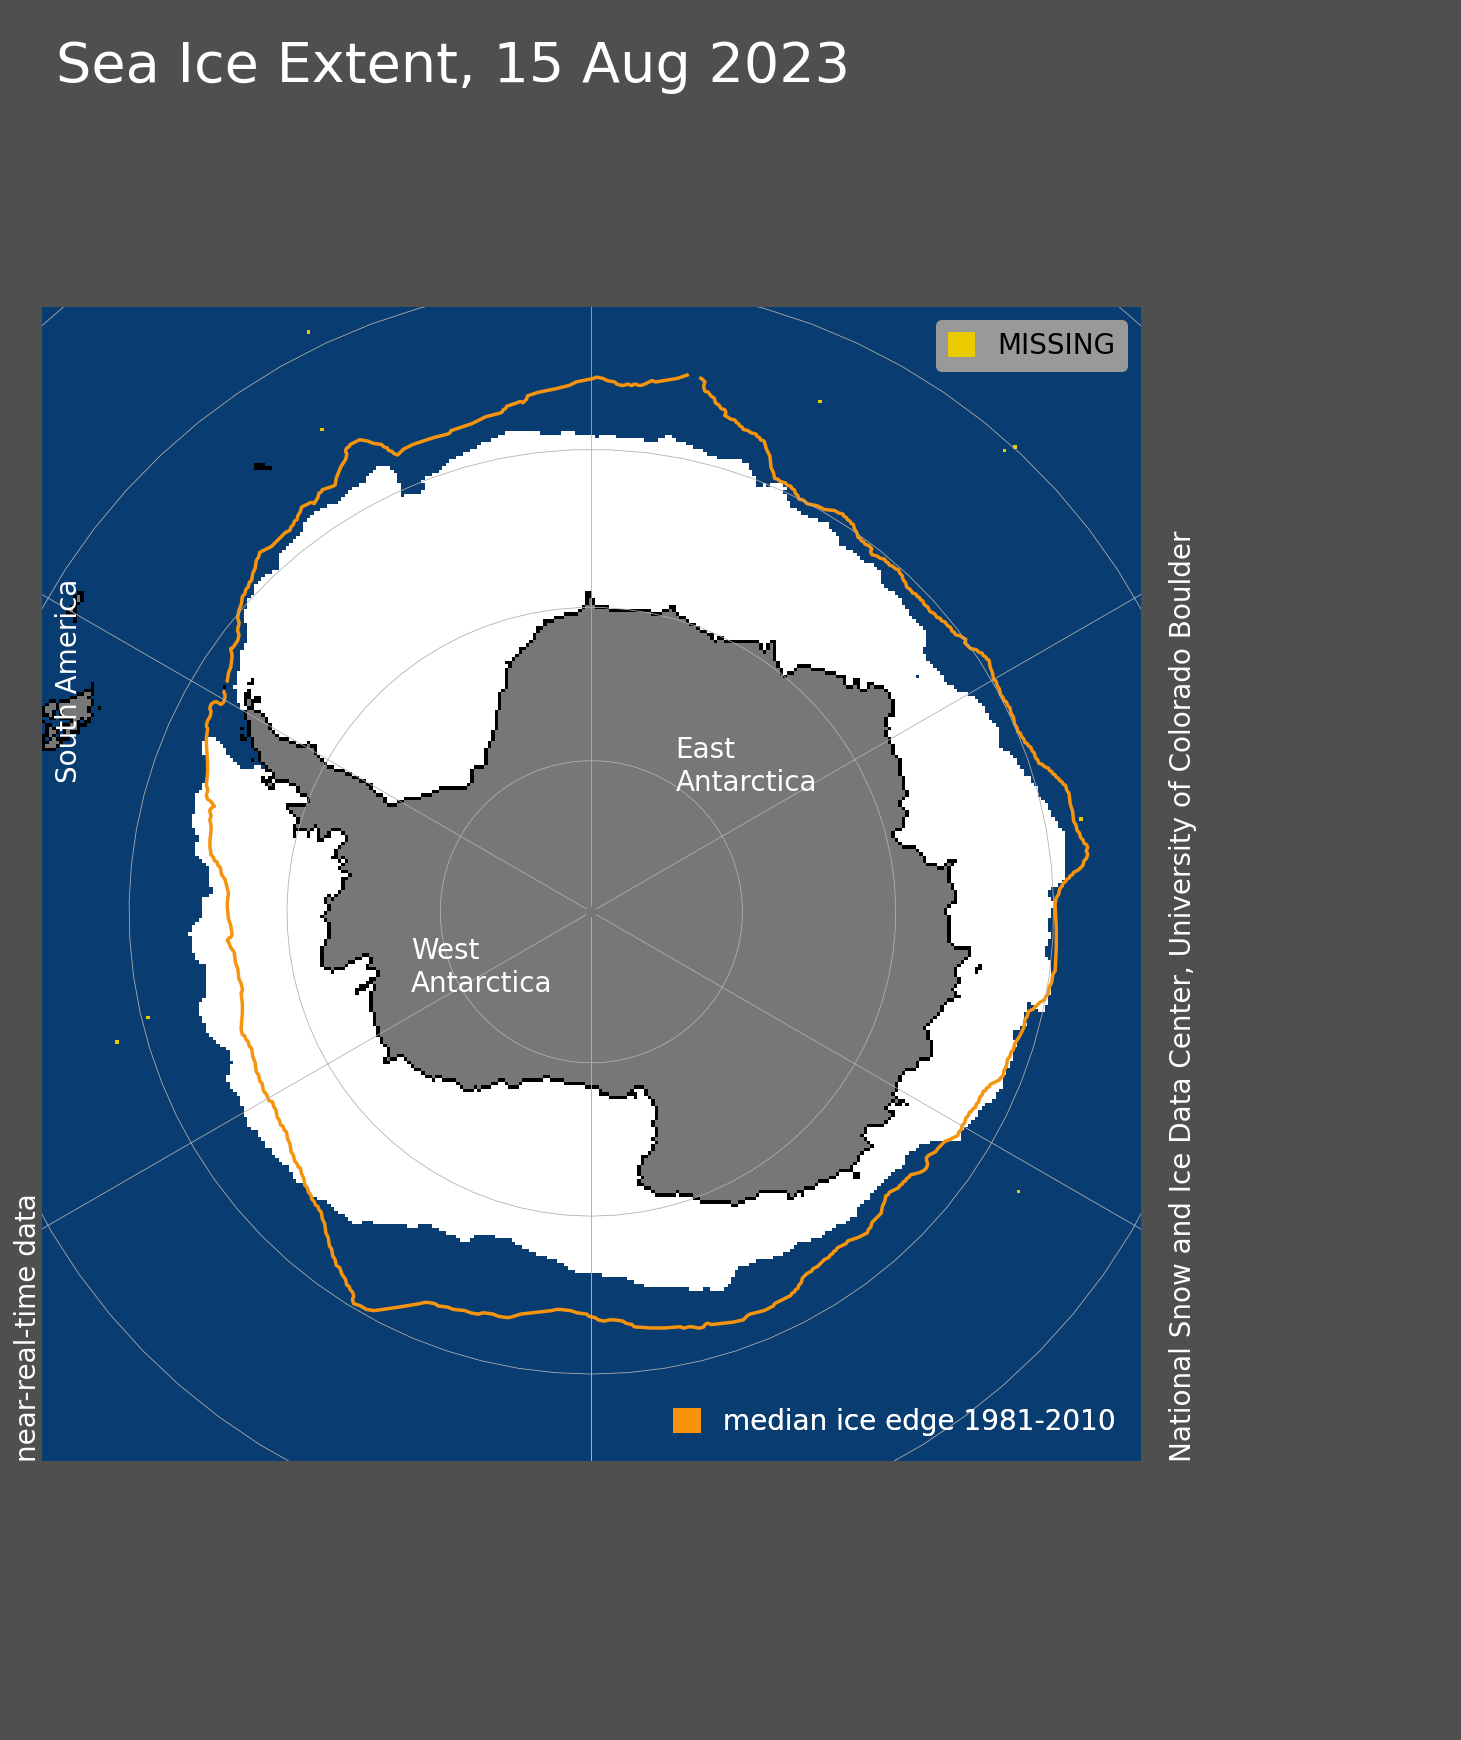
Figure 3b. Antarctic sea ice extent for August 15, 2023 was 15.12 million square kilometers (5.84 million square miles). The orange line shows the 1981 to 2010 average extent for that day. Sea Ice Index data. About the data
Credit: National Snow and Ice Data Center
High-resolution image
Record low levels of Antarctic sea ice extent have persisted and have even become more extreme. Since the beginning of August, the growth in extent has begun to level off (Figure 3a). Highly variable conditions are typical of Antarctic sea ice extent near the seasonal maximum, but the present situation is clearly remarkable. While there will likely be further increases in extent the second half of the month, close attention to the progression of ice growth or retreat is warranted.
On August 15, extent was 15.12 million square kilometers (5.84 million square miles) (Figure 3b), which is 2.54 million square kilometers (980,000 square miles) below the 1981 to 2010 average extent for August 15. Even more remarkable, this year’s extent on August 15 was 1.73 million square kilometers (670,000 square miles) below the previous record low for the date, in 1986. Ice extent is particularly low in the Ross Sea and eastern Weddell Sea sectors, but has recovered somewhat in the Bellingshausen Sea. The Amundsen Sea and western Bellingshausen Sea are now slightly above average.
Melt onset
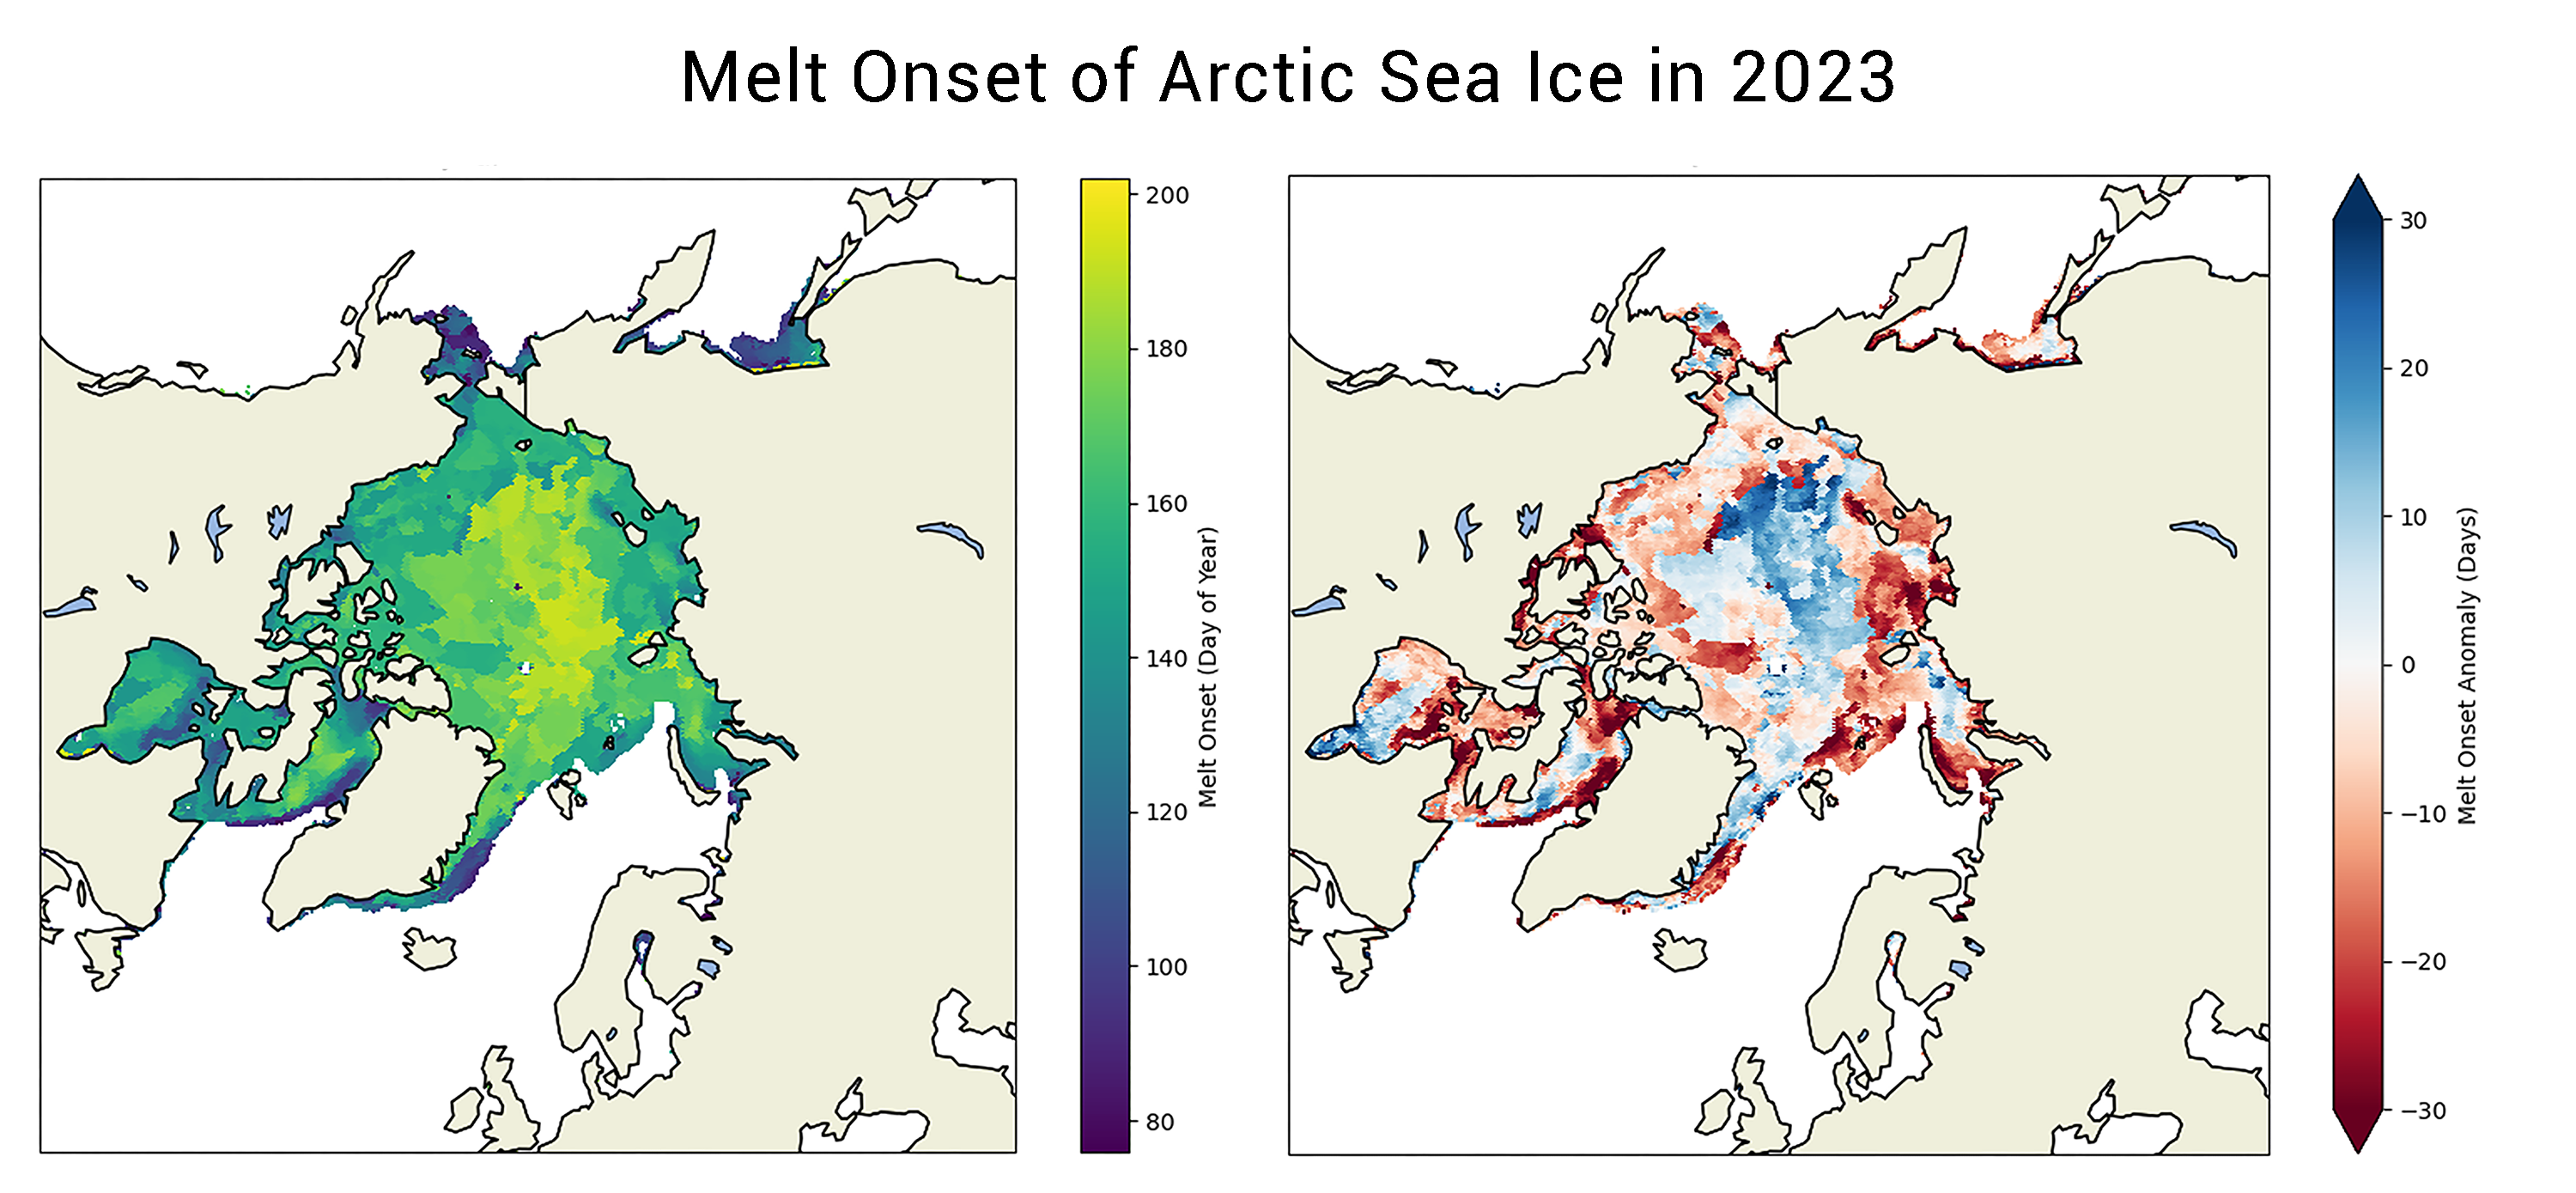
Figure 4. The map on the left shows the melt onset of Arctic Sea Ice for 2023. Different in 2023 melt onset date with the 1981 to 2010 melt date. Red indicates earlier than average melt onset; blue indicates later than average melt onset.
Credit: Data processed by Jeff Miller, NASA Goddard; image by Julienne Stroeve, NSIDC; data based on Markus et al. (2009)
High-resolution image
The onset of surface melt is a potential harbinger of ice conditions later in the melt season. When melt begins, the reflectivity, known as albedo, of the surface decreases, allowing more of the sun’s energy to be absorbed. This means more energy is available to promote further melting the ice and a greater potential for areas of sea ice to melt out completely by the end of summer. Melt onset data are based on the Markus et al. 2009 method, and were provided by Jeff Miller at NASA Goddard. This year, melt started 10 to 20 days earlier than average along the coastal seas around nearly all of the Arctic, while over the central Arctic, melt started 10 to 20 day later than average (Figure 4).
Hudson Bay
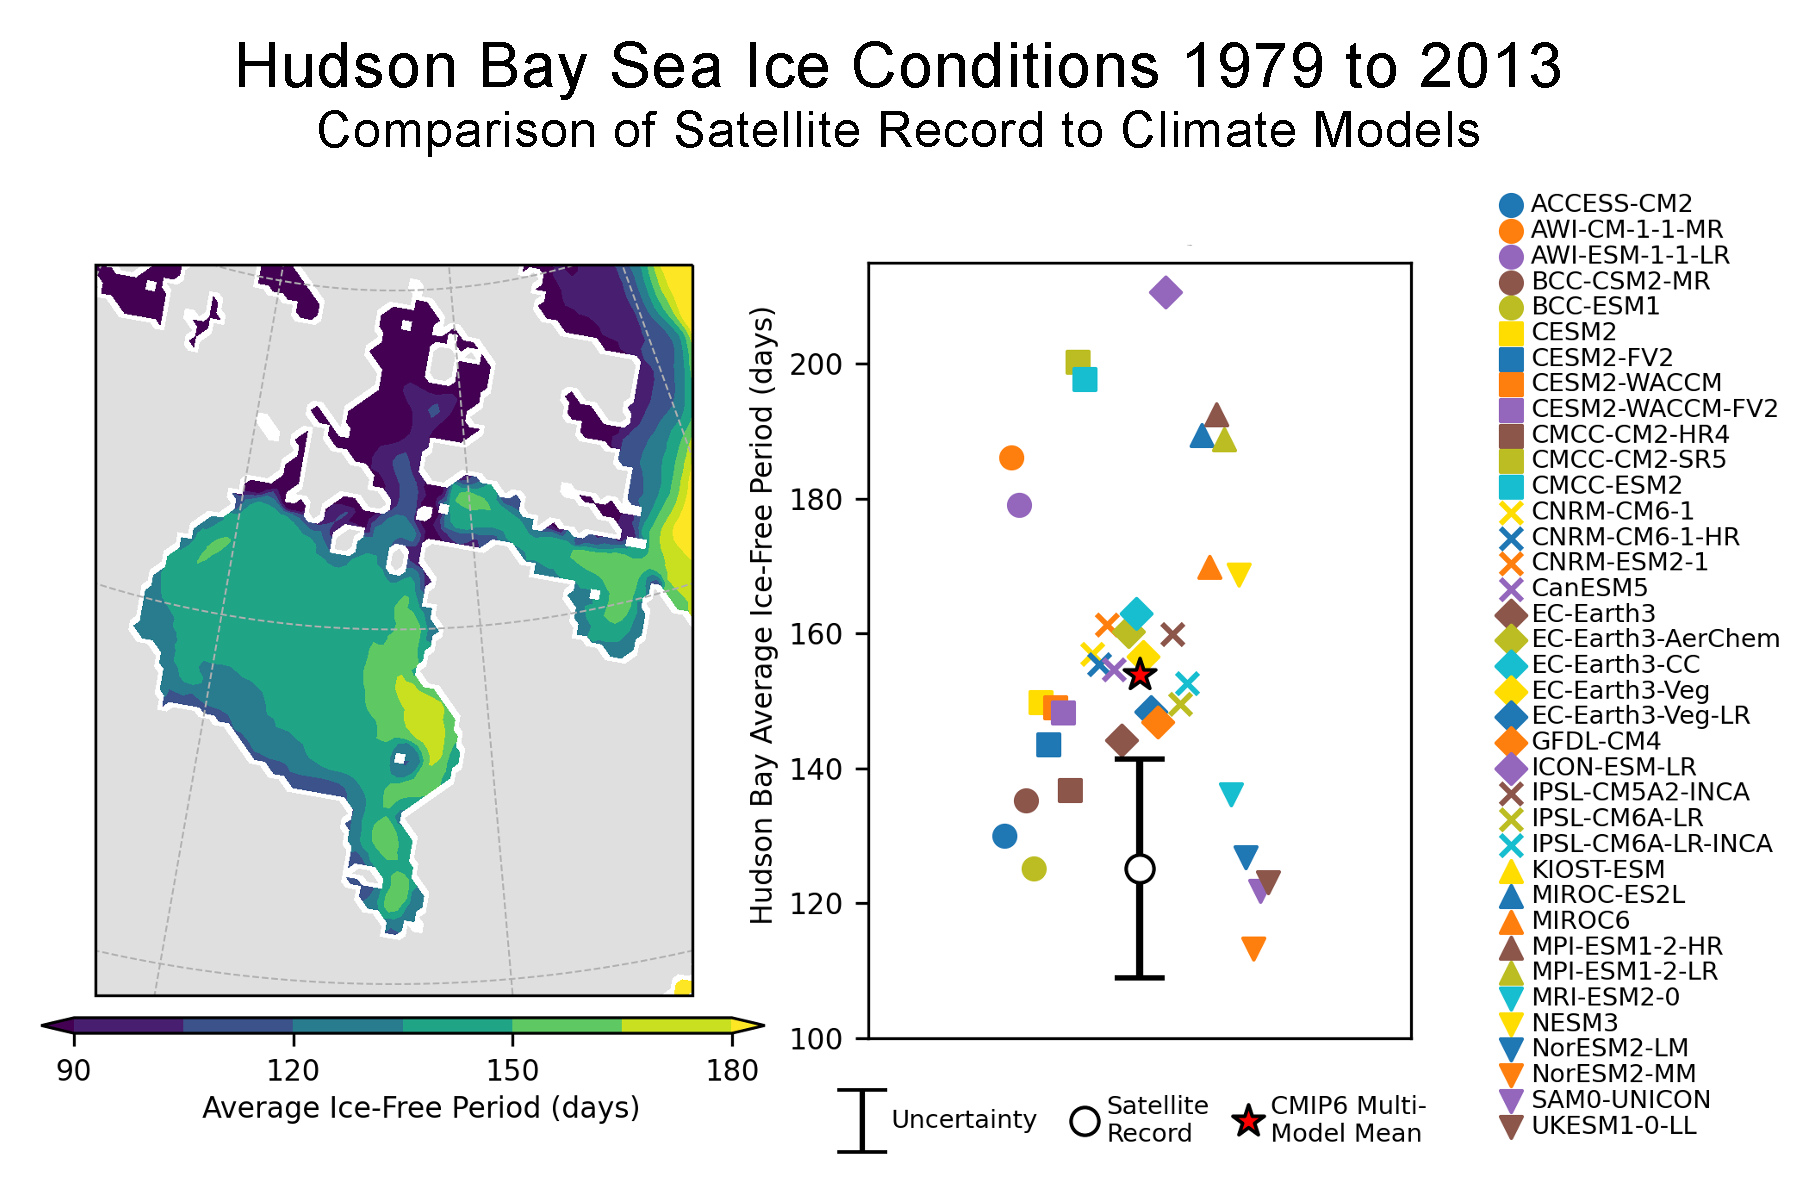
Figure 5. The map of Hudson Bay Complex on the left shows the average ice-free period (sea ice concentration is continuously below 15 percent) from 1979 to 2013 based on the Bootstrap Algorithm applied to passive microwave satellite retrievals. The chart on the right compares the satellite record to 37 historical climate model simulations of the ice-free period averaged for the Hudson Bay Complex (1979 to 2013). Each model is represented by a single ensemble member.
Credit: Alex Crawford, University Manitoba and Crawford, A. D. et al. 2023
High-resolution image
As in many recent years, Hudson Bay melted out earlier than the 1981 to 2010 average date, and there is a trend toward a longer summer ice-free period. There is interest in knowing how long Hudson Bay will be seasonally ice free in the future. A recent study by Alex Crawford and colleagues at the University of Manitoba highlights a common problem in many climate models used to make future projections: The ice-free periods are too long (Figure 5). On average, models simulate sea ice retreating 19 days too early in summer and advancing 9 days too late in autumn, meaning the average model simulates an ice-free period that is about a month longer than is observed by satellite. After accounting for uncertainty in satellite observations, 73 percent (27 of 37) of models significantly overestimate the ice-free period. This performance is the worst for any Arctic sub-region.
The main culprit is how models simulate the atmosphere. Models that overestimate the ice-free period tend to depict overly warm conditions over Hudson Bay, especially in August to October. This warmth links back to winds blowing too often from the south and east. Extra warmth delays autumn freeze up, which leads to thinner ice that melts more readily in summer. Improving the atmospheric components of these models might improve the simulation of Hudson Bay sea ice and provide more confidence in projections of the future.
References
Crawford, A. D., E. Rosenblum, J. V. Lukovich, and J. C. Stroeve. 2023. Sources of Seasonal Sea Ice Bias for CMIP6 Models in the Hudson Bay Complex. Annals of Glaciology, First View, 1-18, doi:10.1017/aog.2023.42.
Markus, T., J. C. Stroeve, and J. Miller. 2009. Recent changes in Arctic sea ice melt onset, freezeup, and melt season length. Journal Geophysical Research, 114, C12024, doi:10.1029/2009JC005436.

