As October drew to a close, freezing progressed rapidly in the Laptev Sea. In the Antarctic, where spring is slowly unfolding, overall ice extent is low, with patterns suggesting a strong persistent low atmospheric pressure in the Amundsen Sea.
Overview of conditions
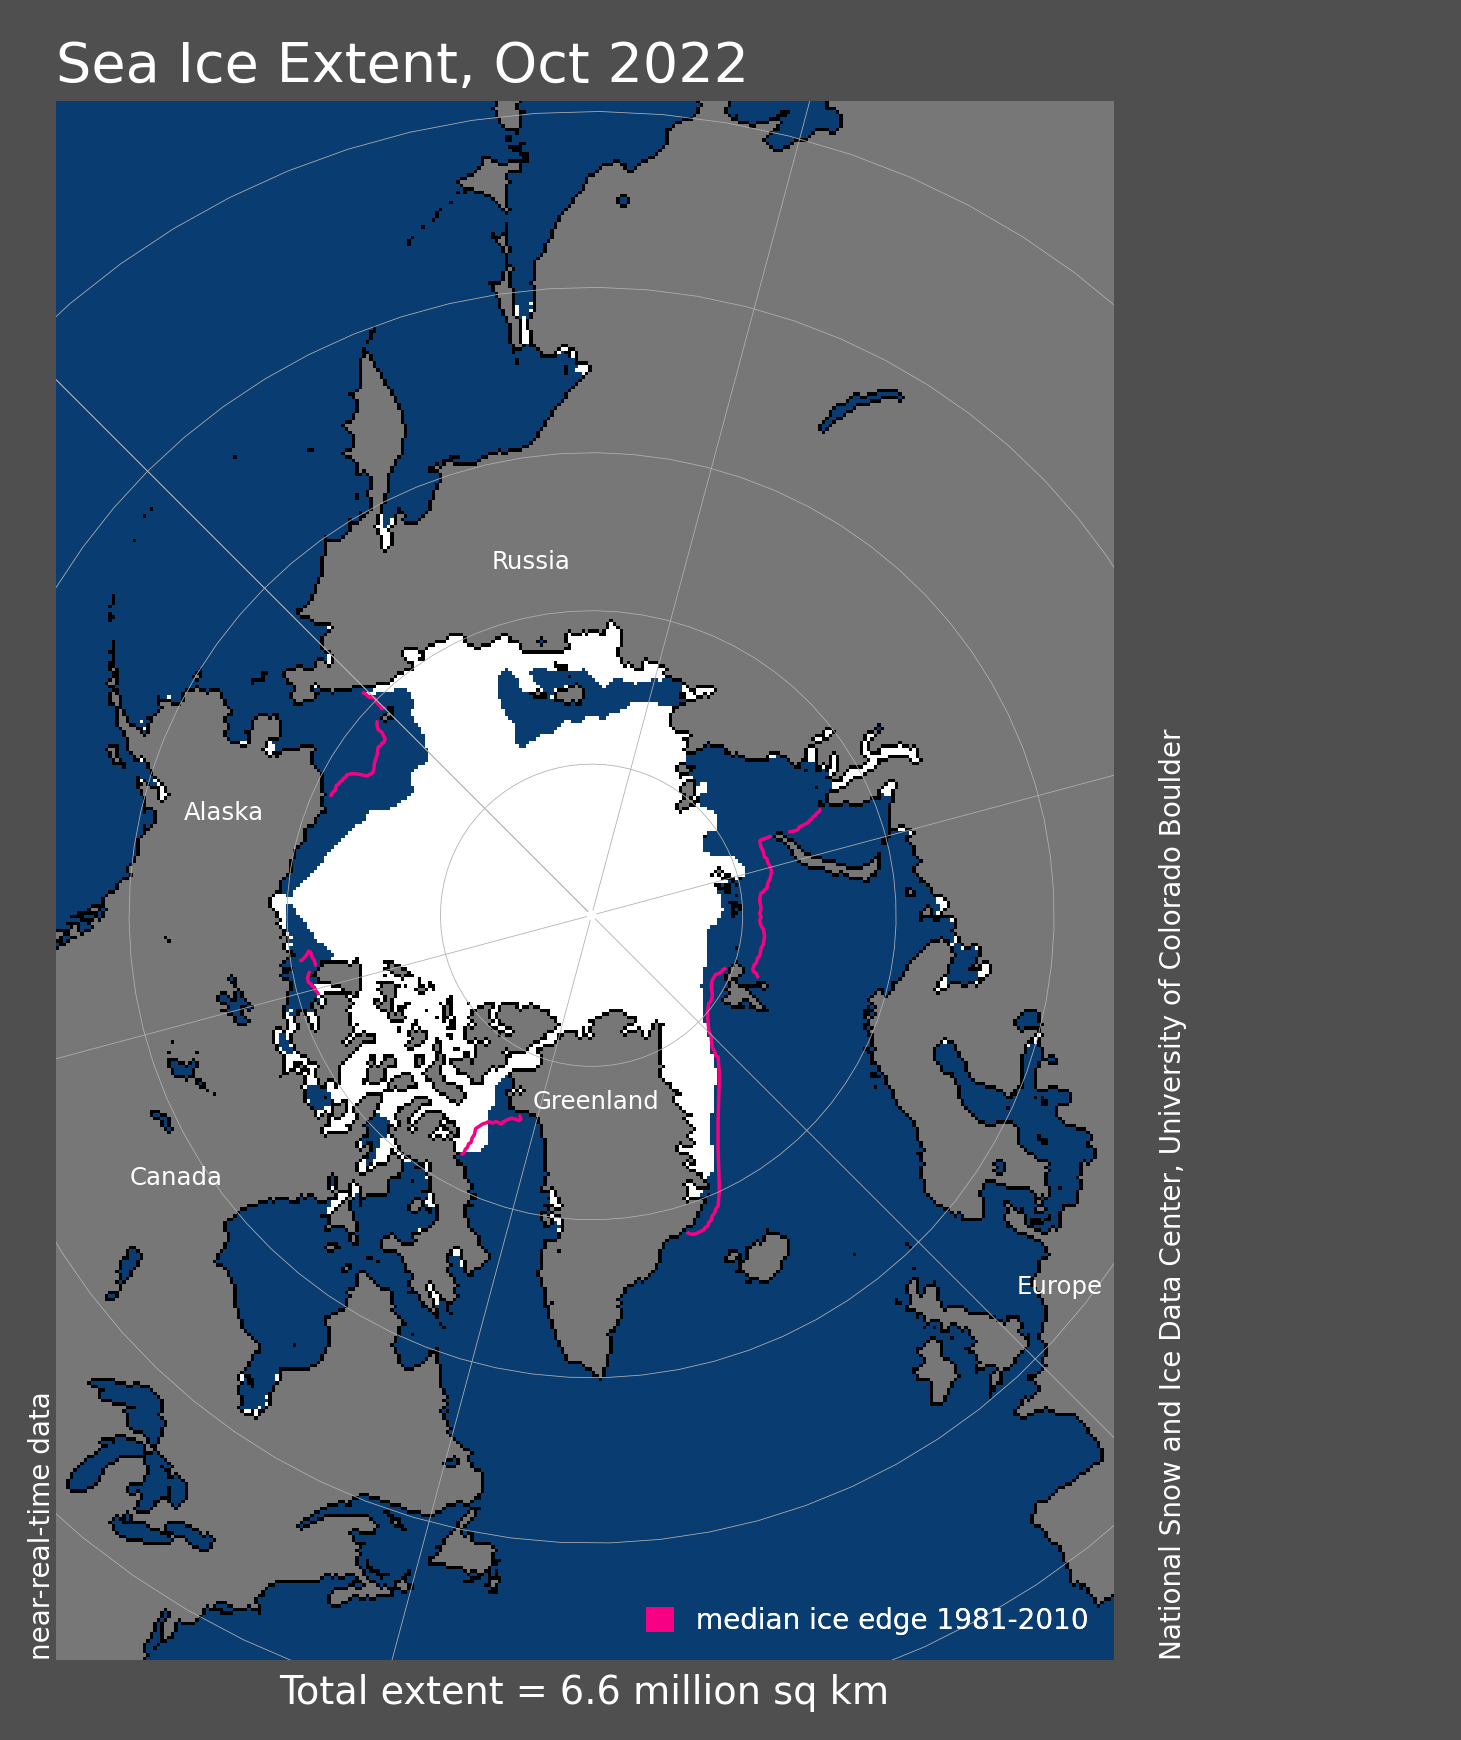
Figure 1a. Arctic sea ice extent for October 2022 was 6.61 million square kilometers (2.55 million square miles). The magenta line shows the 1981 to 2010 average extent for that month. Sea Ice Index data. About the data
Credit: National Snow and Ice Data Center
High-resolution image
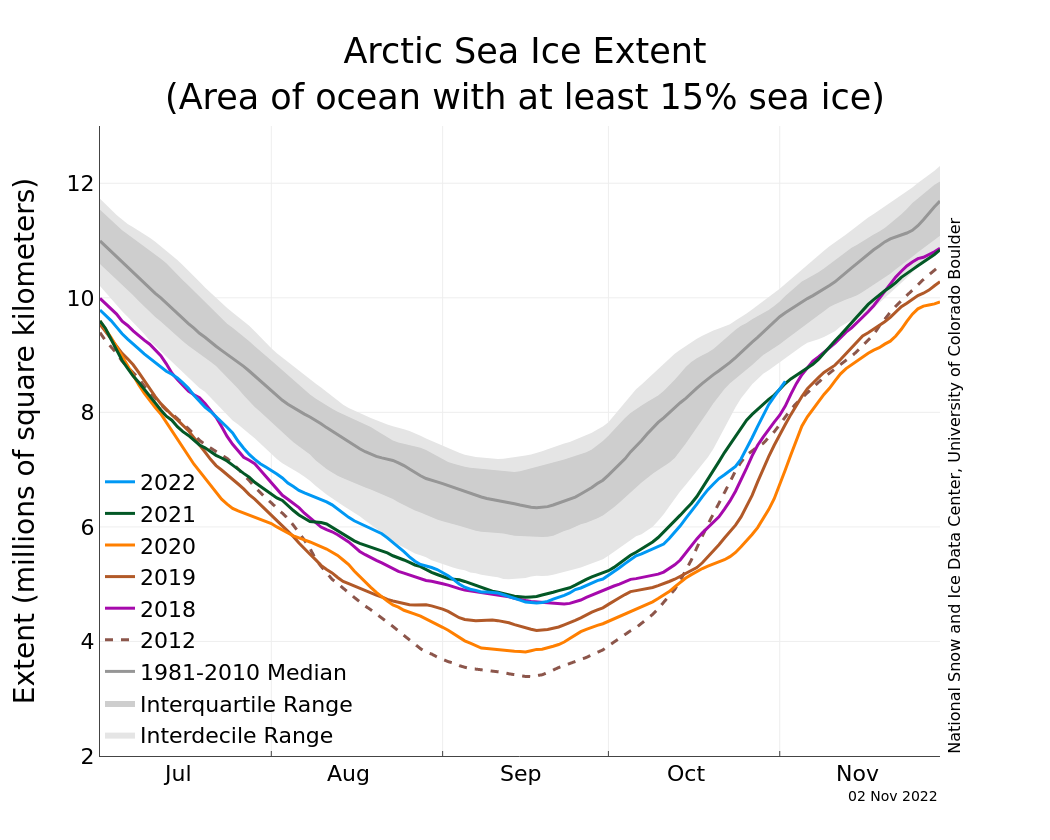
Figure 1b. The graph above shows Arctic sea ice extent as of November 2, 2022, along with daily ice extent data for four previous years and the record low year. 2022 is shown in blue, 2021 in green, 2020 in orange, 2019 in brown, 2018 in magenta, and 2012 in dashed brown. The 1981 to 2010 median is in dark gray. The gray areas around the median line show the interquartile and interdecile ranges of the data. Sea Ice Index data.
Credit: National Snow and Ice Data Center
High-resolution image
The October 2022 average Arctic sea ice extent was 6.61 million square kilometers (2.55 million square miles). This is the eighth lowest in the satellite record (Figure 1a). Extent was 1.74 million square kilometers (672,000 square miles) below the 1981 to 2010 average of 8.35 million square kilometers (3.22 million square miles) and 1.28 million square kilometers (494,000 square miles) above the record minimum set in 2020 of 5.33 million square kilometers (2.06 million square miles).
Ice extent increased at a below average rate at the beginning of the month, and open water persisted for some time in the Laptev Sea, whereas the East Siberian Sea was among the first regions to freeze up. In the last ten days of the month, ice extent rapidly increased (Figure 1b) as the Laptev Sea iced over. The delayed freeze up in the Laptev Sea could be partly a result of ocean heating from the extended period of open water this past spring and summer. However, slow freeze up in this region in recent years is also consistent with observations of eddies within the Arctic Circumpolar Boundary Current that maintain a generally upward ocean heat flux, bringing warm Atlantic water along the eastern Arctic continental slope. The Arctic Circumpolar Boundary Current is a shallow, 200- to 400-meter-deep (660 to 1,300 feet) eastward-flowing current that follows the edge of the continental shelf and carries warm water at 2 to 3 degrees Celsius (36 to 37 degrees Fahrenheit) in shallow depths around the Arctic Ocean. The configuration of the continental shelf in the Russian Arctic brings this water very near the coastal Laptev Sea.
At the end of the month, extent remained below average in the Chukchi Sea on the Pacific side of the Arctic, and also in the Barents and Kara Seas on the Atlantic side.
Conditions in context
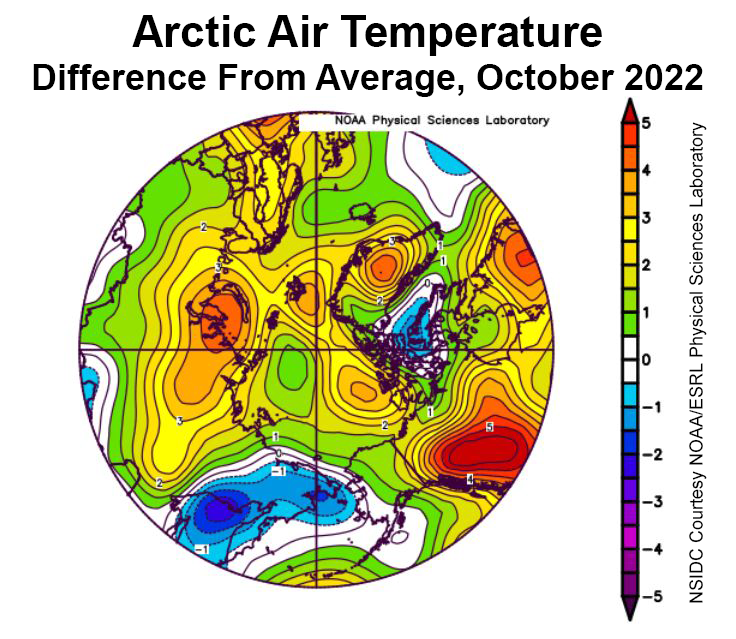
Figure 2a. This plot shows the departure from average air temperature in the Arctic at the 925 hPa level, in degrees Celsius, for October 2022. Yellows and reds indicate higher than average temperatures; blues and purples indicate lower than average temperatures.
Credit: NSIDC courtesy NOAA Earth System Research Laboratory Physical Sciences Laboratory
High-resolution image
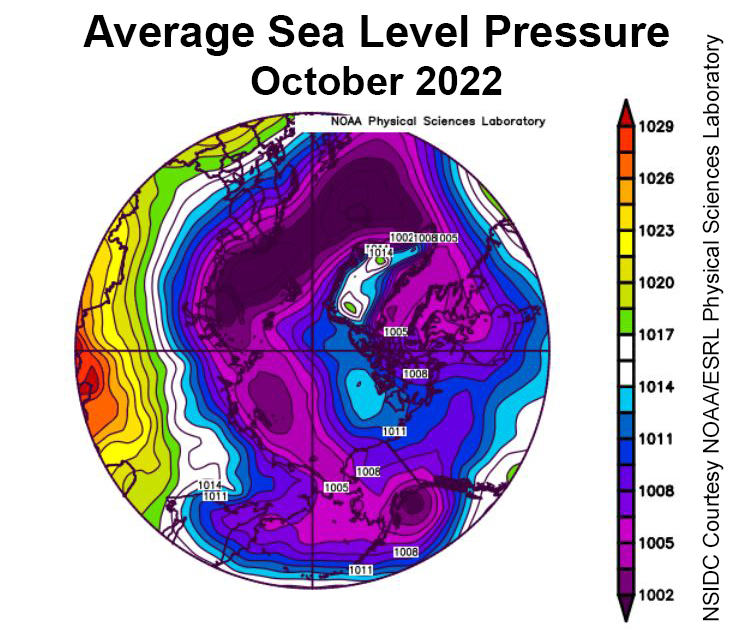
Figure 2b. This plot shows average sea level pressure in the Arctic in millibars for October 2022. Yellows and reds indicate high air pressure; blues and purples indicate low pressure.
Credit: NSIDC courtesy NOAA Earth System Research Laboratory Physical Sciences Laboratory
High-resolution image
Air temperatures during October at the 925 millibar level (approximately 2,500 feet above the surface) were near to above average over most of the Arctic Ocean (Figure 2a). The largest departures from average for this time of year were over the Kara Sea, where air temperatures averaged for October remained above freezing.
The average atmospheric circulation pattern was dominated by below average sea level pressure over nearly the entire Arctic (Figure 2b). Pressures were as much as 10 to 12 millibars below average over the Chukchi and East Siberian Seas and stretching across the pole. This pattern is reflected in the persistence of positive values of the Arctic Oscillation Index for most of the month. When the Arctic Oscillation is in its positive mode, pressures are below average over the Arctic, but above average over the Northern Hemisphere mid latitudes.
October 2022 compared to previous years
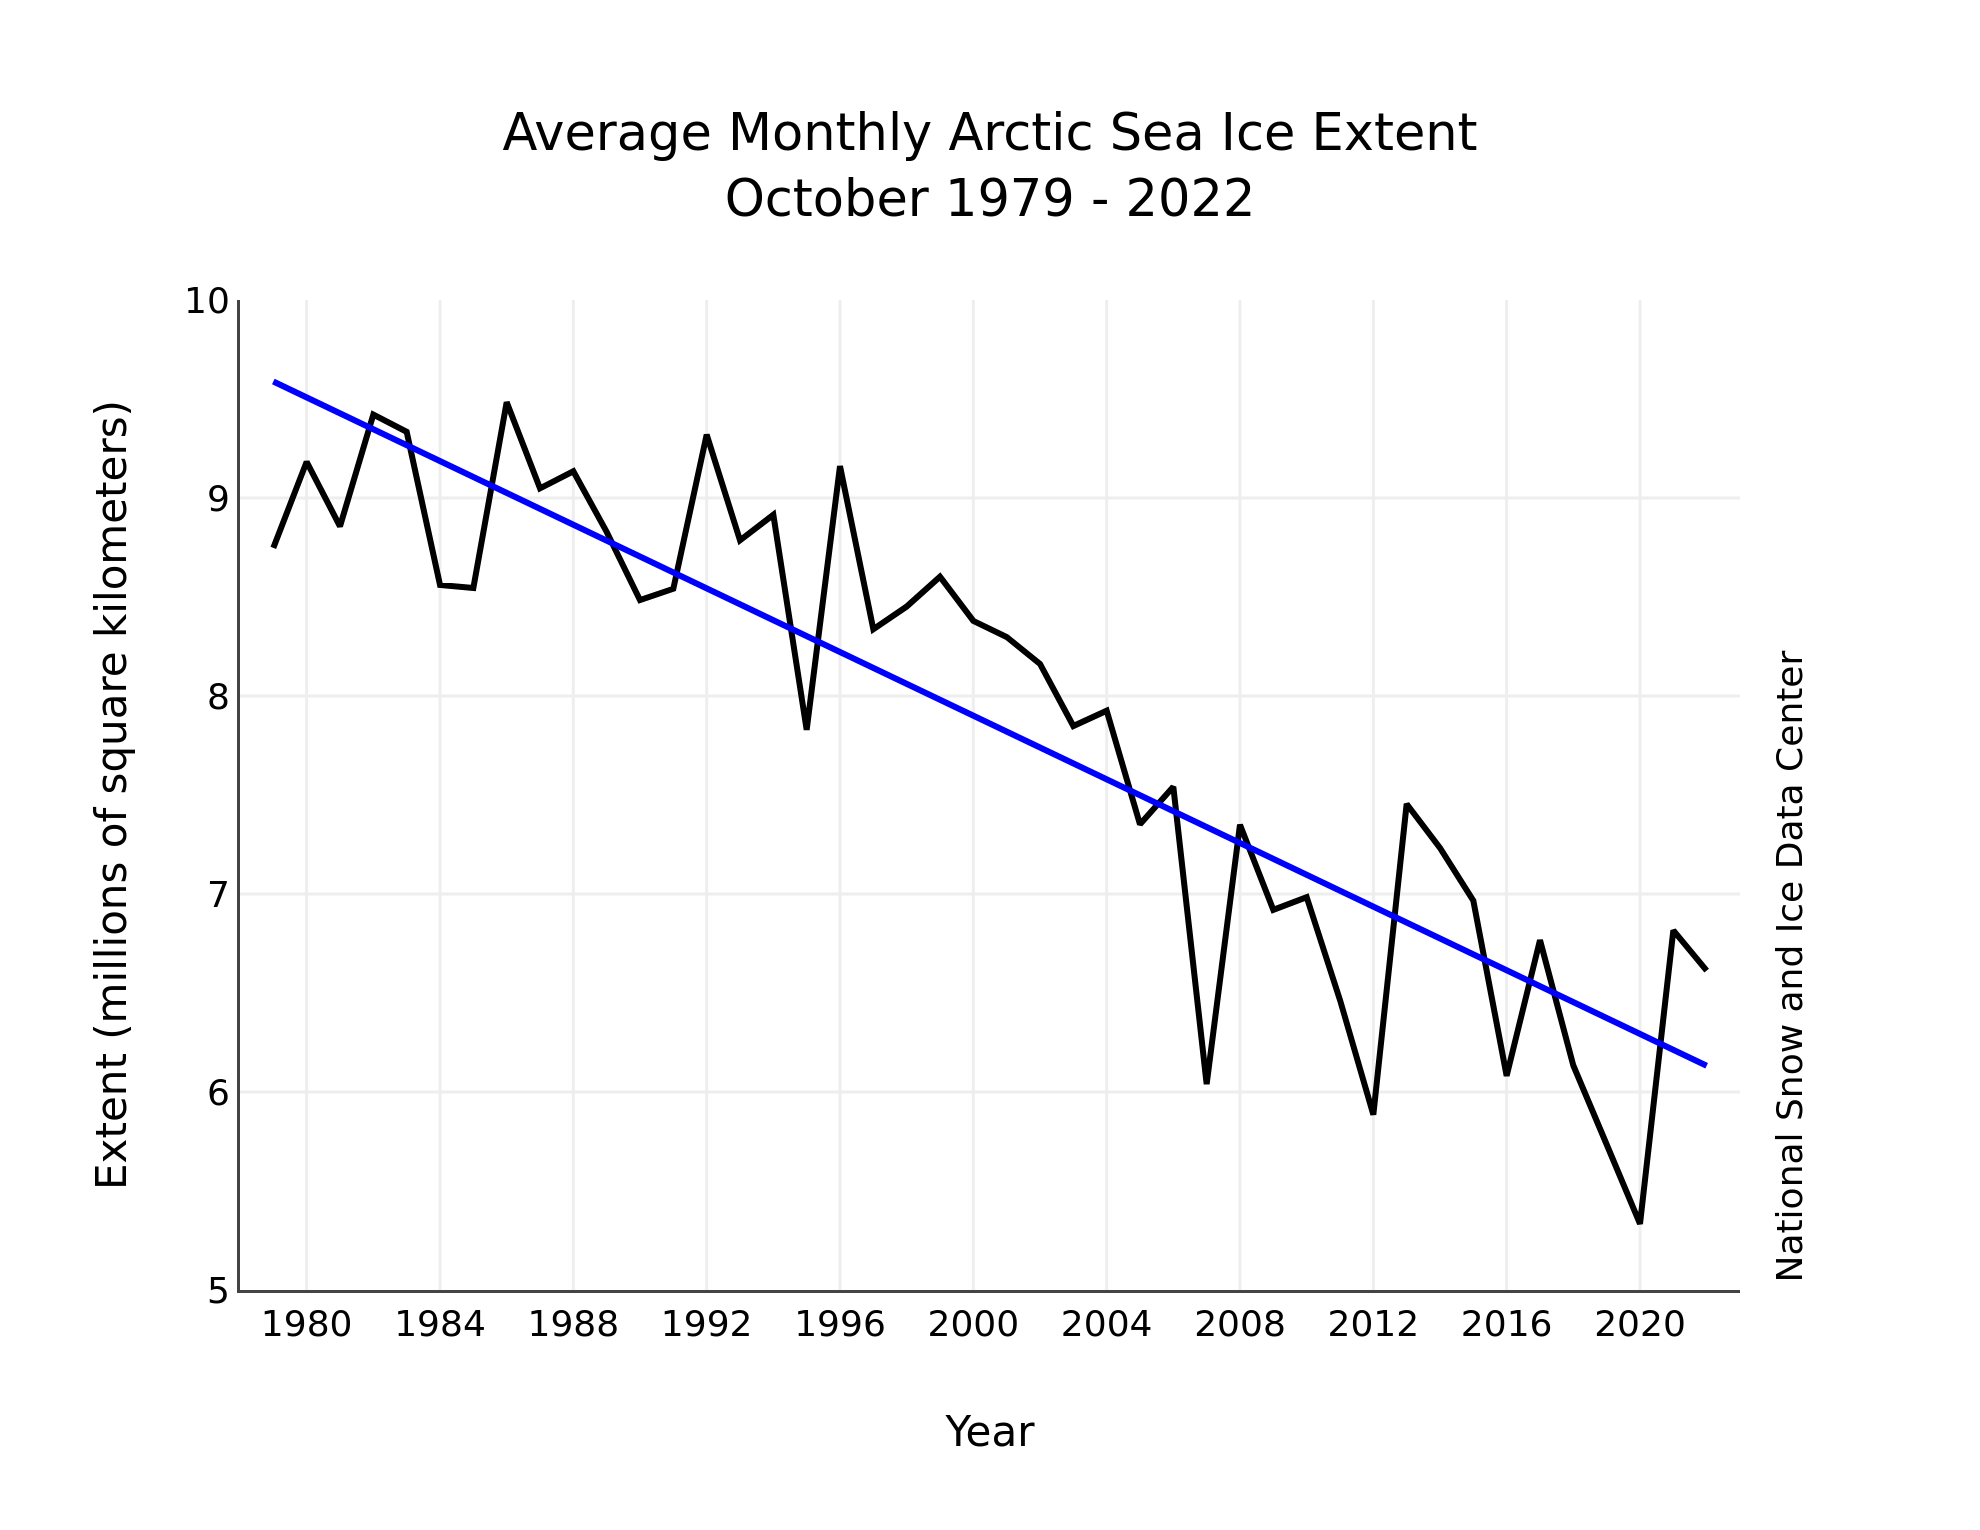
Figure 3. Monthly October ice extent for 1979 to 2022 shows a decline of 9.6 percent per decade.
Credit: National Snow and Ice Data Center
High-resolution image
The downward linear trend in October sea ice extent over the 45-year satellite record is 80,400 square kilometers (31,000 square miles) per year, or 9.6 percent per decade relative to the 1981 to 2010 average. Based on the linear trend, since 1979 October has lost 3.46 million square kilometers (1.34 million square miles). This equivalent to about twice the size of the state of Alaska.
Arctic sea ice loss may make El Niños more common
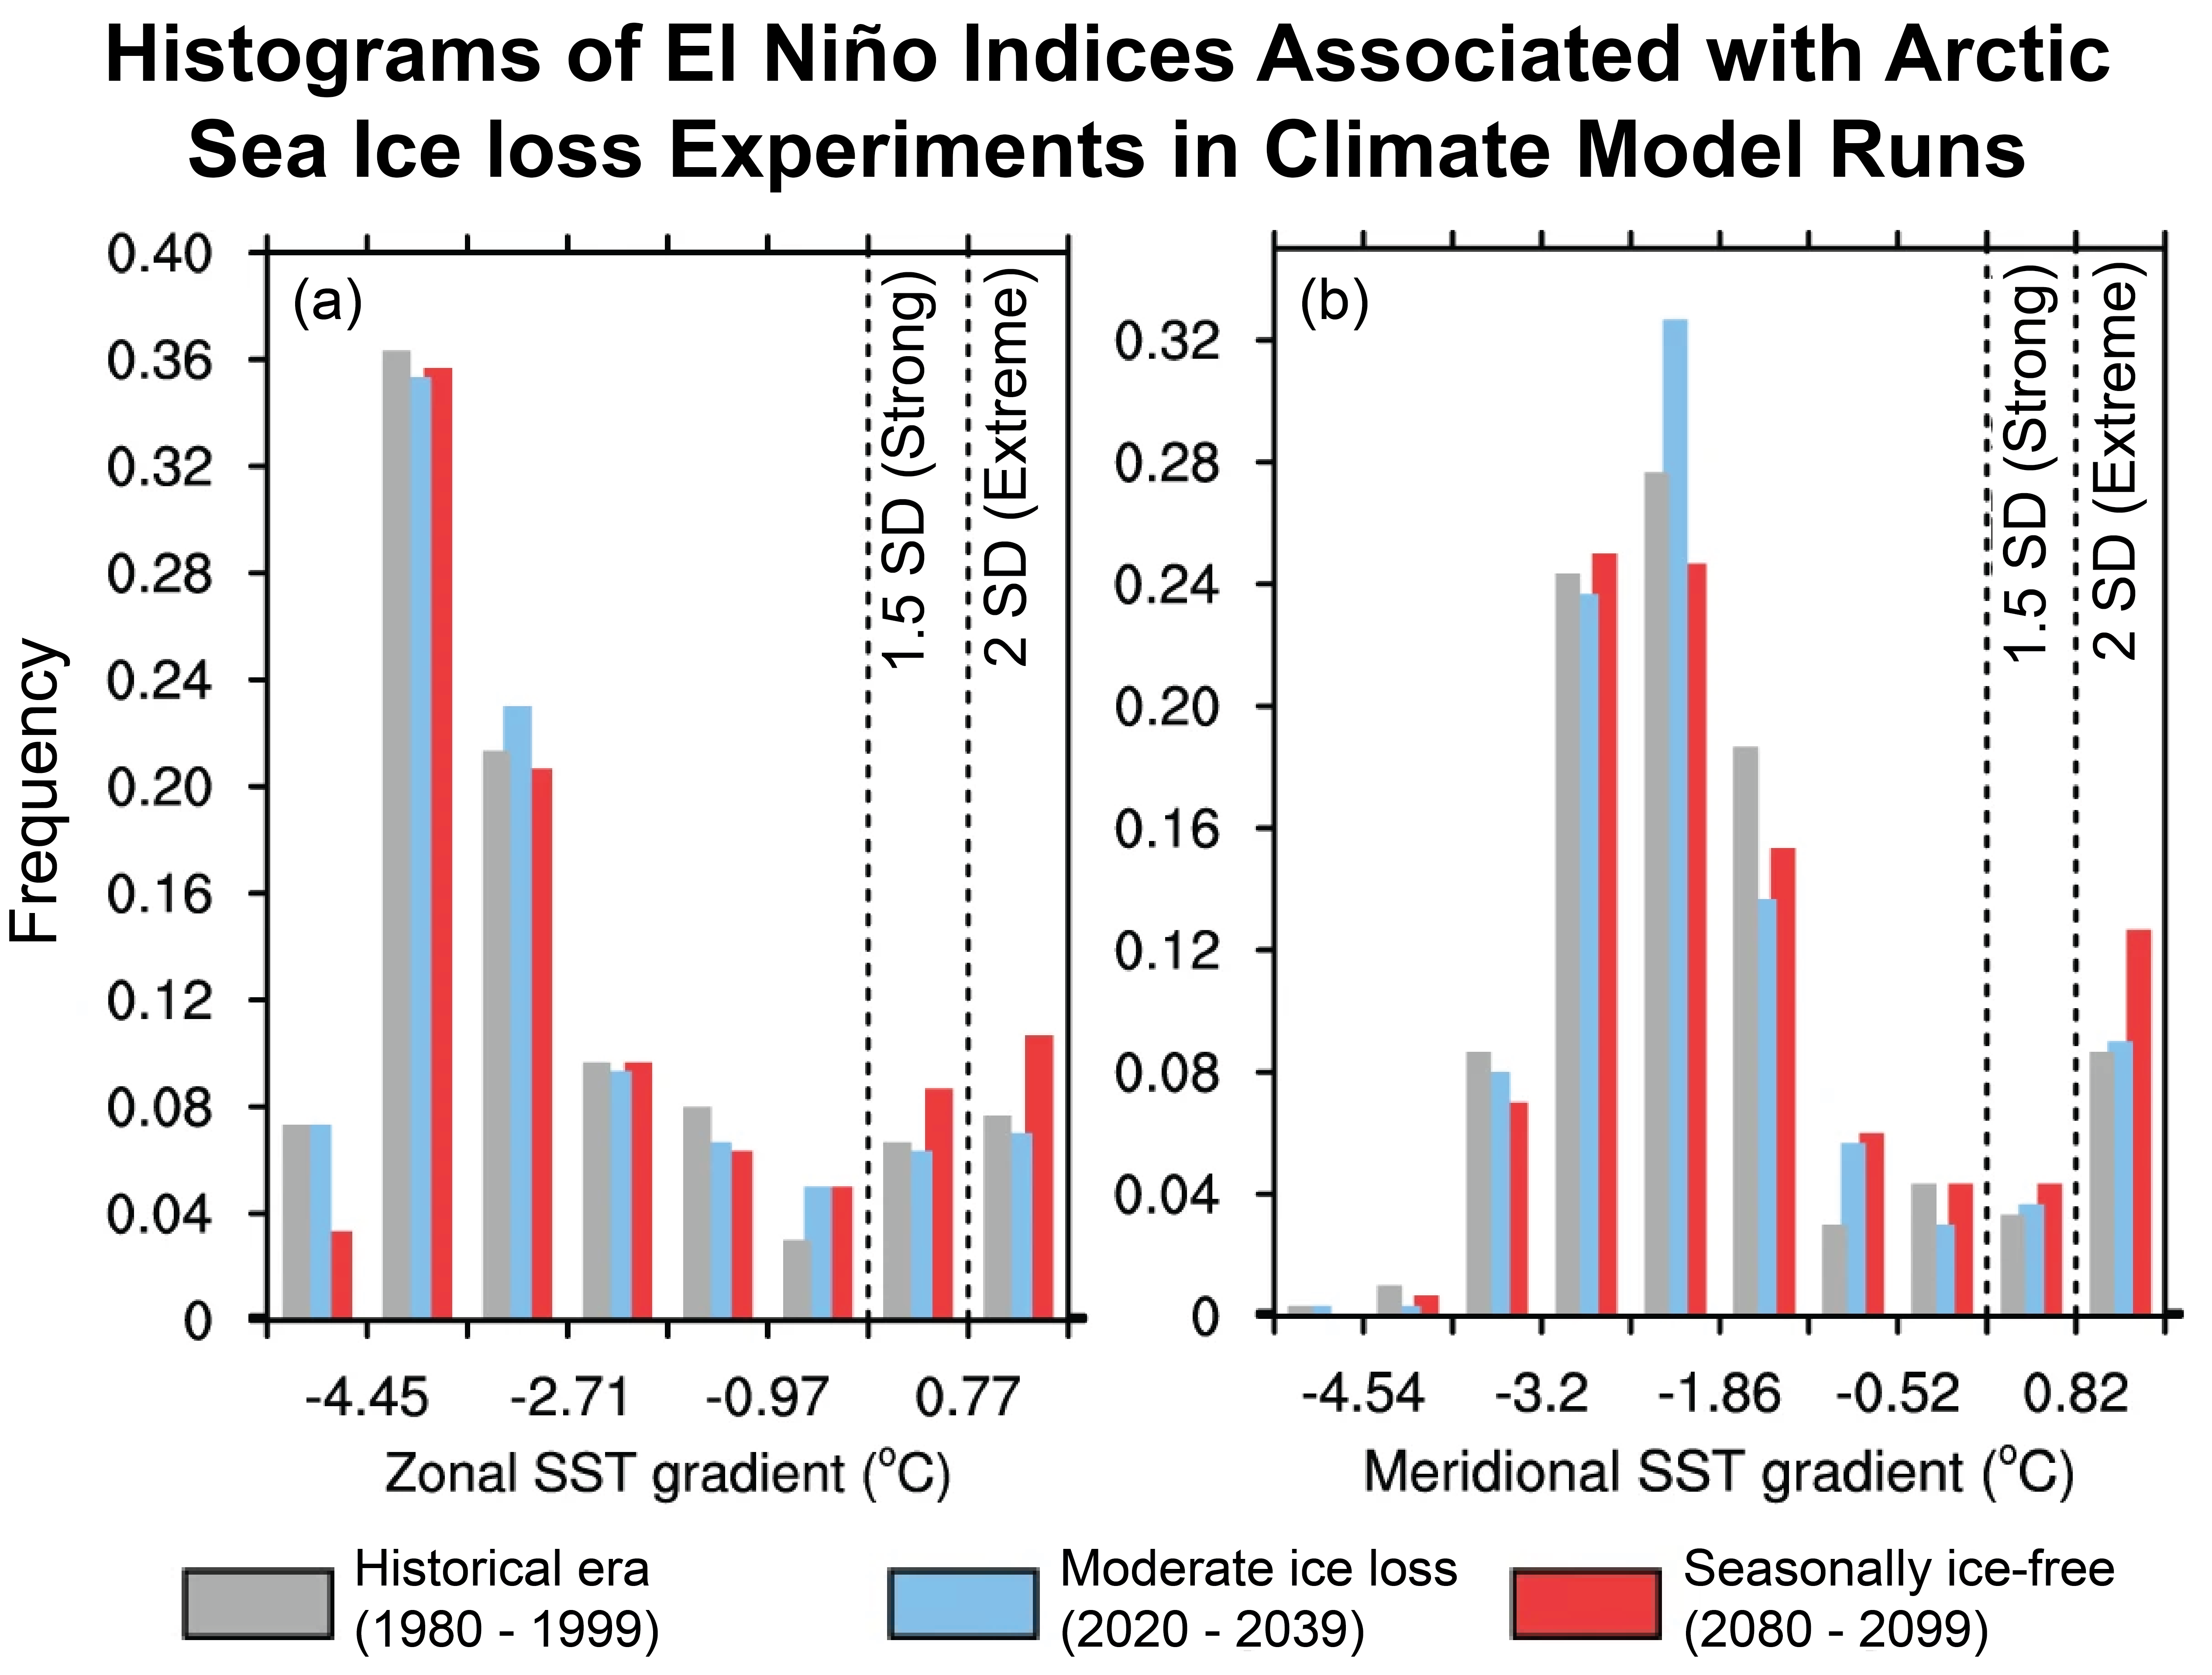
Figure 4. These plots show histograms of El Niño indices associated with Arctic sea ice loss experiments in climate model runs. The left histogram (a) shows the zonal sea surface temperature (SST) gradient in the equatorial Pacific that is defined as the average SST over the Niño 3.4 region (5S-5N, 170W-120W) minus the Maritime Continent region (5S-5N, 110E-160E). The histogram on the right (b) shows the meridional SST gradient in the eastern equatorial Pacific that is defined as the average SST over 5N-10N, 160W-100W minus 2.5S-2.5N, 160W-100W. The vertical bars denote 20-year periods of constant Arctic sea ice in experiments using the US National Center for Atmospheric Research Community Earth System Model (CESM). Gray is the historical period (1980 to 1999); blue is the future period of moderate ice loss (2020 to 2039); and red is the future period of seasonally ice-free conditions (2080 to 2099). Each bin represents 0.5 standard deviation of the corresponding SST anomalies or gradients. Black dashed lines represent 1.5 (strong El Niño) and 2 (extremely strong El Niño) standard deviations.
Credit: Jiping Liu et al. 2022, adapted by NSIDC
High-resolution image
El Niño is an important departure in ocean temperatures along the equator, linked to weakened trade winds. During an El Niño, the cold upwelled waters along the coast of the Americas and much of the eastern parts of the tropical Pacific are replaced by warmer water. This can have global impacts on weather, ecosystems, and economies around the world by shifting the Pacific jet stream southwards. In North America, this usually results in drier and warmer conditions than usual in the northern areas, and wetter conditions in the south. While episodes of El Niño typically occur every two to seven years and can last several months to more than a year, climate model simulations by colleagues at the University of Albany suggest that the frequency of El Niño events could increase by 35 percent by the end of this century if the Arctic Ocean loses its summer ice cover.
This link was found to result from increased heat transfer from the ocean to the atmosphere in the absence of sea ice, intensifying low-pressure systems in the Bering Sea (in the area of the Aleutian Low). Lower sea level pressure increases wind speeds that may oppose trade winds, bringing warm western Pacific water towards the east. Another possible mechanism is that as the Arctic Ocean warms from losing its sea ice cover, ocean currents weaken from the south that bring warm water from the eastern Pacific toward the Arctic. Analysis with other climate models is necessary to test the robustness of these connections.
The Antarctic
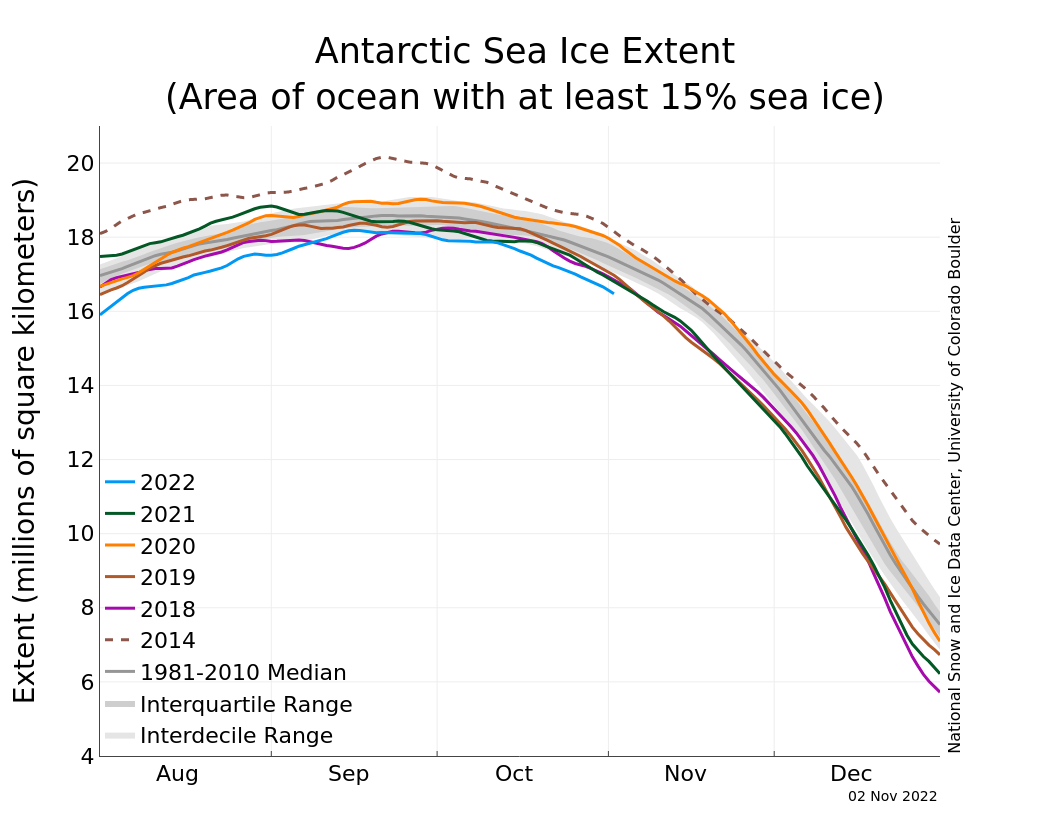
Figure 5. The graph above shows Antarctic sea ice extent as of November 2, 2022, along with daily ice extent data for four previous years and the record high year. 2022 is shown in blue, 2021 in green, 2020 in orange, 2019 in brown, 2018 in magenta, and 2012 in dashed brown. The 1981 to 2010 median is in dark gray. The gray areas around the median line show the interquartile and interdecile ranges of the data. Sea Ice Index data.
Credit: National Snow and Ice Data Center
High-resolution image
The seasonal Southern Ocean sea ice maximum extent was reached on September 16, at 18.19 million square kilometers (7.02 million square miles). This was the fourth lowest sea ice maximum in the satellite record, behind 1986, 2002, and 2017. Low sea ice extent has continued to persist, and the springtime decline in austral ice extent has proceeded at an above average pace. At month’s end, Antarctic sea ice was nearing record-low daily ice extents for the date.
Extent is far below average in the Bellingshausen Sea, and far above average in the Amundsen and eastern Ross Seas, a pattern indicative of a strong Amundsen Sea Low. Sea level pressures in the region have been 8 to 12 millibars below average. However, sea ice extent is also low along the Wilkes Land coast, where air temperatures have been 1 to 4 degrees Celsius (2 to 7 degrees Fahrenheit) above average.
Further reading
Aksenov, Y., V. V. Ivanov, A. G. Nurser, S. Bacon, I. V. Polyakov, A. C. Coward, A. C. Naveira‐Garabato, and A. Beszczynska-Moeller. 2011. The Arctic circumpolar boundary current. Journal of Geophysical Research: Oceans. doi:10.1029/2010JC006637.
Liu, J., M. Song, Z. Zhu, et al. 2022. Arctic sea-ice loss is projected to lead to more frequent strong El Niño events. Nature Communications. doi:10.1038/s41467-022-32705-2.
Pnyushkov, A., I. V. Polyakov, L. Padman, and A. T. Nguyen. 2018. Structure and dynamics of mesoscale eddies over the Laptev Sea continental slope in the Arctic Ocean. Ocean Science. doi:10.5194/os-14-1329-2018.

