Both of Earth’s polar regions had low sea ice extent for the month of June, with Antarctic sea ice setting a record low. Arctic sea ice extent stands at tenth lowest. Near-record low ice extent characterized the Barents and Hudson Bay areas, and there are several low-concentration regions in the Beaufort Sea, an area that usually has a dense ice pack at this time of year.
Overview of conditions
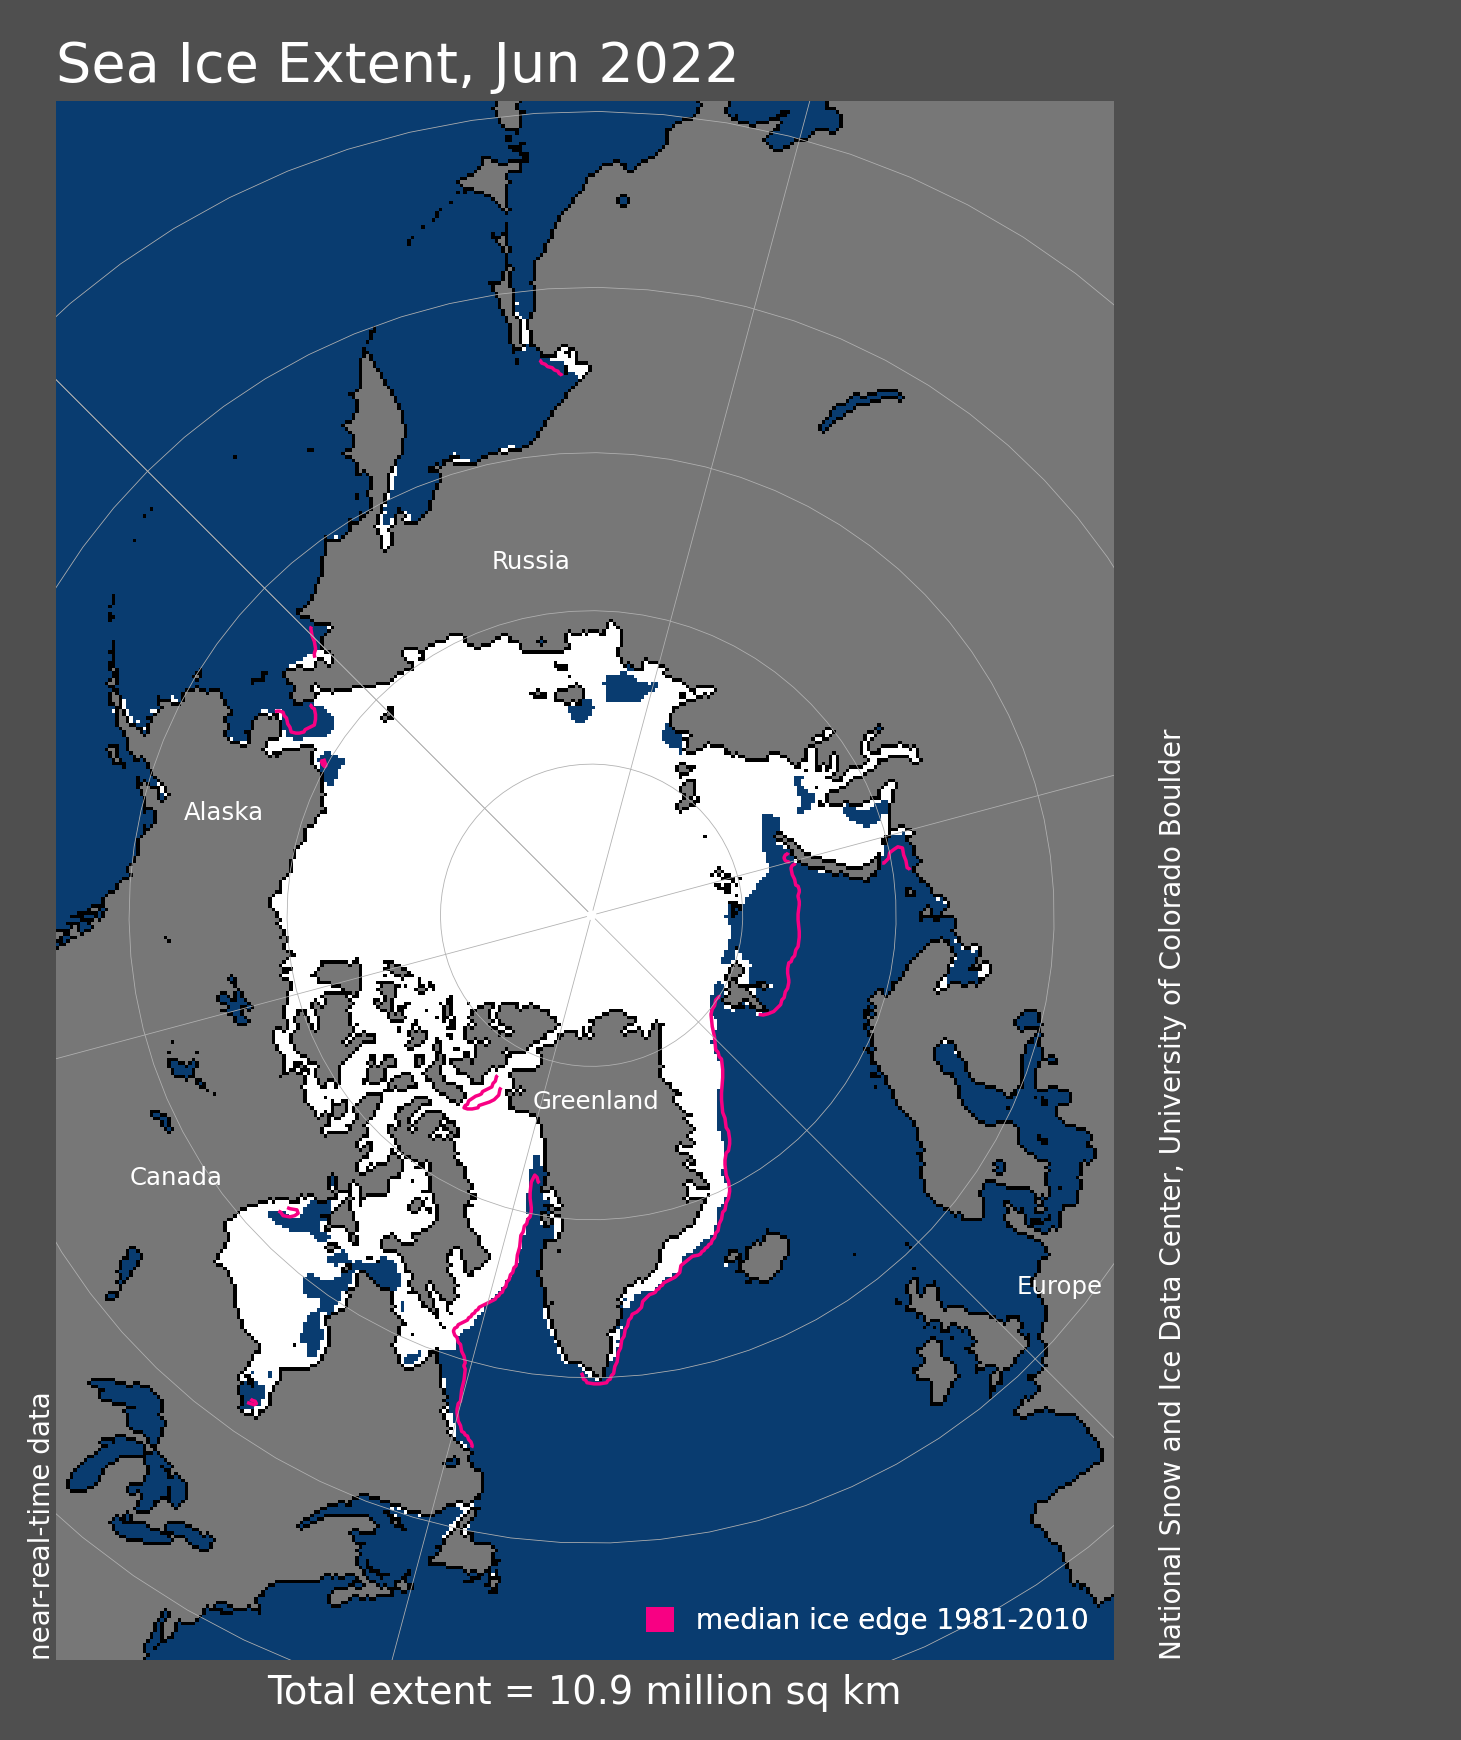
Figure 1. Arctic sea ice extent for June 2022 was 10.86 million square kilometers (4.19 million square miles). The magenta line shows the 1981 to 2010 average extent for that month. Sea Ice Index data. About the data
Credit: National Snow and Ice Data Center
High-resolution image
Average Arctic sea ice extent for June 2022 was 10.86 million square kilometers (4.19 million square miles), ranking tenth lowest in the satellite record (Figure 1). The 2022 June extent was 900,000 square kilometers (347,000 square miles) below the 1981 to 2010 average. Total ice loss for June was 2.50 million square kilometers (965,000 square miles). The Barents Sea is nearly ice free, with the ice edge far north of its usual location for this time of year. Hudson Bay is also losing ice unusually early. Extent in the Chukchi, East Siberian, and Kara Seas is slightly below average. The most notable feature along the Russian coast is the opening of a large polynya in the Laptev Sea near the New Siberian Islands. Baffin Bay has near average ice extent, and in early June the North Water Polynya opened. Some extensive low-ice-concentration regions are forming over the central Arctic Ocean, perhaps portending large polynyas in the later part of the summer.
Conditions in context
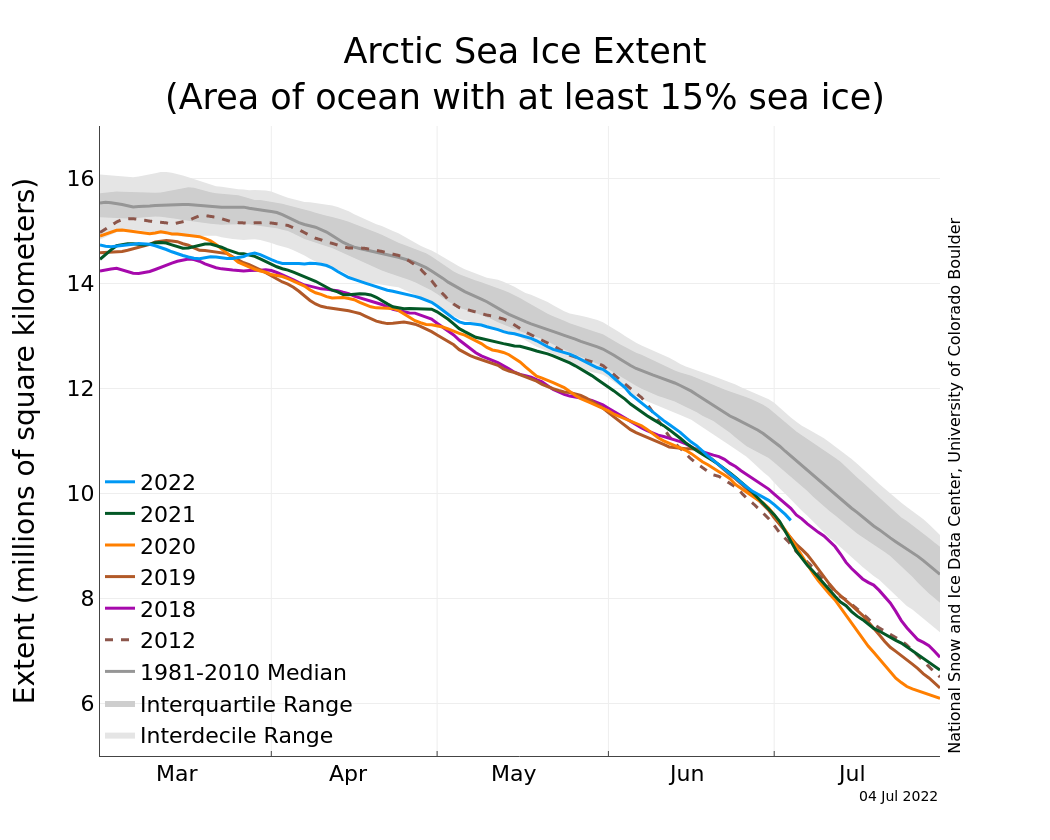
Figure 2a. The graph above shows Arctic sea ice extent as of July 4, 2022, along with daily ice extent data for four previous years and the record low year. 2022 is shown in blue, 2021 in green, 2020 in orange, 2019 in brown, 2018 in magenta, and 2012 in dashed brown. The 1981 to 2010 median is in dark gray. The gray areas around the median line show the interquartile and interdecile ranges of the data. Sea Ice Index data.
Credit: National Snow and Ice Data Center
High-resolution image
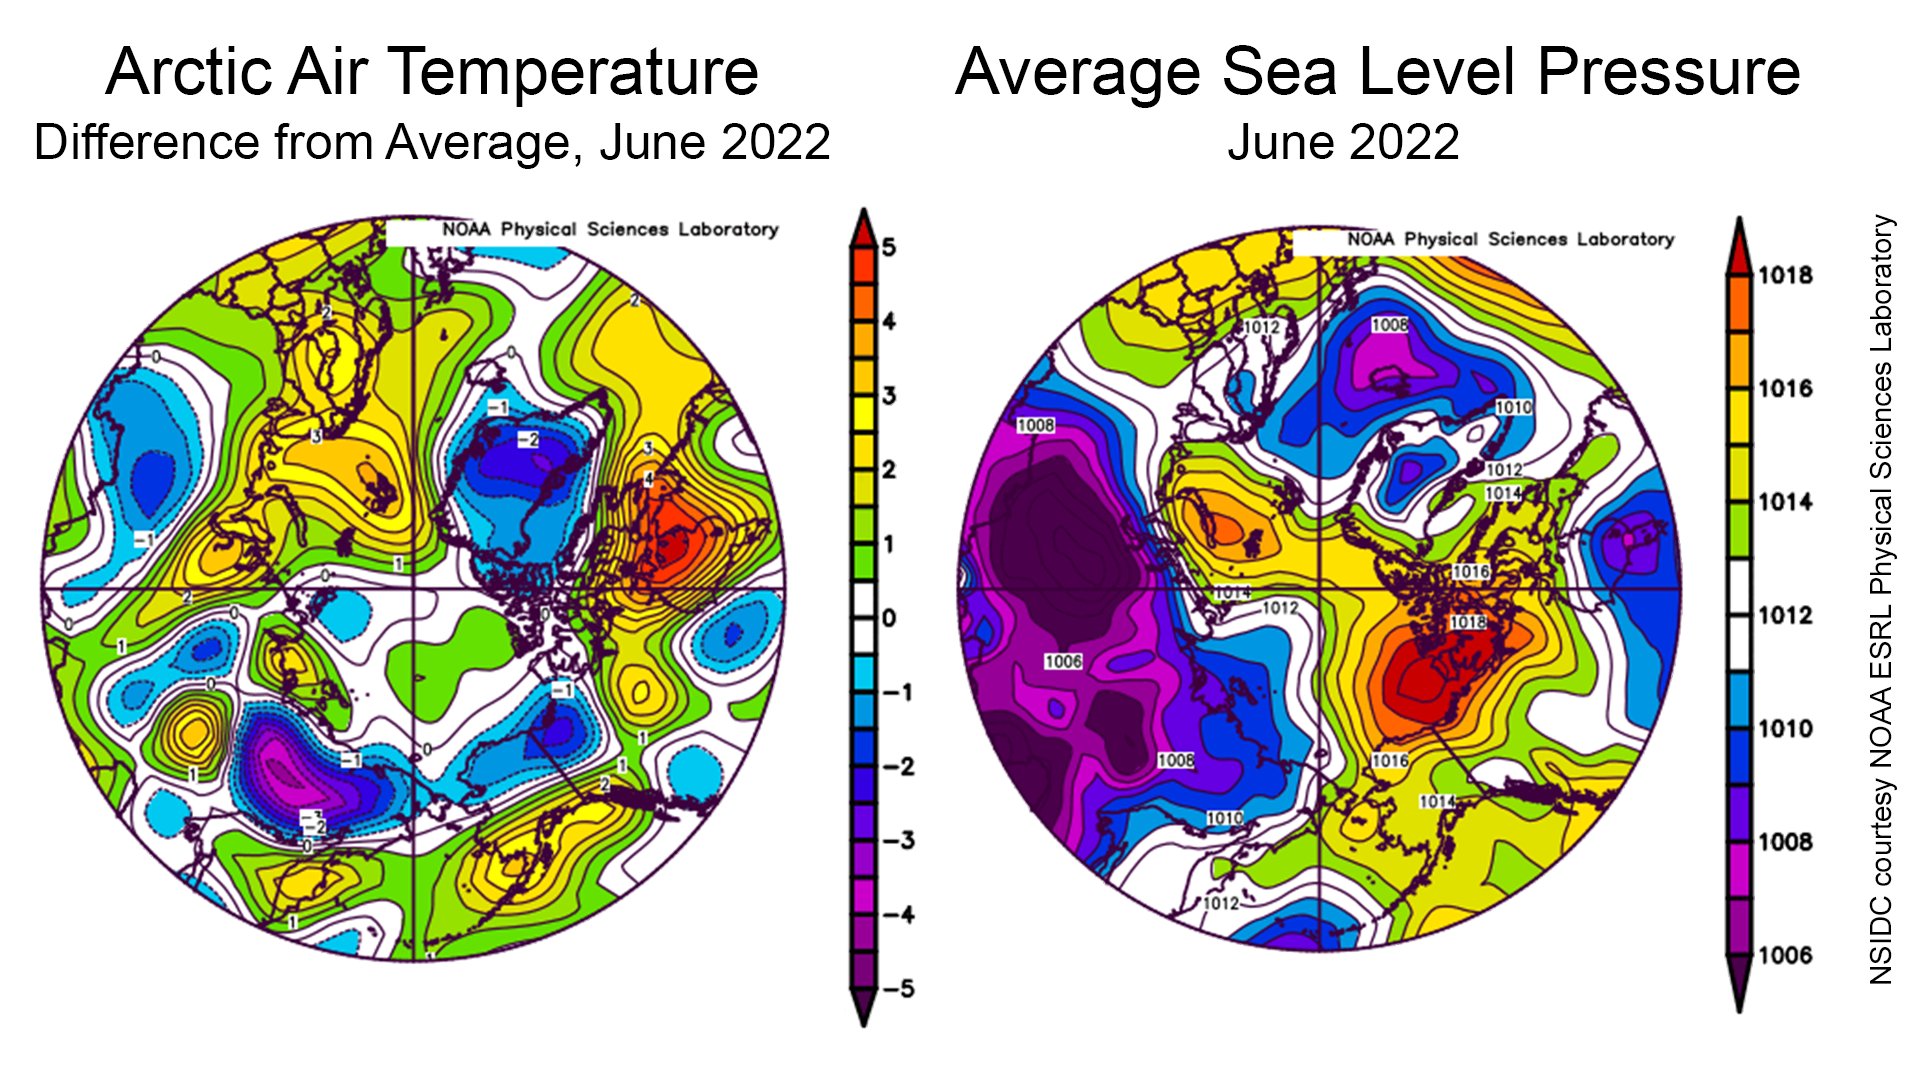
Figure 2b. The left plot shows the departure from average air temperature in the Arctic at the 925 hPa level, in degrees Celsius, for June 2022. Yellows and reds indicate higher than average temperatures; blues and purples indicate lower than average temperatures. The plot on the right shows average sea level pressure in the Arctic in millibars for June 2022. Yellows and reds indicate high air pressure; blues and purples indicate low pressure.
Credit: NSIDC courtesy NOAA Earth System Research Laboratory Physical Sciences Laboratory
High-resolution image
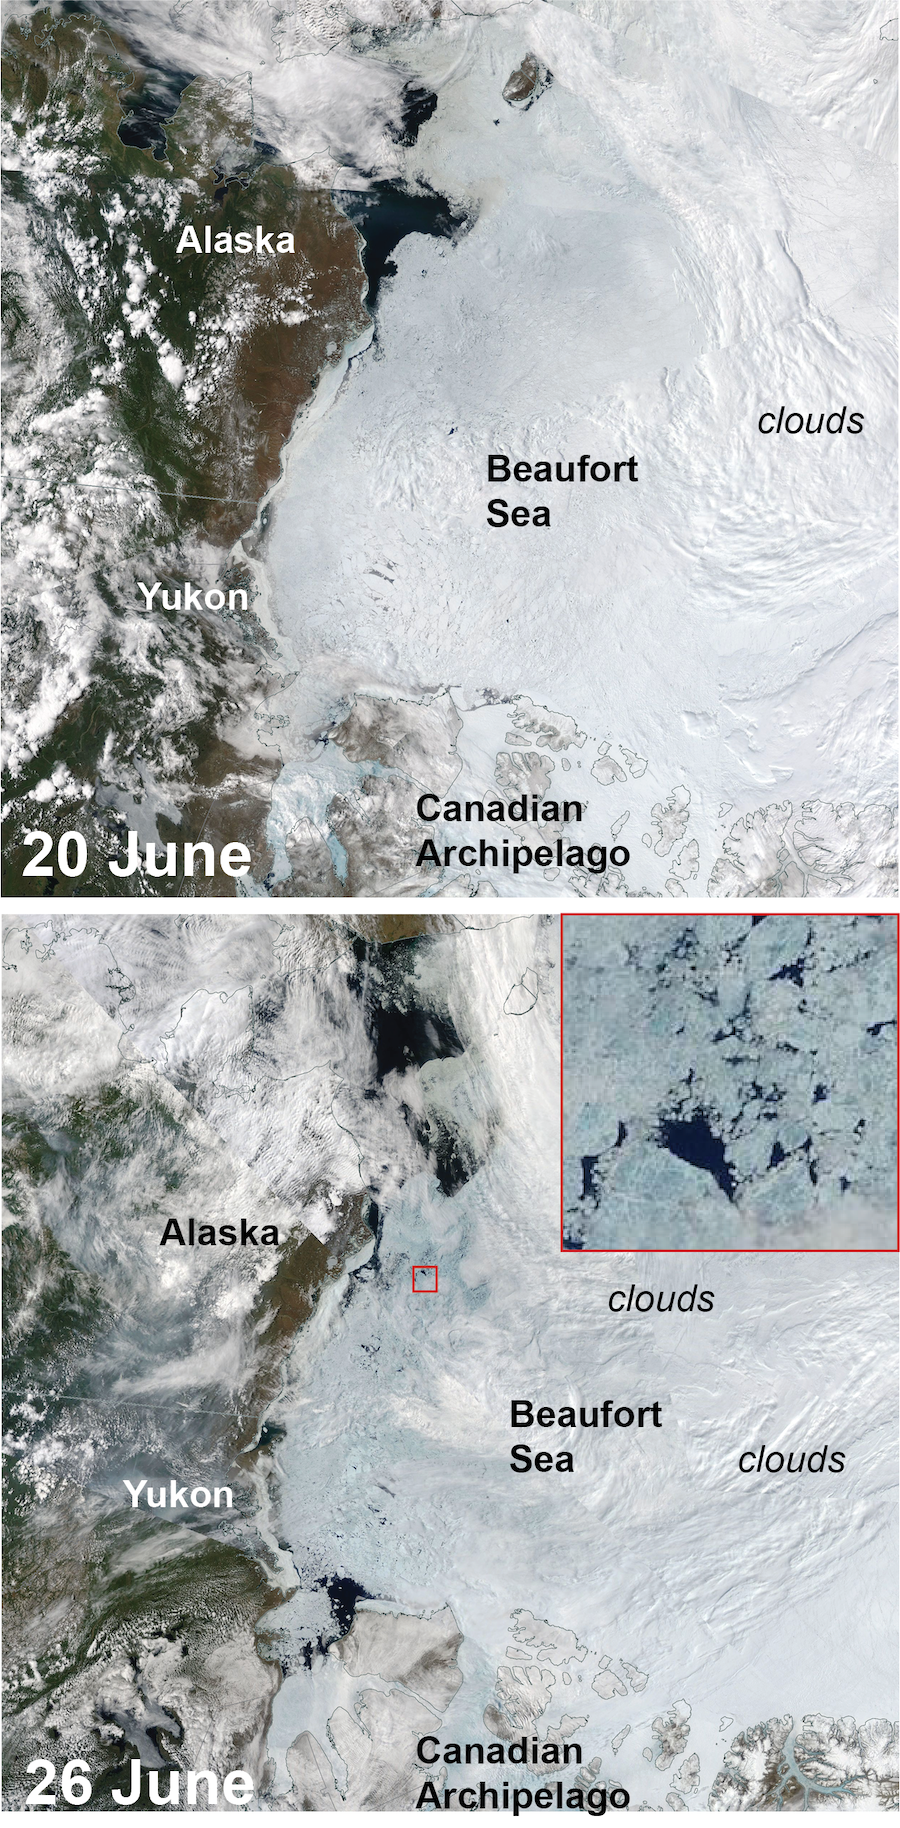
Figure 2c. These Moderate Resolution Imaging Spectroradiometer (MODIS) images from the NASA Terra satellite show the Beaufort Sea and surrounding areas on June 20 (top) and June 26 (bottom). Blue tint over the sea ice areas not covered by clouds indicates development of melt ponds on the ice. The inset is a closeup of the area in the small red box on the June 26 image, depicting melt ponds on sea ice floes.
Credit: NASA WorldView
High-resolution image
June air temperatures over the Arctic as assessed at the 925 hPa level (approximately 2,500 feet above the surface) were close to the long-term average. Most of the high-latitude Arctic Ocean was within a degree of the 1981 to 2010 average temperature. Temperatures in Scandinavia, Svalbard, and northern European Russia were generally 2 to 3 degrees Celsius (4 to 5 degrees Fahrenheit) above average (Figure 2b). The Hudson Bay region is also warm with temperatures 4 to 5 degrees Celsius (7 to 9 degrees Fahrenheit) above average. By contrast, temperatures over central Greenland, the northern Yukon and North Slope, and easternmost Siberia are all 2 to 4 degrees Celsius (4 to 7 degrees Fahrenheit) below average.
The June sea level pressure pattern was characterized by strong high pressure over the Beaufort Sea and a large low pressure area near Iceland (Figure 2b). This pattern is consistent with the warmth over Scandinavia and relatively cool conditions over Baffin Bay. A broad area of low pressure also dominates northwestern Eurasia. The strong high pressure over the Beaufort Sea, and generally high pressures over much of the Arctic Ocean, is consistent with a prevalence of clear skies. Since June is the month of the solstice, with the highest sun elevation, the clear skies let more solar energy reach the ice surface, leading to strong surface melting. Between June 20 and June 26, a large area of the Beaufort Sea started to show the development of melt ponds (Figure 2c).
June 2022 compared to previous years
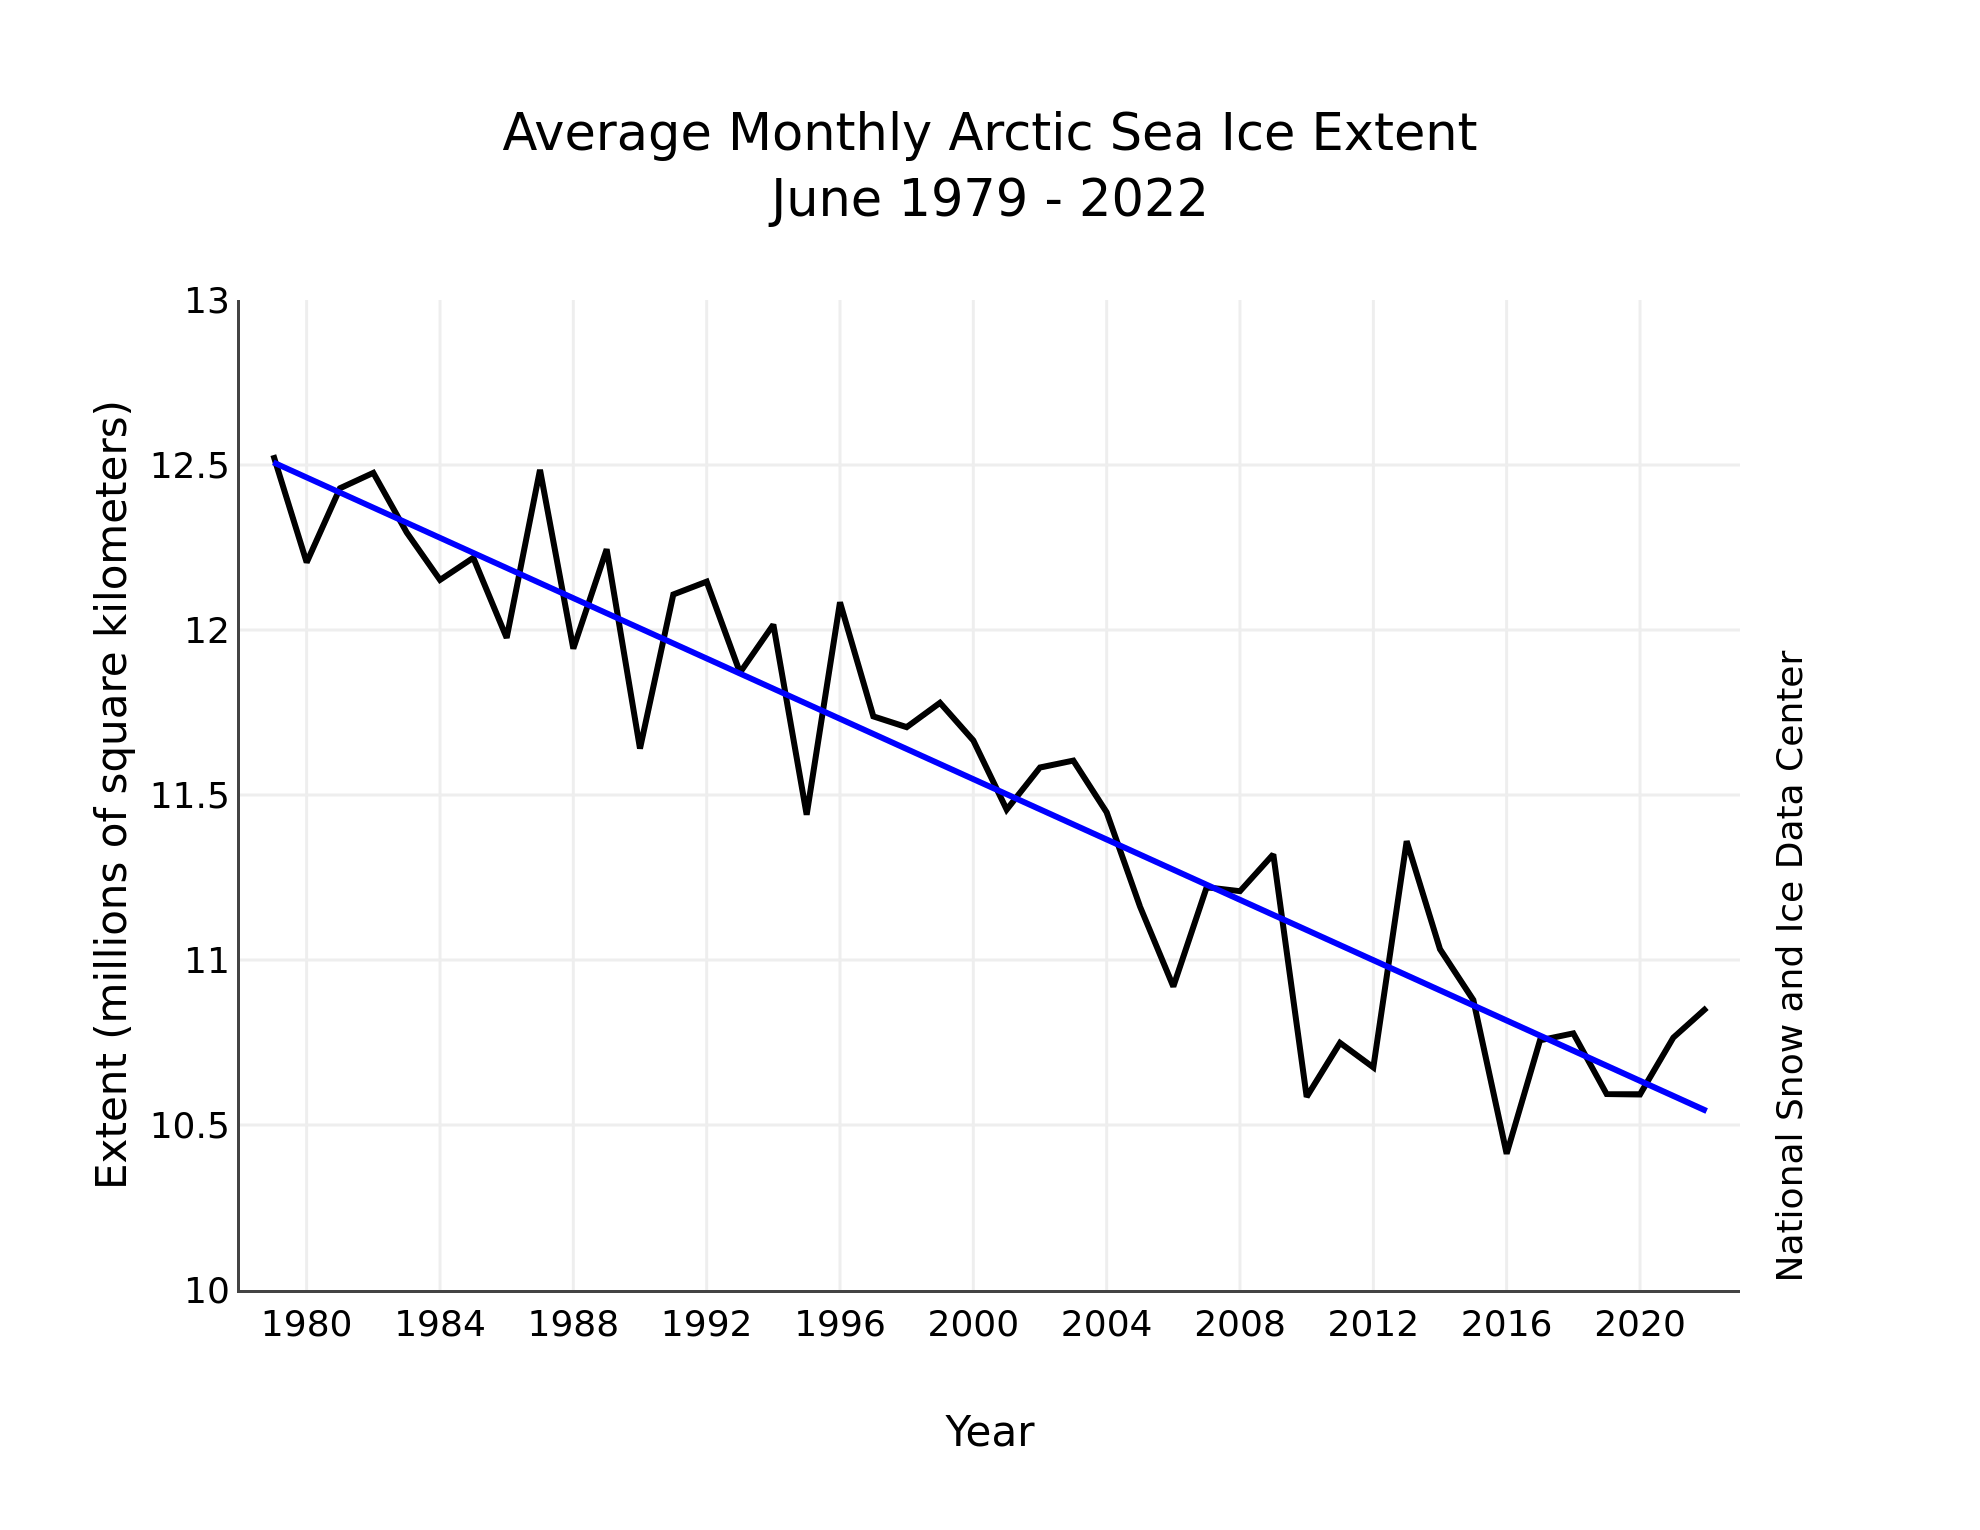
Figure 3. Monthly June ice extent for 1979 to 2022 shows a decline of 3.9 percent per decade.
Credit: National Snow and Ice Data Center
High-resolution image
The downward linear trend in June sea ice extent over the 44-year satellite record is 45,700 square kilometers (17,600 square miles) per year, or 3.9 percent per decade relative to the 1981 to 2010 average. Based on the linear trend, since 1979, June has lost 1.97 million square kilometers (761,000 square miles) of sea ice. This is equivalent to about three times the size of Texas.
Antarctic sea ice extent in June
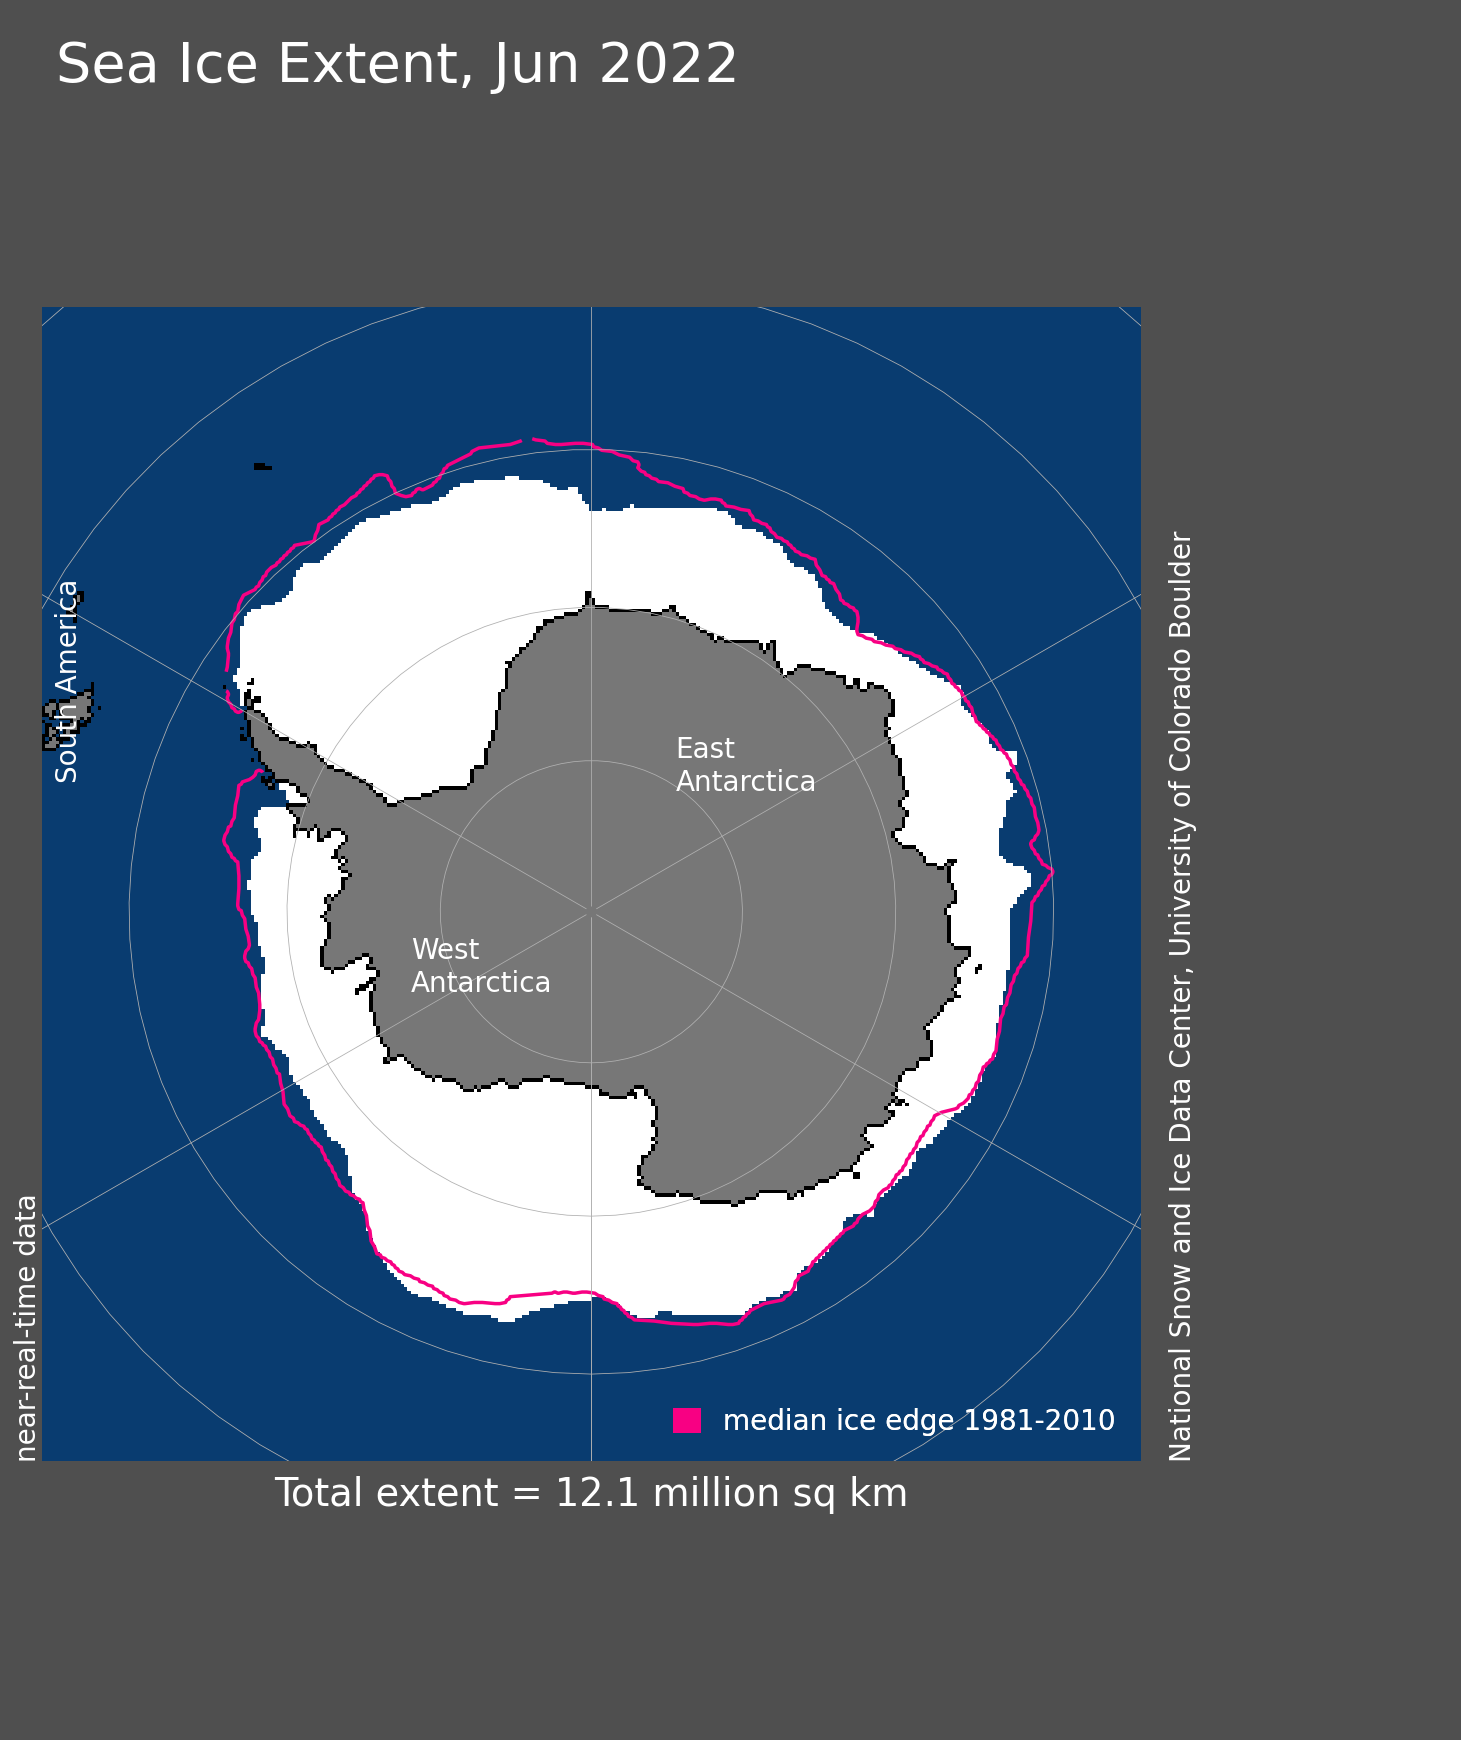
Figure 4. Antarctic sea ice extent for May 2022 was 12.1 million square kilometers (4.67 million square miles). The magenta line shows the 1981 to 2010 average extent for that month. Sea Ice Index data. About the data
Credit: National Snow and Ice Data Center
High-resolution image
Sea ice surrounding the Antarctic continent dipped to near-record low extent in late May and remained close to a record low through mid-month, setting a new record low starting on June 20. Sea ice growth was slower than average, particularly for the Bellingshausen and eastern Weddell seas (Figure 4). The Ross Sea and the sector north of Wilkes Land had near-average extent for the month. Antarctica’s air temperatures for the month at the 925 mb level were above average across nearly the entire continent and surrounding ocean. Over the Weddell Sea, air temperatures were 3 to 6 degrees Celsius (5 to 11 degrees Fahrenheit) above the 1981 to 2010 average, and over coastal areas of Wilkes Land, up to 4 degrees Celsius (7 degrees Fahrenheit) above average. Slightly below average temperatures prevailed over the eastern Ross Sea and western Amundsen Sea. Sea level pressure was low over the Bellingshausen Sea and high over the western Ross Sea. While wind directions based on the air pressure patterns are consistent with the temperature differences (cool winds come off the continent, warmer winds come from the north), in general they are not consistent with the sea ice pattern. Despite cool continental air flowing over the Amundsen Sea, sea ice extent is still low there; warm conditions along the Wilkes coast did not act to reduce June ice extent in that area.
“Atlantification” of the Barents Sea
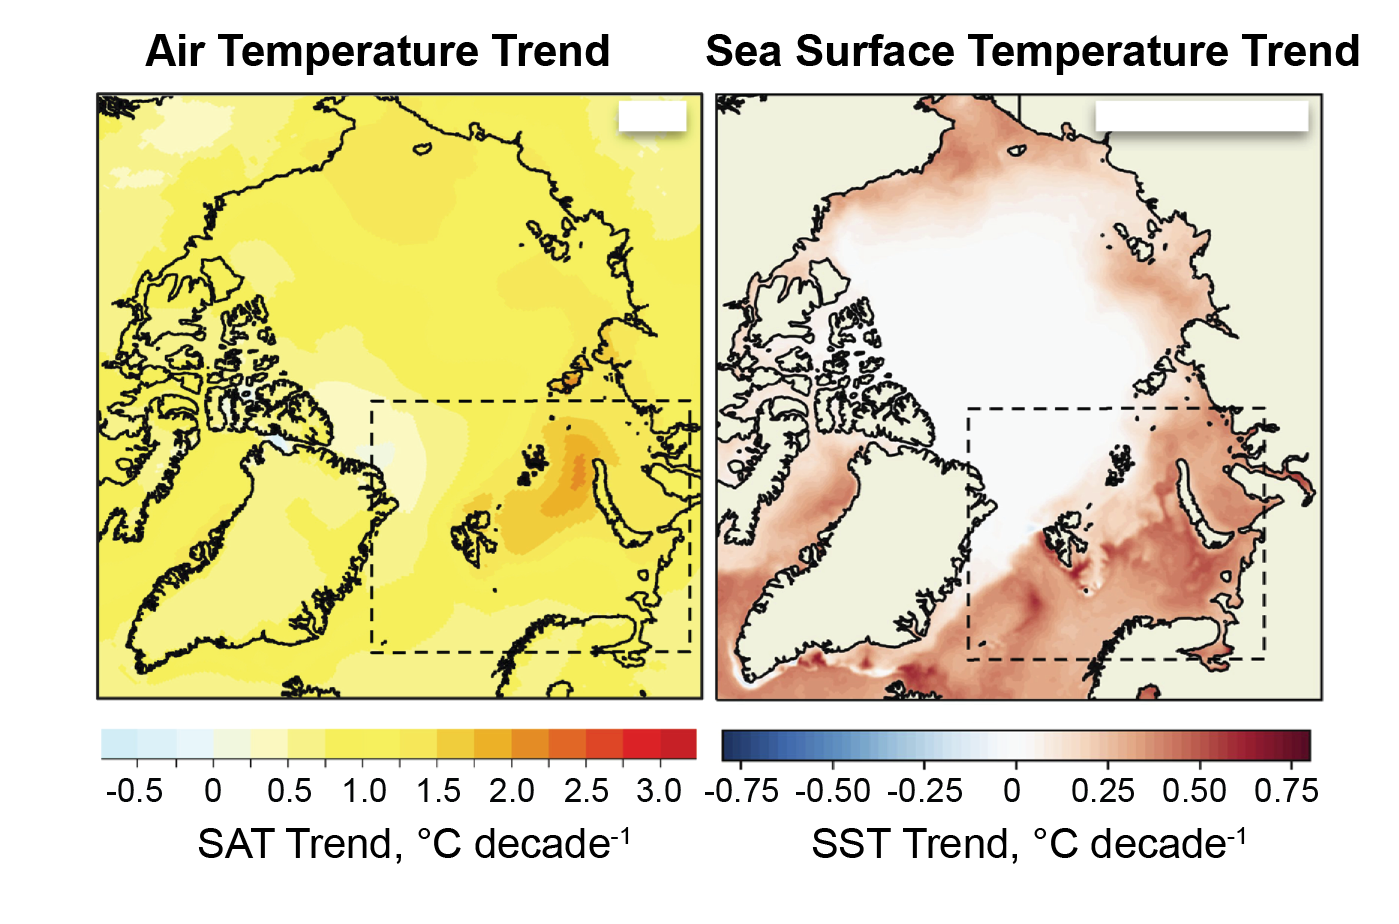
Figure 5. The left map depicts the surface air temperature trend for the Barents Sea from 1981 to 2020. The map on the right depicts sea surface temperature for the same region. Data for surface air temperature are from the European Centre for Medium-Range Weather Forecasts (ECMWF) Reanalysis v5 (ERA-5); data for the sea surface temperature are from European Space Agency sources.
Credit: Adapted from Isaksen et al. 2022
High-resolution image
The Barents Sea has had persistently low winter sea ice extent for many years now. As a result of the more open ocean conditions, the trend in air temperature in the region is extreme: up to ten times the global trend in warming (Figure 5). This was highlighted in a recent study by Isaksen and others. Sea ice acts as a lid in autumn and winter, separating the fairly warm open ocean, which is just above freezing, from the cold Arctic air. Removing the ice results in a large transfer of heat from the ocean to the atmosphere, and therefore atmospheric warming.
The deeper issue is why the sea ice in the northern Barents Sea is declining, and it may be related to the “Atlantification” of the Arctic Ocean. Warm and salty Atlantic water enters the Arctic Ocean through the Barents Sea and eastern Fram Strait, and dives beneath the cold, relatively fresh and less dense surface layer of the Arctic Ocean. Previous research has shown that the fresh surface layer is thinning as a result of less summer sea ice, allowing heat from the Atlantic water to reach the surface, preventing winter sea ice from forming in the Barents Sea region. In short, some parts of the Barents Sea have started to resemble the Atlantic.
Strong La Niña in the Pacific
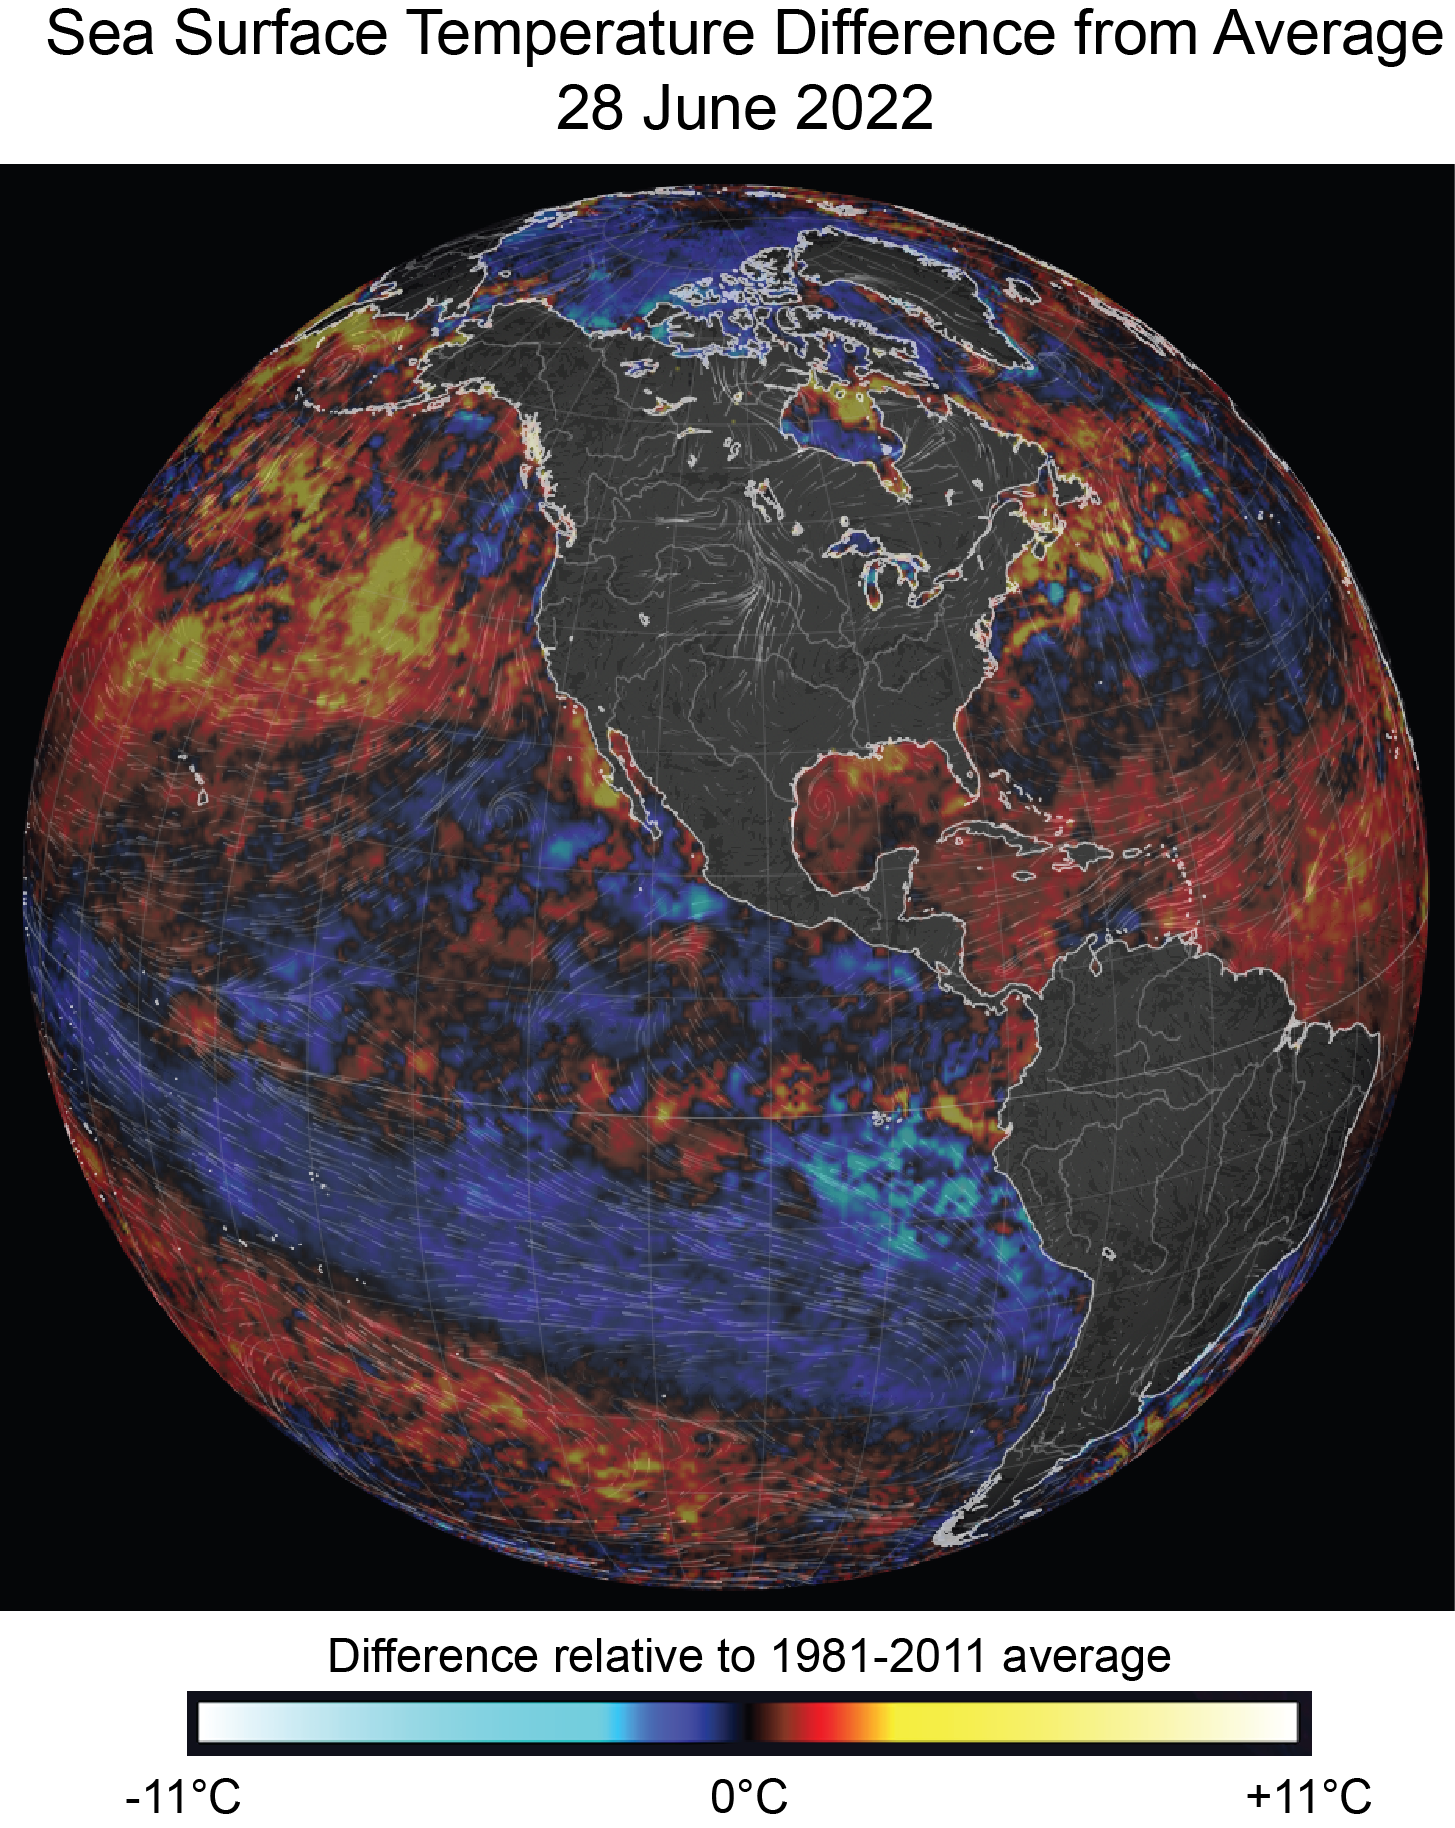
Figure 6. This image shows sea surface temperature as a difference from average (relative to 1981 to 2010) in the Western Hemisphere for June 28, 2022. The blueish area in the equatorial Pacific depicts the strong La Niña conditions. Warm colors indicate warm sea surface conditions in the northern Pacific.
Credit: nullschool.net
High-resolution image
Oscillations in sea surface temperature in the equatorial Pacific, characterized by El Niño and La Niña conditions, can have widespread influences on atmospheric circulation patterns. Beginning around July 2020, a moderate La Niña pattern developed, characterized by a large pool of relatively cool water in the eastern tropical Pacific. This event has persisted with a brief hiatus in the summer of 2021. It is forecast to last through the end of the year, with some variations, generally weakening as the year progresses. Along with the La Niña pattern, a pool of unusually warm water has formed in the northern Pacific.
Researchers Jeong and others present evidence that La Niña events favor extensive Arctic sea ice retreat just north of the Pacific, including the East Siberian Sea, Chukchi Sea, and western Beaufort Sea, in part as a result of warm ocean conditions in the northern Pacific, as we are seeing this year. However, the air pressure pattern in June is unlike past La Niña events that led to rapid ice loss like in the 2012 summer, which set a satellite-era record low September sea ice minimum. That year had warm air and high pressure extending over Greenland, and a strong low pressure over the Siberian and Pacific Arctic that drove ice out of the Arctic Ocean through Fram Strait. At this time, sea ice loss in the Pacific side of the Arctic is moderate, but the large area of low sea ice concentration may grow rapidly in July and August.
Further reading and references
Jeong, H., H. S. Park, M. F. Stuecker, and S. W. Yeh. 2022. Record low Arctic sea ice extent in 2012 linked to two‐year La Niña‐driven sea surface temperature pattern. Geophysical Research Letters, p.e2022GL098385. doi:10.1029/2022GL098385
Isaksen, K., Ø.Nordli, B. Ivanov, et al. 2022. Exceptional warming over the Barents area. Scientific Reports 12, 9371. doi:10.1038/s41598-022-13568-5

