While January began with sea ice extent below average, by the end of the month, extent increased. January 2022 finished as the sixteenth lowest extent in the satellite record above all years since 2009. This illustrates the large natural variability in sea ice conditions. However, winter ice extent is a poor indicator of what the ice extent will look like this coming September.
Overview of conditions

Figure 1a. Arctic sea ice extent for January 2022 was 13.88 million square kilometers (5.36 million square miles). The magenta line shows the 1981 to 2010 average extent for that month. Sea Ice Index data. About the data
Credit: National Snow and Ice Data Center
High-resolution image
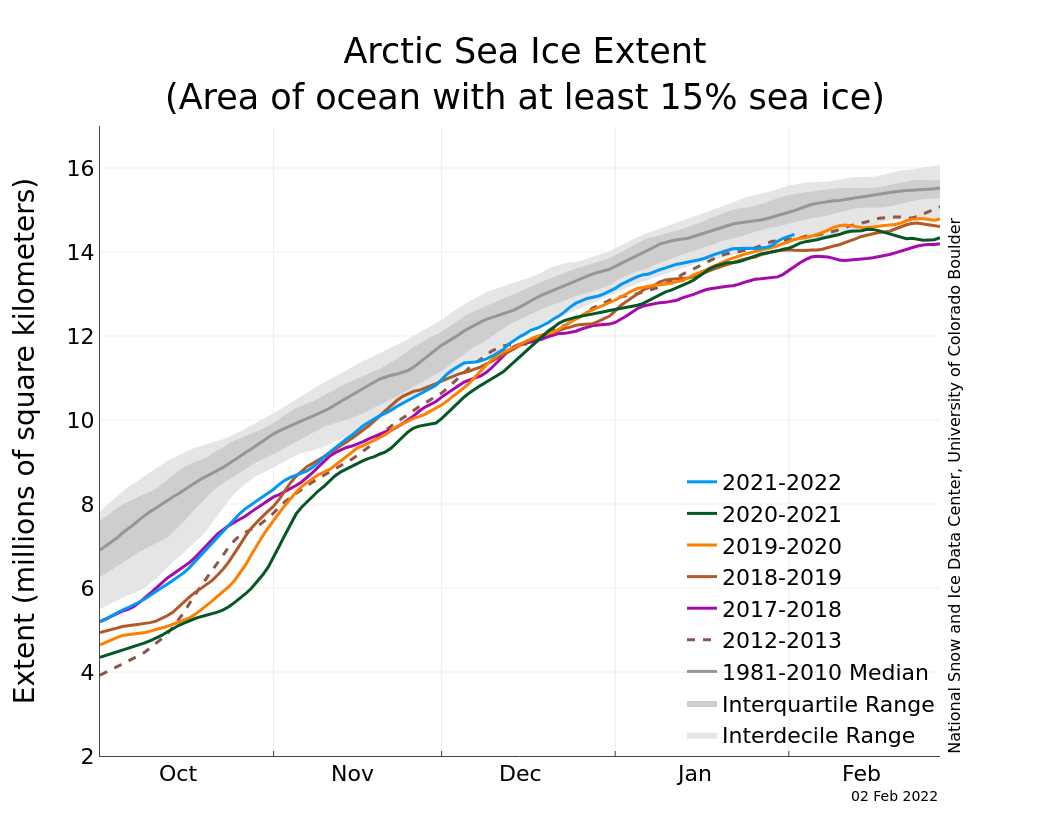
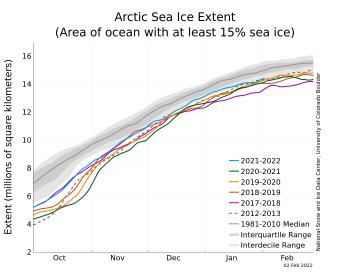
Figure 1b. The graph above shows Arctic sea ice extent as of February 2, 2022, along with daily ice extent data for four previous years and the record low year. 2021 to 2022 is shown in blue, 2020 to 2021 in green, 2019 to 2020 in orange, 2018 to 2019 in brown, 2017 to 2018 in magenta, and 2012 to 2013 in dashed brown. The 1981 to 2010 median is in dark gray. The gray areas around the median line show the interquartile and interdecile ranges of the data. Sea Ice Index data.
Credit: National Snow and Ice Data Center
High-resolution image
Average Arctic sea ice extent for January 2022 was 13.88 million square kilometers (5.36 million square miles), ranking sixteenth lowest in the satellite record (Figure 1a). The 2022 extent was 540,000 square kilometers (208,000 square miles) below the 1981 to 2010 average. Throughout most of January, extent tracked within the interdecile range of the satellite record, falling below the interdecile range on January 26 (Figure 1b). Regionally, the sea ice extent was above average in the Bering Sea, yet below average in the Sea of Okhotsk and the Barents Sea. Extent also remained lower than average in the Gulf of St. Lawrence. At the end of the month, sea ice extent was above all years since 2009.
Conditions in context
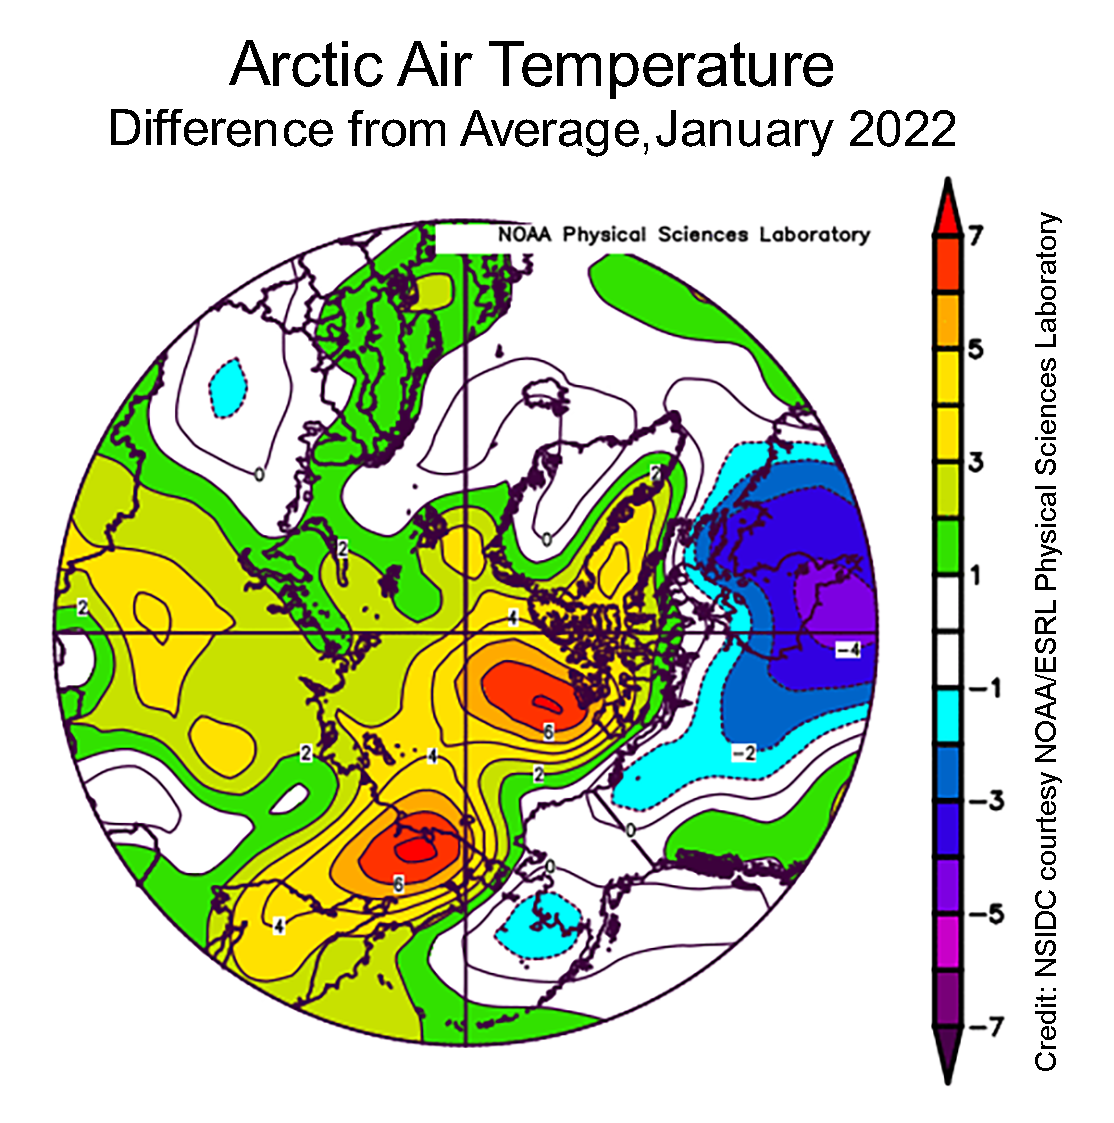
Figure 2a. This plot shows the departure from average air temperature in the Arctic at the 925 hPa level, in degrees Celsius, for January 2022. Yellows and reds indicate higher than average temperatures; blues and purples indicate lower than average temperatures.
Credit: NSIDC courtesy NOAA Earth System Research Laboratory Physical Sciences Laboratory
High-resolution image
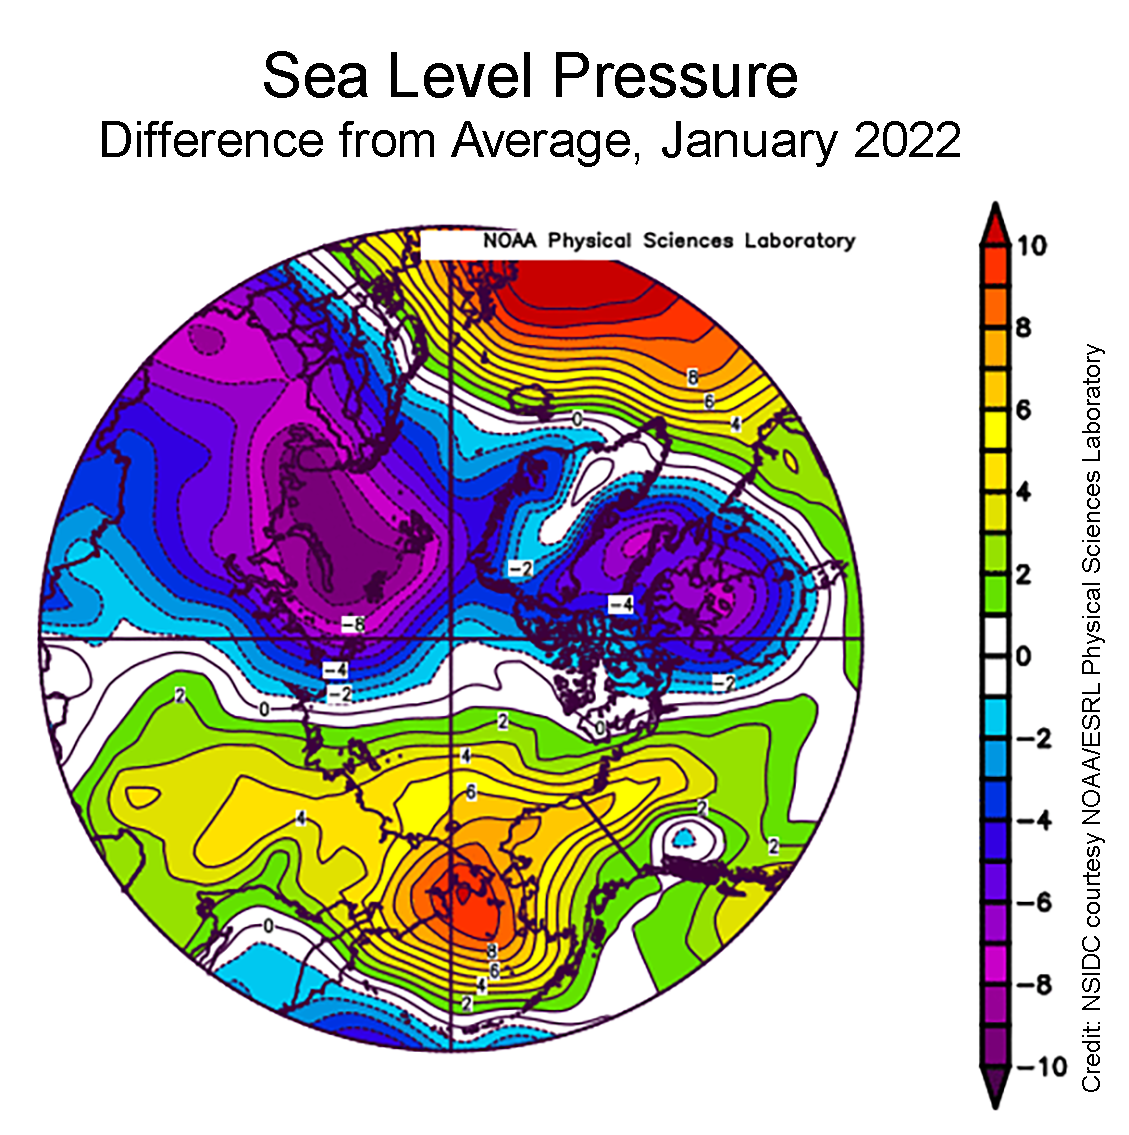
Figure 2b. This plot shows the departure from average sea level pressure in the Arctic in millibars for January 2022. Yellows and reds indicate higher than average air pressures; blues and purples indicate lower than average air pressures.
Credit: NSIDC courtesy NOAA Earth System Research Laboratory Physical Sciences Laboratory
High-resolution image
Air temperatures for January 2022 at the 925 millibar level (about 2,500 feet above the surface) were above average over all of the Arctic Ocean. Temperatures were up to 7 degrees Celsius (13 degrees Fahrenheit) higher than average north of the Canadian Archipelago, with more modest departures in other areas (Figure 2a). The corresponding sea level pressure pattern for January 2022 featured the characteristic Siberian high pressure region that typically forms over eastern Siberia in autumn and winter. However, sea level pressure was up to 8 millibars above average over eastern Siberia, stretching across the Bering Sea and into western Alaska (Figure 2b). This was coupled with below average sea level pressure over Eurasia and Hudson Bay. Generally, when the Siberian High is strong, advection of warm air from eastern Europe leads to mild conditions over the Kara and Laptev Seas. The high over Siberia was also complemented by low pressure south of the Aleutians. This pattern led to winds bringing cold air that enhanced freezing in the Bering Sea and pushed ice southward, leading to the higher extent in the Bering Sea.
January 2022 compared to previous years

Figure 3. Monthly January ice extent for 1979 to 2022 shows a decline of 3.0 percent per decade.
Credit: National Snow and Ice Data Center
High-resolution image
The downward linear trend in January sea ice extent over the 44-year satellite record is 42,800 square kilometers (16,500 square miles) per year, or 3.0 percent per decade relative to the 1981 to 2010 average. Based on the linear trend, since 1979, January has seen a loss of 1.86 million square kilometers (718,000 square miles). This is equivalent to about four times the area of California.
Role of North Atlantic Heat Transport on Barents Sea ice
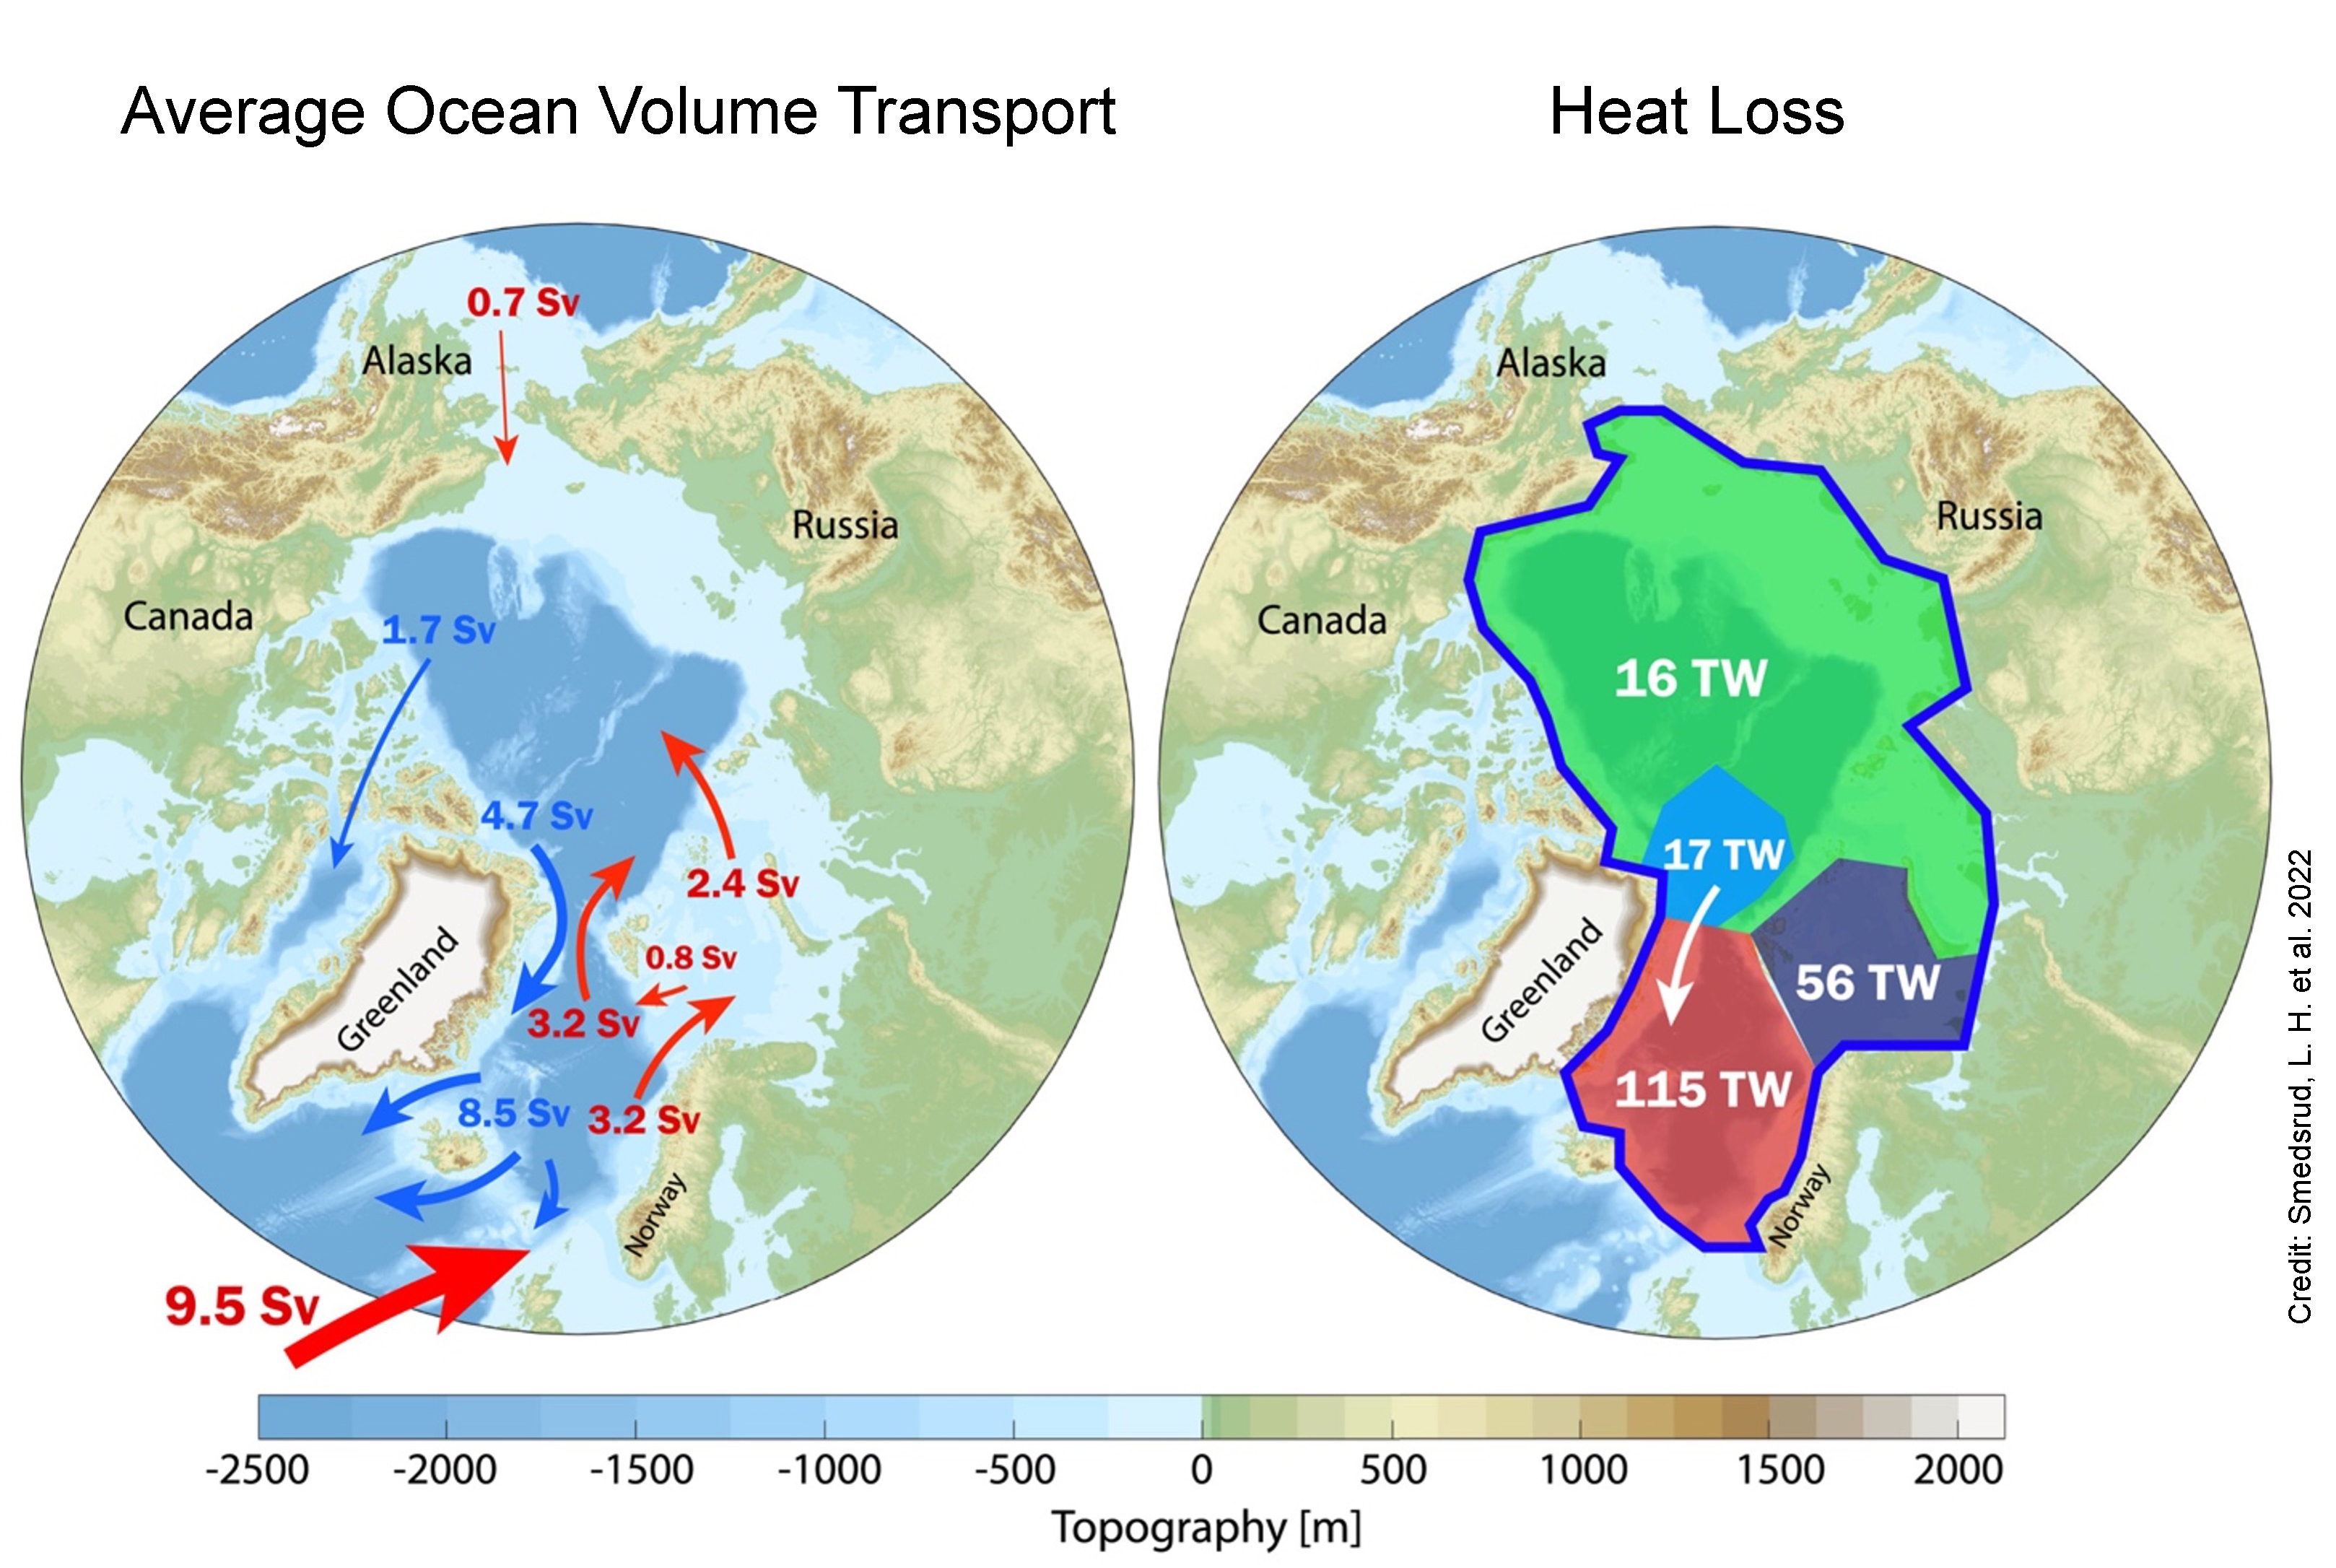
Figure 4a. The left map of the Arctic Ocean shows the simulated average transport of water volume in Sverdrups (Sv: equal to one million cubic meters per second, or about 260 million gallons per second). The right map show the heat loss in terawatts (TW; equal to one trillion watts) for individual regions. The values shown are average annual values for 1900 to 2000.
Credit: Smedsrud et al. 2022
High-resolution image

Figure 4b. Annual ocean temperatures averaged between 50 and 200 meters (164 and 656 feet) depth from 1977 through 2020 showing the variation of ocean heat in the western Barents Sea.
Credit: Institute of Marine Research, Norway
High-resolution image
The northward flow of warm Atlantic Water along the coast of Norway is a primary oceanic heat source for the Arctic Ocean (Figure 4a). During periods when there is increased transport of Atlantic Water, there is reduced winter sea ice in northern Barents Sea and increased ocean heat loss, leading to denser water. The northward flow of Atlantic water towards the Arctic has been high in recent decades. According to colleagues at the Geophysical Institute in Bergen, Norway, the oceanic heat transport to the Arctic Ocean is 30 percent higher today than it was around 1900. However, over a shorter time-frame, there is no distinct trend in warm water flow between 1995 and 2020. The total annual transport of ocean heat, a combination of water volume and the temperature of that water, started to decrease after 2015 (Figure 4b). However, while the volume of Atlantic Water through the Barents Sea opening started to drop in 2015, northern Norway experienced several strong storms from the south, that may have broken up the ice cover or kept it from advancing southward. The wind-driven changes in northward movement of Atlantic Water is likely a result of natural climate variability, including both upstream ocean circulation changes and large-scale atmospheric circulation patterns such as the Arctic Oscillation; however, some researchers think that sea ice loss in the Arctic may also be affecting wind patterns.
Antarctic sea ice taking the plunge
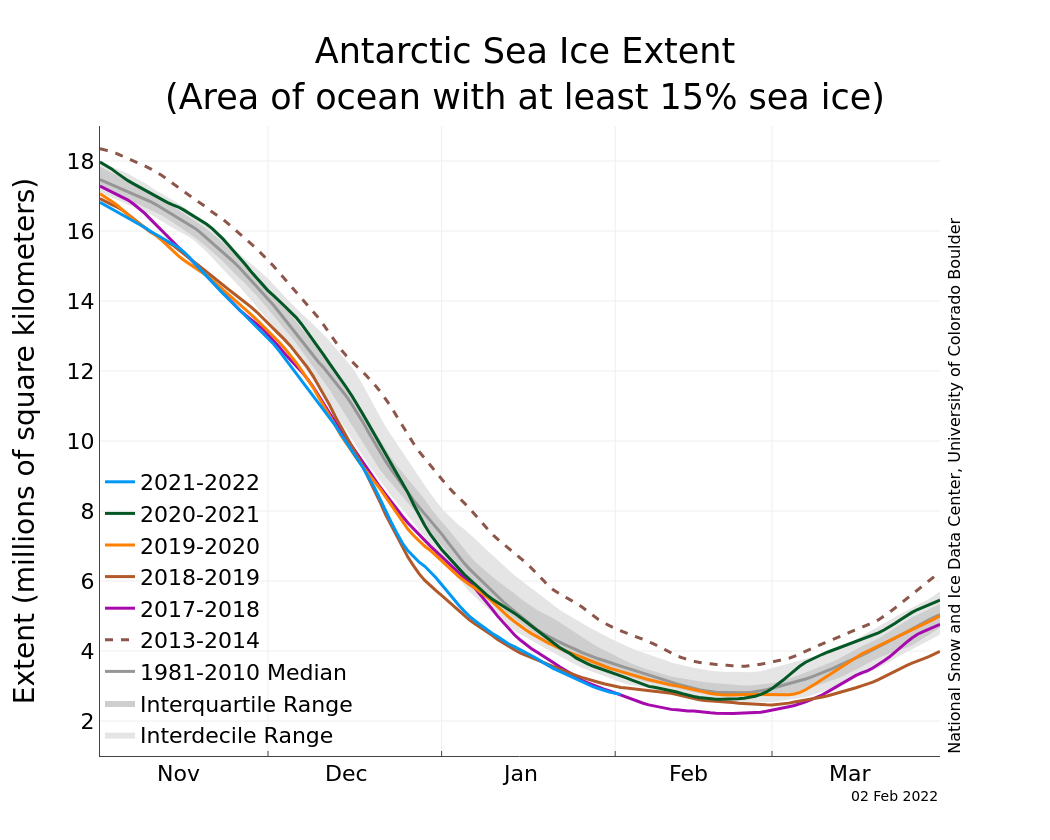
Figure 5a. The graph above shows Antarctic sea ice extent as of February 2, 2022, along with daily ice extent data for five previous years. 2021 to 2022 is shown in blue, 2020 to 2021 in green, 2019 to 2020 in orange, 2018 to 2019 in brown, 2017 to 2018 in magenta, and 2013 to 2014 in dashed brown. The 1981 to 2010 median is in dark gray. The gray areas around the median line show the interquartile and interdecile ranges of the data. Sea Ice Index data.
Credit: National Snow and Ice Data Center
High-resolution image

Figure 5b. These graphs show Antarctic sea ice extent in square kilometers in five different regions as well as Antarctica’s overall sea ice extent.
Credit: Robbie Mallet, University College London
High-resolution image
During the southern hemisphere spring in 2016, Antarctic sea ice suddenly shrank, leading to a series of months (extending into the 2016 to 2017 austral summer) with the lowest monthly average extents in the satellite data record. This January, Antarctic sea ice was the second lowest ice extent in the 44-year record (Figure 5a). Regionally, ice extent is tracking below levels observed for 2017 in the Indian and Pacific sectors, but above levels for that year in other sectors (Figure 5b). In 2017, only the Ross Sea region had record low extent, so it was the driver of the overall record low hemispheric extent. Similarly, this year none of the individual regions have record low extents, but all are well below average leading to the second lowest Antarctic sea ice in the satellite record, above 2017.
The more moderate extent levels since the record lows in 2016 to 2017 result in a small, not statistically significant (at the 95 percent level) positive trend. Climate models simulating the response to anthropogenic greenhouse gas emissions suggest that Antarctic sea ice should be decreasing. So there is a seeming contradiction between the observations and the models. One possibility is that natural variability is higher than the models indicate and that natural variability may still dominate the Antarctic sea ice trends. A new study led by R. Fogt looked at an ensemble of reconstructions of Antarctic sea ice extent since 1905 using sea level pressure, air temperatures, and indices of climate variability. This study argues that the seasonally observed positive trends since 1979 are unusual over the twentieth century, and that a shift occurred around 1960, before routine satellite observations began. This hints that there is indeed pronounced decadal scale variability in ocean and atmospheric conditions that influence Antarctic sea ice. Whether the low ice conditions of recent years represent a new decadal-scale shift remains to be seen.
References
Årthun, M., T. Eldevik, and L. H. Smedsrud. 2019. The Role of Atlantic Heat Transport in Future Arctic Winter Sea Ice Loss, Journal of Climate, 32(11), 3327-3341. Retrieved Feb 3, 2022, from https://journals.ametsoc.org/view/journals/clim/32/11/jcli-d-18-0750.1.xml.
Fogt, R.L., A. M. Sleinkofer, M. N. Raphael, et al. 2022. A regime shift in seasonal total Antarctic sea ice extent in the twentieth century. Nature Climate Chang. 12, 54–62. doi:10.1038/s41558-021-01254-9.
Helland-Hansen, B. and F. Nansen. 1909. The Norwegian Sea: Its physical oceanography based upon the Norwegian researches 1900–1904. Det Mallingske bogtrykkeri.
Orvik, K. A. 2022. Long-term moored current and temperature measurements of the Atlantic inflow into the Nordic Seas in the Norwegian Atlantic Current; 1995-2020. Geophysical Research Letters, 49, e2021GL096427. doi:10.1029/2021GL096427
Smedsrud, L. H., M. Muilwijk, A. Brakstad, E. Madonna, S. K. Lauvset, C. Spensberger, C., et al. 2022. Nordic Seas heat loss, Atlantic inflow, and Arctic sea ice cover over the last century. Reviews of Geophysics, 60, e2020RG000725. doi:10.1029/2020RG000725.
Erratum
On February 9, 2022, a user informed the ASINA team of an error in the text, which stated, “January 2022 finished as the sixteenth lowest extent in the satellite record above all years since 2009, with the exception of 2013 and 2014.” The correct text should state that “January 2022 finished as the sixteenth lowest extent in the satellite record above all years since 2009.” The correction has been made.

