At the end of the first week of July, Arctic sea ice extent was tracking at record low for this time of year. July is the month with most rapid sea ice decline. As in most of the years in the past decade, June saw rapid ice loss in Hudson Bay, Baffin Bay, the Siberian coast, and the Chukchi Sea. However, ice remains extensive north of Alaska.
Overview of conditions
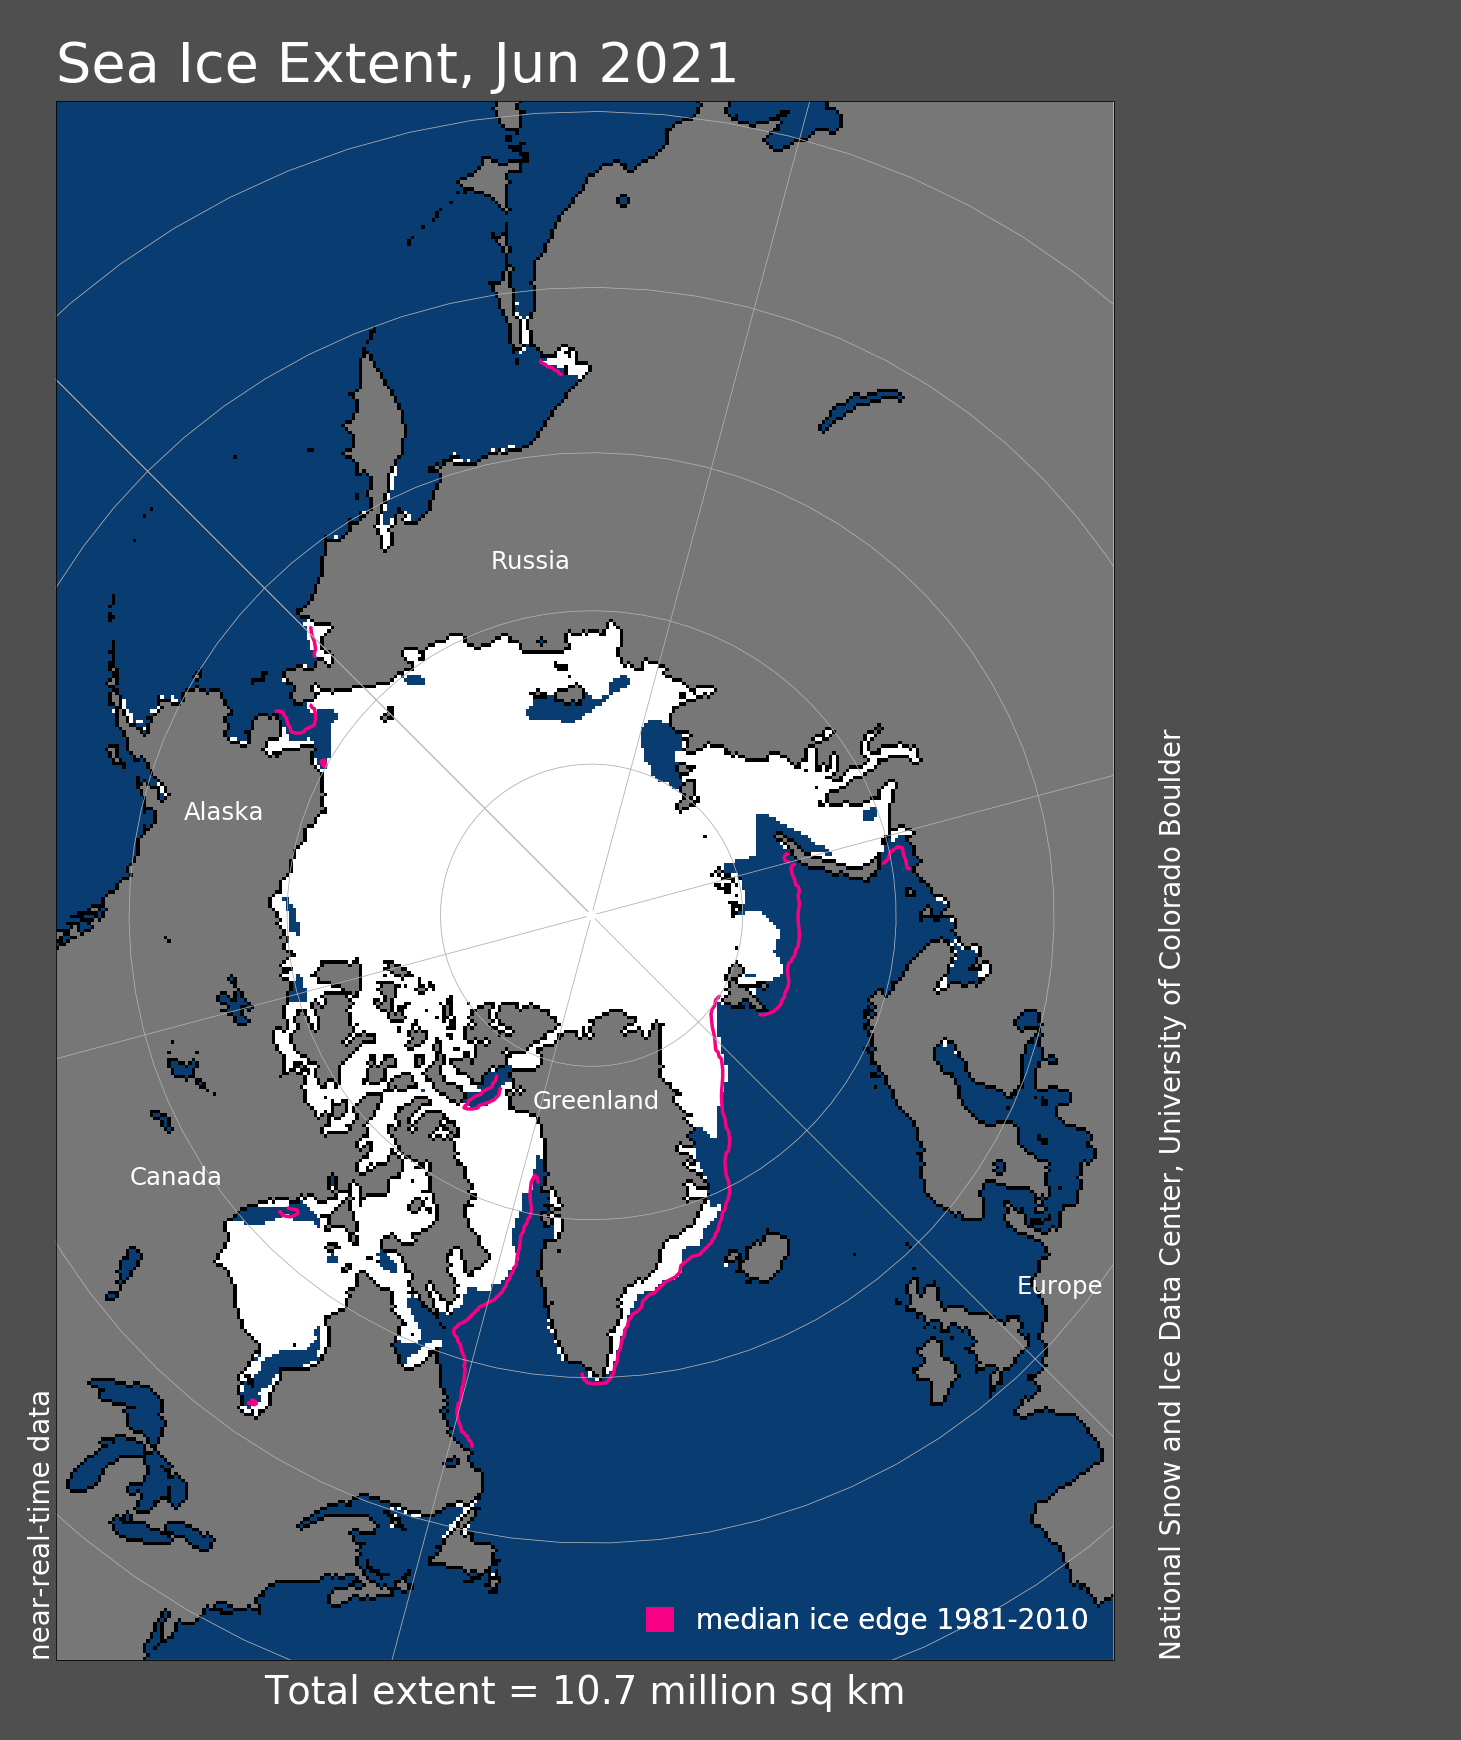
Figure 1. Arctic sea ice extent for June 2021 was 10.71 million square kilometers (4.14 million square miles). The magenta line shows the 1981 to 2010 average extent for that month. Sea Ice Index data. About the data
Credit: National Snow and Ice Data Center
High-resolution image
Loss of Arctic sea ice in June was relatively steady and rapid. The monthly average extent for June 2021 was 10.71 million square kilometers (4.14 million square miles). This was 300,000 square kilometers (116,000 square miles) above the record low for the month set in 2016 and 1.05 million square kilometers (405,000 square miles) below the 1981 to 2010 average. The average extent for the month ranks sixth lowest in the passive microwave satellite record. Large open-water areas developed in the Laptev and East Siberian Seas, and warm winds pushed the ice edge north in the Kara and Barents Seas near Novaya Zemlya. The Fram Straight region and the area to the north of northeastern Greenland had an unusually low ice concentration as the month drew to a close because of both pre-existing thin ice and unusually warm weather. By contrast, by June’s end, sea ice still persisted along the northern coast of Alaska.
Conditions in context
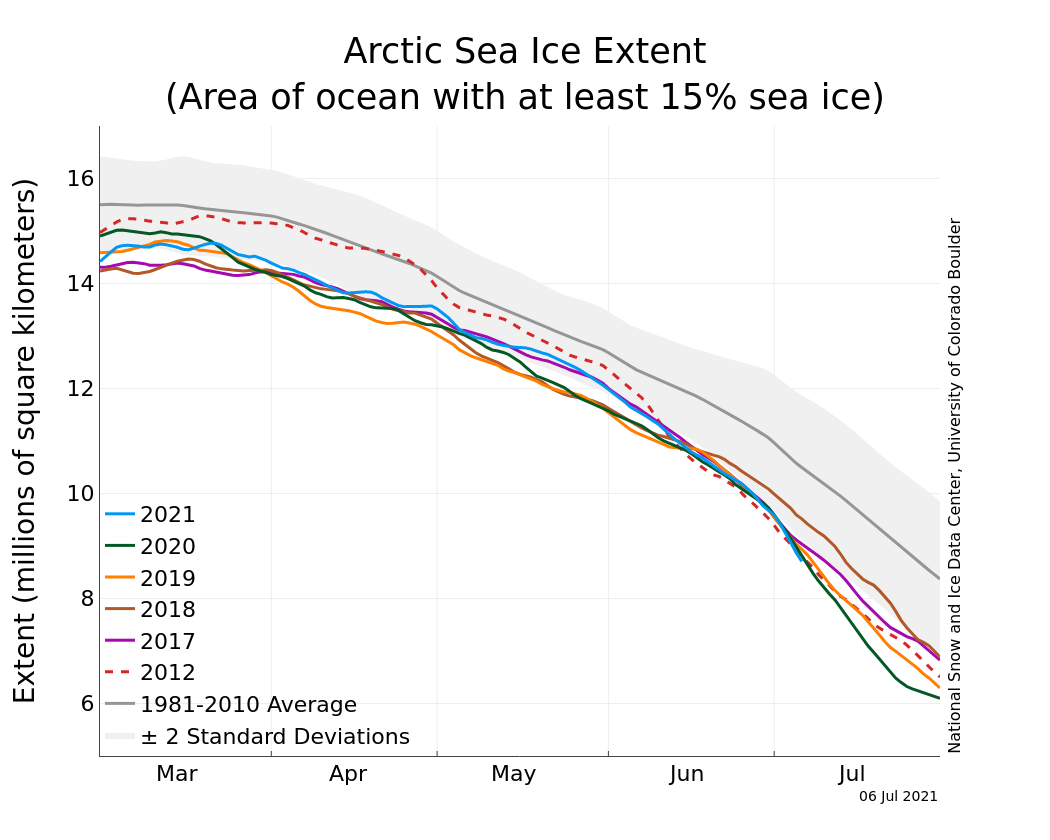
Figure 2a. The graph above shows Arctic sea ice extent as of July 6, 2021, along with daily ice extent data for five previous years and the record low year. 2021 is shown in blue, 2020 in green, 2019 in orange, 2018 in brown, 2017 in magenta, and 2012 in dashed red. The 1981 to 2010 median is in dark gray. The gray areas around the median line show the interquartile and interdecile ranges of the data. Sea Ice Index data.
Credit: National Snow and Ice Data Center
High-resolution image
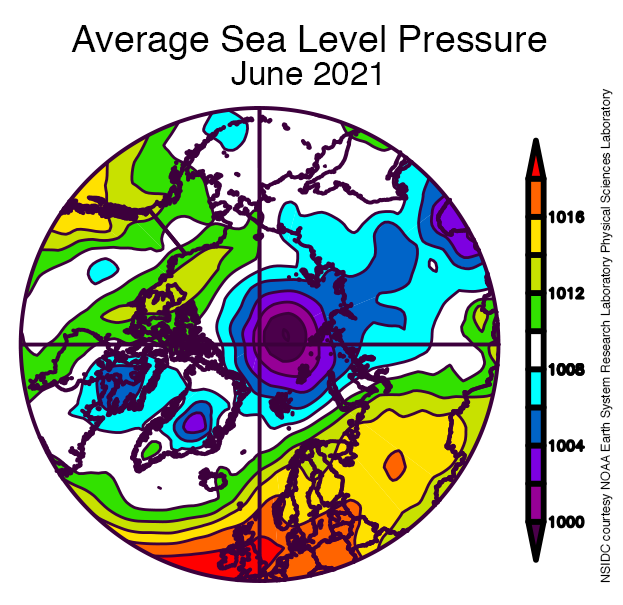
Figure 2b. This plot shows average sea level pressure in the Arctic in millibars for June 2021. Yellows and reds indicate high air pressure; blues and purples indicate low pressure.
Credit: NSIDC courtesy NOAA Earth System Research Laboratory Physical Sciences Laboratory
High-resolution image
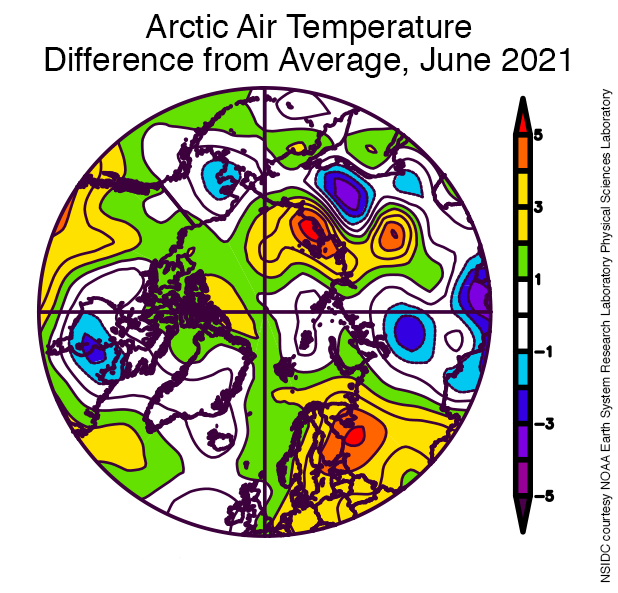
Figure 2c. This plot shows the departure from average air temperature in the Arctic at the 925 hPa level, in degrees Celsius, for June 2021. Yellows and reds indicate higher than average temperatures; blues and purples indicate lower than average temperatures.
Credit: NSIDC courtesy NOAA Earth System Research Laboratory Physical Sciences Laboratory
High-resolution image
Unusually strong low pressure (up to 10 hPa below average) near the North Pole dominated the average atmospheric circulation pattern for June (Figure 2b). High pressure also hovered over western Europe, driving winds northeastward over the Norwegian Sea and into the Barents and Kara Seas. Temperatures at the 925 hPa level over Scandinavia were high as a result, averaging 2 to 5 degrees Celsius (4 to 9 degrees Fahrenheit) above average (Figure 2c). Above average temperatures were also present over northeastern Siberia along the Laptev and East Siberian Sea coast, but cool conditions prevailed over central Alaska and central Siberia. Most of the Arctic Ocean was 1 to 3 degrees Celsius (2 to 5 degrees Fahrenheit) above average, although a region near the Severnaya Zemlya islands was near average. Air temperatures near strong low pressure areas over the Arctic Ocean have historically been associated with relatively cool conditions. However, June temperatures in the vicinity of the low-pressure pattern were near the long-term average.
June 2021 compared to previous years

Figure 3. Monthly June ice extent for 1979 to 2021 shows a decline of 4.0 percent per decade.
Credit: National Snow and Ice Data Center
High-resolution image
The pace of ice loss for the month was faster than average; the Arctic lost a total of 2.39 million square kilometers (923,000 square miles) during the month of June. This corresponds to an average ice loss of 79,600 square kilometers (30,700 square miles) per day compared to the 1981 to 2010 average loss of 56,200 square kilometers (21,700 square miles) per day. Through 2021, the linear rate of decline for June sea ice extent is 4.0 percent per decade. This corresponds to 47,000 square kilometers (18,000 square miles) per year. The cumulative June ice loss over the 43-year satellite record is 1.99 million square kilometers (768,000 square miles), based on the difference in linear trend values in 2021 and 1979. The loss of ice since 1979 in June is equivalent to about three times the size of Texas.
“Last Ice Area” not lasting all that well
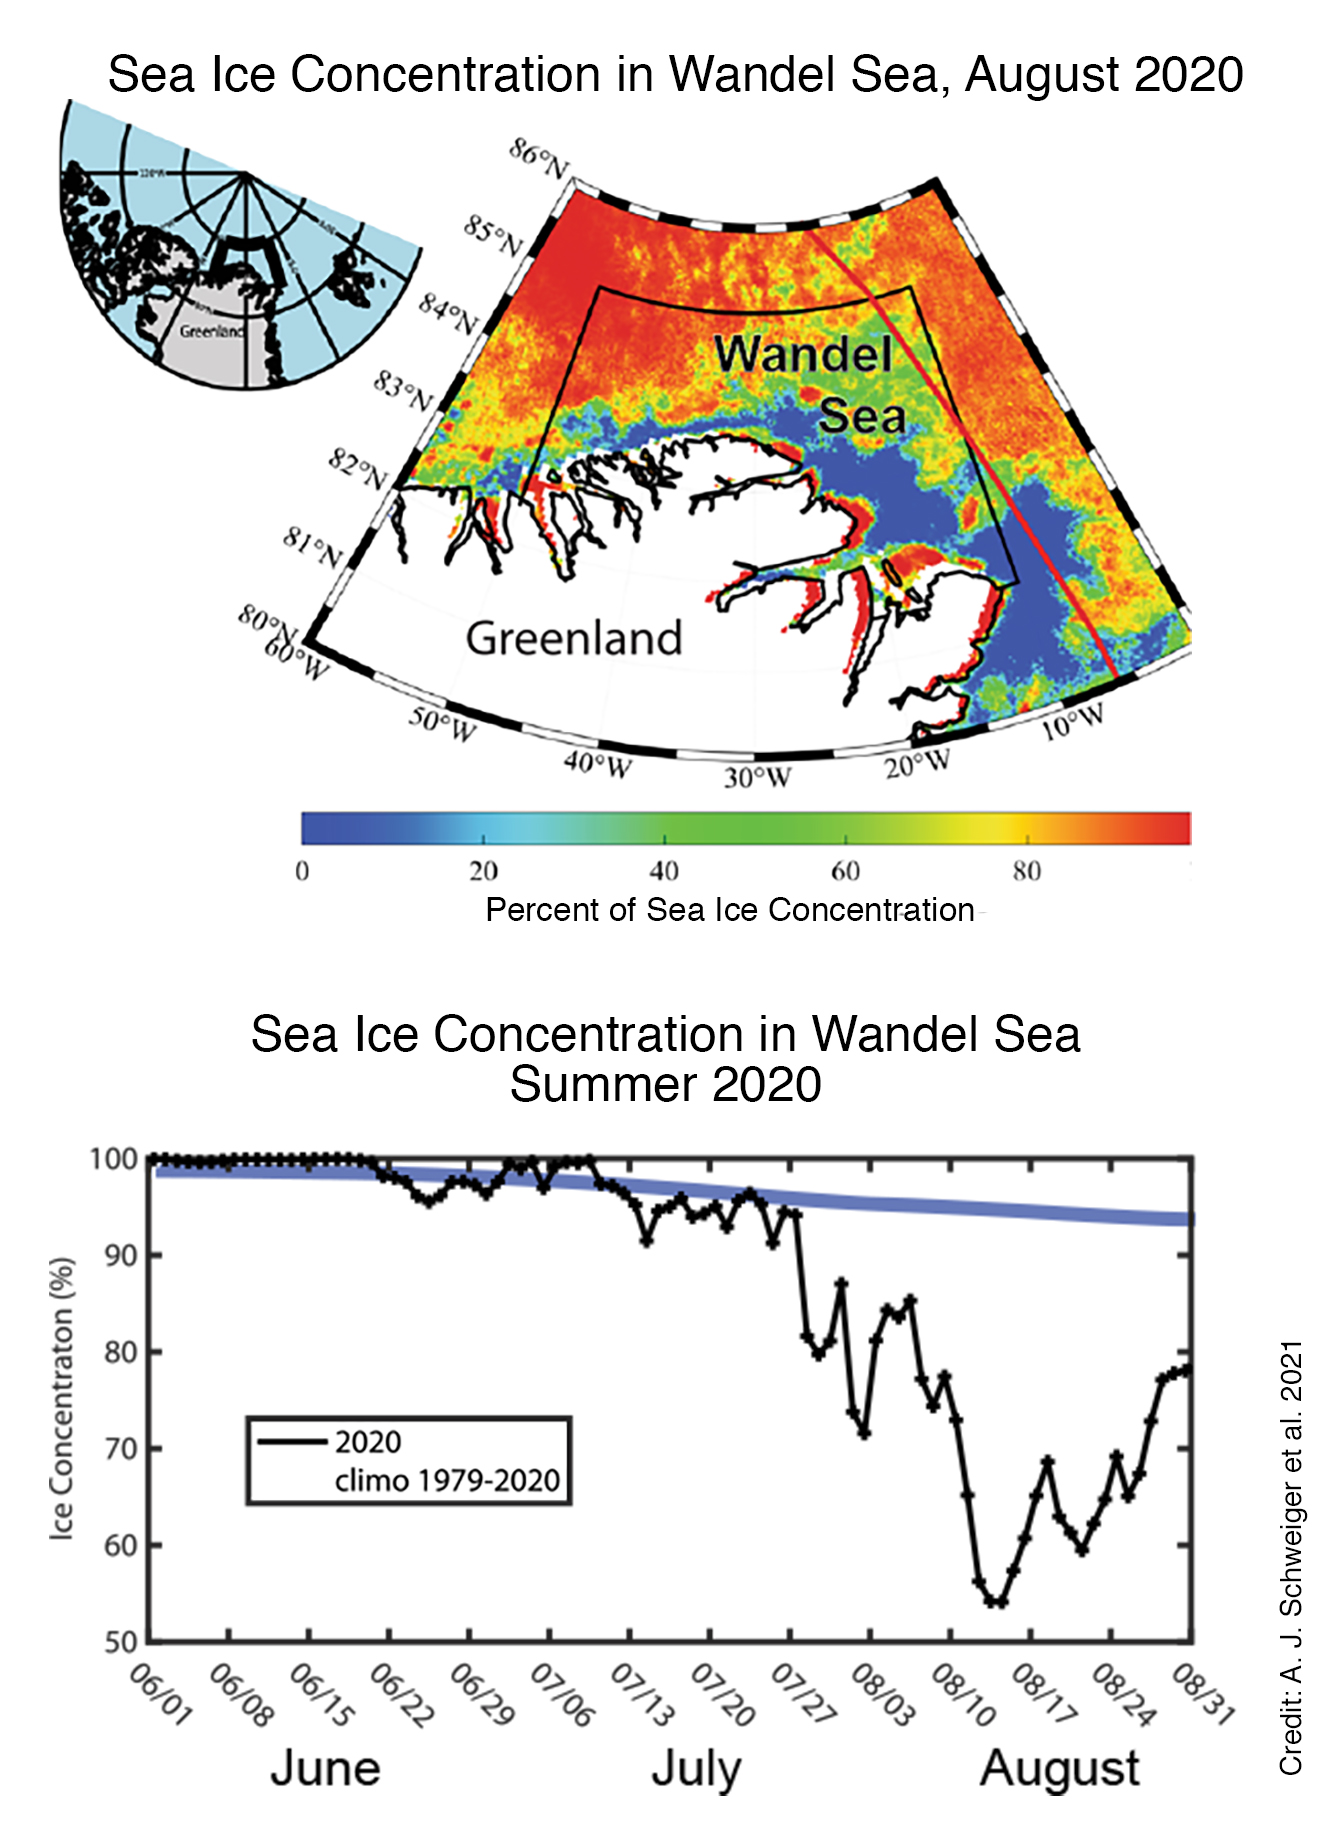
Figure 4. This map and graph shows sea ice conditions in the Wandel Sea during the summer of 2020. The top map includes a locator map and a map of sea ice concentration in the northern Greenland area in August 2020 as the RV Polarstern transited the area (marked by the red line). The bottom graph shows sea ice concentration for the area marked by the black outline over the course of the 2020 summer, derived from NSIDC Climate Data Record for sea ice. In most years since 1978, sea ice concentration average is above 90 percent (solid blue line) throughout the summer.
Credit: Schweiger et al. 2021
High-resolution image
The area north of Greenland and the Canadian Archipelago has recently been referred to as the “Last Ice Area” (LIA) because ice has persisted there in late summer decades while in other regions ice largely melts away. In the LIA, ice is the thickest and oldest in the Arctic, and ice circulation tends to keep ice pressed against the northern coasts of these islands. However, in the summer of 2020, the easternmost portion of the LIA, know as the Wandel Sea, had record low sea ice concentration (Figure 4). This provided easy access to the interior Arctic ice pack for the icebreaker RV Polarstern last summer as it returned to complete research associated with the year-long Multidisciplinary drifting Observatory for the Study of Arctic Climate (MOSAiC) expedition.
A recent paper by colleagues from University of Washington in Seattle, and the University of Toronto Mississauga explains that the record low ice concentration in the Wandel Sea was caused by both thinning of the thick multi-year sea ice and unusual wind-forced ice motion away from the area, particularly in mid- to late August. Changes in the winds replaced the old ice with thinner first-year ice. The authors note that the unusual winds were a significant factor, likely a result of natural variability but that persistent long-term thinning trends in the LIA multi-year sea ice pack were also partly to blame. Winds would not have had as large of an impact in previous decades when the pack was thicker on average.
Antarctic notes
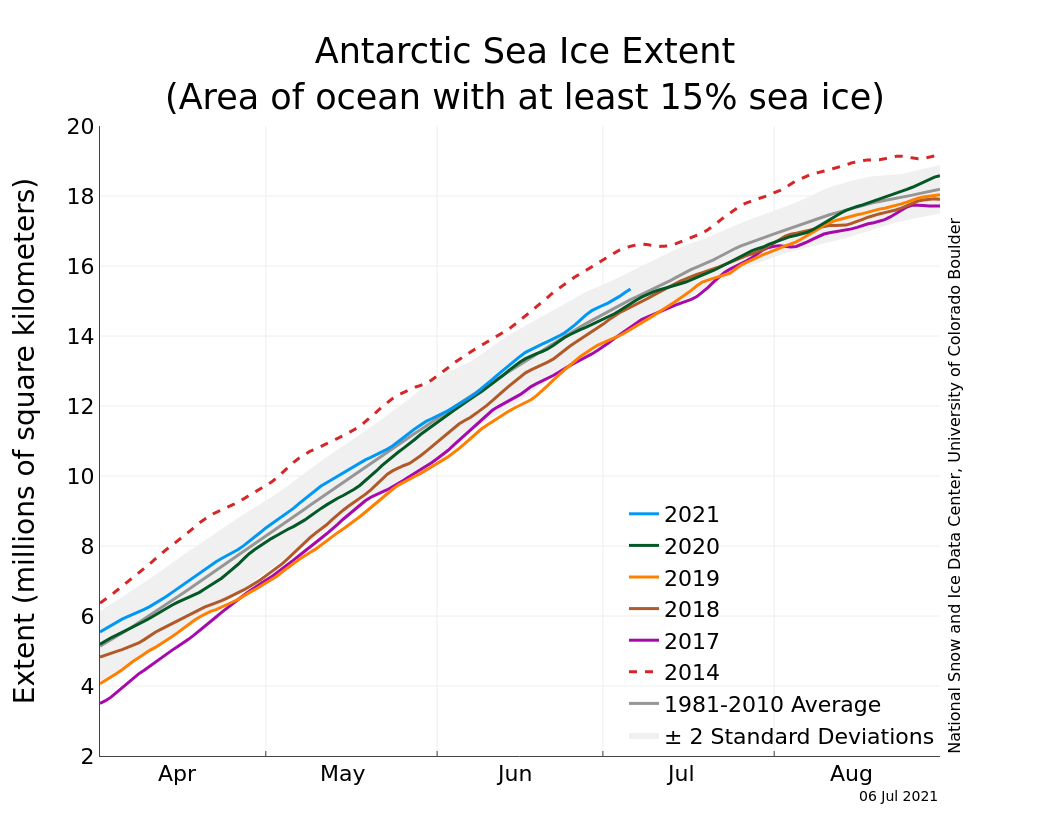
Figure 5. The graph above shows Antarctic sea ice extent as of July 6, 2021, along with daily ice extent data for five previous years and the record low year. 2021 is shown in blue, 2020 in green, 2019 in orange, 2018 in brown, 2017 in magenta, and 2014 in dashed red. The 1981 to 2010 median is in dark gray. The gray areas around the median line show the interquartile and interdecile ranges of the data. Sea Ice Index data.
Credit: National Snow and Ice Data Center
High-resolution image
Sea ice in the Southern Ocean surrounding Antarctica was well above the 1981 to 2010 average extent in June, rising above the ninetieth percentile near the end of the month. Areas north of Dronning Maud Land, Wilkes Land, and the Ross and Amundsen Seas were above average in extent, while regions on either side of the Antarctic Peninsula—the Bellingshausen Sea and the northwestern Weddell Sea—were below average.
The atmospheric circulation pattern for the month was characterized by a strong Amundsen Sea low pressure area (10 to 15 millibars lower than the average for the month) and a weak “wave-3 pattern” around the rest of the Southern Ocean. A wave-3 pattern consists of three high-pressure areas (in this case, the Weddell Sea, Indian Ocean, and southwest Pacific) interspersed with three low-pressure regions (the Amundsen Sea, the areas south of South Africa, and the area south of Australia).
Further reading
Schweiger, A. J., M. Steele, and J. Zhang et al. 2021. Accelerated sea ice loss in the Wandel Sea points to a change in the Arctic’s Last Ice Area. Communications Earth & Environment 2, 122 (2021), doi:10.1038/s43247-021-00197-5.

